Enrollment and Facilities Report Report to the Board of Education December 5, 2012 Presented by: Jane Landefeld and Randy Trent Director of Student Accounting & Research Services Executive Director of Physical Properties
Transcript
Enrollment and FacilitiesReport
Report to the Board of EducationDecember 5, 2012
Presented by:
Jane Landefeld and Randy TrentDirector of Student Accounting & Research Services
Executive Director of Physical Properties
Student Enrollment Data
Official Count Days occur in the Fall andSpring
Students absent on count day
If unexcused, 10 days to return
If excused, 30 days to return
December 5, 2012 Ann Arbor Public Schools 2
Student Enrollment Data (cont.)
Beginning in Fall 2011, the Fall count daywas changed from the last Wednesday inSeptember to the first Wednesday in October.
Fall Student count & Special EducationStudent (formerly December 1 count)
Spring Count is the second Wednesday inFebruary
December 5, 2012 Ann Arbor Public Schools 3
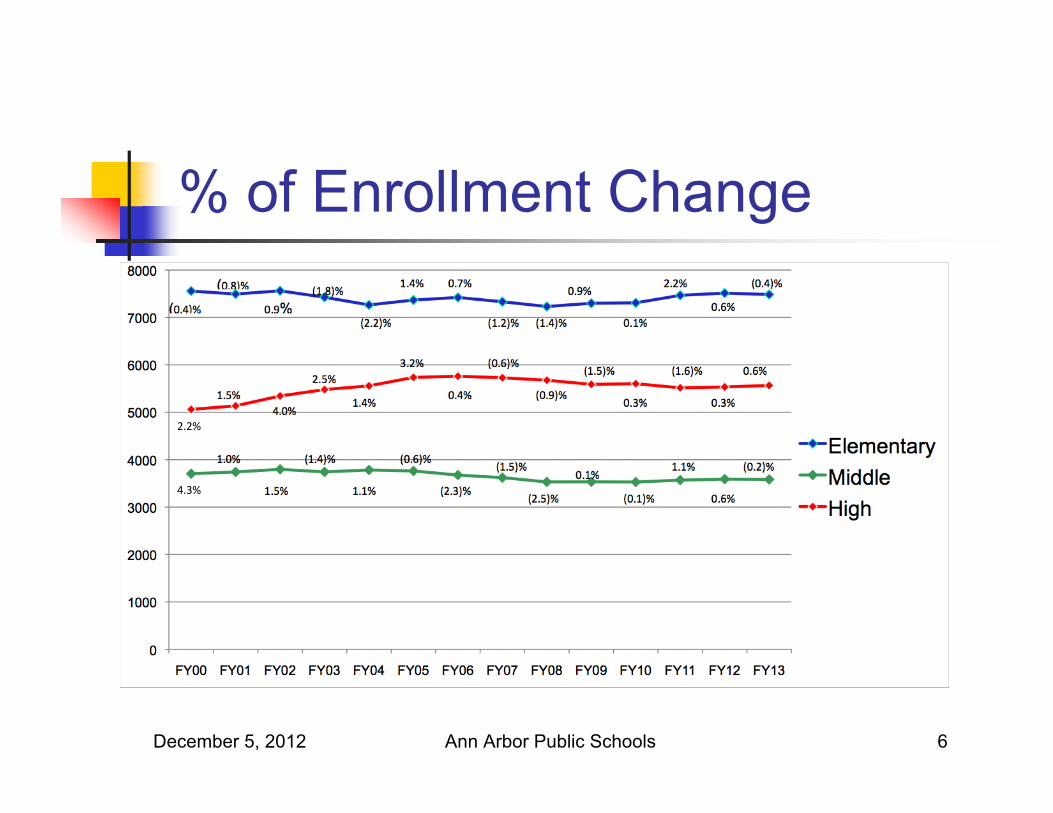
Fall Headcount 2012 Comparedto Fall 2011 by Level
Grades K - 5 Fall 2011 – 7,513 Fall 2012 – 7,484
Grades 6 – 8 Fall 2011 – 3,590 Fall 2012 – 3,584
Grades 9 – 12 Fall 2011 – 5,534 Fall 2012 – 5,566
Total Headcount Fall 2011 – 16,637 Fall 2012 – 16,634
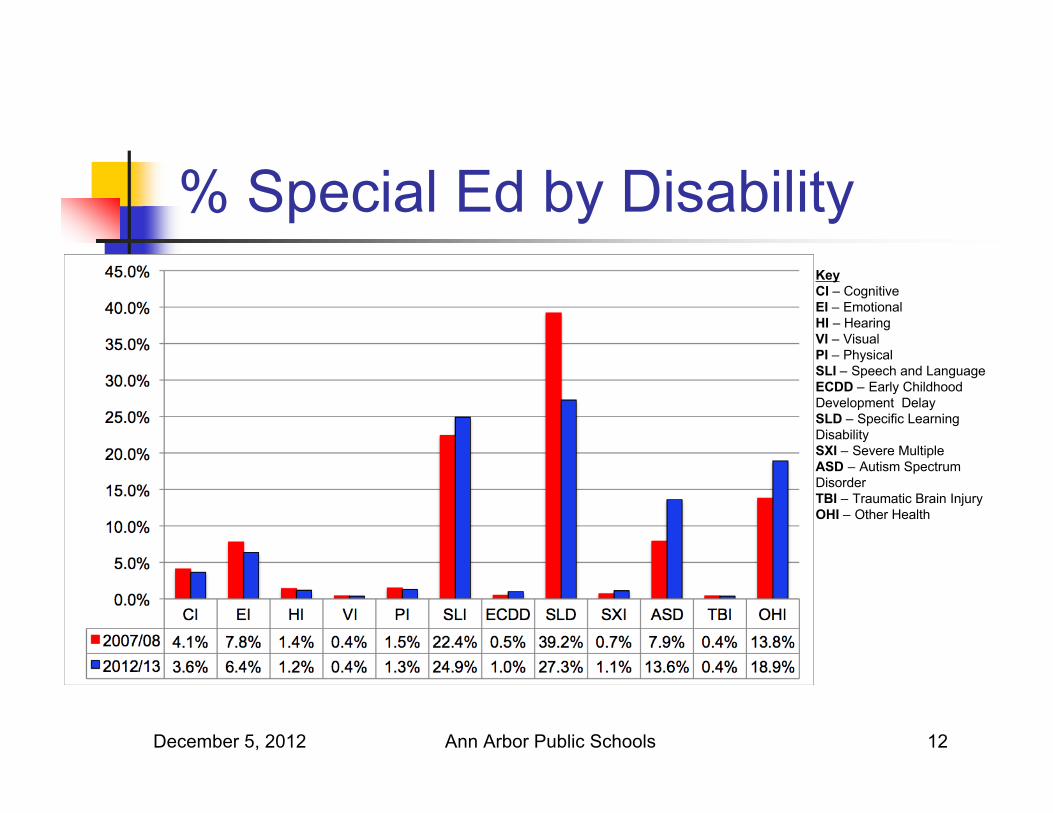
KeyCI – CognitiveEI – EmotionalHI – HearingVI – VisualPI – PhysicalSLI – Speech and LanguageECDD – Early ChildhoodDevelopment DelaySLD – Specific LearningDisabilitySXI – Severe MultipleASD – Autism SpectrumDisorderTBI – Traumatic Brain InjuryOHI – Other Health
% of EconomicallyDisadvantaged by Grade
December 5, 2012 Ann Arbor Public Schools 13
Total Number 4,068 Overall 24.6%
Limited English Speaking 802 Students Eligible for ESL Services 49 Different Languages Spoken Languages Most Often
Spanish – 29.8% Japanese – 14.5% Chinese – 13.7% Korean – 11.1% Arabic – 10.0%
December 5, 2012 Ann Arbor Public Schools 14
Schools of ChoiceFall2010
Fall2011
Fall2012
Total
Applied 51 133 142 326Enrolled 33 84 102 219
December 5, 2012 Ann Arbor Public Schools 15
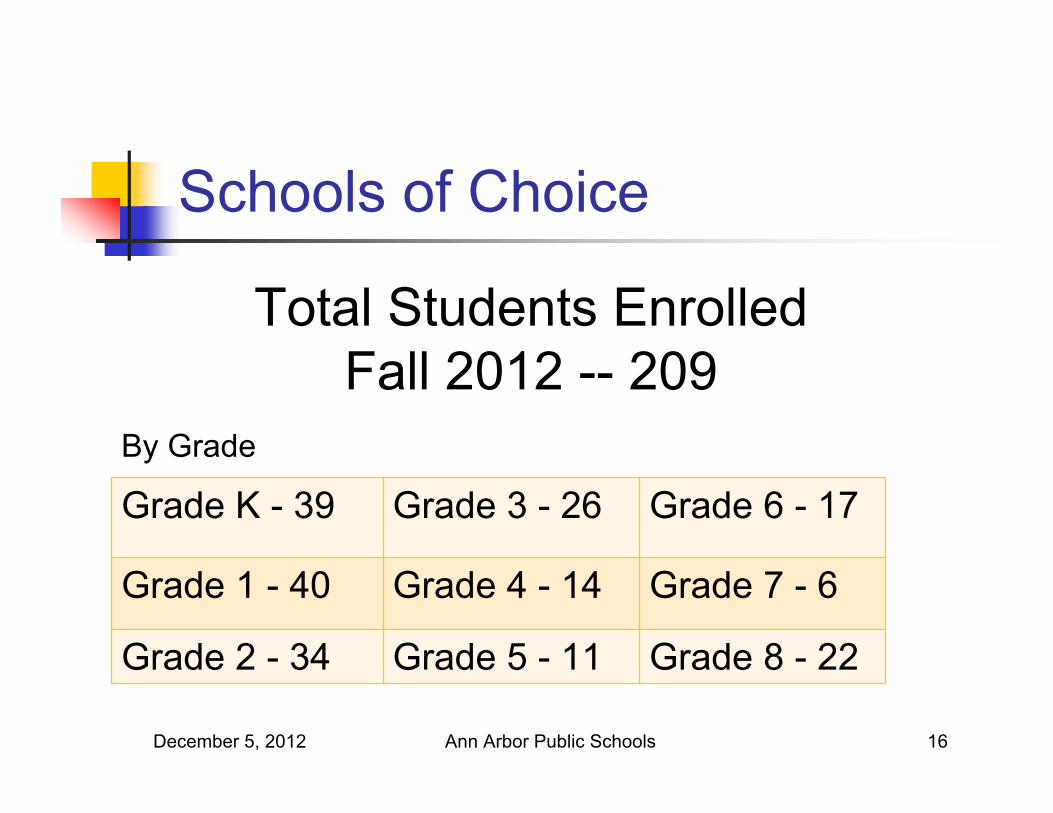
Total Students EnrolledFall 2012 -- 209
Schools of Choice
December 5, 2012 Ann Arbor Public Schools 16
Total Students EnrolledFall 2012 -- 209
Grade K - 39 Grade 3 - 26 Grade 6 - 17
Grade 1 - 40 Grade 4 - 14 Grade 7 - 6
Grade 2 - 34 Grade 5 - 11 Grade 8 - 22
By Grade
Other Enrollees Non Resident Children of Employees -
157 Foreign Exchange Students - 54 USA Hockey Students - 45 Options/Seat Time Waiver - 23 Home Schooled Students – 10 students
(2.34 FTE)
December 5, 2012 Ann Arbor Public Schools 17
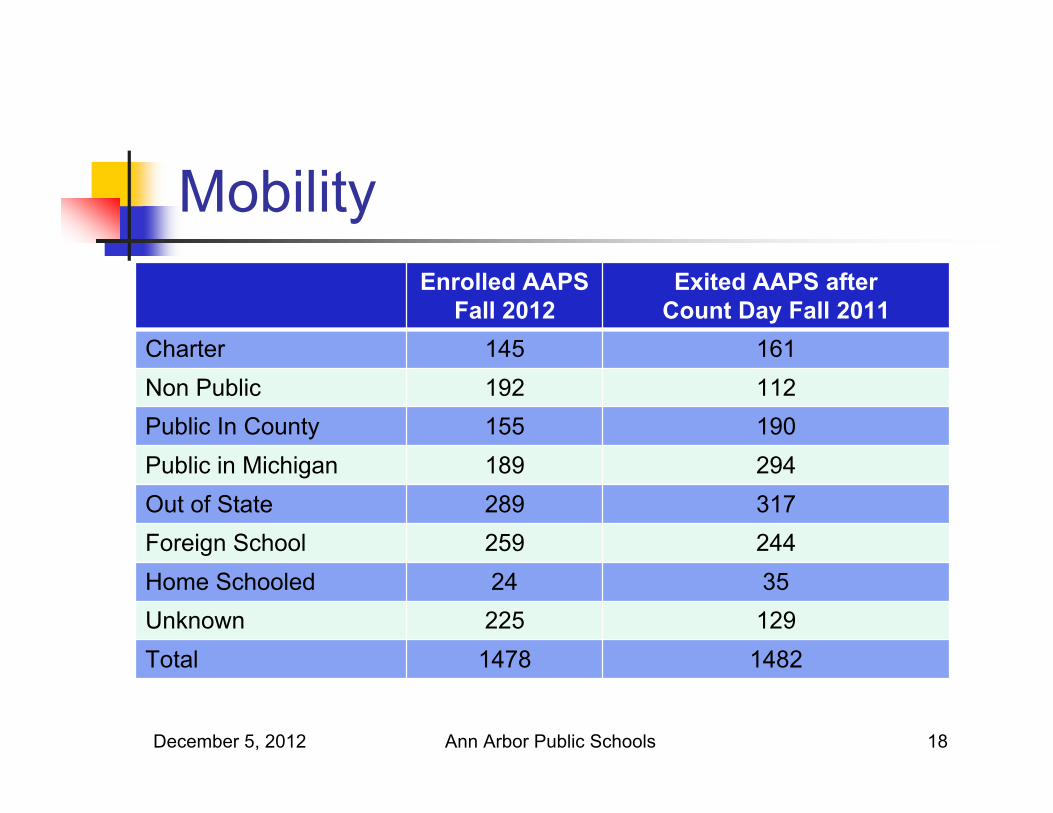
MobilityEnrolled AAPS
Fall 2012Exited AAPS after
Count Day Fall 2011Charter 145 161Non Public 192 112Public In County 155 190Public in Michigan 189 294Out of State 289 317Foreign School 259 244Home Schooled 24 35Unknown 225 129Total 1478 1482
December 5, 2012 Ann Arbor Public Schools 18
AAPS Residents Enrolled in Other Public Schools
December 5, 2012 Ann Arbor Public Schools 19
AAPS Residents Enrolledin Charter Schools
October 24, 2012 Ann Arbor Public Schools 20
Non Residents Enrolled vs.Residents Not Enrolled
December 5, 2012 Ann Arbor Public Schools 21
Ann Arbor Public Schools Plymouth Canton Schools
Kindergarten Enrollment Trends2007/08 to 2011/12
AAPS – increase by 4.5%
County – increase by 2.9%
Statewide – decrease by (2.4)%
December 5, 2012 Ann Arbor Public Schools 22
Grade K-12 Enrollment Trends2007/08 to 2011/12
AAPS – increase by 1.3%
County – decrease by (0.7)%
Statewide – decrease by (6.2)%
December 5, 2012 Ann Arbor Public Schools 23
Enrollment Projections Based onAverage of Previous Years
Reserved Rooms include Title 1, Special Education, childcare,computer labs, special services (i.e.occupational and physical therapy or special gym, art, Music, Vocal Music, small group area for social worker, psychologists,or other professional staff;tutors,staff workroom; or staff dining room