ENROLLMENT MANAGEMENT Presentation to the Board of Trustees December 15, 2014 By Dr. Craig Justice, Vice President for Instruction, Irvine Valley College Dr. Kathy Werle, Vice President for Instruction, Saddleback College Dr. Linda Fontanilla, Vice President for Student Services, Irvine Valley College Dr. Juan Avalos, Vice President for Student Services, Saddleback College
Transcript
ENROLLMENT MANAGEMENT
Presentation to the Board of Trustees December 15, 2014By
Dr. Craig Justice, Vice President for Instruction, Irvine Valley CollegeDr. Kathy Werle, Vice President for Instruction, Saddleback CollegeDr. Linda Fontanilla, Vice President for Student Services, Irvine Valley CollegeDr. Juan Avalos, Vice President for Student Services, Saddleback College
Report Request
The colleges were asked to provide a report on what comprises enrollment management at Saddleback College and Irvine Valley College. What activities are planned for maintaining or increasing enrollment in the short and long range?
Definition
Enrollment management is an institution wide, systematic, comprehensive, research-driven system designed to locate,
attract, and retain the students the institution wishes to serve.
--Noel-Levitz, LLC
Components of Enrollment Management• Data Driven, Student-Centered Scheduling• Student Success and Retention• Outreach and Recruitment• Managing “the Funnel”• K-12 Partnerships• Online Education
Student-Centered Schedule Development• Review of Historical Data, Trends, Other Information
• Gap Analysis, Bottlenecks• Goal: Offer What Students Need
• Effective Room Utilization • Block Scheduling• Attention to Course and Room Caps
• Balance• Days of Week, Times of Day• Mix of Online, Hybrid, and Face-to-Face Classes
Student-Centered Schedule Development
Analysis of data • Unique needs of student populations require
that you know who you are trying to serve• Community and regional data that impact
enrollment• Individual student data that informs planners
when to offer classes, where to offer them, and how (face-to-face, online, or hybrid)
Identify Market Segments, Their Needs• Recent High School Graduates• Continuing Students• Transfer, CTE, Basic Skills• Skills Enhancement• Lifelong Learners • Returning Students• Nonresident, International Students• Adult Education
0
2,000
4,000
6,000
8,000
10,000
12,000
14,000
16,000
18,000
20,000
FTES
Total FTES by Academic Year and College
Irvine Valley SaddlebackNote: FTES data for 2010-11 are taken from the CCFS 320 report. 2010-11 FTES data from the California Community College Chancellor's Office for that year was anomalous . FTES data from the CCCCO datamart for 2010-11 was 15,529.3 for Irvine Valley and 24,670.4 for Saddleback.Source: CCCCO Data Mart
Source: InForm Data warehouse, Enrollment Cube
IVC Resident/Non-Resident FTES
4,367 Resident FTES
89.6% of Total FTES
506 Non-Resident FTES 10.4% of Total
FTES
Fall 2014
Resident FTES Non Resident FTES
Non-Credit (Emeritus/Tutoring)
9.10%Enhanced Non-
Credit (ESL)1.07%
Credit (CTE)28.79%
Credit (Transfer/Degree
Applicable)58.33%
Credit (Basic Skills)2.71%
Saddleback College’s FTES (2013-2014)
Source: InForm Data warehouse, Enrollment Cube
6,076 Resident FTES 95.7% of
Total FTES
272 Non Resident FTES 4.3% of Total
FTES
Resident FTES Non Resident FTES
SC Resident/Non-Resident FTES
The Perfect Storm • Reduction in Applications• Fewer High School Grads• Repeatability and
Repetition Regulations• New Enrollment Priorities• New Matric Requirements• Economic Upturn• Prerequisite Validation
• Shifts in Demand for Undetermined Reasons
• Technology Glitches• Parking Issue Perception• Declining Population Base
in Some Cities• Greater Competition • Scheduling Issues
Environmental Scan
Environmental Scan: Saddleback Insight
“Specifically, in the year 2020, the 15-19 year-old age range, the traditional college age population, will slightly decline in the Saddleback College service area and will increase only very slightly in the Irvine Valley College service area. These projections could influence the numbers of incoming freshmen for 2020 and enrollment projections.”
•-External Scan 2013 (May 29, 3)
Environmental Scan: IVC Insight“Examining the numbers of students enrolled currently in the 5th grade in the service areas’ unified school districts, and compared those numbers to the numbers of students enrolled in the 12th grade currently. The number of those currently enrolled in the 5th grade approximate the number that will be graduating in 2020. For SC service area, there is an -8.8% difference in the number of current 5th graders to 12th graders, and for Irvine Valley College, there is a 14% difference”.
Additional Efforts to Restore Enrollment• Student Retention Campaign• Enrollment Management Work Group• Faster Financial Aid notifications• Appointment and Drop-in Assessment • MAP Workshops• Heightened K-12 Outreach
Irvine Valley College Efforts From Support Services
Student Success, Access, Matriculation, Marketing and Outreach (SSAMMO) Committee
• Strategic Planning Committee with College-Wide Representation
• Purpose/Charge:• Develop and implement strategic planning objectives and
strategies• Review, critique, update and support matriculation processes• Identify and propose solutions for student access concerns• Recommend and review marketing materials.• Support the planning and promotion of key events for the
purposes of outreach and student recruitment
SB 1456 Matriculation Requirements
• Apply for Admissions• Mandated Services
OrientationAssessmentAdvisement/First Semester Academic Plan
• Enrollment
IVC’s Mega Outreach Event• October 1, 2014• Goal: 50 staff, faculty, & administrators to visit
500 organizations• 55 volunteers• Visited 426 organizations• Positive results – Connected with local
organizations in service area• Celebration!
IVC CONNECT Partnership ProgramMOUs with selected High Schools
Northwood High SchoolIUSD
Beckman High SchoolTUSD
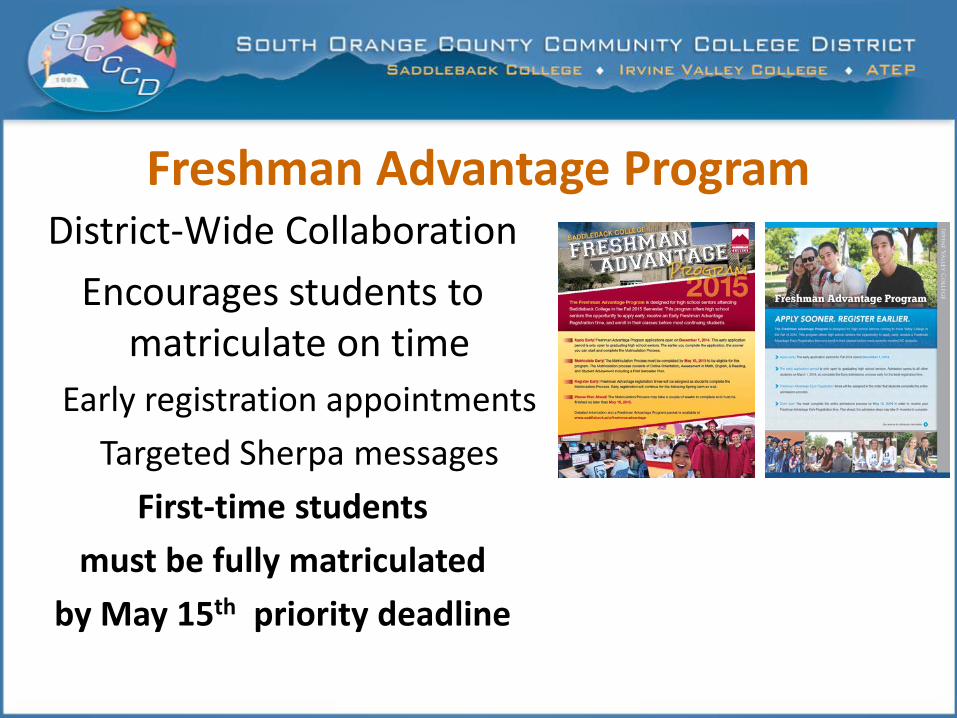
2014 Campus Events• Campus Tours• High School Counselors’ Conference• President’s Breakfast• Fast Friday events• Freshman Advantage Program• Coordination with:
- Marketing & Communications Department- Faculty & deans to promote their programs- Honors Program- Categorical programs- Student Ambassadors Program
Fast Friday EventsInformation designed for students and parents.
College Application-to-Enrollment Yields: 2010-2014
Fall 2010 Fall 2011 Fall 2012 Fall 2013 Fall 2014
Total Financial Aid Applications 4,867 5,706 6,718 6,738 6,990
Total Financial Aid Awards 2,374 3,193 3,471 3,408 3,373*
Yield 49% 56% 52% 50% 48%
FTF Financial Aid Applications 1,058 1,249 1,397 1,394 1,480
FTF Financial Aid Awards 493 738 723 668 789*
Yield 47% 60% 52% 48% 53%
Financial Aid Application-to-Award Yields: 2010-2014
* Students have until 12/22/14 to complete their Financial Aid file and be awarded.
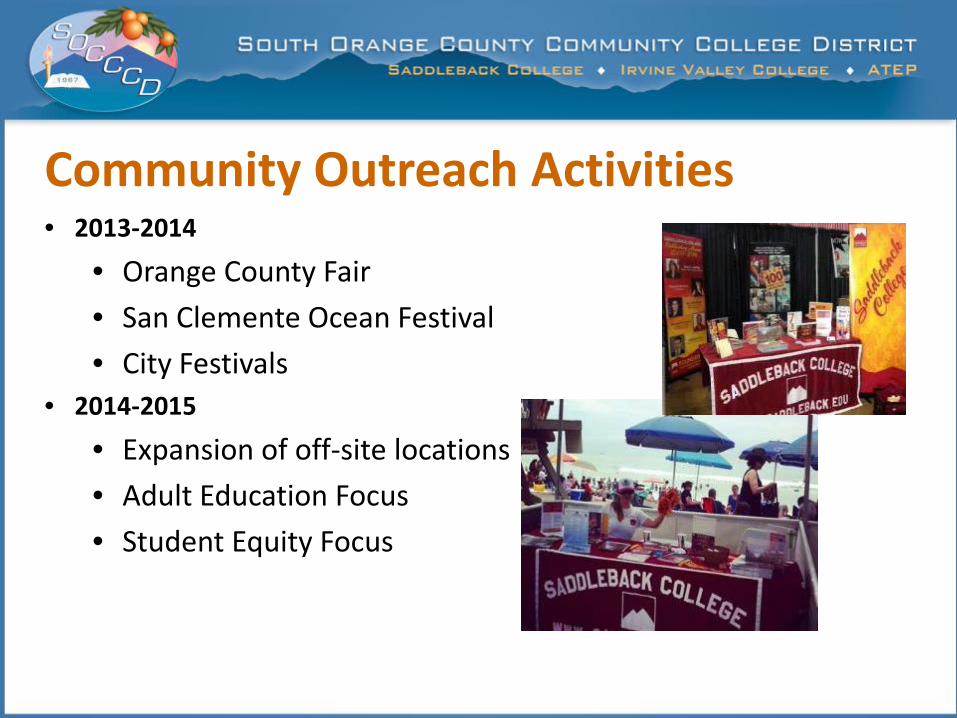
After-School Programming at CUSD• 2013-2014
• 30 Elementary, Middle, and High School locations• 10,499 Student Registrations• 147 Average number of classes with participation/session• 33 Partner Vendors• Junior Gauchos: Back to School Nights, Carnivals, Parent Meetings
• 2014-2015 • Expand locations• Partnerships with PTAs, foundations, and other parent organizations• Scholarship program
SC K-8th Grade Outreach Activities
• 2013-2014• 21 College Nights/Career Fairs• 142 Classroom Presentations• 12 Application Workshops• 21 Financial Aid Workshops• 13 On Site Matriculation/