Ensemble Learning for Named Entity Recognition Ren´ e Speck and Axel-Cyrille Ngonga Ngomo AKSW, Department of Computer Science, University of Leipzig, Germany {speck,ngonga}@informatik.uni-leipzig.de Abstract. A considerable portion of the information on the Web is still only available in unstructured form. Implementing the vision of the Semantic Web thus requires transforming this unstructured data into structured data. One key step during this process is the recognition of named entities. Previous works sug- gest that ensemble learning can be used to improve the performance of named entity recognition tools. However, no comparison of the performance of existing supervised machine learning approaches on this task has been presented so far. We address this research gap by presenting a thorough evaluation of named entity recognition based on ensemble learning. To this end, we combine four different state-of-the approaches by using 15 different algorithms for ensemble learning and evaluate their performace on five different datasets. Our results suggest that ensemble learning can reduce the error rate of state-of-the-art named entity recog- nition systems by 40%, thereby leading to over 95% f-score in our best run. Keywords: Named Entity Recognition • Ensemble Learning • Semantic Web 1 Introduction One of the first research papers in the field of named entity recognition (NER) was presented in 1991 [32]. Today, more than two decades later, this research field is still highly relevant for manifold communities including Semantic Web Community, where the need to capture and to translate the content of natural language (NL) with the help of NER tools arises in manifold semantic applications [15, 19, 20, 24, 34]. The NER tools that resulted from more than 2 decades of research now implement a diversity of algorithms that rely on a large number of heterogeneous formalisms. Consequently, these algorithms have diverse strengths and weaknesses. Currently, several services and frameworks that consume NL to generate semi- structured or even structured data rely on solely one of the formalisms developed for NER or simply merging the results of several tools (e.g., by using simple voting). By do- ing so, current approaches fail to make use of the diversity of current NER algorithms. On the other hand, it is a well-known fact that algorithms with diverse strengths and weaknesses can be aggregated in various ways to create a system that outperforms the best individual algorithms within the system [44]. This learning paradigm is known as ensemble learning. While previous works have already suggested that ensemble learn- ing can be used to improve NER [34], no comparison of the performance of existing supervised machine-learning approaches for ensemble learning on the NER task has been presented so far.
Transcript
Ensemble Learning for Named Entity Recognition
Rene Speck and Axel-Cyrille Ngonga Ngomo
AKSW, Department of Computer Science, University of Leipzig, Germany{speck,ngonga}@informatik.uni-leipzig.de
Abstract. A considerable portion of the information on the Web is still onlyavailable in unstructured form. Implementing the vision of the Semantic Webthus requires transforming this unstructured data into structured data. One keystep during this process is the recognition of named entities. Previous works sug-gest that ensemble learning can be used to improve the performance of namedentity recognition tools. However, no comparison of the performance of existingsupervised machine learning approaches on this task has been presented so far.We address this research gap by presenting a thorough evaluation of named entityrecognition based on ensemble learning. To this end, we combine four differentstate-of-the approaches by using 15 different algorithms for ensemble learningand evaluate their performace on five different datasets. Our results suggest thatensemble learning can reduce the error rate of state-of-the-art named entity recog-nition systems by 40%, thereby leading to over 95% f-score in our best run.
Keywords: Named Entity Recognition • Ensemble Learning • Semantic Web
1 Introduction
One of the first research papers in the field of named entity recognition (NER) waspresented in 1991 [32]. Today, more than two decades later, this research field is stillhighly relevant for manifold communities including Semantic Web Community, wherethe need to capture and to translate the content of natural language (NL) with the helpof NER tools arises in manifold semantic applications [15, 19, 20, 24, 34]. The NERtools that resulted from more than 2 decades of research now implement a diversityof algorithms that rely on a large number of heterogeneous formalisms. Consequently,these algorithms have diverse strengths and weaknesses.
Currently, several services and frameworks that consume NL to generate semi-structured or even structured data rely on solely one of the formalisms developed forNER or simply merging the results of several tools (e.g., by using simple voting). By do-ing so, current approaches fail to make use of the diversity of current NER algorithms.On the other hand, it is a well-known fact that algorithms with diverse strengths andweaknesses can be aggregated in various ways to create a system that outperforms thebest individual algorithms within the system [44]. This learning paradigm is known asensemble learning. While previous works have already suggested that ensemble learn-ing can be used to improve NER [34], no comparison of the performance of existingsupervised machine-learning approaches for ensemble learning on the NER task hasbeen presented so far.
We address this research gap by presenting and evaluating an open-source frame-work for NER that makes use on ensemble learning. In this evaluation, we use fourstate-of-the-art NER algorithms, fifteen different machine learning algorithms and fivedatasets. The statistical significance our results is ensured by using Wilcoxon signed-rank tests.
The goal of our evaluation is to answer the following questions:
1. Does NER based on ensemble learning achieve higher f-scores than the best NERtool within the system?
2. Does NER based on ensemble learning achieve higher f-scores than simple votingbased on the results of the NER tools?
3. Which ensemble learning approach achieves the best f-score for the NER task?
The rest of this paper is structured as follows. After reviewing related work in Sec-tion 2, we give an overview of our approach in Section 3. Especially, we present the the-oretical framework that underlies our approach. Subsequently, in Section 4, we presentour evaluation pipeline and its setup. Thereafter, in Section 5, we present the resultsof a series of experiments in which we compare several machine learning algorithmswith state-of-the-art NER tools. We conclude by discussing our results and elaborat-ing on some future work in Section 6. The results of this paper were integrated intothe open-source NER framework FOX.1 Our framework provides a free-to-use REST-ful web service for the community. A documentation of the framework as well as aspecification of the RESTful web service can be found at FOX’s project page.
2 Related Work
NER tools and frameworks implement a broad spectrum of approaches, which canbe subdivided into three main categories: dictionary-based, rule-based and machine-learning approaches [31]. The first systems for NER implemented dictionary-based ap-proaches, which relied on a list of named entities (NEs) and tried to identify these intext [2,43]. Following work then showed that these approaches did not perform well forNER tasks such as recognizing proper names [39]. Thus, rule-based approaches wereintroduced. These approaches rely on hand-crafted rules [8,42] to recognize NEs. Mostrule-based approaches combine dictionary and rule-based algorithms to extend the listof known entities. Nowadays, hand-crafted rules for recognizing NEs are usually im-plemented when no training examples are available for the domain or language to pro-cess [32]. When training examples are available, the methods of choice are borrowedfrom supervised machine learning. Approaches such as Hidden Markov Models [46],Maximum Entropy Models [10] and Conditional Random Fields [14] have been appliedto the NER task. Due to scarcity of large training corpora as necessitated by supervisedmachine learning approaches, the semi-supervised [31, 35] and unsupervised machinelearning paradigms [13, 33] have also been used for extracting NER from text. In [44],a system was presented that combines with stacking and voting classifiers which were
1 Project page:http://fox.aksw.org. Source code, evaluation data and evaluation re-sults:http://github.com/AKSW/FOX.
trained with several languages, for language-independent NER. [31] gives an exhaustiveoverview of approaches for the NER task.
Over the last years, several benchmarks for NER have been proposed. For exam-ple, [9] presents a benchmark for NER and entity linking approaches. Especially, theauthors define the named entity annotation task. Other benchmark datasets include themanually annotated datasets presented in [38]. Here, the authors present annotateddatasets extracted from RSS feeds as well as datasets retrieved from news platforms.Other authors designed datasets to evaluate their own systems. For example, the Webdataset (which we use in our evaluation) is a particularly noisy dataset designed to eval-uate the system presented in [37]. The dataset Reuters, which we also use, consistsannotated documents chosen out of the Reuters-215788 corpus and was used in [4].
3 Overview
3.1 Named Entity Recognition
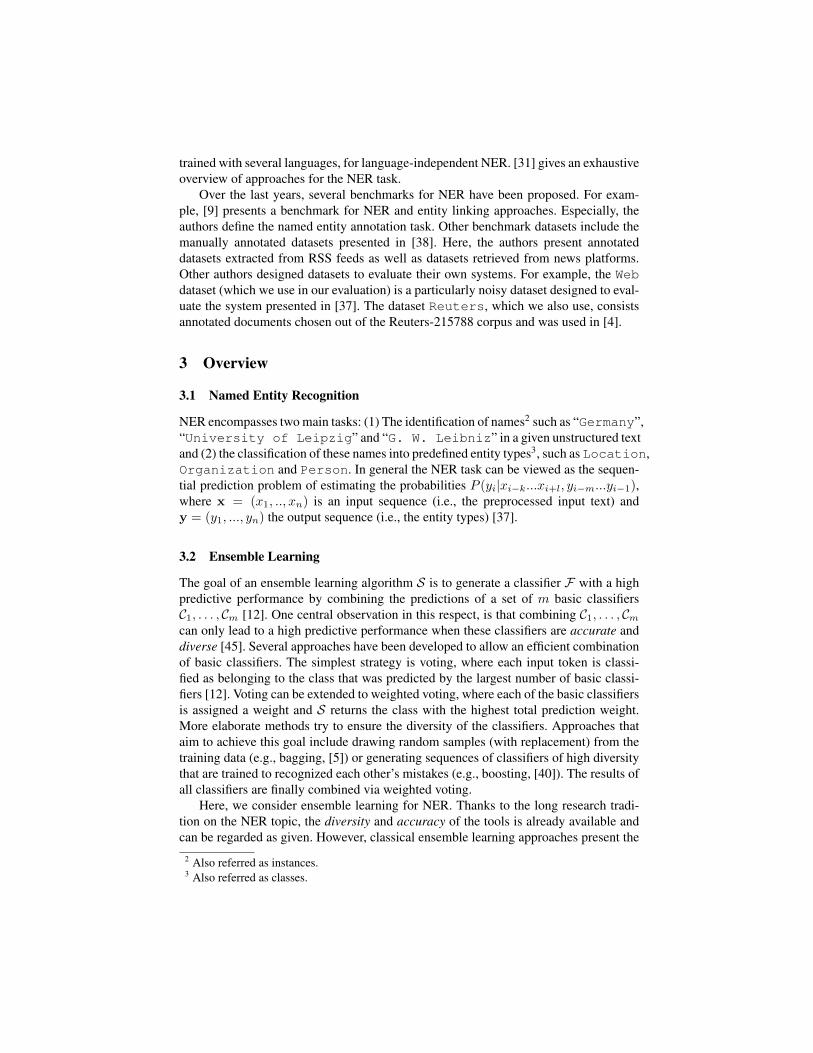
NER encompasses two main tasks: (1) The identification of names2 such as “Germany”,“University of Leipzig” and “G. W. Leibniz” in a given unstructured textand (2) the classification of these names into predefined entity types3, such as Location,Organization and Person. In general the NER task can be viewed as the sequen-tial prediction problem of estimating the probabilities P (yi|xi−k...xi+l, yi−m...yi−1),where x = (x1, .., xn) is an input sequence (i.e., the preprocessed input text) andy = (y1, ..., yn) the output sequence (i.e., the entity types) [37].
3.2 Ensemble Learning
The goal of an ensemble learning algorithm S is to generate a classifier F with a highpredictive performance by combining the predictions of a set of m basic classifiersC1, . . . , Cm [12]. One central observation in this respect, is that combining C1, . . . , Cmcan only lead to a high predictive performance when these classifiers are accurate anddiverse [45]. Several approaches have been developed to allow an efficient combinationof basic classifiers. The simplest strategy is voting, where each input token is classi-fied as belonging to the class that was predicted by the largest number of basic classi-fiers [12]. Voting can be extended to weighted voting, where each of the basic classifiersis assigned a weight and S returns the class with the highest total prediction weight.More elaborate methods try to ensure the diversity of the classifiers. Approaches thataim to achieve this goal include drawing random samples (with replacement) from thetraining data (e.g., bagging, [5]) or generating sequences of classifiers of high diversitythat are trained to recognized each other’s mistakes (e.g., boosting, [40]). The results ofall classifiers are finally combined via weighted voting.
Here, we consider ensemble learning for NER. Thanks to the long research tradi-tion on the NER topic, the diversity and accuracy of the tools is already available andcan be regarded as given. However, classical ensemble learning approaches present the
2 Also referred as instances.3 Also referred as classes.
disadvantage of relying on some form of weighted vote on the output of the classifiers.Thus, if all classifiers Ci return wrong results, classical ensemble learning approachesare bound to make the same mistake [12]. In addition, voting does not take the differentlevels of accuracy of classifiers for different entity types into consideration. Rather, itassigns a global weight to each classifier that describes its overall accuracy. Based onthese observations, we decided to apply ensemble learning for NER based at entity-typelevel. The main advantage of this ensemble-learning setting is that we can now assigndifferent weights to each tool-type pair.
Formally, we model the ensemble learning task at hand as follows: Let the matrixMmt×n (Equation 1) illustrate the input data for S, where Pm
n,t are predictions of them-th NER tool that the n-th token is of the t-th type.P
11,1 · · · P1
1,t P21,1 · · · P2
1,t · · · Pm1,1 · · · Pm
1,t...
. . ....
.... . .
......
. . ....
P1n,1 · · · P1
n,t P2n,1 · · · P2
n,t · · · Pmn,1 · · · Pm
n,t
(1)
The goal of ensemble learning for NER is to detect a classifier that leads to a correctclassification of each of the n tokens into one of the types t.
4 Evaluation
We performed a thorough evaluation of ensemble learning approaches by using five dif-ferent datasets and running a 10-fold cross-validation for 15 algorithms. In this section,we present the pipeline and the setup for our evaluation as well as our results.
4.1 Pipeline
Fig. 1: Workflow chart of the evaluation pipeline.
Figure 1 shows the workflow chart of our evaluation pipeline. In the first step ofour evaluation pipeline, we preprocessed our reference dataset to extract the input textfor the NER tools as well as the correct NEs, which we used to create training andtesting data. In the second step, we made use of all NER tools with this input text to
calculate the predictions of all entity types for each token in this input. At this point,we represented the output of the tools as matrix (see Equation 1). Thereafter, the matrixwas randomly split into 10 disjoint sets as preparation for a 10-fold cross-validation.We trained the different classifiers at hand (i.e., S) with the training dataset (i.e., with 9of 10 sets) and tested the trained classifier with the testing dataset (i.e., with the leftoverset). To use each of the 10 sets as testing set once, we repeated training and testing ofthe classifiers 10 times and used the disjoint sets accordingly. Furthermore, the pipelinewas repeated 10 times to deal with non-deterministic classifiers. In the last step, wecompared the classification of the 10 testing datasets with the oracle dataset to calculatemeasures for the evaluation.
We ran our pipeline on 15 ensemble learning algorithms. We carried out both atoken-based evaluation and an entity-based evaluation. In the token-based evaluation,we regarded partial matches of multi-word units as being partially correct. For example,our gold standard considered “Federal Republic of Germany” as being aninstance of Location. If a tool generated “Germany” as being a location and omitted“Federal Republic of”, it was assigned 1 true positive and 3 false negatives. Theentity-based evaluation only regarded exact matches as correct. In the example above,the entity was simply considered to be incorrect. To provide transparent results, we onlyused open-source libraries in our evaluation. Given that some of these tools at hand donot allow accessing their confidence score without any major alteration of their code,we considered the output of the tools to be binary (i.e., either 1 or 0).
We integrated four NER tools so far: the Stanford Named Entity Recognizer4 (Stan-ford) [14], the Illinois Named Entity Tagger5 (Illinois) [37], the Ottawa Baseline Infor-mation Extraction6 (Balie) [30] and the Apache OpenNLP Name Finder7 (OpenNLP)[3]. We only considered the performance of these tools on the classes Location,Organization and Person. To this end, we mapped the entity types of each ofthe NER tools to these three classes. We utilized the Waikato Environment for Knowl-edge Analysis (Weka) [21] and the implemented classifiers with default parameters:AdaBoostM1 (ABM1) [16] and Bagging (BG) [5] with J48 [36] as base classifier,Decision Table (DT) [26], Functional Trees (FT) [18, 27], J48 [36], Logistic ModelTrees (LMT) [27, 41], Logistic Regression (Log) [28], Additive Logistic Regression(LogB) [17], Multilayer Perceptron (MLP), Naıve Bayes (NB) [23], Random Forest(RF) [6], Support Vector Machine (SVM) [7] and Sequential Minimal Optimization(SMO) [22]. In addition, we used voting at class level (CVote) and a simple voting(Vote) approach [44] with equal weights for all NER tools. CVote selects the NER toolwith the highest prediction performance for each type according to the evaluation anduses that particular tool for the given class. Vote as naive approach combines the re-sults of the NER tools with the Majority Vote Rule [25] and was the baseline ensemblelearning technique in our evaluation.
We used five datasets and five measures for our evaluation. We used the recommendedWilcoxon signed-rank test to measure the statistical significance of our results [11]. Forthis purpose, we applied each measurement of the ten 10-fold cross-validation runs forthe underlying distribution and we set up a 95% confidence interval.
Datasets An overview of the datasets is shown in Table 1. The Web dataset consistsof 20 annotated Web sites as described in [37] and contains the most noise comparedto the other datasets. The dataset Reuters consists of 50 documents randomly chosenout of the Reuters-215788 corpus8 [4]. News∗ is a small subset of the dataset News thatconsists of text from newspaper articles and was re-annotated manually by the authorsto ensure high data quality. Likewise, Reuters was extracted and annotated manuallyby the authors. The last dataset, All, consists of the datasets mentioned before mergedinto one and allows for measuring how well the ensemble learning approaches performwhen presented with data from heterogenous sources.
Table 1: Number of entities separated according entity types and in total.Class News News∗ Web Reuters All
Measures To assess the performance of the different algorithms, we computed the fol-lowing values on the test datasets: The number of true positives TPt, the number oftrue negatives TNt, the number of false positives FPt and the number of false neg-atives FNt. These numbers were collected for each entity type t and averaged overthe ten runs of the 10-fold cross-validations. Then, we applied the one-against-all ap-proach [1] to convert the multi-class confusion matrix of each dataset into a binaryconfusion matrix.
Subsequently, we determined with macro-averaging the classical measures recall(rec), precision (pre) and f-score (F1) as follows:
rec =
∑t∈T
TPt
(TPt+FNt)
|T |, pre =
∑t∈T
TPt
TPt+FPt
|T |, F1 =
∑t∈T
2pretrectpret+rect
|T |. (2)
8 The Reuters-215788 corpus is available at:http://kdd.ics.uci.edu/databases/reuters21578/reuters21578.html.
For the sake of completeness, we averaged the error rate (error) (Equation 3) and theMatthews correlation coefficient (MCC) [29] (Equation 4) similarly.
The error rate monitors the fraction of positive and negative classifications for thatthe classifier failed. The Matthews correlation coefficient considers both the true posi-tives and the true negatives as successful classification and is rather unaffected by sam-pling biases. Higher values indicating better classifications.
5 Results
Table 2–Table 11 show the results of our evaluation for the 15 classifiers we used withinour pipeline and the four NER tools we integrated so far. The best results are markedbold and the NER tools are underlined. Figure 2–Figure 4 depict the f-scores separatedaccording classes of the four NER tools, the simple voting approach Vote and the bestclassifier for the depicted dataset.
We reached the highest f-scores on the News∗ dataset (Table 2 and Table 3) forboth the token-based and the entity-based evaluation. In the token-based evaluation,the MLP and RF classifiers perform best for precision (95.28%), error rate (0.32%)and Matthews correlation coefficient (0.951). MLP performs best for f-score (95.23%)with 0.04% more recall than RF. The baseline classifier (i.e., simple voting) is clearlyoutperformed by MLP by up to +5.21% recall, +12.31% precision, +9.31% f-score, -0.62% error rate and +0.094 MCC. Furthermore, the best single approach is Stanfordand outperformed by up to +2.83% recall, +4.27% precision, +3.55% f-score, -0.21%error rate (that is a reduction by 40%) and +0.037 MCC. Slightly poorer results areachieved in the entity-based evaluation, where MLP is second to FT with 0.01% lessf-score.
On the News dataset (Table 4-Table 5), which was the largest homogenous datasetin our evaluation, we repeatedly achieved high f-scores. The best approach w.r.t. the
token-based evaluation is LMT with an f-score of 92.94%. Random Forest follows thebest approach with respect to f-score again. Moreover, the best single tool Stanford andthe baseline classifier Vote are repeatedly outperformed by up to +2.6% resp. +19.91%f-score. Once again, the entity-based results are approximately 2% poorer, with LMTleading the table like in the token-based evaluation.
On the Web dataset (Table 6-Table 7), which is the worst-case dataset for NER toolsas it contains several incomplete sentences, the different classifiers reached their lowestvalues. For the token-based evaluation, AdaBoostM1 with J48 achieves the best f-score(69.04%) and Matthews correlation coefficient (0.675) and is followed by Random For-est again with respect to f-score. Naıve Bayes performs best for recall (96.64%), Lo-gistic Regression for precision (77.89%) and MLP and RF for the error rate (3.33%).Simple voting is outperformed by ABM1 by up to +3.5% recall, +20.08% precision,+10.45% f-score, -2.64% error rate and +0.108 MCC, while Stanford (the best tool forthis dataset) is outperformed by up to +3.83% recall, +2.64% precision, +3.21% f-score,-0.13% error rate and +0.032 MCC. Similar insights can be won from the entity-basedevaluation, with some classifiers like RF being approximately 10% poorer that at tokenlevel.
On the Reuters dataset (Table 8-Table 9), which was the smallest dataset in ourevaluation, Support Vector Machine performs best. In the token-based evaluation, SVMachieves an f-score of 87.78%, an error rate of 0.89% and a Matthews correlation co-efficient of 0.875%. They are followed by Random Forest with respect to f-score onceagain. Naıve Bayes performs best for recall (86.54%). In comparison, ensemble learn-ing outperforms Vote with SVM by up to +4.46% recall, +3.48% precision, +2.43% f-
score, -0.54% error rate and +0.082 MCC. Moreover, the best NER tool for this dataset,Illinois, is outperformed by up to +0.83% recall, +3.48% precision, +2.43% f-score,-0.20% error rate and +0.024 MCC. In Figure 3a, we barely see a learning effect asABM1 is almost equal to one of the integrated NER tools assessed at class level es-pecially for the class Organization on the Web dataset but in Figure 3c on theReuters dataset we clearly see a learning effect for the class Organization andPerson with the SVM approach.
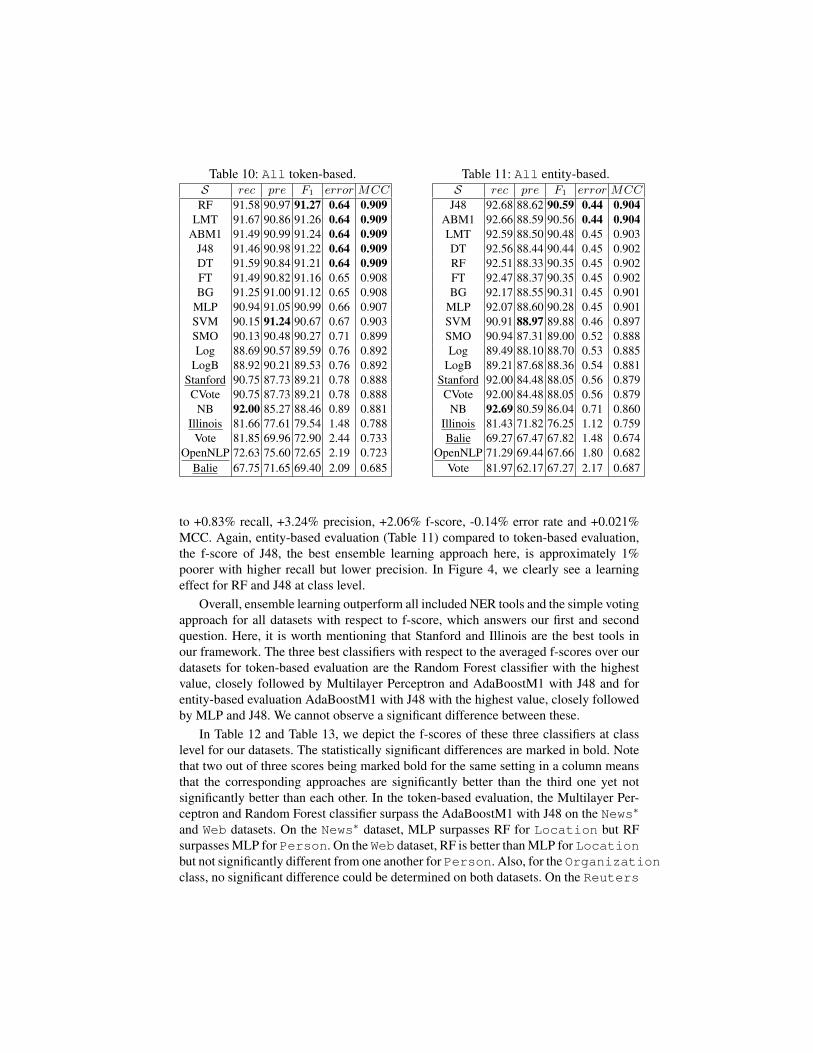
On the All dataset for token-based evaluation (Table 10), the Random Forest ap-proach performs best for f-score (91.27%), error rate (0.64%) and Matthews correlationcoefficient (0.909). Support Vector Machine achieves the best precision (91.24%) andNaıve Bayes the best recall (91.00%) again. In comparison, ensemble learning outper-formed Vote with RF by up to +9.71% recall, +21.01% precision, +18.37% f-score,-1.8% error rate and +0.176% MCC and Stanford, the best tool for this dataset, by up
to +0.83% recall, +3.24% precision, +2.06% f-score, -0.14% error rate and +0.021%MCC. Again, entity-based evaluation (Table 11) compared to token-based evaluation,the f-score of J48, the best ensemble learning approach here, is approximately 1%poorer with higher recall but lower precision. In Figure 4, we clearly see a learningeffect for RF and J48 at class level.
Overall, ensemble learning outperform all included NER tools and the simple votingapproach for all datasets with respect to f-score, which answers our first and secondquestion. Here, it is worth mentioning that Stanford and Illinois are the best tools inour framework. The three best classifiers with respect to the averaged f-scores over ourdatasets for token-based evaluation are the Random Forest classifier with the highestvalue, closely followed by Multilayer Perceptron and AdaBoostM1 with J48 and forentity-based evaluation AdaBoostM1 with J48 with the highest value, closely followedby MLP and J48. We cannot observe a significant difference between these.
In Table 12 and Table 13, we depict the f-scores of these three classifiers at classlevel for our datasets. The statistically significant differences are marked in bold. Notethat two out of three scores being marked bold for the same setting in a column meansthat the corresponding approaches are significantly better than the third one yet notsignificantly better than each other. In the token-based evaluation, the Multilayer Per-ceptron and Random Forest classifier surpass the AdaBoostM1 with J48 on the News∗
and Web datasets. On the News∗ dataset, MLP surpasses RF for Location but RFsurpasses MLP for Person. On the Web dataset, RF is better than MLP for Locationbut not significantly different from one another for Person. Also, for the Organizationclass, no significant difference could be determined on both datasets. On the Reuters
(a) All token-based. (b) All entity-based.
Fig. 4: All dataset.
dataset, MLP and RF are better than ABM1 for Location and Organization,but do not differ one another. For the class Person, no significant difference could bedetermined for all three classifiers. On the News and All dataset, Random Forest issignificantly best for Location. Random Forest and AdaBoostM1 with J48 surpassthe Multilayer Perceptron for Organization but are not significantly different. Forthe class Person, ABM1 is significantly best on the News dataset and RF is best onthe All dataset. The entity-level results also suggest shifts amongst the best systemsdepending on the datasets. Interestingly, MLP and ABM1 are the only two classes ofalgorithm that appear as top algorithms in both evaluation schemes.
Consequently, our results suggest that while the four approaches RF, MLP, ABM1and J48 perform best over the datasets at hand, MLP and ABM1 are to be favored. Notethat significant differences can be observed across the different datasets and that all fourparadigms RF, MLP, ABM1 and J48 should be considered when applying ensemblelearning to NER. This answers the last and most important question of this evaluation.
Table 12: F-score of the best 3 classifiers on class level token-based.S Class News News∗ Web Reuters All
In this paper, we evaluated named entity recognition based on ensemble learning, anapproach to increase the performance of state-of-the-art named entity recognition tools.On all datasets, we showed that ensemble learning achieves higher f-scores than thebest named entity recognition tool integrated in our system and higher f-scores com-pared with a simple voting on the outcome of the integrated tools. Our results suggestthat Multilayer Perceptron and AdaBoostM1 with J48 as base classifier work best forthe task at hand. We have now integrated the results of this evaluation into the FOXframework, which can be found at http://fox.aksw.org. The main advantagesof our framework are that it is not limited to the integration of named entity recognitiontools or ensemble learning algorithms and can be easily extended. Moreover, it providesadditional features like linked data and a RESTful web service to use by the community.
References
1. Erin L. Allwein, Robert E. Schapire, and Yoram Singer. Reducing multiclass to binary: Aunifying approach for margin classifiers. J. Mach. Learn. Res., 1:113–141, September 2001.
2. R. Amsler. Research towards the development of a lexical knowledge base for natural lan-guage processing. SIGIR Forum, 23:1–2, 1989.
3. J Baldridge. The opennlp project, 2005.4. S. D. Bay and S. Hettich. The UCI KDD Archive [http://kdd.ics.uci.edu], 1999.5. Leo Breiman. Bagging predictors. Machine Learning, 24(2):123–140, 1996.6. Leo Breiman. Random forests. Machine Learning, 45(1):5–32, 2001.7. Chih-Chung Chang and Chih-Jen Lin. Libsvm - a library for support vector machines, 2001.
The Weka classifier works with version 2.82 of LIBSVM.8. Sam Coates-Stephens. The analysis and acquisition of proper names for the understanding
of free text. Computers and the Humanities, 26:441–456, 1992. 10.1007/BF00136985.9. Marco Cornolti, Paolo Ferragina, and Massimiliano Ciaramita. A framework for benchmark-
ing entity-annotation systems. In Proceedings of the 22nd international conference on WorldWide Web, pages 249–260. International World Wide Web Conferences Steering Committee,2013.
10. James R. Curran and Stephen Clark. Language independent ner using a maximum entropytagger. In Proceedings of the seventh conference on Natural language learning at HLT-NAACL 2003 - Volume 4, pages 164–167, 2003.
11. Janez Demsar. Statistical comparisons of classifiers over multiple data sets. J. Mach. Learn.Res., 7:1–30, December 2006.
12. Thomas G. Dietterich. Ensemble methods in machine learning. In Proceedings of the FirstInternational Workshop on Multiple Classifier Systems, MCS ’00, pages 1–15, London, UK,2000. Springer-Verlag.
13. Oren Etzioni, Michael Cafarella, Doug Downey, Ana-Maria Popescu, Tal Shaked, StephenSoderland, Daniel S. Weld, and Alexander Yates. Unsupervised named-entity extractionfrom the web: an experimental study. Artif. Intell., 165:91–134, June 2005.
14. Jenny Rose Finkel, Trond Grenager, and Christopher Manning. Incorporating non-local in-formation into information extraction systems by gibbs sampling. In ACL, pages 363–370,2005.
15. Nuno Freire, Jose Borbinha, and Pavel Calado. An approach for named entity recognitionin poorly structured data. In Elena Simperl, Philipp Cimiano, Axel Polleres, Oscar Corcho,and Valentina Presutti, editors, The Semantic Web: Research and Applications, volume 7295of Lecture Notes in Computer Science, pages 718–732. Springer Berlin Heidelberg, 2012.
16. Yoav Freund and Robert E. Schapire. Experiments with a New Boosting Algorithm. InInternational Conference on Machine Learning, pages 148–156, 1996.
17. J. Friedman, T. Hastie, and R. Tibshirani. Additive logistic regression: a statistical view ofboosting. Technical report, Stanford University, 1998.
18. Joao Gama. Functional trees. 55(3):219–250, 2004.19. Aldo Gangemi. A comparison of knowledge extraction tools for the semantic web. In Philipp
Cimiano, Oscar Corcho, Valentina Presutti, Laura Hollink, and Sebastian Rudolph, editors,ESWC, volume 7882 of Lecture Notes in Computer Science, pages 351–366. Springer, 2013.
20. Sherzod Hakimov, Salih Atilay Oto, and Erdogan Dogdu. Named entity recognition anddisambiguation using linked data and graph-based centrality scoring. In Proceedings of the4th International Workshop on Semantic Web Information Management, SWIM ’12, pages4:1–4:7, New York, NY, USA, 2012. ACM.
21. Mark Hall, Eibe Frank, Geoffrey Holmes, Bernhard Pfahringer, Peter Reutemann, and Ian H.Witten. The weka data mining software: An update. SIGKDD Explor. Newsl., 11(1):10–18,November 2009.
22. Trevor Hastie and Robert Tibshirani. Classification by pairwise coupling. In Michael I.Jordan, Michael J. Kearns, and Sara A. Solla, editors, Advances in Neural Information Pro-cessing Systems, volume 10. MIT Press, 1998.
23. George H. John and Pat Langley. Estimating continuous distributions in bayesian classifiers.In Eleventh Conference on Uncertainty in Artificial Intelligence, pages 338–345, San Mateo,1995. Morgan Kaufmann.
24. Ali Khalili and Soren Auer. Rdface: The rdfa content editor. ISWC 2011 demo track, 2011.25. J. Kittler, M. Hatef, R. P W Duin, and J. Matas. On combining classifiers. Pattern Analysis
and Machine Intelligence, IEEE Transactions on, 20(3):226–239, Mar 1998.26. Ron Kohavi. The power of decision tables. In 8th European Conference on Machine Learn-
ing, pages 174–189. Springer, 1995.27. Niels Landwehr, Mark Hall, and Eibe Frank. Logistic model trees. Machine Learning,
95(1-2):161–205, 2005.28. S. le Cessie and J.C. van Houwelingen. Ridge estimators in logistic regression. Applied
Statistics, 41(1):191–201, 1992.29. B. W. Matthews. Comparison of the predicted and observed secondary structure of T4 phage
30. David Nadeau. Balie—baseline information extraction: Multilingual information extractionfrom text with machine learning and natural language techniques. Technical report, Technicalreport, University of Ottawa, 2005.
31. David Nadeau. Semi-supervised Named Entity Recognition: Learning to Recognize 100Entity Types with Little Supervision. PhD thesis, Ottawa, Ont., Canada, Canada, 2007.AAINR49385.
32. David Nadeau and Satoshi Sekine. A survey of named entity recognition and classifica-tion. Linguisticae Investigationes, 30(1):3–26, January 2007. Publisher: John BenjaminsPublishing Company.
33. David Nadeau, Peter Turney, and Stan Matwin. Unsupervised named-entity recognition:Generating gazetteers and resolving ambiguity. pages 266–277, 2006.
34. Axel-Cyrille Ngonga Ngomo, Norman Heino, Klaus Lyko, Rene Speck, and MartinKaltenbock. SCMS - Semantifying Content Management Systems. In Proceedings of theInternational Semantic Web Conference, 2011.
35. Marius Pasca, Dekang Lin, Jeffrey Bigham, Andrei Lifchits, and Alpa Jain. Organizing andsearching the world wide web of facts - step one: the one-million fact extraction challenge.In proceedings of the 21st national conference on Artificial intelligence - Volume 2, pages1400–1405. AAAI Press, 2006.
36. J. Ross Quinlan. C4.5: Programs for Machine Learning. Morgan Kaufmann Publishers Inc.,San Francisco, CA, USA, 1993.
37. Lev Ratinov and Dan Roth. Design challenges and misconceptions in named entity recog-nition. In Proceedings of the Thirteenth Conference on Computational Natural LanguageLearning, CoNLL ’09, pages 147–155, Stroudsburg, PA, USA, 2009. Association for Com-putational Linguistics.
38. Michael Roder, Ricardo Usbeck, Sebastian Hellmann, Daniel Gerber, and andreas Both. N3
- A Collection of Datasets for Named Entity Recognition and Disambiguation in the NLPInterchange Format. In Proceedings of LREC’14, 2014.
39. G. Sampson. How fully does a machine-usable dictionary cover english text. Literary andLinguistic Computing, 4(1), 1989.
40. Robert E. Schapire. The strength of weak learnability. Mach. Learn., 5:197–227, July 1990.41. Marc Sumner, Eibe Frank, and Mark Hall. Speeding up logistic model tree induction. In
9th European Conference on Principles and Practice of Knowledge Discovery in Databases,pages 675–683. Springer, 2005.
42. Christine Thielen. An approach to proper name tagging for german. In In Proceedings of theEACL-95 SIGDAT Workshop, 1995.
43. D. Walker and R. Amsler. The use of machine-readable dictionaries in sublanguage analysis.Analysing Language in Restricted Domains, 1986.
44. Dekai Wu, Grace Ngai, and Marine Carpuat. A stacked, voted, stacked model for namedentity recognition. In Proceedings of the Seventh Conference on Natural Language Learningat HLT-NAACL 2003 - Volume 4, CONLL ’03, pages 200–203, Stroudsburg, PA, USA, 2003.Association for Computational Linguistics.
45. Pengyi Yang, Yee Hwa Yang, Bing B. Zhou, and Albert Y. Zomaya. A review of ensemblemethods in bioinformatics. Current Bioinformatics, 5(4):296–308, 2010.
46. GuoDong Zhou and Jian Su. Named entity recognition using an hmm-based chunk tagger.In Proceedings of ACL, pages 473–480, 2002.