42
Ensuring Sustainability in Sri Lanka’s Growing Hotel Industry 2013
Ensuring Sustainability in Sri Lanka’s Growing Hotel Industry
2013

IFC Disclaimer
“This publication may contain advice, opinions, and
statements of various information providers and
content providers. IFC does not represent or endorse
the accuracy or reliability of any advice, opinion,
statement or other information provided by any
information provider or content provider, or any
user of this publication or other person or entity.”
Prepared on behalf of
IFC - World Bank Group
by PricewaterhouseCoopers (Private) Limited, Sri Lanka and PricewaterhouseCoopers (Private) Limited, India

Table of Contents
The Sri Lankan Hotel Industry - An Overview1.1. Tourism in Sri Lanka’s Economy
1.2. Classification of Tourist Accommodation
1.3. Tourist Hotels
05
06
07
05
01
10
Sri Lanka’s Highly Diverse Hotel Industry2.1. Boutique Villas and Hotels
2.2. Guesthouses
2.3. Tourist Hotels
2.4. Home Stay Units / Bungalows /
Rented Homes and Apartments
12
12
13
14
02
Resource Utilization in Sri Lankan Hotels5.1. Energy and Water Consumption
5.2. Waste Generation and Management
5.3. Resource Efficiency Potential
5.4. Resource Efficiency Measures Taken by a
Few Sri Lankan Hotels
5.5. Energy Consumption Details of the Sri
Lanka National Energy Efficiency Award
(SLNEEA) Winning Hotels
28
30
31
32
35
27
05
37
Resource Utilization Benchmarking – World Over
06
38
How to Ensure Sustainability in Sri Lankan Hotels
07
15
Over 100 New Hotels Under Construction3.1. Boutique Villas and Hotels -
Under Construction
3.2. Guesthouses - Under Construction
3.3. Tourist Hotels - Under Construction
3.4. Resorts - Under-construction
16
17
17
18
03
19
Resource Utilization in Sri Lanka - An Overview4.1. Power and Energy Sector
4.2. Power Sector
4.3. Water Sector
4.4. Solid Waste Generation
19
21
24
25
04

Figure 1: Distribution of rooms according to star category
Figure 2: Monthly average occupancy rate of tourist hotels in 2011 and 2012
Figure 3: Monthly average occupancy rate of tourist hotels in 2011 (Three star to five star)
Figure 4: Monthly average occupancy rate of tourist hotels in 2012 (Three star to five star)
Figure 5: Location of Boutique Hotels and Villas by district
Figure 6: Location of Guesthouses in districts by grade
Figure 7: Location of Tourist Hotels (One star to five star) by district
Figure 8: Location of Tourist Hotels by district
Figure 9: Home Stay units/Bungalows/Rented Homes and Apartments by district
Figure 10: Boutique Hotels under construction by district
Figure 11: Guesthouses under construction by district
Figure 12: Under construction Tourist Hotels (One star to five star) by district
Figure 13: Different sources of energy supply in 2010 (Thousand tonne oil equivalent)
Figure 14: Energy consumption according to sector in 2010 (Thousand tonne oil equivalent)
Figure 15: Industry sector (Thousand tonne oil equivalent)
Figure 16: Household, commercial and other sector (Thousand tonne oil equivalent)
Figure 17: CEB’s electricity sales in 2011 according to type of consumer (Giga watt hour)
Figure 18: LECO’s electricity sales in 2011 according to type of consumer (Giga watt hour)
Figure 19: Total electricity sales by CEB and LECO in 2011 according to type of consumer (Giga watt hour)
Figure 20: Electricity sales to the hotel industry according to consumption in 2011 (in Giga watt hour)
Figure 21: Quantity of water sold by NWSDB in 2009 according to type of consumer
Figure 22: MSW collection according to province (Metric tonnes a day)
Figure 23: Typical energy consumption in tourist hotels
Figure 24: Typical water usage in tourist hotels
Figure 25: A typical hotel's solid waste generation
Figure 26: Energy consumption details (2011) of Sri Lanka National Energy Efficiency Award award winning hotels
Figure 27: Tourist Arrivals and Accommodation Details- 2002 to 2016
7
8
9
9
12
12
13
13
14
16
17
17
19
20
20
20
21
22
22
23
24
25
28
29
31
36
38
5
11
15
16
18
26
27
35
37
List of Figures
List of Tables
Table 1: Growth trends in tourism sector over the last 10 years
Table 2: List of tourist accommodations (existing) in each district
Table 3: Tourist accommodations under construction in each district
Table 4: Expected addition in room capacity under each category
Table 5: Expected addition to room capacity in tourist hotels (One star to five star)
Table 6: Sector specific quantity and type of solid waste
Table 7: Resource utilization in the Sri Lankan hotel industry.
Table 8: Sri Lanka National Energy Efficiency Award winner hotels in 2010, 2011 and 2012
Table 9: Resource utilization benchmarking details of hotels in various countries

AIHE
BOD
CBSL
CEB
COD
EEPEX
ESCOs
ETP
EU
GDP
GWh
HACCP
IFC
kWh
LECO
MSW
NWSDB
PADGO
SLNEEA
SLTDA
SLSEA
STP
T.D.
TSS
WTO
Australian Institute of Hotel Engineering
Biological Oxygen Demand
Central Bank of Sri Lanka
Ceylon Electricity Board
Chemical Oxygen Demand
Enhancing Environmental Performance in Key Sri Lankan Export Sector
Energy Service Companies
Effluent Treatment Plants
European Union
Gross Domestic Product
Giga Watt Hour
Hazard Analysis Critical Control Point
International Finance Corporation
Kilo Watt Hour
Lanka Electricity Company Private Limited
Municipal Solid Waste
National Water Supply and Drainage Board
Portfolio Approach to distributed Generation Opportunities
Sri Lanka National Energy Efficiency Awards
Sri Lanka Tourism Development Authority
Sri Lanka Sustainable Energy Authority
Sewage Treatment Plant
Time of Day
Total Suspended Solids
World Tourism Organization
List of Abbreviations

Sri Lanka’s hotel industry is a key driver of economic growth
in the island nation. Tourist arrivals have almost doubled
since the end of the conflict in 2009. The government of Sri
Lanka is implementing a tourism master plan that envisages
the arrival of 2.5 million tourists by 2016.
This will place a huge strain on resources, especially energy
and water, and will create immense challenges in the efficient
use of these resources as well as disposal of solid and water
waste.
Given this situation, Sri Lanka’s hotel industry needs to
implement immediate measures that will use resources and
recycle waste with greater efficiency.
This paper, commissioned by IFC, lists a number of ways in
which some hotels are already engaged in this. Most hotels
can easily adopt these best practices. At the same time,
authorities have already sanctioned over a hundred hotels that
are currently under construction in various parts of the
country. These new hotels, which plan to open for business in
the next two years, will have to adopt resource efficient
measures from the outset.
As the hotel industry continues to grow rapidly, authorities
need to encourage sustainability practices by recognizing and
promoting hotels that implement energy saving and recycling
measures in their operations. Experience shows that
sustainability translates into profitability. Best practices are
often subsequently rewarded.
With this growth, it becomes important that Sri Lanka's
pristine environment does not suffer. Through joint efforts
from the government and industry, this growth can be
planned and systematic to achieve sustainability. This will
result in a reduction in the emissions of millions of tons of
greenhouse gases into the atmosphere, which can have
irreversible effects on Sri Lanka’s fragile ecology.
Summary

1.1. Tourism in Sri Lanka’s Economy
YearTotal Tourists Arrived
(No.)
Establishments Providing Accommodation
(No.)
Annual Room Occupancy Rate
(Percentage)Gross Tourist Receipts
(million USD)
Table 1Growth trends in tourism sector over the last 10 years
SourceSri Lanka Tourism Development Authority and Central Bank of Sri Lanka
Sri Lanka has witnessed unprecedented economic growth since the end of its
three-decade long civil conflict in May 2009. The tourism sector has emerged as a
frontrunner in Sri Lanka’s economic activities. According to Central Bank of Sri
Lanka (CBSL), the hotel industry contributed around two percent to the country’s
gross domestic product (GDP) in 2011. Sri Lanka is on its way to becoming a major
tourism destination in South Asia. Table 1 shows the huge growth of the tourism
industry, which has nearly doubled in the last three years.
01
2002
2003
2004
2005
2006
2007
2008
2009
2010
2011
393,174
500,642
566,202
549,308
559,603
494,008
438,475
447,890
654,476
855,975
455
498
585
626
749
758
834
871
783
906
43.1
53.2
59.3
45.4
47.8
46.2
43.9
48.4
70.2
77.1
363
441
513
429
410
385
342
350
575
830
Page 05
The Sri Lankan Hotel IndustryAn Overview

1.2. Classification of Tourist Accommodation
Sri Lanka Tourism Development Authority (SLTDA) classifies the tourist accommodation sector into four different categories:
Boutique Villas and Hotels
Boutique hotel is a popular term to describe sometimes luxurious or unique and unusual hotel environments. Boutique hotels differentiate
themselves from larger chain/branded hotels and motels by providing personalized accommodation and services/facilities. There are no
standard classification criteria for boutique villas and hotels.
Boutique hotels are standalone and unlikely to be part of large hotel chains. They focus on tranquillity and comfort rather than gadgetry.
A 24-hour hotel staff often attends to guest services. Many boutique hotels have on-site dining facilities and offer bars and lounges, which
may also be open to the public. The concept of boutique or designer hotels is becoming increasingly popular in Sri Lanka.
Guesthouses
A guesthouse is similar to a hotel or bed and breakfast facility. A guesthouse in Sri Lanka is normally an accommodation unit with five or
more bedrooms.
Home Stay Units/Bungalows/Rented Homes and Apartments
The main aim of these facilities is to provide clean, comfortable and affordable supplementary accommodation to tourists. Tourists in
return will experience local customs and traditions, authentic cuisine, and other attractions of the location while staying with local hosts.
Tourist Hotels
Tourist hotels provide paid lodging, usually on a short-term basis. Facilities provided include attached bathrooms, air conditioning or
climate control, telephones, alarm clocks, television, and internet connectivity. Snacks and drinks may be available in a mini-bar and
facilities for making hot drinks are usually provided. Larger hotels may provide additional guest facilities such as restaurants, swimming
pools, childcare, and have conference and social function services.
Our study focuses on tourist hotels, segmented under standard star category classification.
The Sri Lankan Hotel IndustryAn Overview 01
Boutique Villas and Hotels
GuesthousesHome Stay
Units Tourist Hotels
Page 06

1.3. Tourist Hotels
Distribution of rooms as per star category (percentage)
3,230
1,784
1,178
2,022
1,171
5,268
According to Sri Lanka Tourism Development Authority (SLTDA) Statistical Report of 2011, 906 lodging establishments with 20,794
rooms were registered with it at that time. These establishments were dominated by tourist hotels, which accounted for 70.5 percent (or
14,653) of total room capacity. SLTDA defines tourist hotels as establishments whose operations are considered to be of international
standards.
The majority of these rooms are concentrated in the Colombo and greater Colombo area. SLTDA’s grading is based on criteria set by
World Tourism Organization (WTO). The government of Sri Lanka classifies tourist hotels in five different star categories, ranging from
one to five stars. Currently, the country has a high concentration of five-star rated establishments, followed by the budget two-star
category. A large number of hotel rooms in the country continue to be unclassified, with no star rating. These are mostly independently
owned properties with smaller room inventories that offer less expensive but non-standard product options to tourists. Unclassified
properties cater to demand that cannot be met by branded establishments, either due to high room rent or because they are sold out. They
will continue to form an important part of the hotel industry in Sri Lanka.
Figure 1Distribution of rooms according to star category
SourceSLTDA Statistical Report 2011
Five star
Four star
Three star
Two star
One star
Unclassified
22.04
35.95
12.17
8.04
13.80
7.99
Page 07
The Sri Lankan Hotel IndustryAn Overview 01

Figure 2 shows the occupancy rates of tourist hotels by month during 2011 and 2012. Occupancy rates from October to December 2012
are not yet available.
Page 08
Figure 2Monthly average occupancy rate of tourist hotels in 2011 and 2012
SourceSLTDA Monthly Statistical Bulletin * Data not available
* * *
Monthly average occupancy rate of tourist hotels in 2011 and 2012
2011 2012
100%
90%
80%
70%
60%
50%
40%
30%
20%
10%
0%Jan Feb Mar Apr May Jun Jul Aug Sep Oct Nov Dec
84.4 85.9
74.9
81.2 85
.1 87.4
73.5
53.5
62.2
44.6
57.3
47.4
78.1
77.1
72.6
72.1
70.6 72
.5
80.8
90.3 95
.0
The Sri Lankan Hotel IndustryAn Overview 01

Figure 3 and Figure 4 show monthly occupancy rates of three star to five star tourist hotels during 2011 and 2012. In Figure 4,
occupancy rates from November to December 2012 are not yet available.
Figure 3Monthly average occupancy rate of tourist hotels in 2011 (Three star to five star)
SourceSLTDA Monthly Statistical Bulletin
Monthly average occupancy rate of tourist hotels in 2011 (Three star to five star) 100%
90%
80%
70%
60%
50%
40%
30%
20%
10%
0%Jan Feb Mar Apr May Jun Jul Aug Sep Oct Nov
86.9
85.8
79.9
77.0
75.9
70.8
85.2
84.1
80.8
76.3
74.5
69.6
65.2
61.4
57.6
55.5
54.7 58
.6
78.2
79.3
78.2
74.3
71.7
69.6
83.5 86
.379
.5
90.2 91.7
88.8
76.3
75.6
67.9
Figure 4Monthly average occupancy rate of tourist hotels in 2012 (Three star to five star)
SourceSLTDA Monthly Statistical Bulletin
Monthly average occupancy rate of tourist hotels in 2012 (Three star to five star)
Five star Four star
100%
90%
80%
70%
60%
50%
40%
30%
20%
10%
0%Jan Feb Mar Apr May Jun Jul Aug Sep Oct
Three star
88.2
87.3
81.1 84
.180
.178
.2
88.9
86.2
83.3
51.1
58.4
52.9
46.2 48
.343
.8
49.3
47.6
44.4
77.4
76.2
75.4
74.9
70.3 71
.8
71.5 72.3
74.7
73.2
71.9
70.4
Page 09
Five star Four star Three star
The Sri Lankan Hotel IndustryAn Overview 01

Sri Lanka’s Highly Diverse Hotel Industry
The Sri Lankan hotel industry is concentrated around Colombo, the economic and
financial hub as well as the gateway to the rest of the country. The southern region
comes second as hotel owners take advantage of Sri Lanka’s beach attractions,
followed by ancient cities. The newly liberated eastern and northern regions have the
potential to grow and contribute more to this industry. The industry primarily
consists of tourist hotels and other establishments that include boutique villas/hotels,
guesthouses, inns and youth hostels approved by SLTDA.
Table 2 has mapped all types of existing tourist accommodation by districts.
02
Page 10

District Name
Total Units
Boutique Hotels/Villas
Bou
tique
Vill
as
S.N
O.
Bou
tique
Hot
els
A G
rade
B G
rade
C G
rade
Unc
lassi
fied
Hom
e St
ay U
nits
Bun
galo
ws
Ren
ted
Hom
es
and
Apa
rtm
ents
Guesthouses Tourist HotelsHome Stay Units / Bungalows / Rented
Homes and Apartments
Table 2List of tourist accommodation (existing) in each district
SourceSLTDA
Ampara
Anuradhapura
Badulla
Batticaloa
Colombo
Dambulla
Galle
Gampaha
Hambantota
Jaffna
Kalutara
Kandy
Kegalle
Kurunegala
Matale
Matara
Monaragala
Negombo
Nuwaraeliya
Polonnaruwa
Puttalam
Ratnapura
Trincomalee
Vanniya
0
0
0
0
1
0
11
2
2
0
2
3
0
0
1
0
0
0
4
0
1
0
0
0
1
2
3
4
5
6
7
8
9
10
11
12
13
14
15
16
17
18
19
20
21
22
23
24
0
1
0
1
3
0
10
0
0
0
1
1
0
1
2
1
0
1
0
0
0
1
0
0
0
5
11
1
25
0
23
27
5
2
22
25
9
9
10
13
5
0
11
6
7
7
3
2
2
6
17
5
39
0
28
32
10
3
22
14
8
21
8
12
6
0
5
6
4
6
5
0
0
1
0
1
0
0
3
3
1
0
2
0
0
0
0
1
0
0
0
1
0
0
1
0
0
0
0
0
6
0
2
0
0
0
2
2
0
0
1
0
0
0
0
1
0
0
0
0
0
0
0
0
3
0
1
1
0
0
1
1
0
0
2
0
1
0
2
1
1
0
1
0
0
1
0
0
3
0
0
2
1
0
1
2
0
0
1
0
0
0
2
1
1
0
0
0
0
1
0
0
2
0
7
5
2
0
4
5
0
1
2
1
0
0
0
1
1
1
2
0
0
2
0
0
9
0
4
4
2
0
1
3
0
1
1
1
1
0
4
1
0
1
0
0
2
3
7
0
9
0
28
21
8
0
15
13
1
0
6
5
1
0
4
4
4
0
4
0
0
0
1
0
15
1
3
8
0
0
1
5
0
0
1
1
0
0
5
0
0
0
0
0
0
0
4
0
10
0
1
0
0
0
1
4
0
0
1
0
0
0
2
0
0
1
0
0
0
0
0
0
1
0
0
1
0
0
0
0
0
0
0
0
0
0
0
0
0
0
0
0
27 23 228 259 14 14 15 15 35 35 135 41 24 2
Sri Lanka’s Highly Diverse Hotel Industry02
Page 11

2.1. Boutique Villas and Hotels
Boutique villas and hotels are spread across various districts of Sri Lanka. SLTDA has, to date, approved 27 boutique villas and 23
boutique hotels. Most villas and hotels are concentrated in Kandy and the coastal districts of Galle and Colombo.
Page 12
Figure 5Location of Boutique Hotels and Villas by district
SourceSLTDA
Location of Boutique Hotels and Villas by district
Boutique Villas Boutique Hotels
1
2 1
5 6 5 5 56 6 7 74
6 6
1 1 1 1 1 1
53 3 2 2 2
3 35
2522 22 21
1013 12
25
9 98 8
14
39
23
28 27
32
1011 11
17
1 1
3
1110
2 2 21
34
12
11 1 1 1 1
Anu
radh
apur
a
Bat
tical
oa
Col
ombo
Gal
le
Gam
paha
Ham
bant
ota
Kal
utar
a
Kan
dy
Kur
uneg
ala
Mat
ale
Mat
ara
Neg
ombo
Nuw
arae
liya
Putta
lam
Rat
napu
ra
2.2. Guesthouses
A guesthouse in Sri Lanka is an accommodation unit with five or more bedrooms. These guesthouses are located across many districts.
Based on facilities available, SLTDA has graded them into A, B, and C categories1. Of the 501 guesthouses approved by SLTDA, 228 are
A grade, 259 B grade, and 14 C grade.
Figure 6Location of guesthouses in districts by grade
SourceSLTDA
Location of Guesthouses in districts by grade
B Grade C GradeA Grade
Am
para
Anu
radh
apur
a
Bad
ulla
Bat
tical
oa
Col
ombo
Gal
le
Gam
paha
Ham
bant
ota
Jaffn
a
Kal
utar
a
Kan
dy
Keg
alle
Kur
uneg
ala
Mat
ale
Mat
ara
Mon
arag
ala
Nuw
arae
liya
Polo
nnar
uwa
Putta
lam
Rat
napu
ra
Tri
ncom
alee
Van
niya
Sri Lanka’s Highly Diverse Hotel Industry02
1 The grading is based on the how much the guesthouses comply with conditions defined by the the Tourism Development Act, No. 14 of 1968, which says: "To qualify for ‘A, B or C’ grade, a Tourist Guesthouse shall obtain minimum points allotted to essential items as 90 percent, 70 percent and 60 percent respectively and obtain total marks as 80 percent, 60 percent and 50 percent respectively from the criteria."

2.3. Tourist Hotels
Tourist hotels dominate tourist accommodation in Sri Lanka. The 248 tourist hotels approved by SLTDA have been categorized into two
major types: classified and unclassified. Classified hotels are further categorized from one to five stars based on criteria specified by World
Tourism Organization (WTO). A large number of tourist hotels continue to be unclassified, as they do not meet these criteria. Unclassi-
fied properties cater to demand that cannot be accommodated by branded establishments due to high rentals or non-availability. They
form an important part of the hotel industry in the country.
According to the SLTDA Statistical Report 2011, tourist hotels accounted for 70.46 percent of the industry’s total room capacity for that
year. Of the 249 tourist hotels, 114 hotels were classified and 135 unclassified. In the classified category, 14 were five star hotels mainly
concentrated in Colombo and greater Colombo regions. Of the remaining, 15 were four star, 15 three star, 35 two star, and 35 one star
hotels. These were spread across the country, but concentrated in Galle, Colombo, Kalutara, and Kandy districts.
Figure 7Location of Tourist Hotels (One star to five star) by district
SourceSLTDA
Location of Tourist Hotels (One star to five star) by district
2 23 33
65 5
7
4 4 4 4
9
1 12 2 2 2 2 2 2 2 2 2 2 2
1 1 1 1 1 1 1 1 1 1 1 1 1 1 1 1 1 1 1 1 1 11 11 1 1
Four star Five star
Anu
radh
apur
a
Col
ombo
Gal
le
Gam
paha
Ham
bant
ota
Kal
utar
a
Kan
dy
Kur
uneg
ala
Mat
ale
Mat
ara
Mon
orag
ala
Nuw
arae
liya
Polo
nnar
uwa
Putta
lam
Rat
napu
ra
Tri
ncom
alee
Figure 8Location of Tourist Hotels by district
SourceSLTDA
Location of Tourist Hotels by district
1 1 23 4 4 4 4 5 6 7 8 9
1315
21
28
Keg
alle
Mon
arag
ala
Am
para
Anu
radh
apur
a
Nuw
arae
liya
Polo
nnar
uwa
Putta
lam
Tri
ncom
alee
Mat
ara
Mat
ale
Bad
ulla
Ham
bant
ota
Col
ombo
Kan
dy
Kal
utar
a
Gam
paha
Gal
le
Page 13
One star Two star Three star
Sri Lanka’s Highly Diverse Hotel Industry02
1 1 1 1 1 11 1 1 11
3
4 4
55
2
8
10
15
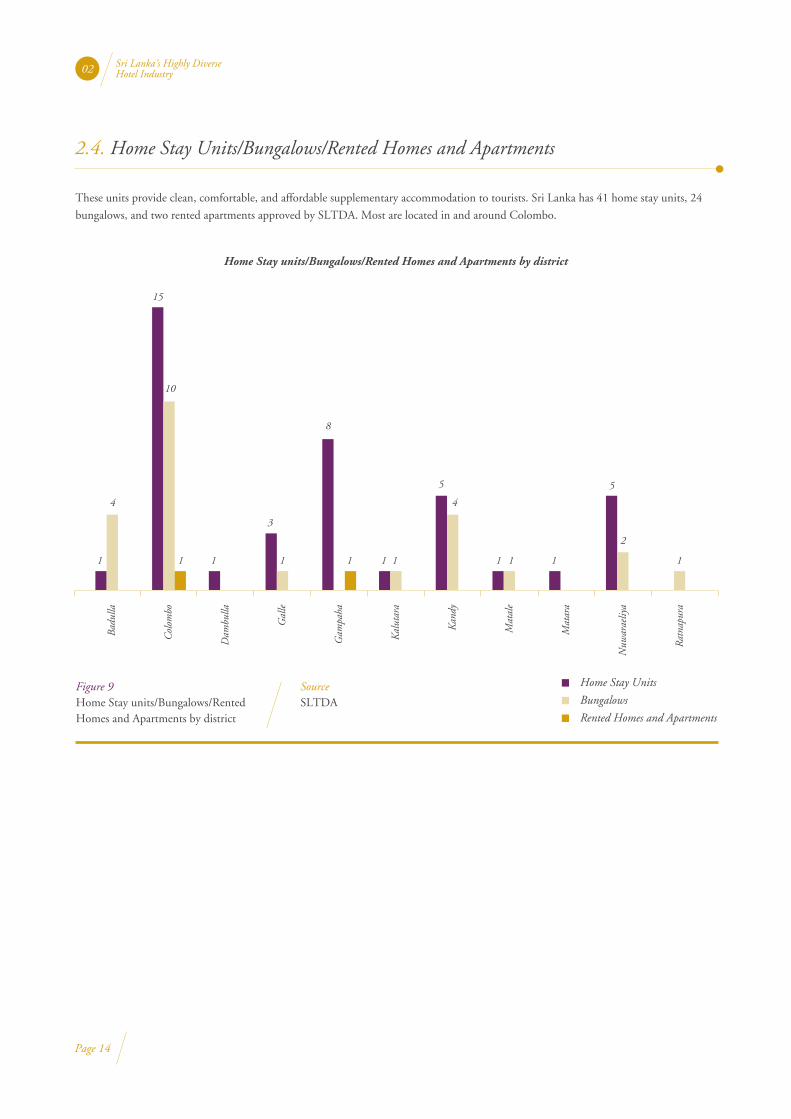
2.4. Home Stay Units/Bungalows/Rented Homes and Apartments
These units provide clean, comfortable, and affordable supplementary accommodation to tourists. Sri Lanka has 41 home stay units, 24
bungalows, and two rented apartments approved by SLTDA. Most are located in and around Colombo.
Page 14
Figure 9Home Stay units/Bungalows/Rented Homes and Apartments by district
SourceSLTDA
Home Stay Units
Bungalows
Rented Homes and Apartments
Home Stay units/Bungalows/Rented Homes and Apartments by district
Bad
ulla
Col
ombo
Dam
bulla
Gal
le
Gam
paha
Kal
utar
a
Kan
dy
Mat
ale
Mat
ara
Nuw
arae
liya
Rat
napu
ra
Sri Lanka’s Highly Diverse Hotel Industry02

Over 100 new hotels under construction
Tourist accommodation currently under construction are located mainly in Galle,
Colombo, Batticaloa, and Kalutara districts. According to SLTDA, 104 tourist hotels
are under construction in 15 districts. Of these, 68 are tourist hotels, 15 boutique
villas and hotels, 13 guesthouses, and eight resorts.
SLTDA granted approvals to these projects from September 2010 to October 2012.
Table 3 lists tourist accommodation (all types) under construction in each district.
03
District
Total Units
Boutique Hotels/Villas
S.N
O.
Guesthouses Tourist Hotels Resorts District Wise Total
Table 3Tourist accommodation under construction in each district
SourceSLTDA
Anuradapura
Badulla
Batticaloa
Colombo
Galle
Gampaha
Hambantota
Jaffna
Kalutara
Kandy
Matale
Matara
Nuwara Eliya
Puttalam
Trincomalee
0
0
2
1
4
2
1
0
0
0
0
2
0
1
2
1
2
3
4
5
6
7
8
9
10
11
12
13
14
15
0
1
3
0
1
0
1
0
3
0
1
1
0
1
1
0
0
0
2
3
2
0
0
2
1
0
0
0
0
0
0
0
2
2
3
1
1
0
2
0
0
1
0
3
2
0
0
2
7
5
2
1
3
3
1
2
2
1
0
1
0
0
1
3
0
1
2
1
1
1
0
0
0
0
0
0
0
1
0
0
0
0
0
0
0
0
0
0
0
0
1
0
1
0
1
0
0
0
1
0
1
1
0
1
1
1
1
12
15
17
8
6
4
12
3
4
7
1
6
7
15 13 10 17 30 10 1 8 104
Page 15
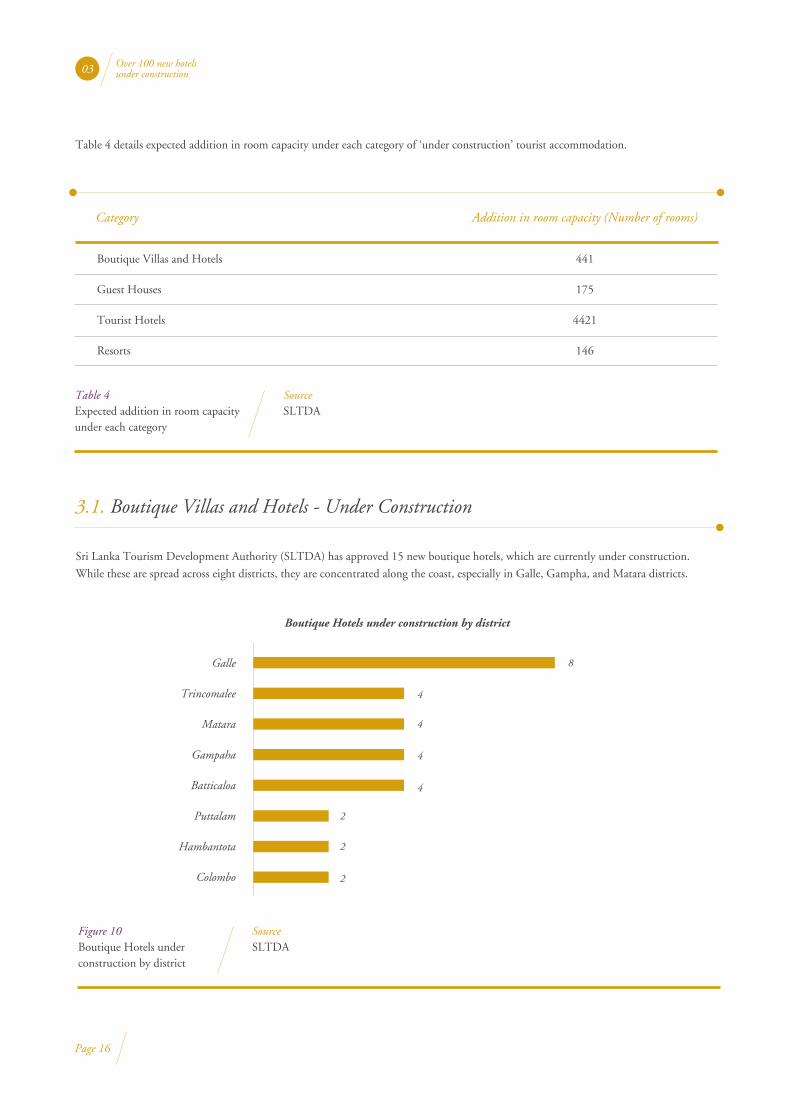
Table 4 details expected addition in room capacity under each category of ‘under construction’ tourist accommodation.
Over 100 new hotels under construction03
Page 16
Table 4Expected addition in room capacity under each category
SourceSLTDA
Category Addition in room capacity (Number of rooms)
Boutique Villas and Hotels
Guest Houses
Tourist Hotels
Resorts
441
175
4421
146
3.1. Boutique Villas and Hotels - Under Construction
Sri Lanka Tourism Development Authority (SLTDA) has approved 15 new boutique hotels, which are currently under construction.
While these are spread across eight districts, they are concentrated along the coast, especially in Galle, Gampha, and Matara districts.
Figure 10Boutique Hotels under construction by district
SourceSLTDA
Boutique Hotels under construction by district
Galle
Trincomalee
Matara
Gampaha
Batticaloa
Puttalam
Hambantota
Colombo
8
4
4
4
4
2
2
2

Over 100 new hotels under construction03
3.2. Guesthouses - Under Construction
A guesthouse is an accommodation unit with five or more bedrooms. SLTDA has approved 13 new guesthouses located across several
districts.
Figure 11Guesthouses under construction by district
SourceSLTDA
Guesthouses under construction by district
Bad
ulla
Gal
le
Ham
bant
ota
Mat
ale
Mat
ara
Putta
lam
Tri
ncom
alee
Bat
tical
oa
Kal
utar
a
1 1 1 1 1 1 1
3 3
3.3. Tourist Hotels - Under Construction
Tourist hotels account for most accommodation projects under construction. SLTDA has approved 68 new tourist hotels of which 10 are
five star hotels, mainly in the Colombo and greater Colombo areas. Of the rest, 30 are four star, 17 three star, 10 two star, and a one star
hotel. These are spread across the country as shown in Figure 12.
Under construction tourist hotels (One star to five star) by district
Figure 12Under construction tourist hotels (One star to five star) by district
SourceSLTDA
2 2 2 22 2 2 2 2 2
7
3 3 3 3 3 3
5
2 2
1 1 1 1 1 1 1 1 11 1 11 1
Bat
tical
oa
Col
ombo
Gal
le
Gam
paha
Ham
bant
ota
Jaffn
a
Kal
utar
a
Kan
dy
Mat
ale
Mat
ara
Nuw
arae
liya
Putta
lam
Tri
ncom
alee
Page 17
Two star One starFive star Four star Three star

Table 5 displays the estimated percentage increase in number of rooms in the one star to five star categories following completion of
under-construction projects.
Over 100 new hotels under construction03
Page 18
Table 5Expected addition to room capacity in tourist hotels (One star to five star )
SourceSLTDA
Category Existing number of
rooms (2011)
3230
1784
1178
2022
1171
Expected addition in number of room
959
1664
1451
325
22
Percentage increase in number of rooms
30
93
123
16
2
3.4. Resorts - Under Construction
SLTDA has approved eight new resorts, one each in eight districts of Sri Lanka – Trincomalee, Puttalam, Matara, Matale, Kalutara, Galle,
Batticaloa and Anuradapura.
Resource Utilization in Sri Lanka An Overview 04
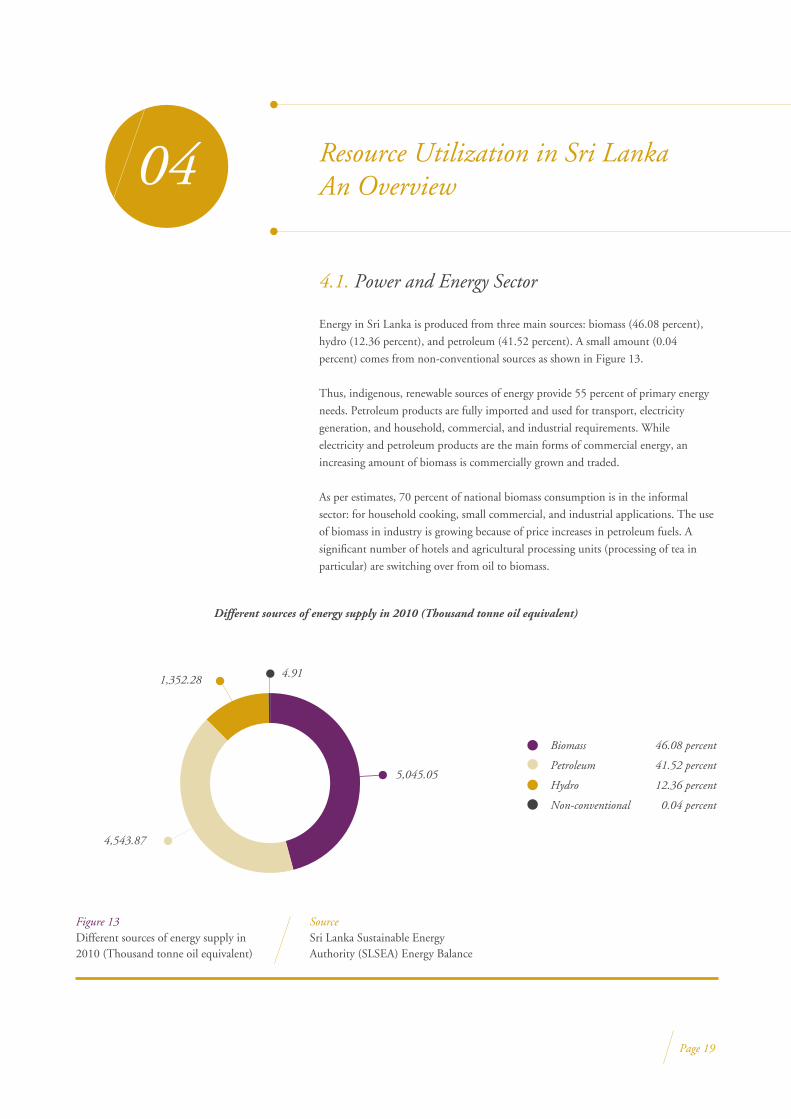
4.1. Power and Energy Sector
Energy in Sri Lanka is produced from three main sources: biomass (46.08 percent),
hydro (12.36 percent), and petroleum (41.52 percent). A small amount (0.04
percent) comes from non-conventional sources as shown in Figure 13.
Thus, indigenous, renewable sources of energy provide 55 percent of primary energy
needs. Petroleum products are fully imported and used for transport, electricity
generation, and household, commercial, and industrial requirements. While
electricity and petroleum products are the main forms of commercial energy, an
increasing amount of biomass is commercially grown and traded.
As per estimates, 70 percent of national biomass consumption is in the informal
sector: for household cooking, small commercial, and industrial applications. The use
of biomass in industry is growing because of price increases in petroleum fuels. A
significant number of hotels and agricultural processing units (processing of tea in
particular) are switching over from oil to biomass.
Different sources of energy supply in 2010 (Thousand tonne oil equivalent)
46.08 percent
41.52 percent
12.36 percent
0.04 percent
Figure 13Different sources of energy supply in 2010 (Thousand tonne oil equivalent)
SourceSri Lanka Sustainable Energy Authority (SLSEA) Energy Balance
Biomass
Petroleum
Hydro
Non-conventional
4.91
5,045.05
4,543.87
1,352.28
Page 19
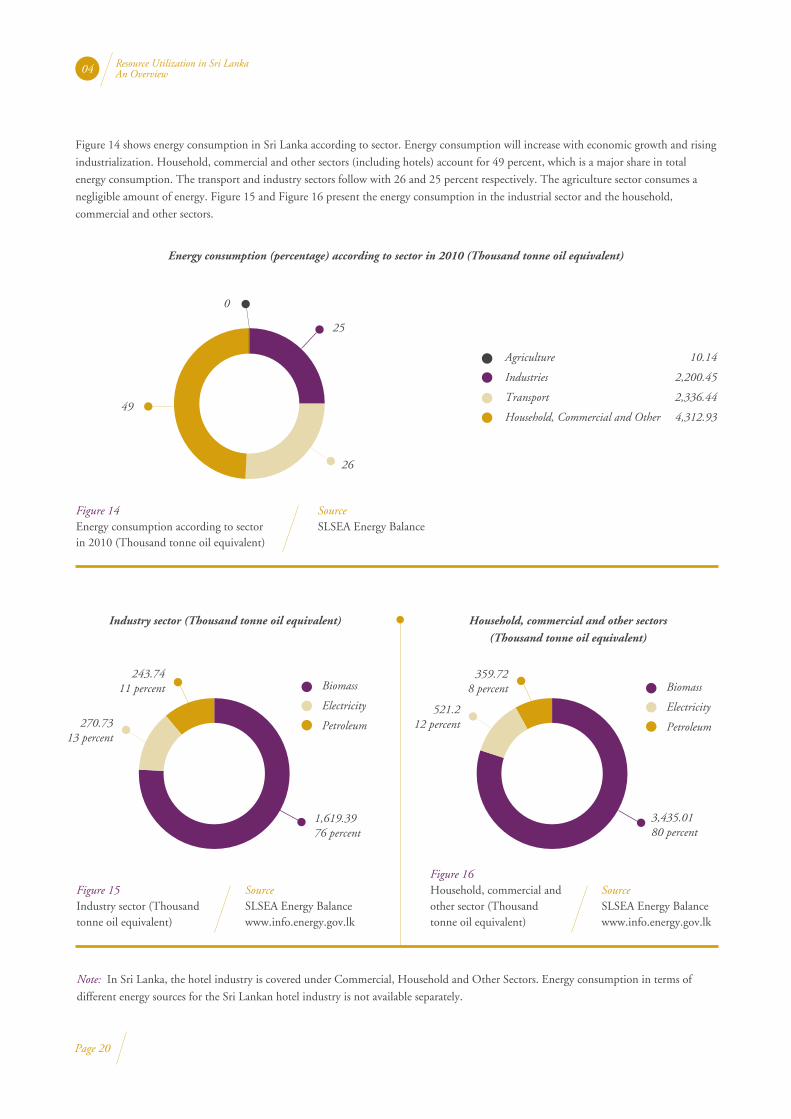
Figure 14 shows energy consumption in Sri Lanka according to sector. Energy consumption will increase with economic growth and rising
industrialization. Household, commercial and other sectors (including hotels) account for 49 percent, which is a major share in total
energy consumption. The transport and industry sectors follow with 26 and 25 percent respectively. The agriculture sector consumes a
negligible amount of energy. Figure 15 and Figure 16 present the energy consumption in the industrial sector and the household,
commercial and other sectors.
Note: In Sri Lanka, the hotel industry is covered under Commercial, Household and Other Sectors. Energy consumption in terms of
different energy sources for the Sri Lankan hotel industry is not available separately.
Resource Utilization in Sri Lanka An Overview 04
Page 20
Energy consumption (percentage) according to sector in 2010 (Thousand tonne oil equivalent)
10.14
2,200.45
2,336.44
4,312.93
Figure 14Energy consumption according to sector in 2010 (Thousand tonne oil equivalent)
SourceSLSEA Energy Balance
Agriculture
Industries
Transport
Household, Commercial and Other
25
0
26
49
Industry sector (Thousand tonne oil equivalent)
Figure 15Industry sector (Thousand tonne oil equivalent)
SourceSLSEA Energy Balance www.info.energy.gov.lk
Biomass
Electricity
Petroleum
1,619.3976 percent
3,435.0180 percent
270.7313 percent
243.7411 percent
Household, commercial and other sectors
(Thousand tonne oil equivalent)
Figure 16Household, commercial and other sector (Thousand tonne oil equivalent)
SourceSLSEA Energy Balance www.info.energy.gov.lk
Biomass
Electricity
Petroleum
521.212 percent
359.728 percent
Page 21
Resource Utilization in Sri Lanka An Overview 04
4.2. Power Sector
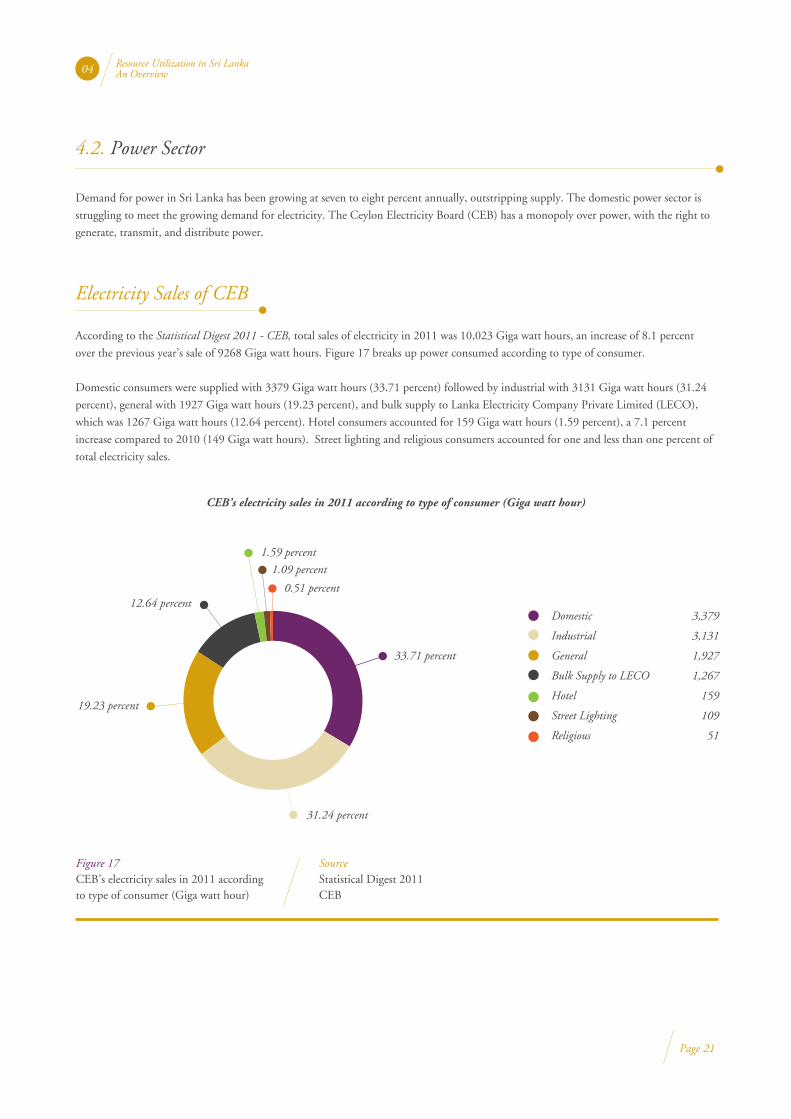
Demand for power in Sri Lanka has been growing at seven to eight percent annually, outstripping supply. The domestic power sector is
struggling to meet the growing demand for electricity. The Ceylon Electricity Board (CEB) has a monopoly over power, with the right to
generate, transmit, and distribute power.
Electricity Sales of CEB
According to the Statistical Digest 2011 - CEB, total sales of electricity in 2011 was 10,023 Giga watt hours, an increase of 8.1 percent
over the previous year’s sale of 9268 Giga watt hours. Figure 17 breaks up power consumed according to type of consumer.
Domestic consumers were supplied with 3379 Giga watt hours (33.71 percent) followed by industrial with 3131 Giga watt hours (31.24
percent), general with 1927 Giga watt hours (19.23 percent), and bulk supply to Lanka Electricity Company Private Limited (LECO),
which was 1267 Giga watt hours (12.64 percent). Hotel consumers accounted for 159 Giga watt hours (1.59 percent), a 7.1 percent
increase compared to 2010 (149 Giga watt hours). Street lighting and religious consumers accounted for one and less than one percent of
total electricity sales.
CEB’s electricity sales in 2011 according to type of consumer (Giga watt hour)
3,379
3,131
1,927
1,267
159
109
51
Figure 17CEB’s electricity sales in 2011 according to type of consumer (Giga watt hour)
SourceStatistical Digest 2011 CEB
Domestic
Industrial
General
Bulk Supply to LECO
Hotel
Street Lighting
Religious
0.51 percent
1.09 percent
1.59 percent
33.71 percent
31.24 percent
12.64 percent
19.23 percent

Resource Utilization in Sri Lanka An Overview 04
LECO’s electricity sales in 2011 according to type of consumer (Giga watt hour)
538
367
241
37
23
8
1
Figure 18LECO’s electricity sales in 2011 according to type of consumer (Giga watt hour)
SourceStatistical Digest 2011 CEB
Domestic
General
Industrial
Hotel
Street Lighting
Religious
Temporary Connections
0.08 percent0.66 percent
1.89 percent
44.28 percent
30.21 percent
3.05 percent
19.84 percent
Page 22
Electricity Sales of LECO
The 1267 Giga watt hours of electricity to LECO was in turn distributed to its customers. LECO’s electricity sales in 2011 according to
type of consumer are provided in Figure 18. Of this, domestic consumers were supplied with 538 Giga watt hours (33.71 percent)
followed by general with 367 Giga watt hours (30.21 percent), hotels with 37 Giga watt hours (3.05 percent), and street lighting with 23
Giga watt hours (1.89 percent). Religious consumers and temporary connections accounted for 0.66 and 0.08 percent of total electricity
sales.
Total electricity sales of CEB and LECO in 2011 is presented in Figure 19. Of total consumption, domestic consumers were supplied
with 3917 Giga watt hours (39.3 percent), followed by industrial 3372 Giga watt hours (33.8 percent), and general 2294 Giga watt hours
(23 percent). Hotel consumers accounted for 196 Giga watt hours of electricity (two percent), while street lighting and religious
consumers accounted for 1.3 percent and 0.6 percent of total electricity sales.
Total electricity sales by CEB and LECO in 2011 according to type of consumer (Giga watt hour)
3,917
3,372
2,294
196
132
59
Figure 19Total electricity sales by CEB and LECO in 2011 according to type of consumer (Giga watt hour)
SourceStatistical Digest 2011 CEB
Domestic
Industrial
General
Hotel
Street Lighting
Religious
0.6 percent
1.3 percent
39.3 percent
33.8 percent
2 percent
23 percent
Resource Utilization in Sri Lanka An Overview 04
Electricity Sales in the Hotel Industry
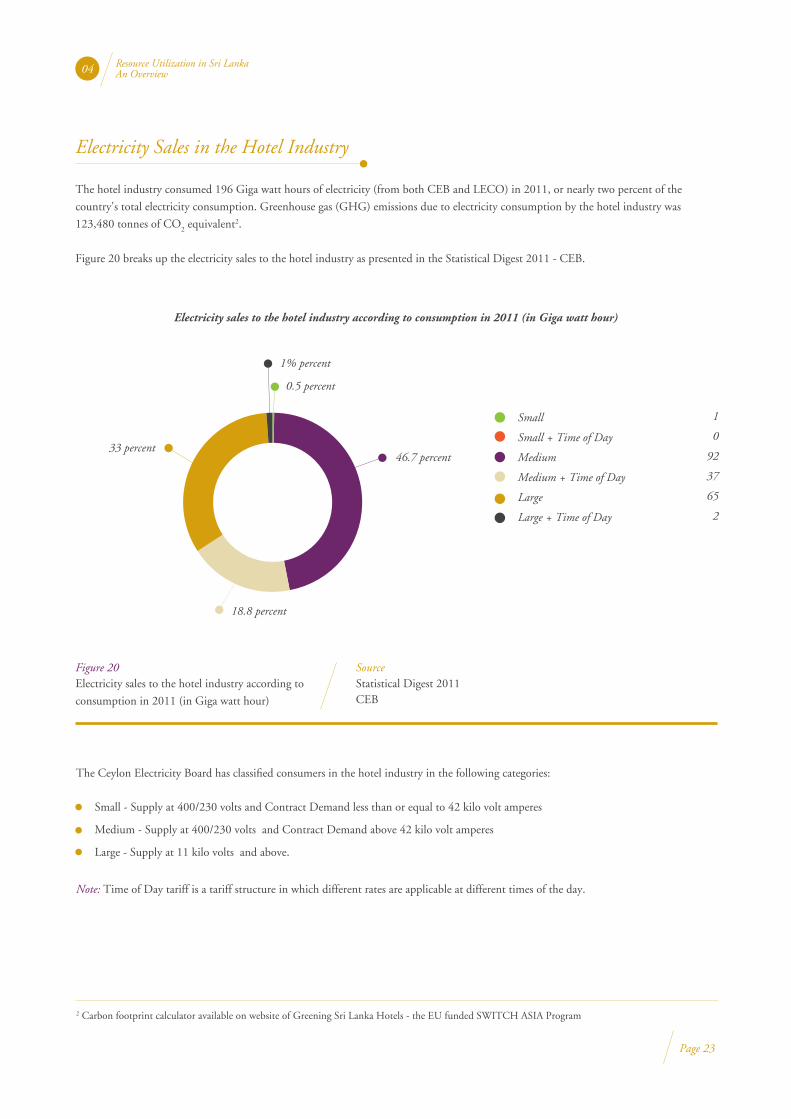
The hotel industry consumed 196 Giga watt hours of electricity (from both CEB and LECO) in 2011, or nearly two percent of the
country's total electricity consumption. Greenhouse gas (GHG) emissions due to electricity consumption by the hotel industry was
123,480 tonnes of CO2 equivalent2.
Figure 20 breaks up the electricity sales to the hotel industry as presented in the Statistical Digest 2011 - CEB.
The Ceylon Electricity Board has classified consumers in the hotel industry in the following categories:
Note: Time of Day tariff is a tariff structure in which different rates are applicable at different times of the day.
Electricity sales to the hotel industry according to consumption in 2011 (in Giga watt hour)
1
0
92
37
65
2
Figure 20Electricity sales to the hotel industry according to
consumption in 2011 (in Giga watt hour)
SourceStatistical Digest 2011CEB
Small
Small + Time of Day
Medium
Medium + Time of Day
Large
Large + Time of Day
1% percent
0.5 percent
46.7 percent
18.8 percent
33 percent
Small - Supply at 400/230 volts and Contract Demand less than or equal to 42 kilo volt amperes
Medium - Supply at 400/230 volts and Contract Demand above 42 kilo volt amperes
Large - Supply at 11 kilo volts and above.
Page 23
2 Carbon footprint calculator available on website of Greening Sri Lanka Hotels - the EU funded SWITCH ASIA Program

Resource Utilization in Sri Lanka An Overview 04
4.3. Water Sector
Sri Lanka is well placed when it comes to water resources. Surface water dominates the water sector, while groundwater use is largely
limited to domestic water supply and small-scale irrigation. However, increase of industrial zones and development of tourist hotels is
leading to unprecedented groundwater extraction in Sri Lanka.
The National Water Supply and Drainage Board (NWSDB), which currently functions under the Ministry of Water Supply and
Drainage, is the principal authority providing safe drinking water and sanitation in Sri Lanka. According to NWSDB’s annual report
2009, direct billing consumers (domestic, NWSDB quarters, and government quarters) accounted for 66 percent of total water sold by it.
This was followed by government institutions (10 percent), commercial and industrial (nine percent), tenement gardens (four percent),
bulk buildings (3 percent), board of investments (two percent), and religious premises (two percent). Schools, public stand posts (public
taps), shipping, and others accounted for only one percent each of total water sold.
Tourist hotels purchased only one percent (1,942,000 cubic meters) of total water sold by NWSDB in 2009. Apart from government
water supply, hotels also sourced water from their own resources like bore wells. In fact, bore wells are major sources of water for most
hotels. Lesser sources are rainwater harvesting and third party vendors. As a major portion of demand is met by unaccounted sources,
accurate information on water consumption by hotels is not available in the public domain.
Sales (percentage)
Figure 21Quantity of water sold by NWSDB in 2009 according to type of consumer
SourceSri Lanka NWSDB Annual Report - 2009
Direct Billing (Domestic, National Water Supply and Drainage Board Quarters, Government Quarters)
Government institutions, National Water Supply and Drainage Board premises
Commercial and Industrial
Tenement Gardens
Bulk Billing
Board of Investments
Religious Premises
Schools
Public Stand - Post Supply
Others
Tourist Hotels
Shipping
Page 24
2
2 11
113
66
10
4
9
Resource Utilization in Sri Lanka An Overview 04
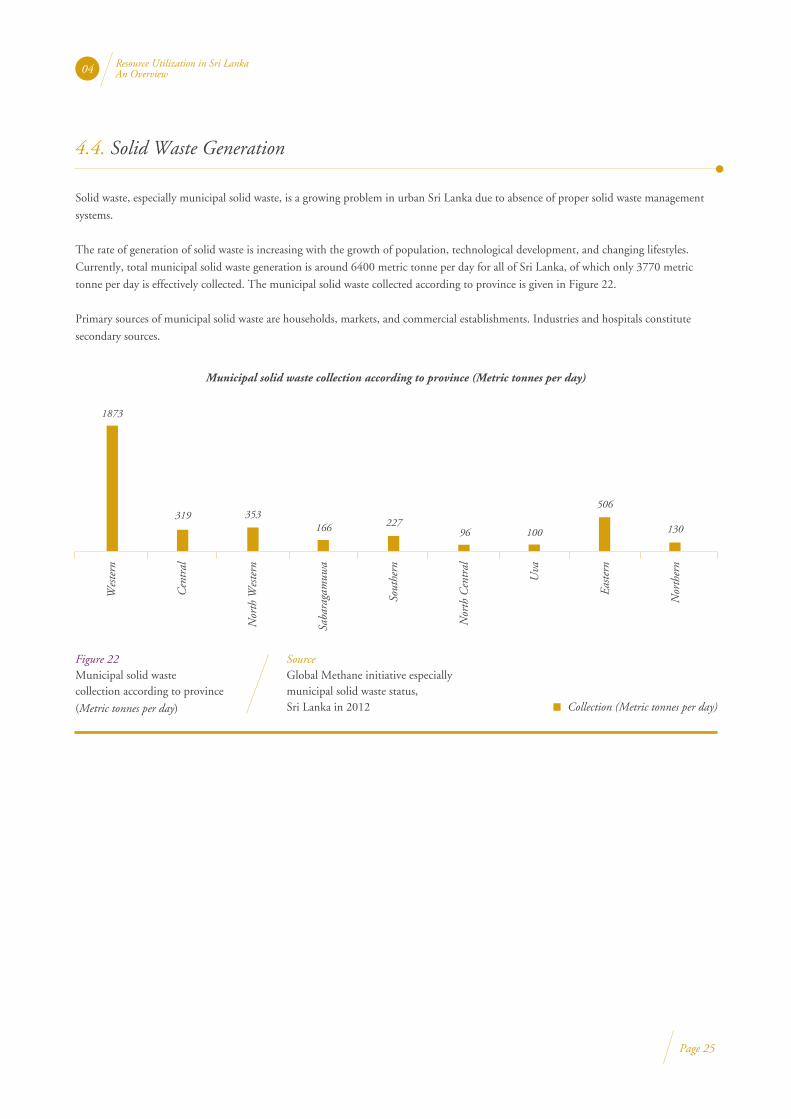
4.4. Solid Waste Generation
Solid waste, especially municipal solid waste, is a growing problem in urban Sri Lanka due to absence of proper solid waste management
systems.
The rate of generation of solid waste is increasing with the growth of population, technological development, and changing lifestyles.
Currently, total municipal solid waste generation is around 6400 metric tonne per day for all of Sri Lanka, of which only 3770 metric
tonne per day is effectively collected. The municipal solid waste collected according to province is given in Figure 22.
Primary sources of municipal solid waste are households, markets, and commercial establishments. Industries and hospitals constitute
secondary sources.
Page 25
Figure 22Municipal solid waste collection according to province
(Metric tonnes per day)
SourceGlobal Methane initiative especially municipal solid waste status, Sri Lanka in 2012
Municipal solid waste collection according to province (Metric tonnes per day)
Wes
tern
Cen
tral
Nor
th W
este
rn
Saba
raga
muw
a
Sout
hern
Nor
th C
entr
al
Uva
Easte
rn
Nor
ther
n
1873
319 353166 227
96 100
506
130
Collection (Metric tonnes per day)
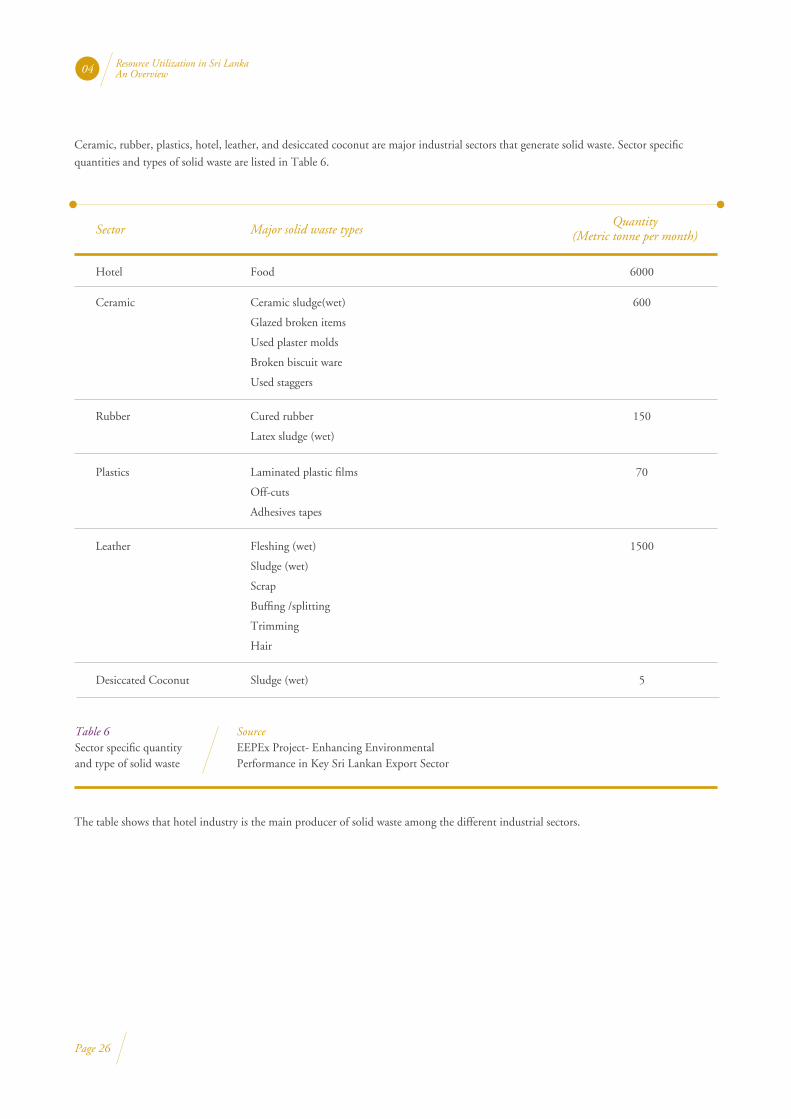
Ceramic, rubber, plastics, hotel, leather, and desiccated coconut are major industrial sectors that generate solid waste. Sector specific
quantities and types of solid waste are listed in Table 6.
The table shows that hotel industry is the main producer of solid waste among the different industrial sectors.
Table 6Sector specific quantity and type of solid waste
SourceEEPEx Project- Enhancing Environmental Performance in Key Sri Lankan Export Sector
Sector Major solid waste types
FoodHotel
Quantity(Metric tonne per month)
6000
Ceramic sludge(wet)
Glazed broken items
Used plaster molds
Broken biscuit ware
Used staggers
Ceramic
Cured rubber
Latex sludge (wet)
Rubber
600
150
Sludge (wet) Desiccated Coconut 5
Laminated plastic films
Off-cuts
Adhesives tapes
Plastics 70
Fleshing (wet)
Sludge (wet)
Scrap
Buffing /splitting
Trimming
Hair
Leather 1500
Resource Utilization in Sri Lanka An Overview 04
Page 26
Page 27
Resource Utilization in Sri Lankan Hotels 05
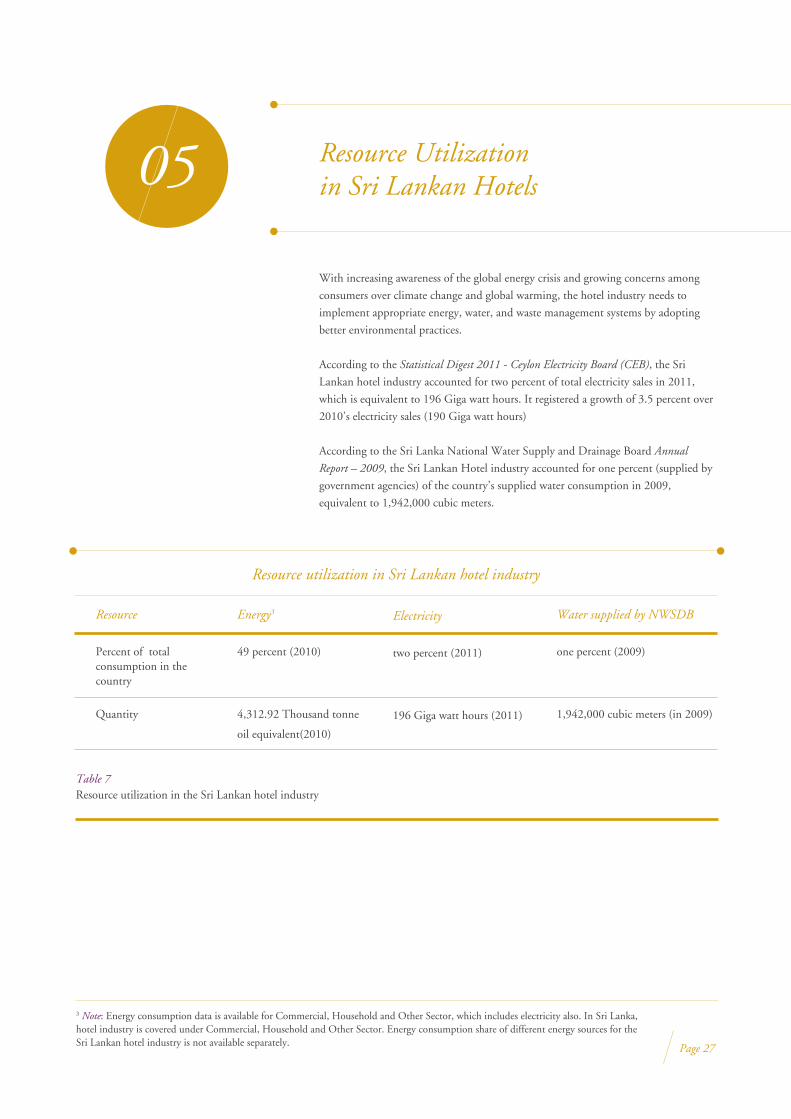
With increasing awareness of the global energy crisis and growing concerns among
consumers over climate change and global warming, the hotel industry needs to
implement appropriate energy, water, and waste management systems by adopting
better environmental practices.
According to the Statistical Digest 2011 - Ceylon Electricity Board (CEB), the Sri
Lankan hotel industry accounted for two percent of total electricity sales in 2011,
which is equivalent to 196 Giga watt hours. It registered a growth of 3.5 percent over
2010’s electricity sales (190 Giga watt hours)
According to the Sri Lanka National Water Supply and Drainage Board Annual
Report – 2009, the Sri Lankan Hotel industry accounted for one percent (supplied by
government agencies) of the country’s supplied water consumption in 2009,
equivalent to 1,942,000 cubic meters.
Table 7Resource utilization in the Sri Lankan hotel industry
Resource Energy3
49 percent (2010)Percent of total consumption in the country
Water supplied by NWSDB
one percent (2009)
4,312.92 Thousand tonne
oil equivalent(2010)
Electricity
Resource utilization in Sri Lankan hotel industry
two percent (2011)
196 Giga watt hours (2011)Quantity 1,942,000 cubic meters (in 2009)
3 Note: Energy consumption data is available for Commercial, Household and Other Sector, which includes electricity also. In Sri Lanka, hotel industry is covered under Commercial, Household and Other Sector. Energy consumption share of different energy sources for the Sri Lankan hotel industry is not available separately.

Resource Utilization in Sri Lankan Hotels 05
Page 28
Tourist arrivals in Sri Lanka have been increasing year on year over the last three decades. In 2011, arrivals were around 850,000 and the
government has set a target to increase it to 2.5 million tourists by 2016. To achieve this, the Sri Lankan hotel industry needs to double its
infrastructure in the next three years. This will also result in doubling resource utilization by that time.
As is apparent from energy efficiency and resource improvement studies from other countries, the hotel industry possesses a savings
potential of 20 percent in energy and water consumption. Waste generation can be reduced by 20 percent by improving resource
utilization through adoption of best practices.
Energy and water efficiency and improvement in resource utilization improves the organizational performance of a hotel. It also helps
greatly to position itself as a more responsible destination in the minds of consumers.
5.1. Energy and Water Consumption
The major sources of energy in Sri Lankan hotels are grid-supplied electricity, diesel for electricity generation, furnace oil for steam boiler
operation, liquefied petroleum gas (LPG) for cooking, biomass from cultivated forestry, and biogas from waste. The energy use4 of a
typical hotel in a warm humid climate, such as the Sri Lankan coast, is provided in Figure 23. The breakup of energy consumption is
air-conditioning 50 percent, followed by lighting (20 percent), kitchen (15 percent), laundry (eight percent), and others (seven percent).
Typical energy consumption in tourist hotels in Sri Lanka (percentage)
Figure 23Typical energy consumption in tourist hotels
SourceStudy on sustainable consumption practices in Sri Lankan hotels
Air Conditioning
Lighting
Laundry
Kitchen
Others
7
50
20
15
8
4 Research paper “A study on sustainable consumption practices in Sri Lanka hotel industry” written by Professor N Ratnayake, University of Moratuwa and Srilal Miththapala, Ceylon Chamber of Commerce

Resource Utilization in Sri Lankan Hotels 05
Hotels consume a significant amount of water for various activities. The amount of water used directly impacts the amount wastewater
generated and treated in treatment plants.
The typical pattern of how water is used in the different departments of a hotel in a warm humid climate, such as the Sri Lankan coast, is
shown (Australian Institute of Hotel Engineering, 1996) in Figure 24. Efforts to conserve water should be directed at guest rooms,
kitchens, public washrooms, and laundry. In addition, gardening and landscaping consume substantial amounts of water, particularly in
the dry season, depending on the size of garden and type of vegetation. If hotels take initiatives to reduce their water consumption, the
generation of wastewater will automatically reduce, and the performance of wastewater treatment plants will improve.
Typical water usage in tourist hotel (percentage)
Figure 24Typical water usage in tourist hotels
SourceStudy on sustainable consumption practices in the Sri Lankan hotel industry
Guest rooms
Air conditioning
Kitchen
Cold room
Laundry
Steam generation
Lockers/Public toilets
Pool
12
38
16
4
16
2
21
Page 29
Resource Utilization in Sri Lankan Hotels 05
Wastewater Management
With new hotels rapidly increasing, regulatory authorities in Sri Lanka have decided to enforce stringent environmental regulations on the
hotel industry. As a result, under the Sri Lanka National Environment Act, tolerance limits for industrial and domestic effluents
discharged into the sea were defined in 1990. To comply, most coastal hotels were compelled to set up effluent treatment plants to treat
effluents to correct standards before discharging into the sea or the coastal environment. The costs of installing and running these effluent
treatment plants are high.
Effluent treatment plants collect sewage and wastewater in a sewage collection tank. This is passed through a sand separator to a feeder
tank and then on to two sedimentation tanks. From these tanks, the wastewater passes through soil filters and a treated water sump for
reuse. Sludge produced from the sedimentation tanks is pumped to a digester tank. The digester tank produces biogas after which the
sludge passes through a pressure equalisation tank to drying beds.
The main by-products of the effluent treatment plant or sewage treatment plant are:
Water: used for watering the garden
Biogas: used for cooking
Sun-dried sludge: used in the garden
Page 30
5.2. Waste Generation and Management
Hotels produce more sewage and wastewater (For example, laundry and bath wastes, kitchen wastes) when compared to domestic
households. Wastewater pollutes water bodies surrounding tourist attractions, damages the environment and poses serious threats to
human health.
When it comes to waste management, the hotel industry is driven almost entirely by regulatory requirements, except for a few
environmentally conscious hotels that take extra measures to reduce, reuse, and recycle solid waste and wastewater. This is because most
establishments do not see financial benefits, as they do with energy conservation measures.

Resource Utilization in Sri Lankan Hotels 05
Page 31
Solid Waste Management
Solid waste from a typical hotel consists of restaurant food waste, office paper, bottles, plastic, aluminium beverage containers, and
cardboard boxes. Although this waste is diverse, hotels typically generate a consistent type of waste. The majority is paper and food waste,
with lesser amounts of metal, plastic, and glass. This profile is similar to the standard municipal solid waste from residential communities.
In a typical hotel, the breakup of solid waste generation by type is food and non-recyclables, 46.2 percent, followed by paper
(25.3 percent), cardboard (11.7 percent), plastic (6.7 percent), glass (5.6 percent), and metal (4.5 percent). Variations in waste
composition from one hotel to another can be attributed to differences in scope of operations and target markets.
Solid waste management needs to ensure that waste is:
minimised
collected effectively (separated into non-degradable and biodegradable waste)
treated properly
disposed of responsibly
A typical hotel's solid waste generation (percentage)
Figure 25A typical hotel's solid waste generation
SourceUNEP manual for Cleaner production in Hotels
Food and Non recyclables
Paper
Cardboard
Plastics
Glass
Metal
4.55.6
46.2
25.3
6.7
11.7
5.3. Resource Efficiency Potential
Implementation of resource efficiency initiatives in the Sri Lankan hotel industry is urgently needed to reduce dependency on fossil fuels
and meet future demand for resources like energy, electricity and water. Various studies and initiatives indicate that there is potential to
save around 20 percent in energy and 20 percent in water consumption and waste generation5.
5 Greening Sri Lankan Hotels Project - EU funded under the Switch Asia program
Resource Utilization in Sri Lankan Hotels 05
Page 32
5.4. Resource Efficiency Measures Taken by some Sri Lankan Hotels
Resource efficiency measures taken by various tourist hotels in Sri Lanka, as collated through secondary research, are as listed below:
Energy Conservation Measures
High and Medium Investment Measures
Variable frequency drives to reduce electricity consumption water pumping
Air curtains to maintain proper cooling and reduce electricity consumption of air-conditioners
Gasifiers to generate energy for laundry
Solar water heating systems for hot water
Incandescent lights and halogen lights replaced by energy efficient lamps
Card-key systems to switch off lights in absence of guests in rooms
Dimmer switches to reduce energy consumption in lighting
Sensors for lights in car parking areas
Low and No Investment Measures
AC temperatures set to optimum level (24-25°C)
Colour code system to switch lights on and off according to a schedule
Lights in corridors switched on and off on a section-by-section basis
Freezer curtains to reduce energy loss in cold rooms
Preventive maintenance as per planned schedules
Water Conservation Measures
High and Medium Investment Measures
Separate meters to monitor water consumption in different departments
Water saving cisterns with dual flushes
Press-top faucets in staff canteens to reduce water wastage
Low and No Investment Measures
Daily checks for leaks in water storage tanks and taps
Preventive maintenance as per planned schedules
Technicians to check sewage treatment plants every day
Treated water from sewage treatment plant used to water gardens
Water quality checked every six months by external agency to ensure discharged water meets standards set by the Central
Environmental Authority
Kitchen water sent through grease traps and solid grease treated with effective micro-organism solutions and completely digested
Wastewater Management
High and Medium Investment Measures
Sewage treatment plants for wastewater treatment
Low and No Investment Measures
Resource Utilization in Sri Lankan Hotels 05
Page 33
Solid Waste Management
Plastic replaced by environmentally friendly materials. For example, laundry bags are made of cloth (for soiled linen) and cane (to
deliver laundered clothes); shampoo dispensed in ceramic bottles and newspaper bags are made of paper
Plastic water bottles provided with packed lunches. Plastic cutlery not used
Use of plastic straws with cocktails or drinks reduced
Plastic shopping bags discontinued and suppliers educated to use reusable plastic crates or cardboards boxes
Garbage bags used only for wet garbage to meet Hazard Analysis Critical Control Point (HACCP) standards
Office stationery and paper reused
Complete computerisation and networking to make offices paper-free
Garbage and trash separated at sources of origin in all departments - such as the kitchen, restaurant and bar, housekeeping, laundry,
and maintenance
Garbage bins colour coded for glass and plastic, paper and cardboard, polythene and plastic, and wet garbage
Guests requested to bring back picnic boxes and plastic water bottles so they can be disposed of properly
Low and No Investment Measures

Resource Utilization in Sri Lankan Hotels 05
Page 34
Information Dissemination or Awareness Measures
Monetary value of wasteful use of major equipment demonstrated
Notices to create awareness about energy conservation displayed in rooms
Staff trained routinely on energy conservation
Housekeeping staff made aware of the need to be vigilant against leaking taps
All staff trained and monitored on separation of garbage
Energy Management and Electrical Load
Use of card key enabled switches in rooms
Building management systems
Use equipment that matches loads
Use variable frequency drives for motors, chillers, and pumps
Install automatic power factor correction capacitor banks
Use energy efficient lighting systems (LEDs and CFLs)
Use natural lighting as much as possible
Use occupancy sensors and timers to control lighting
Maintain required light levels and use efficient luminaries
Heating, Ventilation, and Air Conditioning Load
Use proper thermal insulation for walls and roofs to reduce AC loads
Consider orientation of building at time of design
Double glass windows and sun control films for windows to reduce heat penetration into buildings
Minimise leaks by using door closers for air conditioned spaces
Use of natural ventilation/tree cover
Use of efficient room air conditioning units
Central type air conditioners with multi compressors and variable frequency drive
Biomass steam boilers, solar hot water panels, heat pumps, and waste heat recovery for heating water
Inverter ACs Solar ACs Hybrid ACs
Hotels under construction need to implement sustainability measures/technologies from the start. The following steps can be considered:
Water Conservation
Install water sub meters to measure water consumption in each section
Rainwater harvesting
Use low flow taps and showers in toilets

Hotel Commercial buildings State sector office buildings
Environmental Management
Use optimum sized wastewater treatment plants and sewage treatment plants
Reuse sewage treatment plant treated water for gardening/toilet flushing, etc.
Solid waste management
Separating and sorting waste at source by using colour coded bins
Biogas production from waste generated in the hotel
Manufacturing
Services
Health care
The list of award-winning hotels is given in Table 8.
Resource Utilization in Sri Lankan Hotels 05
Page 35
5.5. Energy Consumption Details of the Sri Lanka National Energy Efficiency Award Winning Hotels
The Sri Lanka National Energy Efficiency Award (SLNEEA) is prestigious national recognition given to organizations implementing
energy efficiency initiatives. The specialty of the SLNEEA program is that it recognizes energy management systems without merely
focusing on specific projects. The awards highlight successful implementation of innovative, cost effective, and transferable energy
efficiency measures across large, medium, and small categories in the following sectors.
Award Category
2010
Jetwing BeachGold
2012
Nil
Nil
2011
Year
Heritance Kandalam
Seashells Hotel (Pvt) Ltd
The Tea Factory HotelSilver Heritance Ayurveda Maha Gedara
Jetwing Hunnas Falls Heritance AhungallaBronze Jetwing Blue
Jetwing Lighthouse NilCertification of Merit Mount Lavinia Hotel
Cinnamon Grand
Bandarawela Hotel
The Royal Heritage Hotel (Pvt) Ltd
St. Andrew’s Hotel (Pvt) Ltd
Table 8SLNEEA winner hotels in 2010, 2011 and 2012
SourceSLSEA
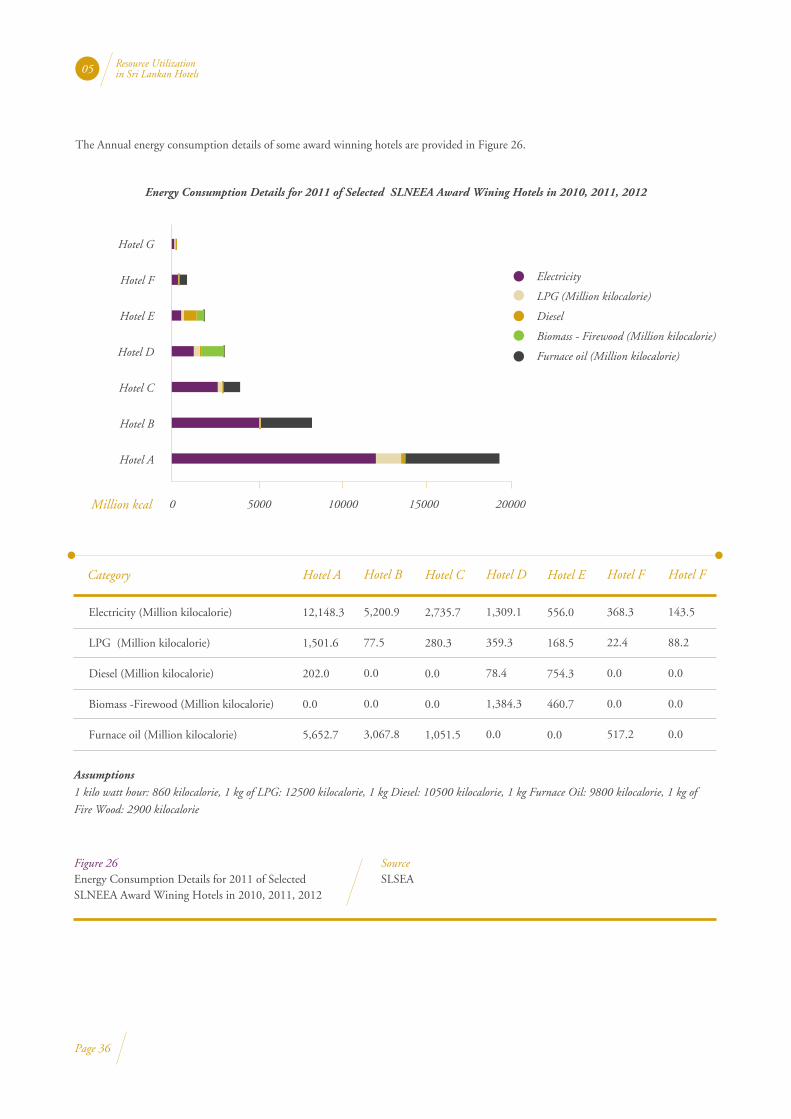
Assumptions1 kilo watt hour: 860 kilocalorie, 1 kg of LPG: 12500 kilocalorie, 1 kg Diesel: 10500 kilocalorie, 1 kg Furnace Oil: 9800 kilocalorie, 1 kg of
Fire Wood: 2900 kilocalorie
The Annual energy consumption details of some award winning hotels are provided in Figure 26.
Resource Utilization in Sri Lankan Hotels 05
Page 36
Figure 26Energy Consumption Details for 2011 of Selected SLNEEA Award Wining Hotels in 2010, 2011, 2012
SourceSLSEA
Energy Consumption Details for 2011 of Selected SLNEEA Award Wining Hotels in 2010, 2011, 2012
Hotel G
Hotel F
Hotel E
Hotel D
Hotel C
Hotel B
Hotel A
0 5000 10000 15000 20000
Electricity
LPG (Million kilocalorie)
Diesel
Biomass - Firewood (Million kilocalorie)
Furnace oil (Million kilocalorie)
Category
Million kcal
Electricity (Million kilocalorie)
LPG (Million kilocalorie)
Diesel (Million kilocalorie)
Biomass -Firewood (Million kilocalorie)
Furnace oil (Million kilocalorie)
Hotel A
12,148.3
1,501.6
202.0
0.0
5,652.7
Hotel B
5,200.9
77.5
0.0
0.0
3,067.8
Hotel C
2,735.7
280.3
0.0
0.0
1,051.5
Hotel D
1,309.1
359.3
78.4
1,384.3
0.0
Hotel E
556.0
168.5
754.3
460.7
0.0
Hotel F
143.5
88.2
0.0
0.0
0.0
Hotel F
368.3
22.4
0.0
0.0
517.2

NA: Data is not available
Resource Utilization Benchmarking – World Over06
A comparison of resource utilization benchmarking for hotels in various countries is
provided in Table 9. This is based on information published in various reports and
international journals on resource use and waste management in hotels. During this
assignment, the project team will identify parameters for three, four, and five star
hotel categories.
Page 37
Table 9Resource utilization benchmarking details of hotels in various countries
SourceInternational Journal of Basic and Applied Sciences IJBAS Vol.: 9 No: 10: Resource Use, Waste, and Total Productivity Management in Saudi Arabia Hotel Industry, Journal of Cleaner Production 13 (2005) 109–116: Resource use and waste management in Vietnam hotel industry
Electricity Consumption (kilo watt hour/Guest Room/Day)
Water Consumption (m3 Water / Guest Room / Day)
Wastewater (m3 Wastewater / Guest Room/Day)
Solid Waste(kg of Solid waste / Guest Room/Day)
NA
NA
NA
NA
77 - 98
6 - 21.0
3 - 5.3
14 - 33
<60.4
NA
0.5
NA
35
0.9 - 1.4
NA
1.2 - 2
Vietnam Saudi Asia Europe
81 - 127
4.4 - 39.9
13.5 - 32.3
NA
44 -77
2.4 - 2.6
1.8 - 2.2
7.3 - 12.2
30 - 40
1.8 - 2.3
1.4 - 1.7
2.5 - 7.2
<40.2
NA
0.29
NA
30
0.2 - 0.3
NA
0.5 - 1.5
Vietnam Saudi Asia Europe
40 - 50
2.2 - 11
8.2 - 17.9
2.3 - 12
<21.4
NA
0.26
NA
25
0.2 - 0.3
NA
0.5 - 1.5
Vietnam Saudi Asia Europe
15 - 27
0.9 - 1.7
0.4 - 0.8
0.8 - 2.1
27 - 41
0.6 - 10.8
0.7 - 5.6
1.4 - 1.9
<21.4
NA
0.26
NA
25
0.2 - 0.3
NA
0.5-1.5
Vietnam Saudi Asia Europe
Resource Hotel Category
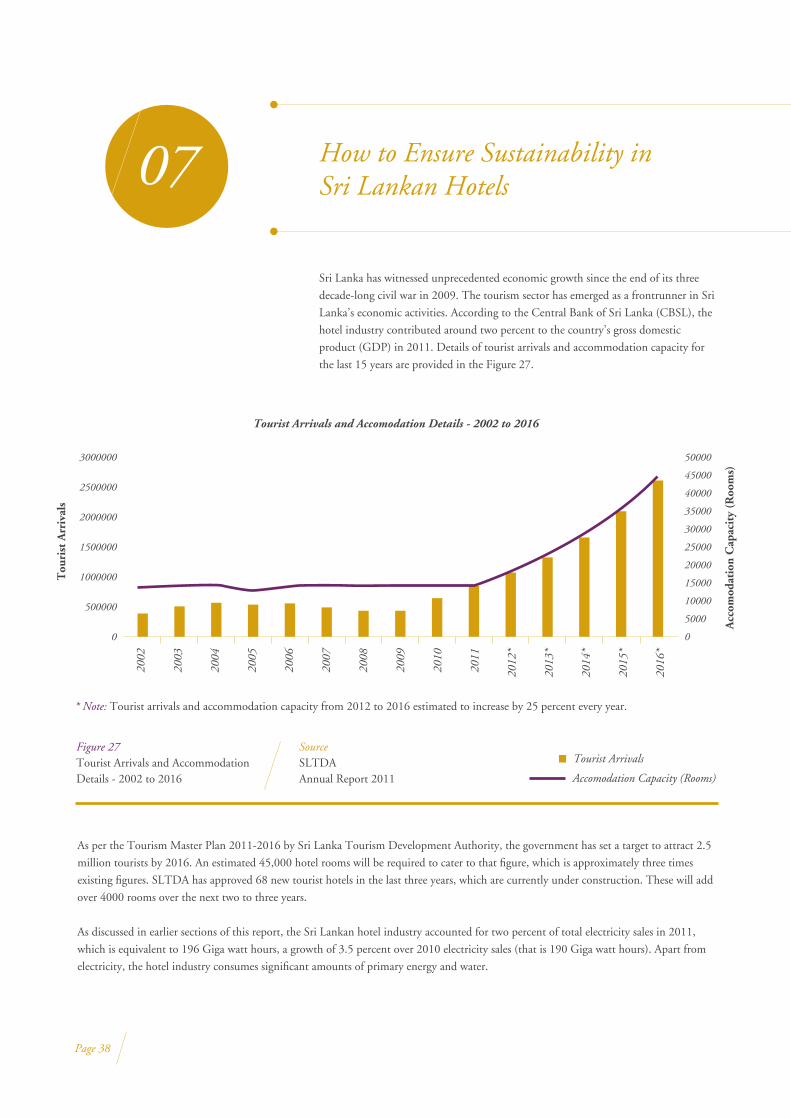
As per the Tourism Master Plan 2011-2016 by Sri Lanka Tourism Development Authority, the government has set a target to attract 2.5
million tourists by 2016. An estimated 45,000 hotel rooms will be required to cater to that figure, which is approximately three times
existing figures. SLTDA has approved 68 new tourist hotels in the last three years, which are currently under construction. These will add
over 4000 rooms over the next two to three years.
As discussed in earlier sections of this report, the Sri Lankan hotel industry accounted for two percent of total electricity sales in 2011,
which is equivalent to 196 Giga watt hours, a growth of 3.5 percent over 2010 electricity sales (that is 190 Giga watt hours). Apart from
electricity, the hotel industry consumes significant amounts of primary energy and water.
How to Ensure Sustainability in Sri Lankan Hotels07
Sri Lanka has witnessed unprecedented economic growth since the end of its three
decade-long civil war in 2009. The tourism sector has emerged as a frontrunner in Sri
Lanka’s economic activities. According to the Central Bank of Sri Lanka (CBSL), the
hotel industry contributed around two percent to the country’s gross domestic
product (GDP) in 2011. Details of tourist arrivals and accommodation capacity for
the last 15 years are provided in the Figure 27.
Figure 27Tourist Arrivals and Accommodation Details - 2002 to 2016
SourceSLTDAAnnual Report 2011
Tourist Arrivals and Accomodation Details - 2002 to 2016
2002
2003
2004
2005
2006
2007
2008
2009
2010
2011
2012
*
2013
*
2014
*
2015
*
2016
*
Accomodation Capacity (Rooms)
Tourist Arrivals
Acc
omod
atio
n C
apac
ity
(Roo
ms)
Tou
rist
Arr
ival
s
3000000
2500000
2000000
1500000
1000000
500000
0
50000
45000
40000
35000
30000
25000
20000
15000
10000
5000
0
* Note: Tourist arrivals and accommodation capacity from 2012 to 2016 estimated to increase by 25 percent every year.
Page 38
If the Sri Lankan Tourism Master Plan 2011-2016 is implemented successfully, energy requirements in the hotel industry will increase by
about three times the 2011 figures by 2016. This will throw out millions of tonnes more anthropogenic6 carbon into the atmosphere.
Multilateral and bilateral cooperation agencies and development finance institutions should engage directly to inform, educate, and work
collaboratively with the tourism industry to integrate sustainability into policies and management practices and secure its active
participation in developing sustainable tourism. At the national level, government and civil society engagement should be a critical part of
efforts to coordinate action towards successful implementation of resource efficiency measures in the hotel industry.
Some programs, which can make Sri Lankan hotels sustainable and greener, can be:
From the data presented above, it is clear the rapid increase in Sri Lankan tourist hotels in the current scenario will lead to higher energy
consumption and environmental degradation. Drastic measures must be taken for efficient use of resources in the Sri Lankan hotel
industry through implementation of innovative programs that do not affect the economic growth of the sector.
Star Rating Program for Hotels: The star rating program for hotels can lead to more efforts by hotels to get higher star ratings and
ultimately use that to market their hotels. This can also increase demand for these hotels in the market, based on their resource
efficiency. That is, actual performance of the hotels in terms of specific resource usage (specific energy consumption, specific water
consumption, and specific waste generation). Ratings can be based on a one to five star scale in each category of graded tourist
accommodations with five star labelled hotels being the most efficient.
National Hotel Industry Resource Consumption Benchmarking Program: The main goal of the program can be to establish a
framework to standardize data collection on resource usage, baseline setting for different graded tourist accommodations, resource
utilization target setting and monitoring. This information can help users and other stakeholders evaluate hotel resource efficiency,
track improvements compared to other hotels, and recognize top performers.
Financing Program for Resource Efficient Measures in Hotel Industry: Resource efficiency and environmental investments are
relatively new, so remain outside the mainstream of financial markets (particularly in developing countries). In many cases, barriers are
based on misperceptions or lack of knowledge. For example, payback periods and amounts are not clearly established for many green
investments due to limited experience with them. This creates uncertainty for banks and other investors, jeopardizing financing.
Financial support (through lower interest loans) can be provided to hotel owners and energy service companies (ESCOs) to invest in
resource efficient measures in hotels. This will act as a motivator for bankers, hotel owners, and energy service companies to invest in
resource efficient measures in the hotel industry.
How to Ensure Sustainability in Sri Lankan Hotels07
Page 39
6 An effect resulting from human activity
International Finance Corporation Sri Lanka 15th Floor, DHPL Building 42 Nawam Mawatha Colombo 02 Sri Lanka
Tel: +94 11 5400 100 Fax: +94 11 4795 017
www.ifc.org


![[B3] PEMASIRI R W Ranjith_Economic Benefits of Sri Lanka's First Expressway Project](https://static.documents.pub/doc/80x56/545218f6af795904308b4ae0/b3-pemasiri-r-w-ranjitheconomic-benefits-of-sri-lankas-first-expressway-project.jpg)


