28
SEPTEMBER 2021 INVESTOR PRESENTATION

SEPTEMBER 2021
INVESTOR PRESENTATION

DISCLAIMERForward-looking Statements
Some of the statements contained in this presentation are forward-looking statements within the meaning of Section 27A of the Securities Act of 1933, as amended, and Section 21E of the Securities Exchange Act of 1934, as amended. These forward-looking statements are
generally identified by the use of words such as "anticipate," "believe," "could," "estimate," "expect," "intend," "may," "plan," "potential," "predict," "project," "should," "target," "will," "would" and, in each case, their negative or other various or comparable terminology. These
forward-looking statements reflect our views with respect to future events as of the date of this release and are based on our management’s current expectations, estimates, forecasts, projections, assumptions, beliefs and information. Although management believes that the
expectations reflected in these forward-looking statements are reasonable, it can give no assurance that these expectations will prove to have been correct. All such forward-looking statements are subject to risks and uncertainties, many of which are outside of our control, and
could cause future events or results to be materially different from those stated or implied in this document. It is not possible to predict or identify all such risks. These risks include, but are not limited to: secular shifts in consumer demand for swimming pools and spending on
outdoor living spaces; slow pace of material conversion from concrete pools to fiberglass pools in the pool industry; general economic conditions and uncertainties affecting markets in which we operate and economic volatility that could adversely impact the Company’s business,
including the COVID-19 pandemic; changes in access to consumer credit or increases in interest rates impacting consumers’ ability to finance their purchases of pools; the impact of weather on the Company’s business; the Company’s ability to attract new customers and retain
existing customers; the Company’s ability to sustain further growth and to manage it effectively; the ability of the Company’s suppliers to continue to deliver the quantity or quality of materials sufficient to meet the Company’s needs to manufacture the Company’s products; the
availability and cost of third-party transportation services for the Company’s products and raw materials; product quality issues; the Company’s ability to successfully defend litigation brought against the Company; the Company’s ability to adequately obtain, maintain, protect and
enforce the Company’s intellectual property and proprietary rights and claims of intellectual property and proprietary right infringement, misappropriation or other violation by competitors and third parties; failure to hire and retain qualified employees and personnel; exposure to
risks associated with international sales and operations, including foreign currency exchange rates, corruption and instability; security breaches, cyber-attacks and other interruptions to the Company’s and the Company’s third-party service providers’ technological and physical
infrastructures; catastrophic events, including war, terrorism and other international conflicts, public health issues or natural catastrophes and accidents; risk of increased regulation of the Company’s operations, particularly related to environmental laws and other risks,
uncertainties and factors described under the section titled “Risk Factors” in the registration statement on Form S-1 filed with the U.S. Securities and Exchange Commission (the “SEC”) by the Company, as well as other filings that the Company will make with the SEC, such as
Annual Reports on Form 10-K, Quarterly Reports on Form 10-Q and Current Reports on Form 8-K. These factors should not be construed as exhaustive and should be read in conjunction with the other cautionary statements that are included in this presentation and in other
filings. We expressly disclaim any obligation to publicly update or review any forward-looking statements, whether as a result of new information, future developments or otherwise, except as required by applicable law.
Non-GAAP Financial Measures
We track our non-GAAP financial measures to monitor and manage our underlying financial performance. This presentation includes the presentation of Adjusted EBITDA (including on a last twelve months’ basis) and Adjusted EBITDA margin, which are non-GAAP financial
measures that exclude the impact of certain costs, losses and gains that are required to be included in our profit and loss measures under GAAP. Although we believe these measures are useful to investors and analysts for the same reasons it is useful to management, as
discussed below, these measures are neither a substitute for, nor superior to, U.S. GAAP financial measures or disclosures. Other companies may calculate similarly-titled non-GAAP measures differently, limiting their usefulness as comparative measures. We have reconciled
Adjusted EBITDA to the applicable most comparable GAAP measure, net income, throughout this presentation.
Adjusted EBITDA and Adjusted EBITDA margin are key metrics used by management and our board of directors to assess our financial performance. Adjusted EBITDA and Adjusted EBITDA margin are also frequently used by analysts, investors and other interested parties to
evaluate companies in our industry, when considered alongside other GAAP measures. We use Adjusted EBITDA and Adjusted EBITDA margin to supplement GAAP measures of performance to evaluate the effectiveness of our business strategies, to make budgeting decisions
and to compare our performance against that of other companies using similar measures. We have presented Adjusted EBITDA and Adjusted EBITDA margin solely as supplemental disclosures because we believe they allow for a more complete analysis of results of operations
and assist investors and analysts in comparing our operating performance across reporting periods on a consistent basis by excluding items that we do not believe are indicative of our core operating performance, such as (i) depreciation and amortization, (ii) interest expense, (iii)
income tax (benefit) expense, (iv) loss on sale and disposal of property and equipment, (v) restructuring charges, (vi) management fees, (vii) stock-based compensation expense, (viii) other expense (income) / net unrealized (gains) losses on foreign currency transactions, (ix)
other non-cash items, (x) strategic initiative costs, (xi) acquisition and integration related costs, (xii) other, (xiii) IPO costs, and (xiv) COVID-19-related expenses (income).
Adjusted EBITDA and Adjusted EBITDA margin are non-GAAP financial measures and should not be considered as alternatives to net income as a measure of financial performance or any other performance measure derived in accordance with GAAP, and they should not be
construed as an inference that our future results will be unaffected by unusual or non-recurring items. You are encouraged to evaluate these adjustments and the reasons we consider them appropriate for supplemental analysis. In evaluating Adjusted EBITDA and Adjusted
EBITDA margin, you should be aware that in the future we may incur expenses that are the same as or similar to some of the adjustments in this presentation. There can be no assurance that we will not modify the presentation of Adjusted EBITDA and Adjusted EBITDA margin
following this offering, and any such modification may be material. Our presentation of Adjusted EBITDA and Adjusted EBITDA margin should not be construed to imply that our future results will be unaffected by any such adjustments. In addition, other companies, including
companies in our industry, may not calculate Adjusted EBITDA and Adjusted EBITDA margin at all or may calculate Adjusted EBITDA and Adjusted EBITDA margin differently and accordingly, are not necessarily comparable to similarly entitled measures of other companies,
which reduces the usefulness of Adjusted EBITDA and Adjusted EBITDA margin as tools for comparison.
Adjusted EBITDA and Adjusted EBITDA margin have their limitations as analytical tools, and you should not consider them in isolation or as a substitute for analysis of our results as reported under GAAP. Some of these limitations are that Adjusted EBITDA and Adjusted EBITDA
margin:
• do not reflect every expenditure, future requirements for capital expenditures or contractual commitments;
• do not reflect changes in our working capital needs;
• do not reflect the interest expense, or the amounts necessary to service interest or principal payments, on our outstanding debt;
• do not reflect income tax (benefit) expense, and because the payment of taxes is part of our operations, tax expense is a necessary element of our costs and ability to operate;
• do not reflect non-cash equity compensation, which will remain a key element of our overall equity-based compensation package; and
• do not reflect the impact of earnings or charges resulting from matters we consider not to be indicative of our ongoing operations.
Although depreciation and amortization are eliminated in the calculation of Adjusted EBITDA and Adjusted EBITDA margin, the assets being depreciated and amortized will often have to be replaced in the future, and Adjusted EBITDA and Adjusted EBITDA margin do not reflect
any costs of such replacements.
2

LATHAM AT A GLANCE
THE MARKET LEADER IN EVERY POOL SUB-CATEGORY IN WHICH WE COMPETE
THE ONLY POOL COMPANY THAT HAS ESTABLISHED A DIRECT RELATIONSHIP
WITH THE HOMEOWNER
UNIQUE DIRECT-TO-HOMEOWNER MODEL DELIVERS PURCHASE-READY LEADS
TO THE LARGEST DEALER NETWORK IN THE WORLD
CAPITALIZING ON THE SIGNIFICANT MATERIAL CONVERSION OPPORTUNITY
WITH FIBERGLASS
COAST-TO-COAST MANUFACTURING AND DISTRIBUTION PLATFORM CONSISTING
OF 2,000+ EMPLOYEES ACROSS 32 FACILITIES
ELEVEN CONSECUTIVE YEARS OF REVENUE AND EBITDA GROWTH
3
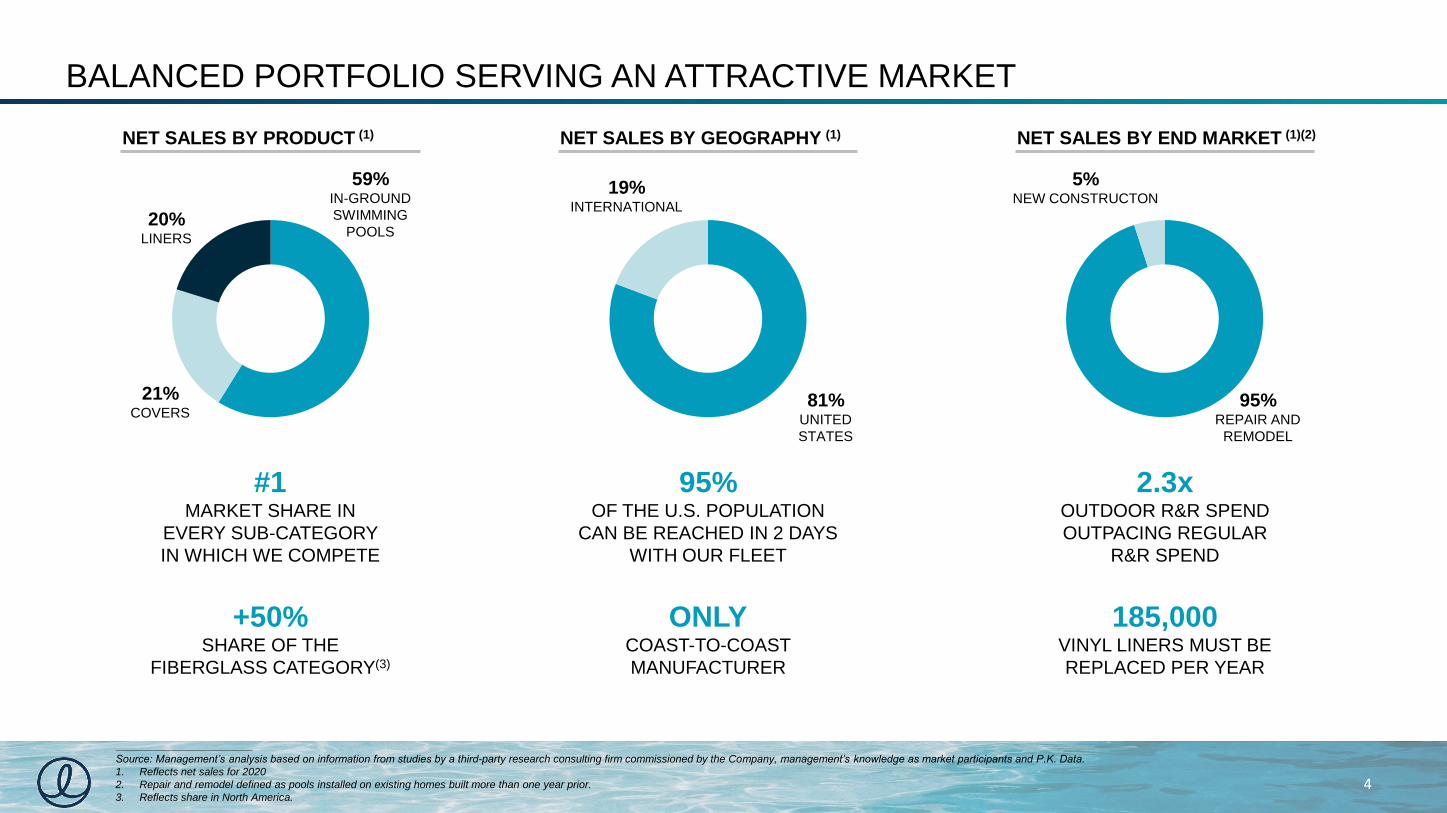
BALANCED PORTFOLIO SERVING AN ATTRACTIVE MARKET
NET SALES BY PRODUCT (1) NET SALES BY END MARKET (1)(2)NET SALES BY GEOGRAPHY (1)
_______________________
Source: Management’s analysis based on information from studies by a third-party research consulting firm commissioned by the Company, management’s knowledge as market participants and P.K. Data.
1. Reflects net sales for 2020
2. Repair and remodel defined as pools installed on existing homes built more than one year prior.
3. Reflects share in North America.
#1MARKET SHARE IN
EVERY SUB-CATEGORY
IN WHICH WE COMPETE
+50%SHARE OF THE
FIBERGLASS CATEGORY(3)
ONLYCOAST-TO-COAST
MANUFACTURER
95%OF THE U.S. POPULATION
CAN BE REACHED IN 2 DAYS
WITH OUR FLEET
20%LINERS
59%IN-GROUND
SWIMMING
POOLS
21%COVERS
81%UNITED
STATES
95%REPAIR AND
REMODEL
5%NEW CONSTRUCTON
185,000VINYL LINERS MUST BE
REPLACED PER YEAR
2.3xOUTDOOR R&R SPEND
OUTPACING REGULAR
R&R SPEND
19%INTERNATIONAL
4

TRANSFORMATIONAL B2C GO-TO-MARKET STRATEGY
YESTERDAY
DEALERS
POOL
MANUFACTURER
POOL
MANUFACTURER
HOMEOWNERS
TODAY
HOMEOWNERS
LATHAM IS THE ONLY CONSUMER BRAND IN THE RESIDENTIAL POOL INDUSTRY WITH A
DIFFERENTIATED VALUE PROPOSITION THAT INCLUDES AN UNMATCHED PRODUCT PORTFOLIO
TODAY, LATHAM CONTROLS THE HOMEOWNER
EDUCATION PROCESS AND HAS THE ABILITY TO
FUNNEL PURCHASE-READY LEADS TO PRE-
QUALIFIED DEALERS THROUGH ITS WEBSITE OR
MOBILE APP
HOMEOWNERS RELIED ON THEIR LOCAL DEALER
TO PROVIDE THEM INFORMATION ON POOL
MANUFACTURERS, SHAPES, SIZES AND MATERIALS
AND WERE RESTRICTED BY DEALER INVENTORIES
EXCLUSIVE
DEALER
5

LATHAM HOLDS THE #1 MARKET SHARE POSITION IN EVERY
POOL PRODUCT SUB-CATEGORY IN WHICH IT COMPETES
IN-GROUND SWIMMING POOLS COVERSLINERS
_______________________
Source: Management’s analysis based on information from studies by a third-party research consulting firm commissioned by the Company and
management’s knowledge as market participants.
1 1
50%+MARKET SHARE OF THE
FIBERGLASS CATEGORY MORE
THAN FOUR TIMES NEXT
LARGEST COMPETITOR
~185KREPLACEMENT VINYL
LINERS PURCHASED EVERY
YEAR FOR THE ~1.6M VINYL
POOLS IN THE U.S.
8-10 YEARSFREQUENT REPLACEMENT
NEED INCREASES DEMAND
FOR LATHAM LINERS
70%SAVINGS IN
HEATING COSTS
50%REDUCTION IN
ELECTRICITY COSTS
97FIBERGLASS MOLD
OPTIONS IN PORTFOLIO
TAIL
1
TAILTAIL
6
FAVORABLE INDUSTRY STRUCTURE…
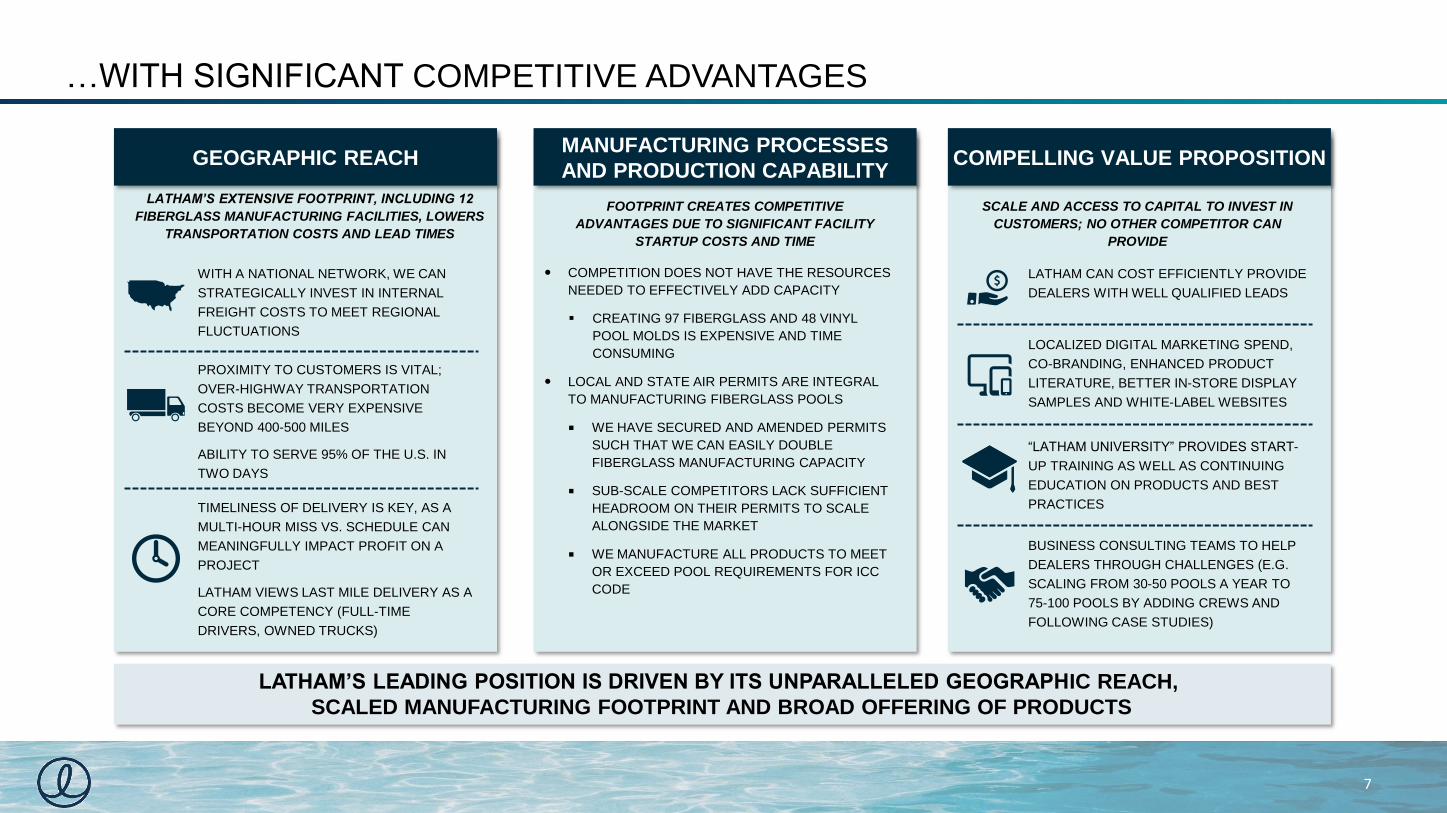
LATHAM’S LEADING POSITION IS DRIVEN BY ITS UNPARALLELED GEOGRAPHIC REACH,
SCALED MANUFACTURING FOOTPRINT AND BROAD OFFERING OF PRODUCTS
GEOGRAPHIC REACH COMPELLING VALUE PROPOSITIONMANUFACTURING PROCESSES
AND PRODUCTION CAPABILITY
LATHAM’S EXTENSIVE FOOTPRINT, INCLUDING 12
FIBERGLASS MANUFACTURING FACILITIES, LOWERS
TRANSPORTATION COSTS AND LEAD TIMES
FOOTPRINT CREATES COMPETITIVE
ADVANTAGES DUE TO SIGNIFICANT FACILITY
STARTUP COSTS AND TIME
SCALE AND ACCESS TO CAPITAL TO INVEST IN
CUSTOMERS; NO OTHER COMPETITOR CAN
PROVIDE
COMPETITION DOES NOT HAVE THE RESOURCES
NEEDED TO EFFECTIVELY ADD CAPACITY
▪ CREATING 97 FIBERGLASS AND 48 VINYL
POOL MOLDS IS EXPENSIVE AND TIME
CONSUMING
LOCAL AND STATE AIR PERMITS ARE INTEGRAL
TO MANUFACTURING FIBERGLASS POOLS
WE HAVE SECURED AND AMENDED PERMITS
SUCH THAT WE CAN EASILY DOUBLE
FIBERGLASS MANUFACTURING CAPACITY
SUB-SCALE COMPETITORS LACK SUFFICIENT
HEADROOM ON THEIR PERMITS TO SCALE
ALONGSIDE THE MARKET
WE MANUFACTURE ALL PRODUCTS TO MEET
OR EXCEED POOL REQUIREMENTS FOR ICC
CODE
WITH A NATIONAL NETWORK, WE CAN
STRATEGICALLY INVEST IN INTERNAL
FREIGHT COSTS TO MEET REGIONAL
FLUCTUATIONS
PROXIMITY TO CUSTOMERS IS VITAL;
OVER-HIGHWAY TRANSPORTATION
COSTS BECOME VERY EXPENSIVE
BEYOND 400-500 MILES
ABILITY TO SERVE 95% OF THE U.S. IN
TWO DAYS
TIMELINESS OF DELIVERY IS KEY, AS A
MULTI-HOUR MISS VS. SCHEDULE CAN
MEANINGFULLY IMPACT PROFIT ON A
PROJECT
LATHAM VIEWS LAST MILE DELIVERY AS A
CORE COMPETENCY (FULL-TIME
DRIVERS, OWNED TRUCKS)
LATHAM CAN COST EFFICIENTLY PROVIDE
DEALERS WITH WELL QUALIFIED LEADS
LOCALIZED DIGITAL MARKETING SPEND,
CO-BRANDING, ENHANCED PRODUCT
LITERATURE, BETTER IN-STORE DISPLAY
SAMPLES AND WHITE-LABEL WEBSITES
“LATHAM UNIVERSITY” PROVIDES START-
UP TRAINING AS WELL AS CONTINUING
EDUCATION ON PRODUCTS AND BEST
PRACTICES
BUSINESS CONSULTING TEAMS TO HELP
DEALERS THROUGH CHALLENGES (E.G.
SCALING FROM 30-50 POOLS A YEAR TO
75-100 POOLS BY ADDING CREWS AND
FOLLOWING CASE STUDIES)
7
…WITH SIGNIFICANT COMPETITIVE ADVANTAGES
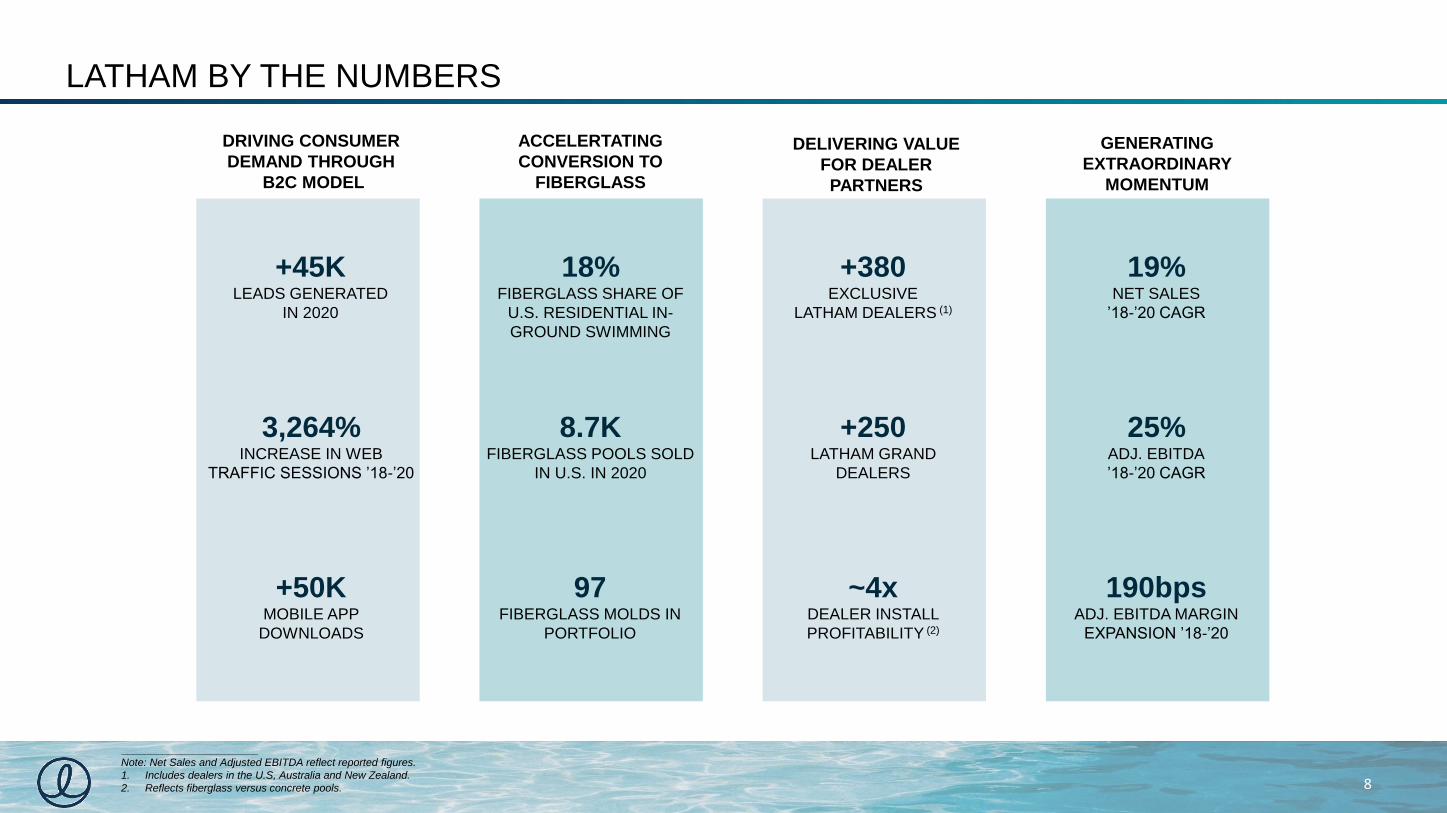
LATHAM BY THE NUMBERS
DRIVING CONSUMER
DEMAND THROUGH
B2C MODEL
DELIVERING VALUE
FOR DEALER
PARTNERS
GENERATING
EXTRAORDINARY
MOMENTUM
ACCELERTATING
CONVERSION TO
FIBERGLASS
18%FIBERGLASS SHARE OF
U.S. RESIDENTIAL IN-
GROUND SWIMMING
8.7KFIBERGLASS POOLS SOLD
IN U.S. IN 2020
19%NET SALES
’18-’20 CAGR
25%ADJ. EBITDA
’18-’20 CAGR
190bpsADJ. EBITDA MARGIN
EXPANSION ’18-’20
+45KLEADS GENERATED
IN 2020
+250LATHAM GRAND
DEALERS
3,264%INCREASE IN WEB
TRAFFIC SESSIONS ’18-’20
+50KMOBILE APP
DOWNLOADS
~4xDEALER INSTALL
PROFITABILITY (2)
+380EXCLUSIVE
LATHAM DEALERS (1)
8
97FIBERGLASS MOLDS IN
PORTFOLIO
_______________________
Note: Net Sales and Adjusted EBITDA reflect reported figures.
1. Includes dealers in the U.S, Australia and New Zealand.
2. Reflects fiberglass versus concrete pools.

LATHAM’S COMMITMENT TO ESG EXCELLENCE
SUSTAINABILITY
SOCIAL IMPACT CORPORATE GOVERNANCE
FOCUS ON SAFETY
OUR PRODUCTS SAVE WATER AND ENERGY
AUTOMATIC SAFETY COVERS LEAD TO ~90% REDUCTION IN WATER EVAPORATION AND OVER
50% REDUCTION IN ENERGY USAGE
FIBERGLASS PENETRATION REDUCES POLLUTION
FIBERGLASS SHARE INCREASES COMPRESS DEMAND FOR CEMENT, THE THIRD LARGEST
SOURCE OF INDUSTRIALPOLLUTION (1)
________________
1. United States Environmental Protection Agency.
OUR PRODUCTS SAVE LIVES
AUTOMATIC SAFETY COVERS ENFORCE THE HIGHEST LEVEL OF SAFETY FOR CHILDREN
AND PETS
CREATING AND ADHERING TO INDUSTRY STANDARDS
THE DESIGN OF POOLS PLAYS A KEY ROLE IN CONSUMER SAFETY
BEST-IN-CLASS WORKFORCE SAFETY
LONGSTANDING COMMITMENT TO ENSURING A SAFE WORK
ENVIRONMENT
ACCOUNTABILITY
BOARD-LEVEL OVERSIGHT OF AND COMMITMENT TO SUSTAINABILITY,
SOCIAL IMPACT & STRONG GOVERNANCE
SEPARATION OF CHAIRMAN & CEO
EXAMPLE OF COMMITMENT TO BEST PRACTICES IN CORPORATE GOVERNANCE
EXPERIENCED PERSPECTIVE
HIGH QUALITY BOARD OF DIRECTORS COMPRISED OF VISIONARY LEADERS OF BRANDED,
DISRUPTIVE BUSINESSES AND EXPERIENCED, SUCCESSFUL, LONG-TERM INVESTORS
CLEAN, "CHEMICAL-LIGHT" WATER
FIBERGLASS POOLS DECREASE ALGAE AND REDUCE CHEMICAL NEEDS
ENGAGEMENT • SAFETY • RESPECT INCLUSION • INTEGRITY • PRIDE
GROWING FEMALE REPRESENTATION
~50% ACROSS MULTIPLE FUNCTIONS, AND PROGRESSING IN OTHERS
MADE IN AMERICA
ALL OF OUR DOMESTIC PRODUCTS ARE MANUFACTURED IN THE USA
DIVERSITY AND INCLUSION
>50% OF LATHAM WORKFORCE COMPRISED OF UNDERREPRESENTED
MINORITIES
9
COMMITTED TO SERVING OUR
COMMUNITIES AND THE
ENVIRONMENT

GROWTH STRATEGY
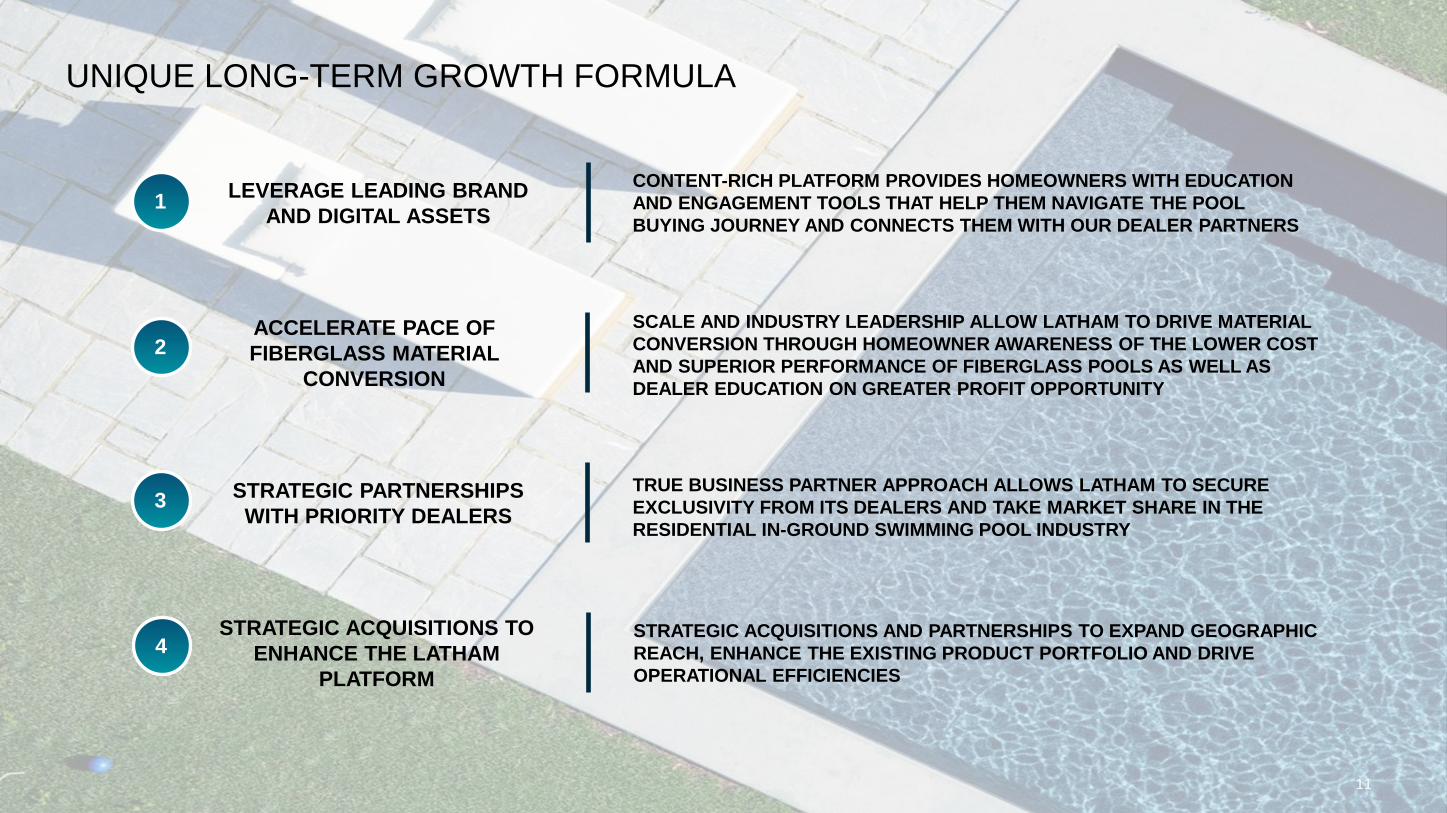
UNIQUE LONG-TERM GROWTH FORMULA
CONTENT-RICH PLATFORM PROVIDES HOMEOWNERS WITH EDUCATION
AND ENGAGEMENT TOOLS THAT HELP THEM NAVIGATE THE POOL
BUYING JOURNEY AND CONNECTS THEM WITH OUR DEALER PARTNERS
LEVERAGE LEADING BRAND
AND DIGITAL ASSETS
ACCELERATE PACE OF
FIBERGLASS MATERIAL
CONVERSION
STRATEGIC PARTNERSHIPS
WITH PRIORITY DEALERS
SCALE AND INDUSTRY LEADERSHIP ALLOW LATHAM TO DRIVE MATERIAL
CONVERSION THROUGH HOMEOWNER AWARENESS OF THE LOWER COST
AND SUPERIOR PERFORMANCE OF FIBERGLASS POOLS AS WELL AS
DEALER EDUCATION ON GREATER PROFIT OPPORTUNITY
TRUE BUSINESS PARTNER APPROACH ALLOWS LATHAM TO SECURE
EXCLUSIVITY FROM ITS DEALERS AND TAKE MARKET SHARE IN THE
RESIDENTIAL IN-GROUND SWIMMING POOL INDUSTRY
STRATEGIC ACQUISITIONS AND PARTNERSHIPS TO EXPAND GEOGRAPHIC
REACH, ENHANCE THE EXISTING PRODUCT PORTFOLIO AND DRIVE
OPERATIONAL EFFICIENCIES
STRATEGIC ACQUISITIONS TO
ENHANCE THE LATHAM
PLATFORM
1
2
3
4
11
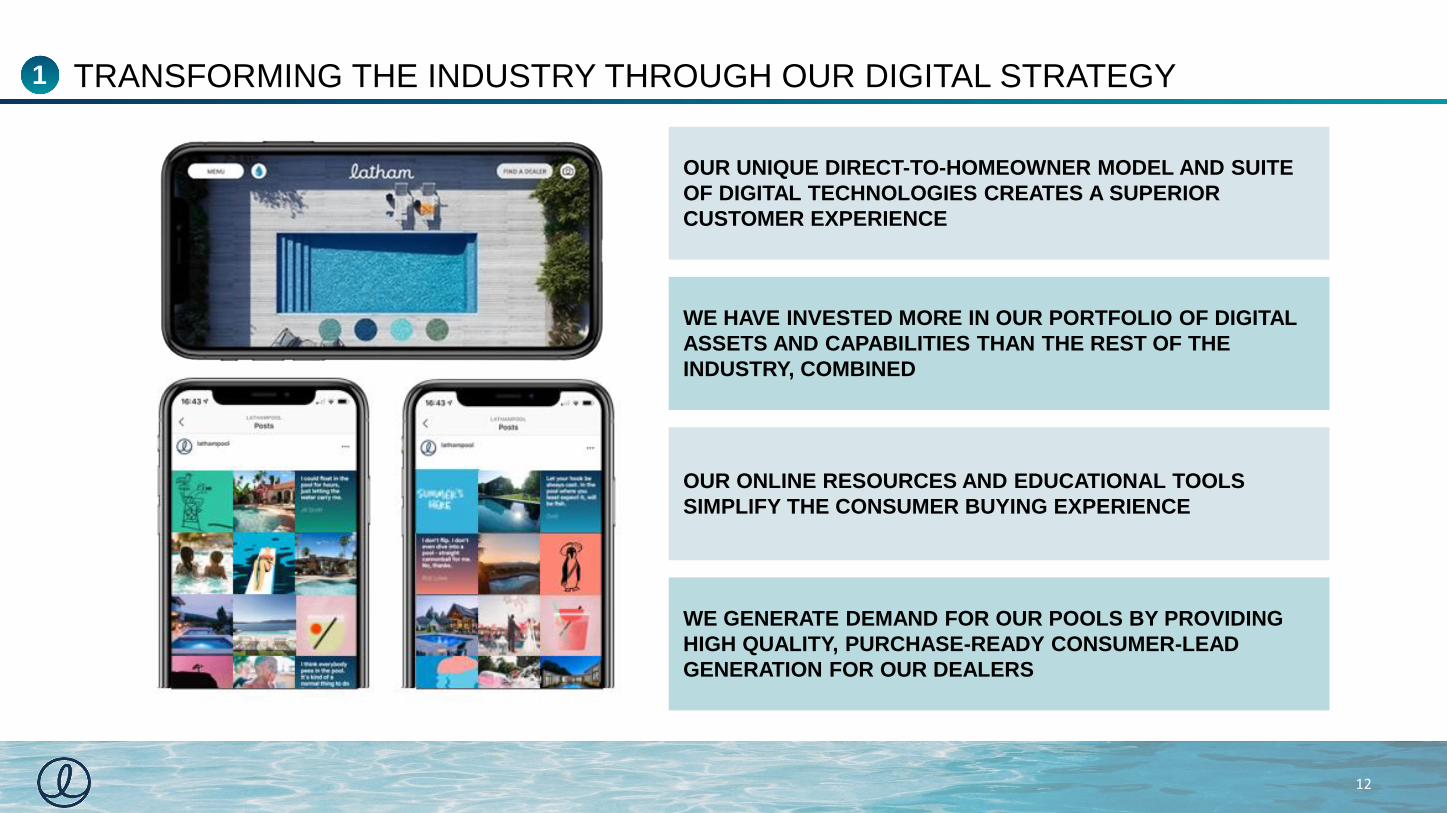
WE HAVE INVESTED MORE IN OUR PORTFOLIO OF DIGITAL
ASSETS AND CAPABILITIES THAN THE REST OF THE
INDUSTRY, COMBINED
OUR ONLINE RESOURCES AND EDUCATIONAL TOOLS
SIMPLIFY THE CONSUMER BUYING EXPERIENCE
WE GENERATE DEMAND FOR OUR POOLS BY PROVIDING
HIGH QUALITY, PURCHASE-READY CONSUMER-LEAD
GENERATION FOR OUR DEALERS
OUR UNIQUE DIRECT-TO-HOMEOWNER MODEL AND SUITE
OF DIGITAL TECHNOLOGIES CREATES A SUPERIOR
CUSTOMER EXPERIENCE
12
1 TRANSFORMING THE INDUSTRY THROUGH OUR DIGITAL STRATEGY
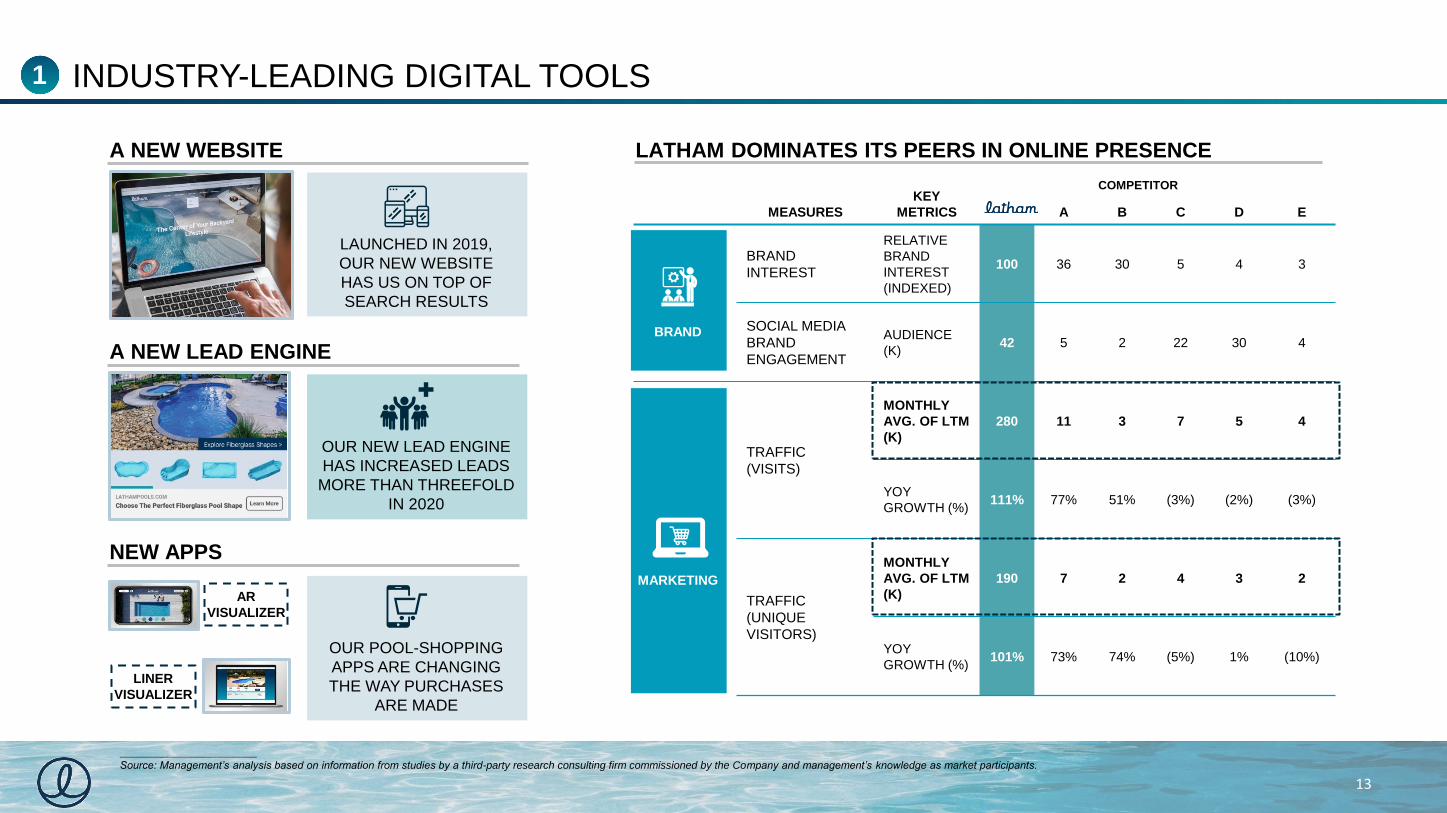
INDUSTRY-LEADING DIGITAL TOOLS
A NEW WEBSITE
LAUNCHED IN 2019,
OUR NEW WEBSITE
HAS US ON TOP OF
SEARCH RESULTS
A NEW LEAD ENGINE
NEW APPS
OUR NEW LEAD ENGINE
HAS INCREASED LEADS
MORE THAN THREEFOLD
IN 2020
OUR POOL-SHOPPING
APPS ARE CHANGING
THE WAY PURCHASES
ARE MADE
AR
VISUALIZER
LINER
VISUALIZER
MEASURES
KEY
METRICS A B C D E
BRAND
INTEREST
RELATIVE
BRAND
INTEREST
(INDEXED)
100 36 30 5 4 3
SOCIAL MEDIA
BRAND
ENGAGEMENT
AUDIENCE
(K)42 5 2 22 30 4
TRAFFIC
(VISITS)
MONTHLY
AVG. OF LTM
(K)
280 11 3 7 5 4
YOY
GROWTH (%)111% 77% 51% (3%) (2%) (3%)
TRAFFIC
(UNIQUE
VISITORS)
MONTHLY
AVG. OF LTM
(K)
190 7 2 4 3 2
YOY
GROWTH (%)101% 73% 74% (5%) 1% (10%)
LATHAM DOMINATES ITS PEERS IN ONLINE PRESENCE
BRAND
MARKETING
COMPETITOR
_______________________
Source: Management’s analysis based on information from studies by a third-party research consulting firm commissioned by the Company and management’s knowledge as market participants.
13
1
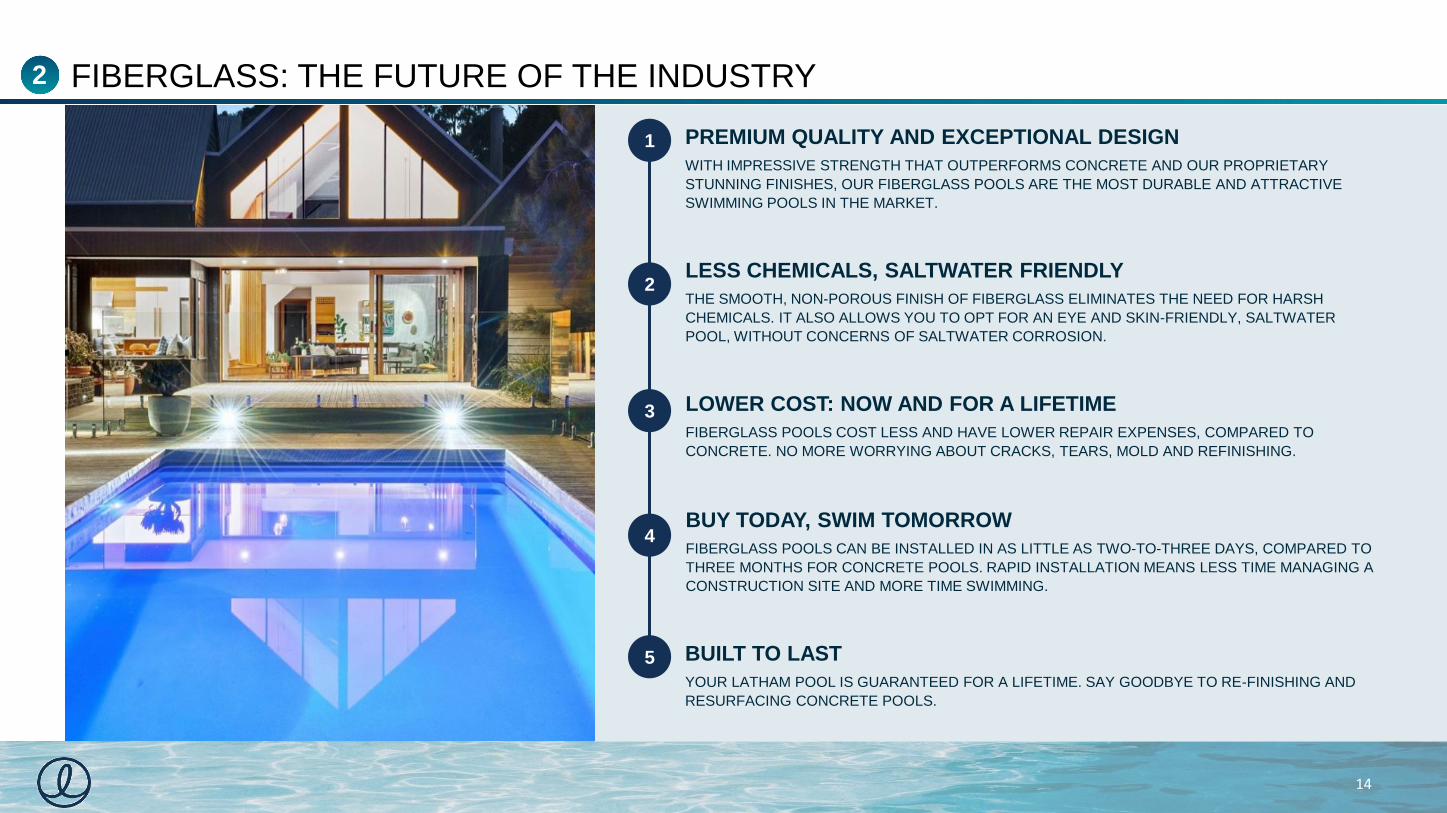
PREMIUM QUALITY AND EXCEPTIONAL DESIGN
WITH IMPRESSIVE STRENGTH THAT OUTPERFORMS CONCRETE AND OUR PROPRIETARY
STUNNING FINISHES, OUR FIBERGLASS POOLS ARE THE MOST DURABLE AND ATTRACTIVE
SWIMMING POOLS IN THE MARKET.
BUY TODAY, SWIM TOMORROW
FIBERGLASS POOLS CAN BE INSTALLED IN AS LITTLE AS TWO-TO-THREE DAYS, COMPARED TO
THREE MONTHS FOR CONCRETE POOLS. RAPID INSTALLATION MEANS LESS TIME MANAGING A
CONSTRUCTION SITE AND MORE TIME SWIMMING.
BUILT TO LAST
YOUR LATHAM POOL IS GUARANTEED FOR A LIFETIME. SAY GOODBYE TO RE-FINISHING AND
RESURFACING CONCRETE POOLS.
LESS CHEMICALS, SALTWATER FRIENDLY
THE SMOOTH, NON-POROUS FINISH OF FIBERGLASS ELIMINATES THE NEED FOR HARSH
CHEMICALS. IT ALSO ALLOWS YOU TO OPT FOR AN EYE AND SKIN-FRIENDLY, SALTWATER
POOL, WITHOUT CONCERNS OF SALTWATER CORROSION.
1
2
4
5
LOWER COST: NOW AND FOR A LIFETIME
FIBERGLASS POOLS COST LESS AND HAVE LOWER REPAIR EXPENSES, COMPARED TO
CONCRETE. NO MORE WORRYING ABOUT CRACKS, TEARS, MOLD AND REFINISHING.
3
14
FIBERGLASS: THE FUTURE OF THE INDUSTRY2

+43% SAVINGS
IN TOTAL
LIFECYCLE
UPKEEP COSTS
ACCELERATING CONVERSION
FIBERGLASS POOLS OFFER A SUPERIOR VALUE PROPOSITION THAT IS UNDERPINNED BY, LOWER UP-FRONT AND TOTAL
LIFECYCLE COSTS FOR THE HOMEOWNER AND ATTRACTIVE ECONOMICS FOR THE DEALER
_______________________
Source: Management’s analysis based on information from studies by a third-party research consulting firm commissioned by the Company and management’s knowledge as market participants.
Note: Assumes pool of a certain size, with all other conditions being the same; Assumes ‘certain number of working days per year with one pool building crew; certain number of days per installation of each
type of pool, resulting in certain number of pool installations per year for each type of pool. Assumes pool of a certain size, with all other conditions being the same.
FIBERGLASS IS BUILT TO LAST
15
LOWER COST: NOW AND FOR A LIFETIME
FIBERGLASS VINYL CONCRETE
~$54,000 ~$37,500 ~$75,000
- 1 1
~$10,500 ~$19,000 ~$38,100
~$64,500 ~$56,500 ~$113,100
#3 #2
UPFRONT COST
# OF MAJOR REPAIRS
10-YEAR MAINTENANCE
TOTAL 10-YEAR COST
LIFETIME WARRANTY
CUSTOMER SATISFACTION
FIBERGLASS VINYL CONCRETE
1 WEEK 1 MONTH 3 MONTHS
~125 POOLS ~35 POOLS ~20 POOLS
3 PEOPLE 6-8 PEOPLE 8-10 PEOPLE
$5-10K $5-10K $5-15K
~$1.25MM ~$350K ~$300K
TOTAL PROJECT TIME
1-YEAR INSTALL CAPACITY
LABOR CREW
PROFIT PER POOL
INSTALL PROFITABILITY
INSTALLER ECONOMICS
HOMEOWNER ECONOMICS
1
+28% SAVINGS
IN UP FRONT
COSTS
LATHAM’S SUPERIOR VALUE PROPOSITION2

(% OF RESIDENTIAL IN-GROUND SWIMMING POOLS)
4%9% 12%
16% 18%25%
PRE-2000A
2000-2009A
2010-2018A
2019A 2020E 2023E
35%40%
15%
40%
52%
70%
2020EFRANCE
2020ESPAIN
1990A 2000A 2010A 2020E
(% OF RESIDENTIAL IN-GROUND SWIMMING POOLS)
AUSTRALIA
FIBERGLASS SHARE OF U.S. POOL INSTALLATIONS INTERNATIONAL FIBERGLASS MARKET PENETRATION
_______________________
Source: Management’s analysis based on information from studies by a third-party research consulting firm commissioned by the Company,
management’s knowledge as market participants and P.K. Data
“FIBERGLASS POOLS HAVE HAD A TRANSFORMATIONAL IMPACT ON THE AUSTRALIAN MARKET,
RESULTING IN AN OVER 70% FIBERGLASS PENETRATION LEVEL” – CHRIS MEYER, NARELLAN POOLS
16
SIGNIFICANT OPPORTUNITY TO ACCELERATE MATERIAL CONVERSION TO FIBERGLASS IN THE U.S.2
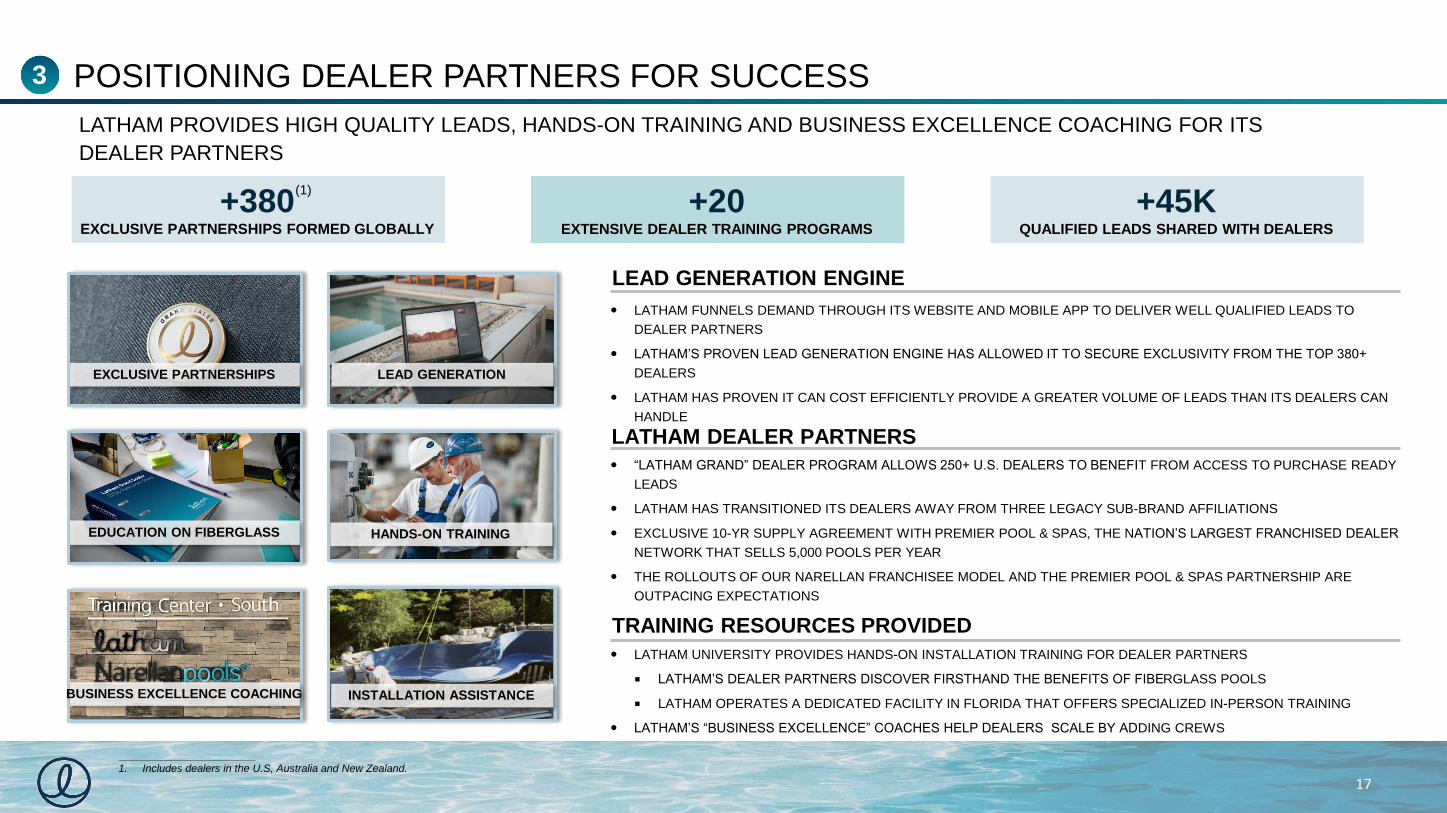
+380EXCLUSIVE PARTNERSHIPS FORMED GLOBALLY
“LATHAM GRAND” DEALER PROGRAM ALLOWS 250+ U.S. DEALERS TO BENEFIT FROM ACCESS TO PURCHASE READY
LEADS
LATHAM HAS TRANSITIONED ITS DEALERS AWAY FROM THREE LEGACY SUB-BRAND AFFILIATIONS
EXCLUSIVE 10-YR SUPPLY AGREEMENT WITH PREMIER POOL & SPAS, THE NATION’S LARGEST FRANCHISED DEALER
NETWORK THAT SELLS 5,000 POOLS PER YEAR
THE ROLLOUTS OF OUR NARELLAN FRANCHISEE MODEL AND THE PREMIER POOL & SPAS PARTNERSHIP ARE
OUTPACING EXPECTATIONS
LATHAM DEALER PARTNERS
LATHAM PROVIDES HIGH QUALITY LEADS, HANDS-ON TRAINING AND BUSINESS EXCELLENCE COACHING FOR ITS
DEALER PARTNERS
LATHAM UNIVERSITY PROVIDES HANDS-ON INSTALLATION TRAINING FOR DEALER PARTNERS
LATHAM’S DEALER PARTNERS DISCOVER FIRSTHAND THE BENEFITS OF FIBERGLASS POOLS
LATHAM OPERATES A DEDICATED FACILITY IN FLORIDA THAT OFFERS SPECIALIZED IN-PERSON TRAINING
LATHAM’S “BUSINESS EXCELLENCE” COACHES HELP DEALERS SCALE BY ADDING CREWS
TRAINING RESOURCES PROVIDED
EDUCATION ON FIBERGLASS
EXCLUSIVE PARTNERSHIPS
HANDS-ON TRAINING
INSTALLATION ASSISTANCE
LEAD GENERATION
LATHAM FUNNELS DEMAND THROUGH ITS WEBSITE AND MOBILE APP TO DELIVER WELL QUALIFIED LEADS TO
DEALER PARTNERS
LATHAM’S PROVEN LEAD GENERATION ENGINE HAS ALLOWED IT TO SECURE EXCLUSIVITY FROM THE TOP 380+
DEALERS
LATHAM HAS PROVEN IT CAN COST EFFICIENTLY PROVIDE A GREATER VOLUME OF LEADS THAN ITS DEALERS CAN
HANDLE
LEAD GENERATION ENGINE
BUSINESS EXCELLENCE COACHING
17
+20EXTENSIVE DEALER TRAINING PROGRAMS
+45KQUALIFIED LEADS SHARED WITH DEALERS
(1)
_______________________
1. Includes dealers in the U.S, Australia and New Zealand.
POSITIONING DEALER PARTNERS FOR SUCCESS3

STRATEGICALLY
EXPAND U.S. AND
INTERNATIONAL
FOOTPRINT
SEEK HIGH QUALITY
BUSINESSES WITH
COMPLEMENTARY
OFFERINGS
FOCUS ON THE
CONSUMER EXPERIENCE
THROUGH SHARED
TECHNOLOGY AND BEST
PRACTICES
TARGET COMPANIES WITH
HIGH GROWTH AND
STRONG MARGINS
LATHAM HAS A HISTORY OF SUCCESSFUL M&A INTEGRATION AND HAS AMPLE OPPORTUNITY FOR
ADDITIONAL ADD-ONS GIVEN INDUSTRY FRAGMENTATION
_______________________
Source: Management estimates.
#1 LEADING
DIRECT-TO-CONSUMER
POOL BRAND
800
REGIONAL AND LOCAL
FIBERGLASS RETAILERS
TAIL
0%
20%
40%
60%
80%
100%
FIBERGLASS REPLACEMENT LINERS AUTO COVER VINYL POOLS
#1 LEADING
MARKET SHARE WITH ROOM
FOR CONTINUED GROWTH
TAILTAIL
18
EXECUTE AND INTEGRATE STRATEGIC ACQUISITIONS4
A CLEAR M&A FRAMEWORK… …WITH A SUCCESSFUL TRACK RECORD OF M&A…
…IN A FRAGMENTED INDUSTRY

FINANCIAL HIGHLIGHTS

NET SALES ADJ. EBITDA AND ADJ. EBITDA MARGIN
$247$265
$287
$318
$403
$463
2016A 2017A 2018A 2019A 2020A PF2020A
$39
$47
$54
$61
$84
15.8%
17.8%
18.8%19.2%
20.8%
2016A 2017A 2018A 2019A 2020A
($ IN MILLIONS) ($ IN MILLIONS)
OUR FIBERGLASS POOL SALES HAVE GROWN AT A 27% CAGR FROM 2016 TO 2020
_______________________
Note: Net Sales and Adjusted EBITDA reflect reported figures.
1. Reflects organic figures, excluding the impact of GLI and Narellan.
2. Pro forma for full year of GLI.
(2)
20
LATHAM IS DRIVING EXTRAORDINARY GROWTH

2Q21 AND 1H21 FINANCIAL HIGHLIGHTS
2Q21 FINANCIAL HIGHLIGHTS:
NET SALES GREW $68.1 MILLION OR 60.3% TO $180.9
MILLION, DRIVEN BY:
o INCREASED ORDER VOLUME
o EXPANDED STRATEGIC PARTNERSHIPS WITH LATHAM’S
EXCLUSIVE DEALERS
o ACQUISITION OF GLI
o PRICE INCREASES
TRANSLATED TO STRONG ADJUSTED EBITDA GROWTH,
REACHING $42.8 MILLION in 2Q21, UP $9.7 MILLION YEAR-
OVER-YEAR
1H21 FINANCIAL HIGHLIGHTS:
NET SALES GREW $165.6 MILLION OR 101.1% to $329.6
MILLION
ADJUSTED EBITDA OF $76.4 MILLION, UP 144.7% YEAR-
OVER-YEAR, REPRESENTING A 23.2% ADJUSTED EBITDA
MARGIN
ANNOUNCED THE CONSTRUCTION OF A NEW FIBERGLASS
POOL MANUFACTURING PLANT IN KINGSTON, ONTARIO
RAISED LOWER END OF FISCAL YEAR 2021 NET SALES AND
ADJUSTED EBITDA GUIDANCE
21
$112.8
$33.1
($ IN MILLIONS)
2Q20 2Q21 2Q20 2Q21
Q2 NET SALES
$180.9
$42.8
($ IN MILLIONS)
Q2 ADJUSTED EBITDA
$164.0 $31.2
($ IN MILLIONS)
1H20 1H21 1H20 1H21
1H NET SALES
$329.6
$76.4
($ IN MILLIONS)
1H ADJUSTED EBITDA
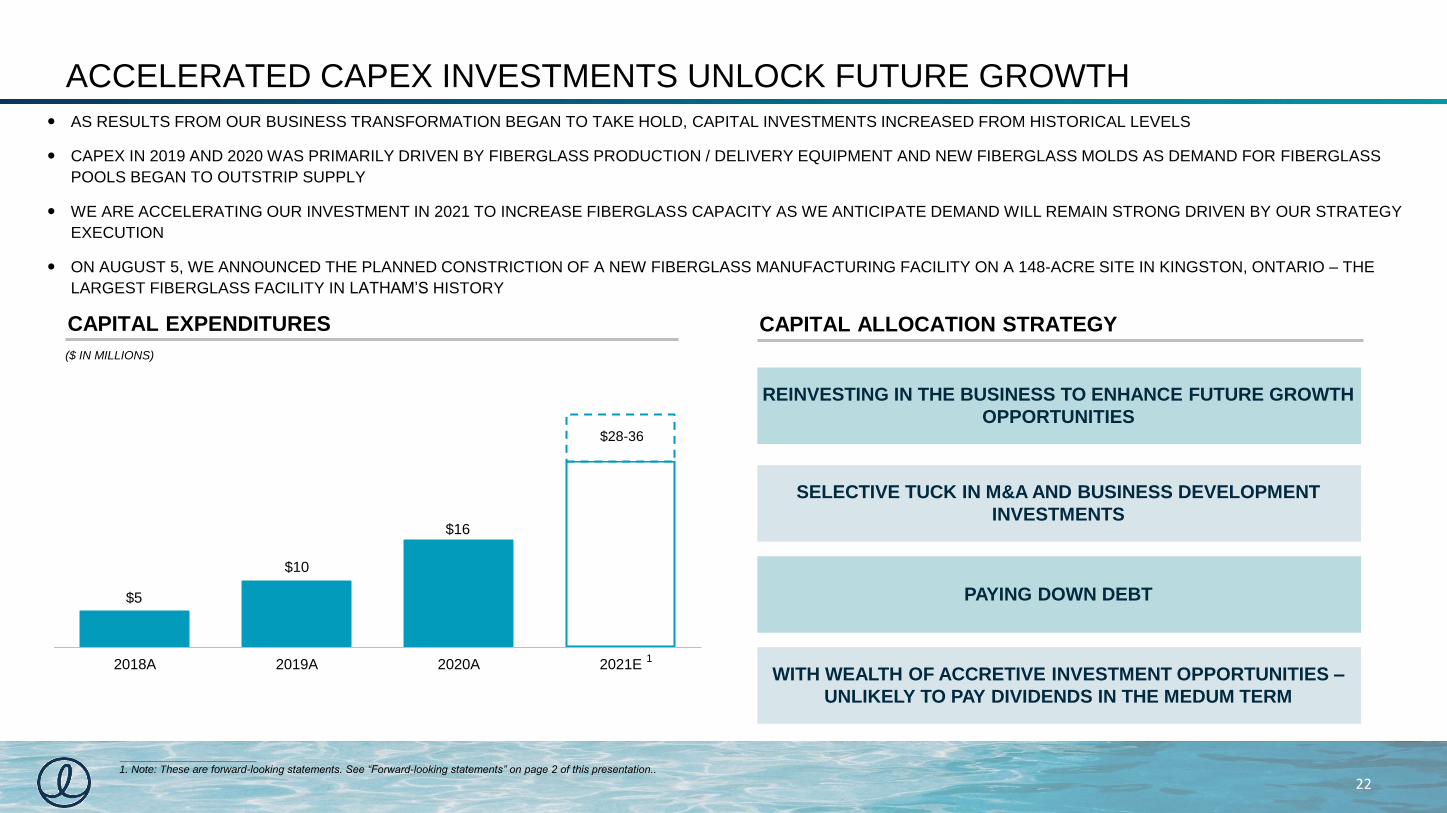
ACCELERATED CAPEX INVESTMENTS UNLOCK FUTURE GROWTH
22
AS RESULTS FROM OUR BUSINESS TRANSFORMATION BEGAN TO TAKE HOLD, CAPITAL INVESTMENTS INCREASED FROM HISTORICAL LEVELS
CAPEX IN 2019 AND 2020 WAS PRIMARILY DRIVEN BY FIBERGLASS PRODUCTION / DELIVERY EQUIPMENT AND NEW FIBERGLASS MOLDS AS DEMAND FOR FIBERGLASS
POOLS BEGAN TO OUTSTRIP SUPPLY
WE ARE ACCELERATING OUR INVESTMENT IN 2021 TO INCREASE FIBERGLASS CAPACITY AS WE ANTICIPATE DEMAND WILL REMAIN STRONG DRIVEN BY OUR STRATEGY
EXECUTION
ON AUGUST 5, WE ANNOUNCED THE PLANNED CONSTRICTION OF A NEW FIBERGLASS MANUFACTURING FACILITY ON A 148-ACRE SITE IN KINGSTON, ONTARIO – THE
LARGEST FIBERGLASS FACILITY IN LATHAM’S HISTORY
$5
$10
$16
2018A 2019A 2020A 2021E
CAPITAL EXPENDITURES
($ IN MILLIONS)
$28-36
SELECTIVE TUCK IN M&A AND BUSINESS DEVELOPMENT
INVESTMENTS
REINVESTING IN THE BUSINESS TO ENHANCE FUTURE GROWTH
OPPORTUNITIES
PAYING DOWN DEBT
WITH WEALTH OF ACCRETIVE INVESTMENT OPPORTUNITIES –
UNLIKELY TO PAY DIVIDENDS IN THE MEDUM TERM
CAPITAL ALLOCATION STRATEGY
1
_______________________
1. Note: These are forward-looking statements. See “Forward-looking statements” on page 2 of this presentation..

• LATHAM IS A STRONG CASH FLOW GENERATOR WITH A HISTORY OF DELEVERAGING THE BALANCE SHEET AND WE
EXPECT THAT TREND TO CONTINUE THROUGH EBITDA AND CASH FLOW GROWTH
CAPITALIZATION SUMMARY
_______________________
1. On January 25, 2021, in connection with the 2021 Financing Transactions, we entered into a third amendment to the Term Loan to borrow an additional $175.0 million.
2. As of December 31, 2020, no amount was drawn, and we had $30.0 million of availability under the Revolving Credit Facility.
3. The Parent Note bore interest at 0.15% per annum and was due on October 20, 2023. The Parent Note was settled in full on February 2, 2021 with the proceeds from the Amended Term
Loan.
4. Calculated by subtracting cash from total debt
5. LTM Adjusted EBITDA is the sum of the Company’s Adjusted EBITDA for the four fiscal quarter ended July 3, 2021 and December 31, 2020, respectively.
23
CAPITAL STRUCTURE SUMMARY
($ IN MILLIONS)
As of
December 31, 2020
As of
July 3, 2021
CASH $59 $77
AMENDED TERM LOAN (1) $221 $237
REVOLVING CREDIT FACILITY (2) - -
PARENT NOTE (3) $65 -
TOTAL DEBT $286 $237
NET DEBT (4) $227 $160
LTM ADJ. EBITDA (5) $84 $128
CREDIT STATISTICS
TOTAL DEBT / LTM ADJ. EBITDA 3.4x 1.9x
NET DEBT / LTM ADJ. EBITDA 2.7x 1.3x

FINANCIAL OUTLOOK
24
FISCAL 2021 OUTLOOK1
ADJUSTED EBITDA
$130 MILLION TO $138 MILLION
NET SALES
$600 MILLION - $620 MILLION
CAPITAL EXPENDITURES
$28 MILLION TO $36 MILLION
OUTLOOK REFLECTS STRONG FIRST HALF FINANCIAL
RESULTS AND OUR OPTIMISM IN ABILITY TO CONTINUE TO
DRIVE THE MATERIAL CONVERSION TO FIBERGLASS,
LEVERAGE OUR UNIQUE DIRECT-TO-HOMEOWNER DIGITAL
STRATEGIES TO GENERATE LEADS FOR DEALERS,
CAPITALIZE ON POSITIVE TRENDS IN OUTDOOR LIVING
AND MANAGE SUPPLY CHAIN AND INFLATIONARY-RELATED
HEADWINDS
THREE TO FIVE YEAR TARGETS2
ADJUSTED EBITDA GROWTH
12-15%
NET SALES GROWTH
10-12%
ADJUSTED EBITDA MARGIN
+500 BPS
THESE TARGETS ARE DRIVEN BY OUR CONSUMER-DRIVEN
STRATEGY, THE MATERIAL CONVERSION TO FIBERGLASS, OUR
CAPACITY INVESTMENTS AND OUR DISCIPLINED APPROACH TO
PRICE AND COST MANAGEMENT
_______________________
Note:
1. Represents guidance given by the Company as of August 5, 2021. These are forward-looking statements. See “Forward-looking statements” on page 2 of this presentation.
2. These are goals/targets and are not projections. These are forward-looking statements, which are subject to significant business, economic, regulatory and competitive uncertainties and contingencies, many of
which are beyond the control of the Company and its management, and are based upon assumptions with respect to future decisions, which are subject to change. Actual results will vary and those variations
may be material. Nothing in this presentation should be regarded as a representation by any person that these goals/targets will be achieved. See “Forward-looking statements” on page 2 of this presentation.
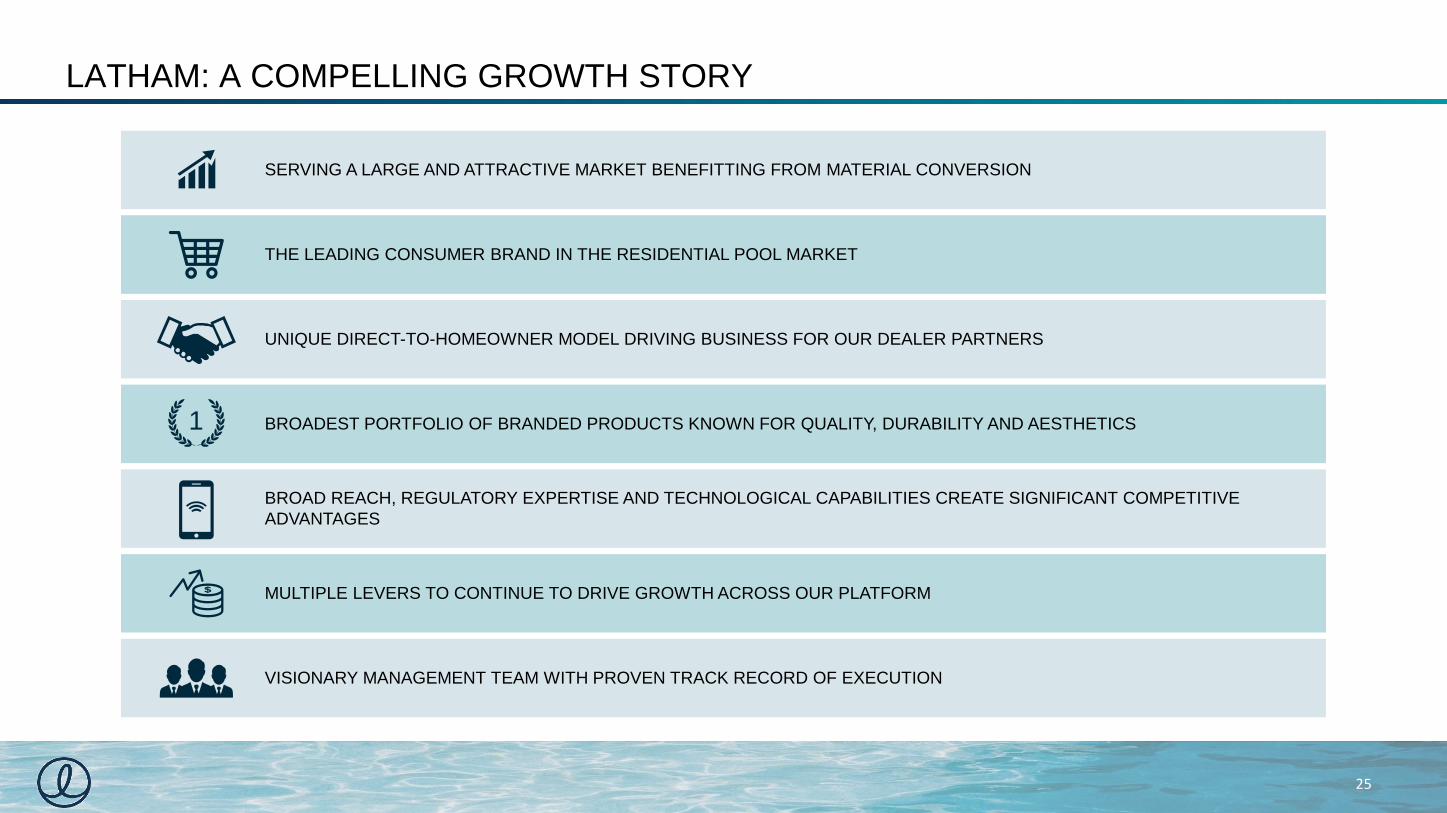
SERVING A LARGE AND ATTRACTIVE MARKET BENEFITTING FROM MATERIAL CONVERSION
THE LEADING CONSUMER BRAND IN THE RESIDENTIAL POOL MARKET
UNIQUE DIRECT-TO-HOMEOWNER MODEL DRIVING BUSINESS FOR OUR DEALER PARTNERS
BROAD REACH, REGULATORY EXPERTISE AND TECHNOLOGICAL CAPABILITIES CREATE SIGNIFICANT COMPETITIVE
ADVANTAGES
VISIONARY MANAGEMENT TEAM WITH PROVEN TRACK RECORD OF EXECUTION
BROADEST PORTFOLIO OF BRANDED PRODUCTS KNOWN FOR QUALITY, DURABILITY AND AESTHETICS
MULTIPLE LEVERS TO CONTINUE TO DRIVE GROWTH ACROSS OUR PLATFORM
1
25
LATHAM: A COMPELLING GROWTH STORY
APPENDIX
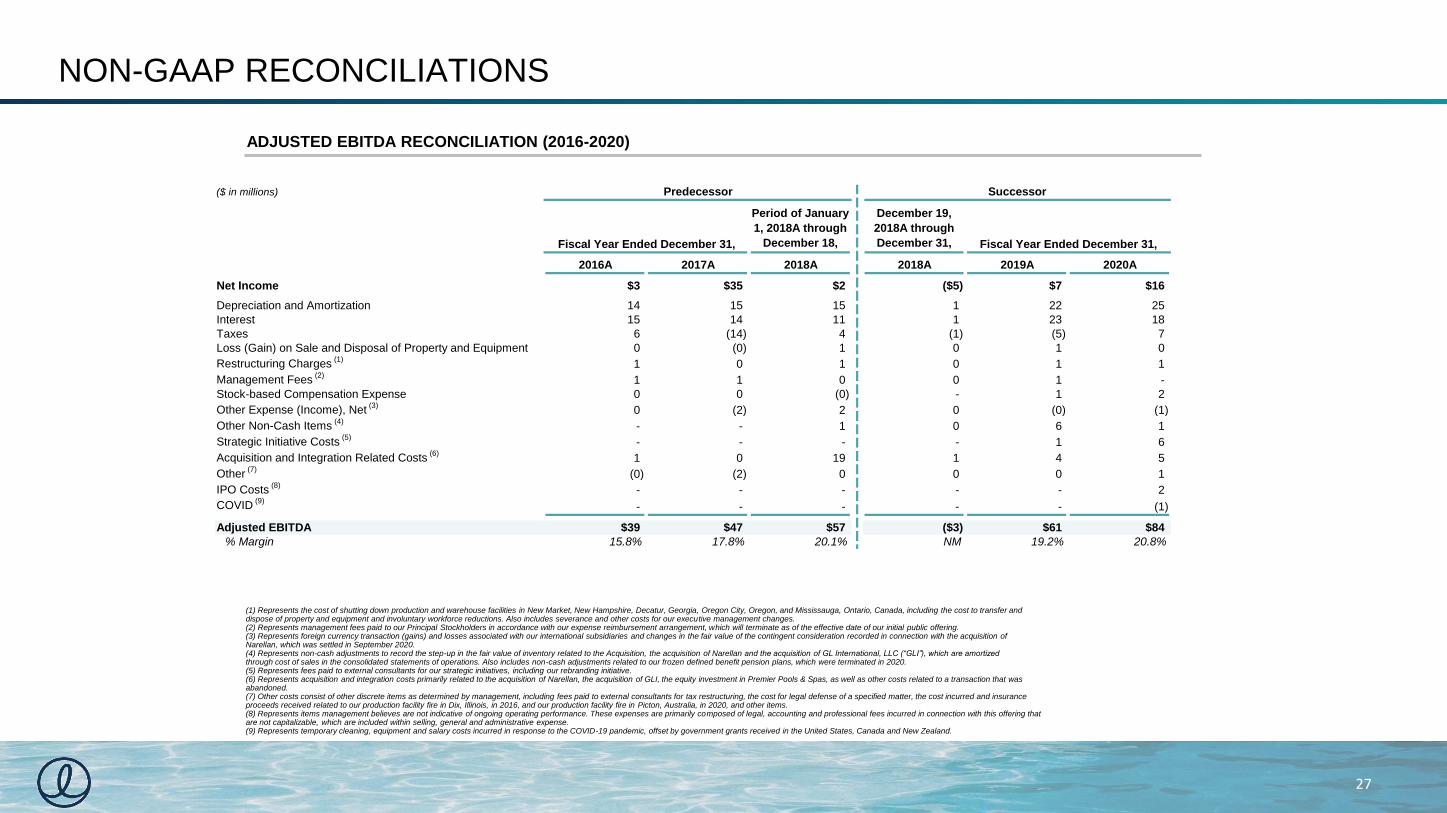
NON-GAAP RECONCILIATIONS
ADJUSTED EBITDA RECONCILIATION (2016-2020)
($ in millions) Predecessor Successor
Fiscal Year Ended December 31,
Period of January
1, 2018A through
December 18,
Period of
December 19,
2018A through
December 31, Fiscal Year Ended December 31,
2016A 2017A 2018A 2018A 2019A 2020A
Net Income $3 $35 $2 ($5) $7 $16
Depreciation and Amortization 14 15 15 1 22 25
Interest 15 14 11 1 23 18
Taxes 6 (14) 4 (1) (5) 7
Loss (Gain) on Sale and Disposal of Property and Equipment 0 (0) 1 0 1 0
Restructuring Charges (1)
1 0 1 0 1 1
Management Fees (2)
1 1 0 0 1 -
Stock-based Compensation Expense 0 0 (0) - 1 2
Other Expense (Income), Net (3)
0 (2) 2 0 (0) (1)
Other Non-Cash Items (4)
- - 1 0 6 1
Strategic Initiative Costs (5)
- - - - 1 6
Acquisition and Integration Related Costs (6)
1 0 19 1 4 5
Other (7)
(0) (2) 0 0 0 1
IPO Costs (8)
- - - - - 2
COVID (9)
- - - - - (1)
Adjusted EBITDA $39 $47 $57 ($3) $61 $84
% Margin 15.8% 17.8% 20.1% NM 19.2% 20.8%
(1) Represents the cost of shutting down production and warehouse facilities in New Market, New Hampshire, Decatur, Georgia, Oregon City, Oregon, and Mississauga, Ontario, Canada, including the cost to transfer anddispose of property and equipment and involuntary workforce reductions. Also includes severance and other costs for our executive management changes.(2) Represents management fees paid to our Principal Stockholders in accordance with our expense reimbursement arrangement, which will terminate as of the effective date of our initial public offering.(3) Represents foreign currency transaction (gains) and losses associated with our international subsidiaries and changes in the fair value of the contingent consideration recorded in connection with the acquisition ofNarellan, which was settled in September 2020.(4) Represents non-cash adjustments to record the step-up in the fair value of inventory related to the Acquisition, the acquisition of Narellan and the acquisition of GL International, LLC (“GLI”), which are amortizedthrough cost of sales in the consolidated statements of operations. Also includes non-cash adjustments related to our frozen defined benefit pension plans, which were terminated in 2020.(5) Represents fees paid to external consultants for our strategic initiatives, including our rebranding initiative.(6) Represents acquisition and integration costs primarily related to the acquisition of Narellan, the acquisition of GLI, the equity investment in Premier Pools & Spas, as well as other costs related to a transaction that wasabandoned.(7) Other costs consist of other discrete items as determined by management, including fees paid to external consultants for tax restructuring, the cost for legal defense of a specified matter, the cost incurred and insuranceproceeds received related to our production facility fire in Dix, Illinois, in 2016, and our production facility fire in Picton, Australia, in 2020, and other items.(8) Represents items management believes are not indicative of ongoing operating performance. These expenses are primarily composed of legal, accounting and professional fees incurred in connection with this offering thatare not capitalizable, which are included within selling, general and administrative expense.(9) Represents temporary cleaning, equipment and salary costs incurred in response to the COVID-19 pandemic, offset by government grants received in the United States, Canada and New Zealand.
27

NON-GAAP RECONCILIATIONS
ADJUSTED EBITDA RECONCILIATION (2Q20 and 2Q21; 1H20 and 1H21)
(1) Represents severance and other costs for our executive management changes.
(2) Represents foreign currency transaction (gains) and losses associated with our international subsidiaries and changes in the fair value of the contingent consideration recorded in connection with the acquisition of Narellan Group Pty Limited and its subsidiaries, which was settled in September 2020.
(3) Represents fees paid to external consultants for our strategic initiatives, including our rebranding initiative.
(4) Represents acquisition and integration costs primarily related to the acquisition of GL International, LLC (“GLI”) in October 2020, the equity investment in Premier Holdco, LLC in October 2020, as well as other costs related to a transaction that was abandoned.
(5) Other costs consist of other discrete items as determined by management, including (i) fees paid to external consultants for tax restructuring, (ii) the cost for legal defense of a specified matter, (iii) the cost incurred and insurance proceeds related to our production facility fire in Picton, Australia in 2020, (iv) temporary cleaning, equipment and salary costs incurred in response to the COVID-19 pandemic, offset by government grants received in the United States, Canada and New Zealand and (v) non-cash adjustments to record the step-up in the fair value of inventory related to the acquisition of GLI, which are amortized through cost of sales in the condensed consolidated statements of operations.
(6) Represents items management believes are not indicative of ongoing operating performance. These expenses are primarily composed of legal, accounting and professional fees incurred in connection with the IPO that are not capitalizable, which are included within selling, general and administrative expense.
28
Fiscal Quarter Ended Two Fiscal Quarters Ended
July 3,
2021
June 27,
2020
July 3,
2021
June 27,
2020
(dollars in thousands)
Net (loss) income $ (53,598) $ 16,414 $ (45,065) $ 963
Depreciation and amortization 7,770 5,854 15,670 11,609
Interest expense 7,516 4,308 16,572 9,641
Income tax expense 5,218 5,459 8,101 2,440
Loss on sale and disposal of property and equipment 22 (3) 187 -
Restructuring charges(1) 36 347 407 633
Stock-based compensation 75,511 240 76,975 464
Unrealized gains (losses) on foreign currency transactions(2) (731) (1,176) (792) 2,565
Strategic initiative costs(3) 376 1,457 376 2,549
Acquisition and integration related costs(4) 4 126 72 238
Other(5) (355) 69 (91) 108
IPO Costs(6) 1,079 - 3,956 -
Adjusted EBITDA $ 42,848 $ 33,095 $ 76,368 $ 31,210
Net sales $ 180,889 $ 112,822 $ 329,635 $ 163,956
Net (loss) income margin (29.6%) 14.5% (13.7%) 0.6%
Adjusted EBITDA margin 23.7% 29.3% 23.2% 19.0%


![· Web view[Enter text here] [Enter text here] [Enter text here][Enter text here][Enter text here] [Enter text here] [Agent Name] [Slogan] Cell: [cell] eMail: [email]](https://static.documents.pub/doc/80x56/5b075ad17f8b9a56408cfaa3/viewenter-text-here-enter-text-here-enter-text-hereenter-text-hereenter.jpg)


