This presentation was made at the AAPA Marine Terminal Management Workshop in Long Beach, in September 2015. Daniel Elroi is the President and CEO of NorthSouth GIS LLC, located in Los Angeles, California. Daniel has been specializing in geospatial technologies since their commercial inception and early deployments in the 1980s. He has focused his career on consulting to organizations wishing to make best use of these technologies to achieve their business goals or public mandates, both in the private and public sectors. Over the past 28 years he has helped numerous clients implement technologies such as GIS, GPS, image analysis and other related technologies for local government, real estate, engineering, mining, nuclear waste disposal, pipelines, non‐profits, and for the past six years, in ports and airports. Daniel has been instrumental in the launching of four GIS consulting firms around the world, and is always looking for areas where geospatial technologies can help their adopters to realize an obvious return on their investment. Before I begin my presentation, I want you to go on a journey of imagination with me… 1
Transcript
This presentation was made at the AAPA Marine Terminal Management Workshop in Long Beach, in September 2015.
Daniel Elroi is the President and CEO of NorthSouth GIS LLC, located in Los Angeles, California. Daniel has been specializing in geospatial technologies since their commercial inception and early deployments in the 1980s. He has focused his career on consulting to organizations wishing to make best use of these technologies to achieve their business goals or public mandates, both in the private and public sectors. Over the past 28 years he has helped numerous clients implement technologies such as GIS, GPS, image analysis and other related technologies for local government, real estate, engineering, mining, nuclear waste disposal, pipelines, non‐profits, and for the past six years, in ports and airports. Daniel has been instrumental in the launching of four GIS consulting firms around the world, and is always looking for areas where geospatial technologies can help their adopters to realize an obvious return on their investment.
Before I begin my presentation, I want you to go on a journey of imagination with me…
1
Imagine a map of your port, perhaps looking a little like this port. Imagine that your port engineer tells you that she has commissioned a Facility Condition Assessment (FCA) on the quay walls and that she is worried about several of the berths and recommends immediate repairs.
2
Now suppose that you could click on the quay wall in question in the port map and bring up the photos taken as part of the FCA, so you could see for yourself.
3
And perhaps bring up close‐up photos to get a better feel for the conditions.
4
Or bring up detailed photos of the cores that were drilled into the concrete.
5
And suppose that information from the original construction of the berth was also available from the map, like the original capital investment.
6
Now imagine being able to look at deterioration projections buried deep inside engineering reports directly from the map, showing in green, yellow and red whether each quay wall is expected to remain serviceable for the duration of the lease of that berth to your tenant, or whether you are likely to have to repair the structure in order to remain within your contractual obligation.
7
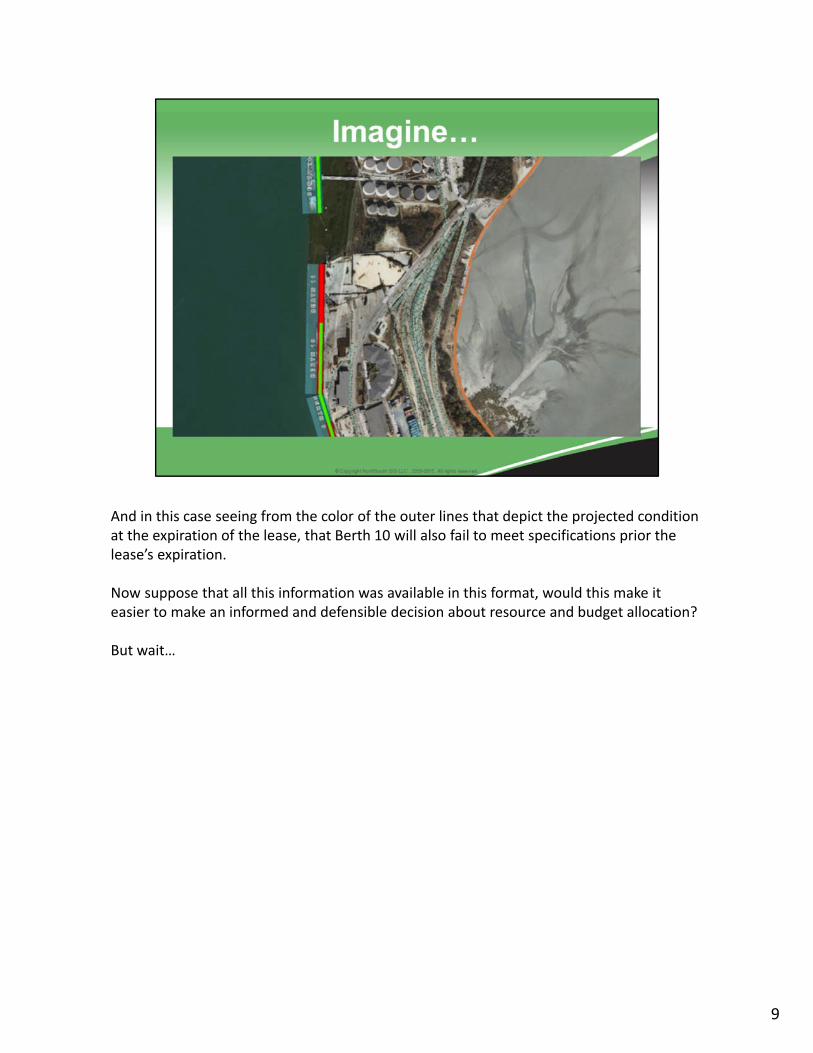
Now imagine that instead of graphs in reports, you could visualize these conditions directly on the map, in this case depicting existing conditions, showing as the engineer had said, that Berth 11 is already failing to meet engineering requirements.
8
And in this case seeing from the color of the outer lines that depict the projected condition at the expiration of the lease, that Berth 10 will also fail to meet specifications prior the lease’s expiration.
Now suppose that all this information was available in this format, would this make it easier to make an informed and defensible decision about resource and budget allocation?
But wait…
9
Now imagine that your billing system was linked to your mapped leases on the port’s digital map viewer. And suppose that this highlighted revenues by each lease, using color codes, with red reflecting high revenues and white showing no revenues.
10
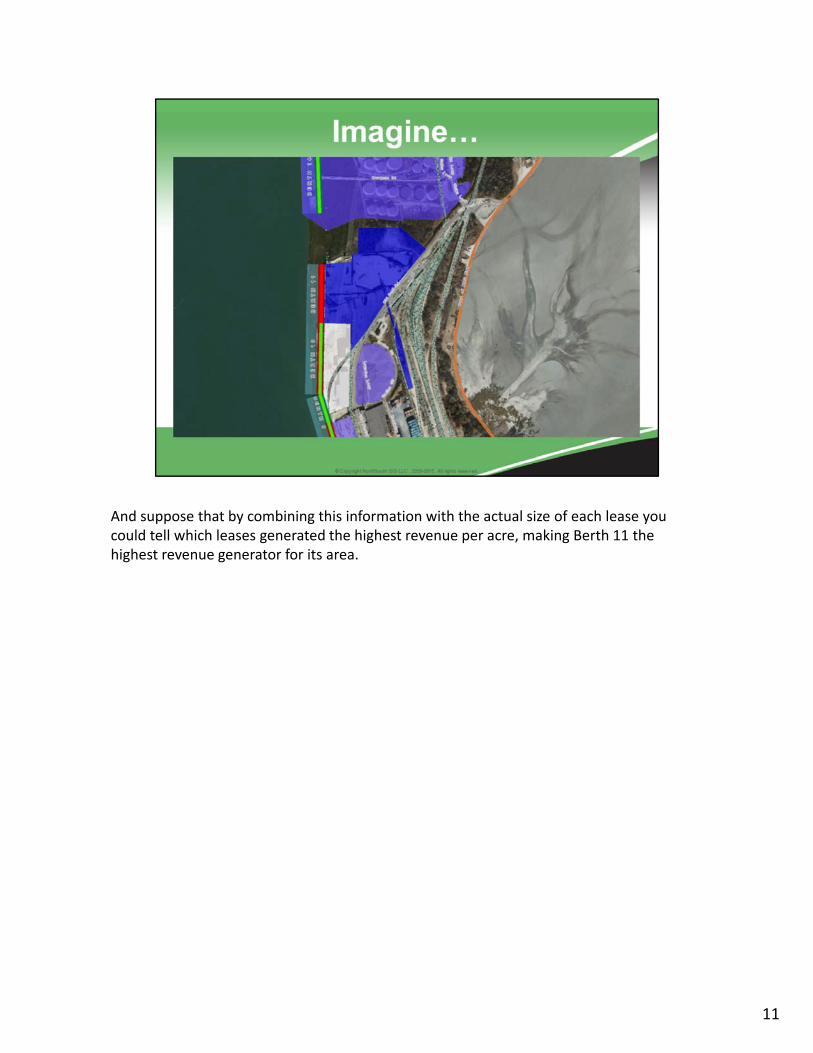
And suppose that by combining this information with the actual size of each lease you could tell which leases generated the highest revenue per acre, making Berth 11 the highest revenue generator for its area.
11
Now suppose that you could access all the individual work orders executed over the past decade, not only by your own maintenance department, but also by several sets of contractors and warranty repairs, down to the actual location of the repair or replacement, the date, the cost, and so on. And suppose that this information is stored in work order systems, computerized maintenance management systems, or external contractors’ systems.
12
And suppose that even though these records may not use the same location reference as the leases, but instead be attached to building, generators, cranes and pumps, that they can be aggregated over space and time to give you a picture of the expenses associated with each lease.
13
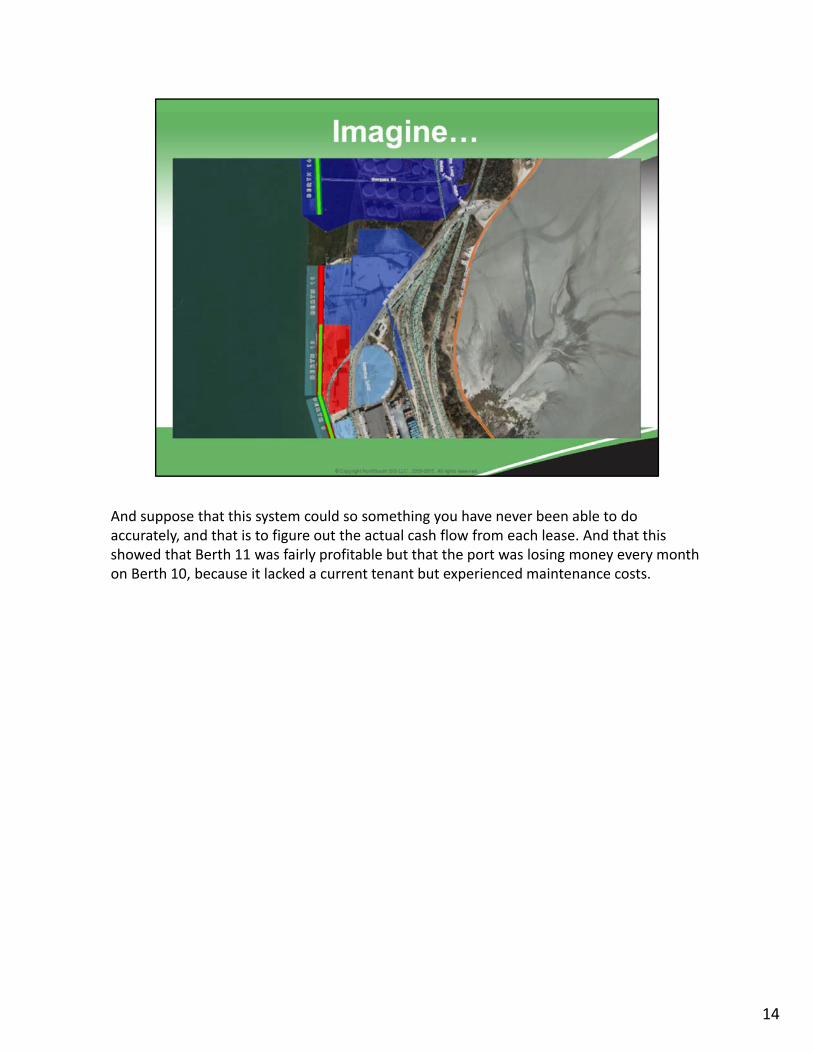
And suppose that this system could so something you have never been able to do accurately, and that is to figure out the actual cash flow from each lease. And that this showed that Berth 11 was fairly profitable but that the port was losing money every month on Berth 10, because it lacked a current tenant but experienced maintenance costs.
14
And suppose that you could also reach into the Asset Registry in the Financial System and combine information about the long term net asset value of that lease, taking into account the value of the land and major assets, as well as the financial and environmental liabilities associated with that terminal. Could this information provide additional valuable data with which to make the right decision?
But wait…
15
What if you could also reach into the lease data, perhaps stored in an Enterprise Resource Planning (ERP) system, and examine the lease status of the two terminals.
16
From which you could see the lease terms and duration of Berth 11.
17
But also the lease conditions that you could offer a new tenant on Berth 10. Suppose that you could interest the tenant in Berth 11 to also lease Berth 10 at favorable terms, so you could make the less urgent repairs to Berth 10 at the same time as the urgent repairs at Berth 11 thus saving money and turn around the cash flow problem there.
18
Suppose that could zoom in on the map and dig deeper.
19
Suppose that you could bring your tenant to your office and show them details about buildings and utilities on Berth 10.
20
Bring up the floor plans directly from the map.
21
Examine the capacity and condition of the utilities.
22
Bring up the live view of the terminal from the security cameras.
23
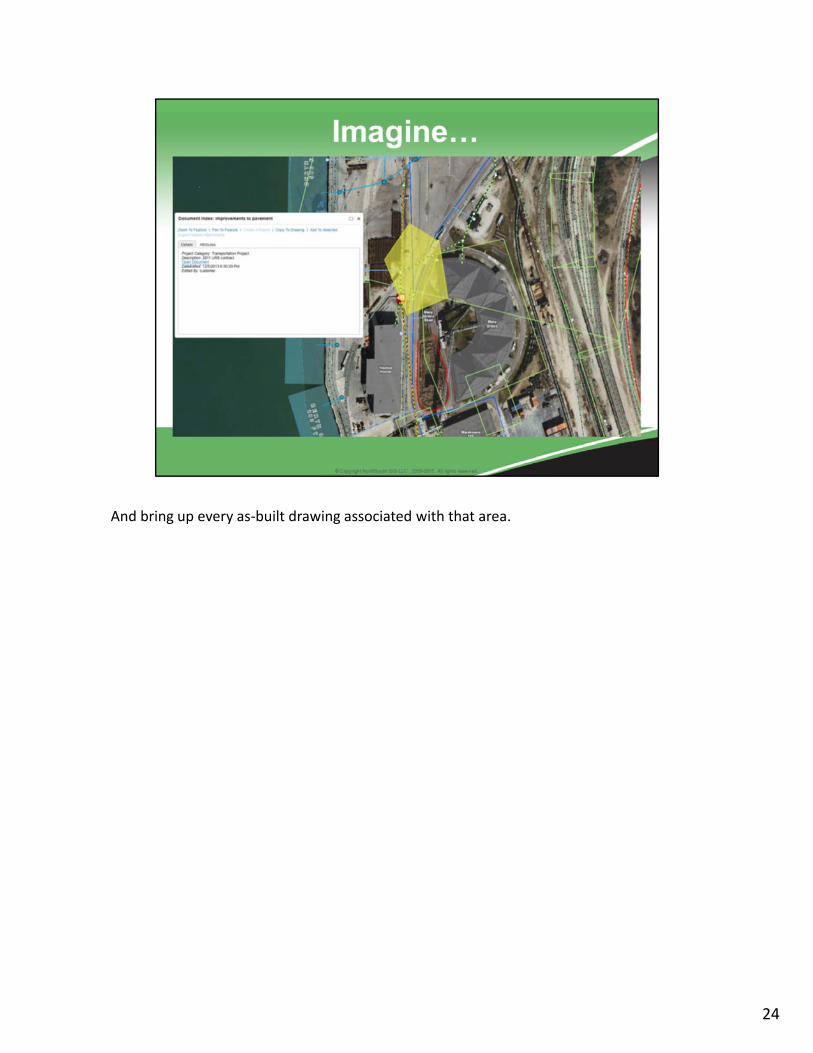
And bring up every as‐built drawing associated with that area.
24
And imagine that you could sketch out, measure, and illustrate your proposal to your tenant right there, on your computer, during your meeting, using the same software.
25
And imagine printing out a report for your tenant to walk away with and this whole process turning a bad situation on its face, resulting in improving cash flow , saving money on repairs, giving your tenant a berth to operate from during the repairs on Berth 11, and making the best informed decision possible.
So is this a “Vision” or a “Dream”? The fact is that most of the information needed to support this scenario is within reach of most ports, only it is not in an accessible form.
26
My name is Daniel Elroi, and my company, NorthSouth GIS is in the business of turning this vision into reality in ports.
The rest of the presentation covers aspects of making this vision a reality. And while I address port authorities, primarily, the fact is that many marine terminals operate in much the same way as ports, tracking assets, repairs, depreciation, and so on, and therefore there are many parallels that transfer to terminal operators as well.
27
I will cover the basics of Geographic Information Systems (GIS) and other geospatial technologies.
Then focus on the application of these technologies to the ports industry.
And focus specifically on the application of these technologies to the subject of asset management.
28
I speak of Geospatial Systems rather than GIS, because there are many geospatial systems that work together. For relatively static data we use Geographic Information Systems (GIS), Computer Aided Drafting (CAD), and aerial photos and other images. Static data, such as the location of utilities, bathymetry, roads, buildings, and leases may change every few years, months, or sometimes days, but they do not change constantly.
Geospatial data can also be dynamic, data that changes location of status constantly. This include vessel location (AIS), vessel traffic system (VTS) components, and automated vehicle location (AVL) transponders.
Geospatial technology can also encompass sensor data, which can vary rapidly in both location and status, such as streaming video from CCTV cameras, radar, sonar, card readers, and weather stations.
29
Let’s turn our attention to Enterprise Asset Management (EAM) in ports.
There are many definitions and many possible components to an asset management program. Different people will perceive different items on this list as defining asset management, from the CFO on one end to a plumber on the other end.
30
I prefer to look at asset management from two aspects, the financial and the physical. However, we need to start by separating an asset management program from the systems used to implement it. A Program is a policy driven process for tracking information and making decisions with it. Systems consist of software, processes, and the hardware needed to support those.
From a financial perspective, an asset management program should provide a dashboard of the financial health of different parts of the port, whether it speaks of short term profitability, long term asset value, risk exposure and mitigation, efficiency, or transparency in decision making.
From a physical perspective, an asset management program should provide the tools for requesting and executing preventive maintenance and repairs, recording costs and labor, modeling service life of assets, and being able to aggregate this information for reporting and analysis purposes.
31
An Enterprise Asset Management program crosses many boundaries since it really impacts the entire organization. As such, it needs to handle a lot of data if it is to provide its users with the ability to make rational, transparent, repeatable, data‐driven decisions.
The good news is that much of the data needed by an EAM is already being collected at ports. The bad news is that it is being collected by different groups, using different software, and with different levels of “granularity”, i.e. some data is collected for an entire terminal, other for a lease, other for a building within a lease, and other for an address associated with the lease holder but not necessarily the lease locations.
Common to these systems – acknowledging the reality that in many ports a “system” is just a spreadsheet or paper documents – is the fact that they refer to locations. While they may refer to locations in different ways, geospatial systems, especially GIS, are excellent ways for correlating information in one data management system to information in another system. For example, GIS make it possible to select all the utilities, cameras, cranes, and buildings in a certain area, even in an ad‐hoc fashion instead of using a specific lease number, and retrieve all the maintenance records. This capability is especially important because retrieving archived data is made more difficult if only tenant names or lease numbers are used as reference, since those change so frequently!
32
The “assets” in Asset Management (and the liabilities associated with them) may not always be so obvious in a port.
33
Parking – a significant revenue generator for some cruise ports is often operated by contractors. Are they taking good care of that asset? Or you own the parking meters. Are you losing revenue on broken meters?
34
Some ports own a dozen or more parks. Are the playground and restrooms showing up in your asset registry? Are broken water sprinklers posing a liability in water usage and fines? Are you collecting activity and use fees?
35
Is the obligation for the cleanup of a remediation site showing up as a liability on your books? What about the hidden value of that liability – the ability to develop new uses for that land once it is cleaned? Is that land an asset or a liability?
36
Security is often paid for and maintained using complex combinations of grants, regional collaboration funds, and port funds. Are they properly recorded? What about their maintenance, done by outside vendors – is that counted against the profitability of the entire port, or of specific terminals?
37
While your community is neither an asset or liability, it is influential in determining the value of your assets and liabilities. A community that puts more pressure on the port can turn certain assets like a productive terminal, into liabilities due to pressure to move trucks off the local streets.
38
Are you collecting appropriate fees for dockage. Are vessels staying longer than reported? And what about the costs of providing security at docks that are not regularly used, when a vessel is late in arriving or leaving?
39
There are many hidden assets and liabilities associated with tenants? Are tenants damaging your assets? Are they maintaining the assets that they are obligated to, or are they passing those costs on to the port?
40
The most traditional view of asset management is, of course, the value and condition of infrastructure, like cranes, docks and warehouses.
41
Do your tenant agreements provide a guaranteed minimum wharfage payment to the port and is that accounted correctly in the asset register?
42
Are maintenance costs properly allocated to tenants and are they charged back to them? Do you have meters for each subtenant, or do you have master‐tenants take responsibility for collecting the costs of utilities on your behalf?
43
Dredging in the main channel may be paid for by the Corps of Engineers, but is the cost of dredging in the berths properly amortized, depending on the frequency of maintenance dredging?
44
Now that we have looked at the variety of assets and liabilities, let’s look at how collect the data needed to support EAM.
45
Much of the data may already be in a variety of systems in the port. But it may not be exposed to other systems, or be exportable. Other data has yet to be collected, moved from spreadsheets into databases, or converted from paper records to electronic data.
46
Some of the data may not, in fact, reside inside the port but in tenant data, regulatory agencies, or municipal agencies or utility companies.
47
And in reality, much data has to be collected in the field, and done so on an on‐going basis. This data should be collected in such a way that it can contribute to the on‐going maintenance of the EAM.
48
Of course, siloed or disparate data cannot easily contribute to EAM unless it is somehow integrated.
49
Some data can be integrated using tabular keys, such as common addresses, asset IDs, or tenant names.
50
Other data can only be reasonably integrated using GIS tools, such as those that can allocate the proportional asset value of a utility network that becomes divided between two tenants after it was originally built for a single tenant.
51
The purpose of integrating all this data is to support analysis and visualization, from which policy and planning can ensure. Using the land assets of the port as an example here.
52
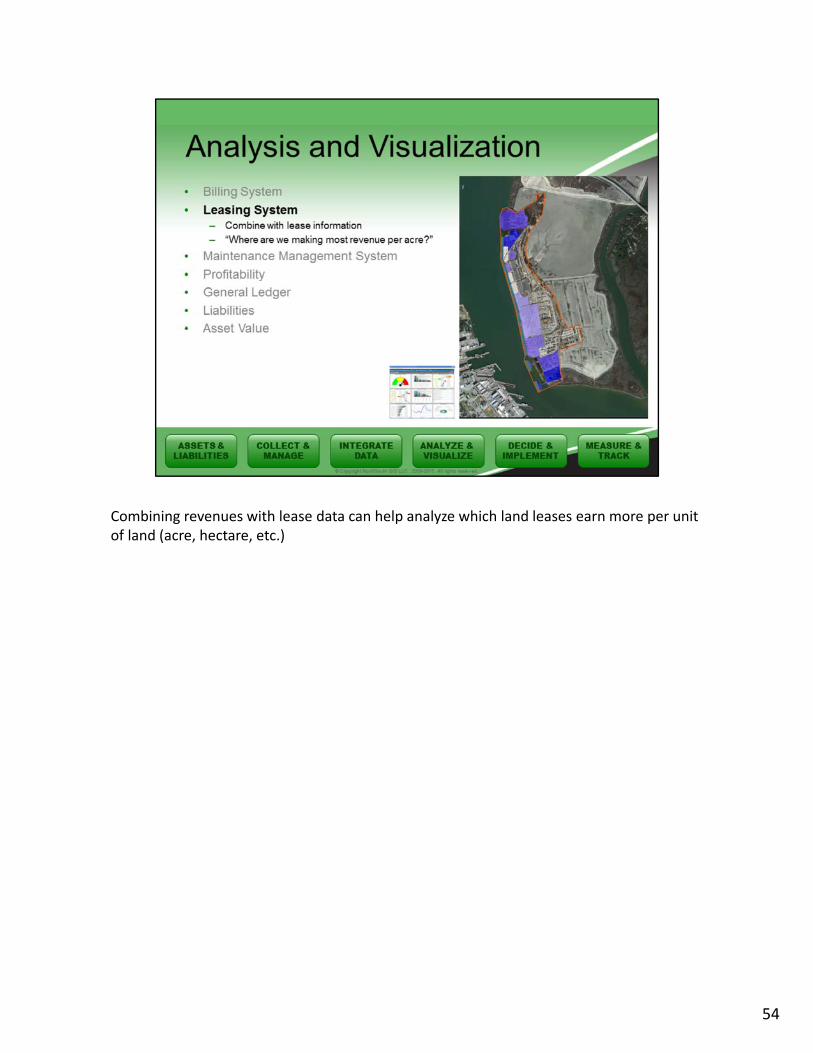
Linking billing and finance systems to the map can illustrate the high and low revenue earning assets.
53
Combining revenues with lease data can help analyze which land leases earn more per unit of land (acre, hectare, etc.)
54
Aggregating data from word orders and maintenance records can provide a vision of expenditures associated with leases or other port properties (common use land, administrative use land, etc.).
55
The difference between earnings and expenditures provides a numeric and visual view of the profitability of each assets as expressed by cashflow.
56
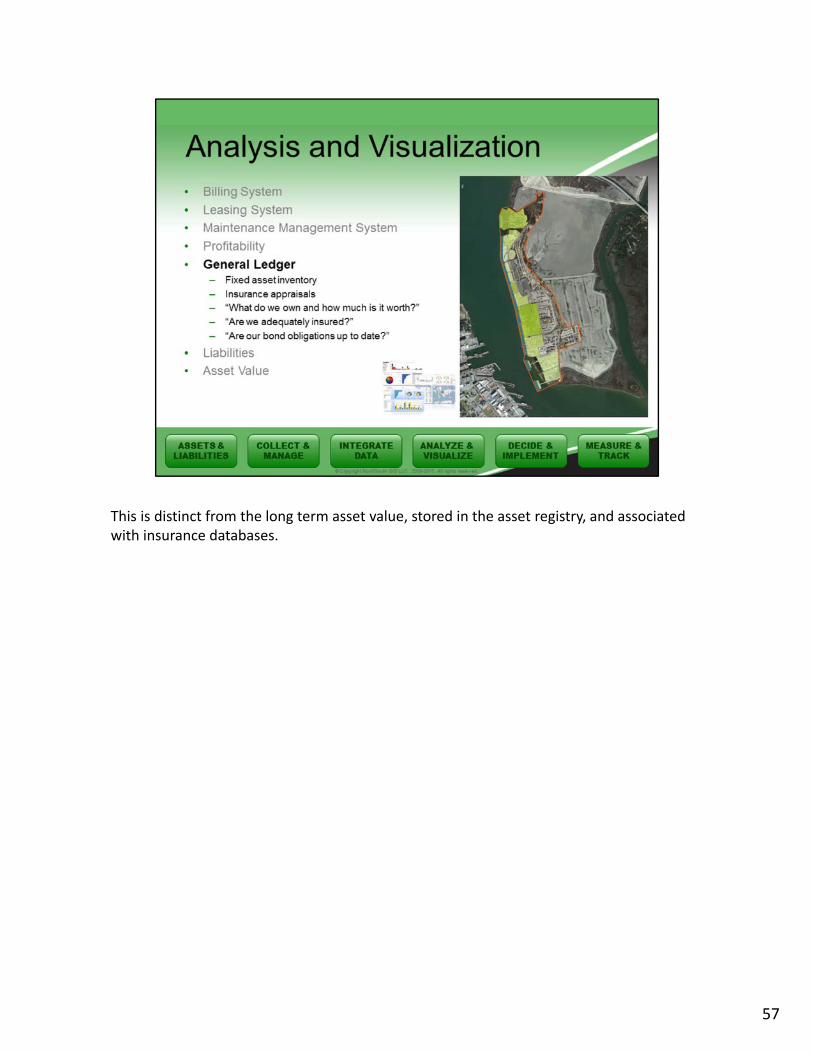
This is distinct from the long term asset value, stored in the asset registry, and associated with insurance databases.
57
Converting a variety of liabilities, loans, bonds, cleanup costs, etc. into uniform numeric values, is an invaluable tool.
58
And this provides us with both short term profitability and long term net asset values, all of which can be used to assess the priority and value of asset repair, replacement, or disposal.
59
Data, data integration, analysis and visualization are all the devices we have for setting priorities and making decisions
60
Our asset management plan, a living document of costs, risks, benefits and priorities should be aligned to the port’s strategic plan.
61
Such plans drive both capital improvement projects.
62
As well as major maintenance projects.
63
And whatever we plan as part of EAM needs to be measured and assessed for performance and success.