61
Enterprise Data Management Optimization Dr. Boris Zibitsker BEZ Systems [email protected] www.bez.com St. Louis CMG

Outline
Enterprise Data Management with Moving Target Enterprise Data Management Options and Tradeoffs Role of Modeling in EDM Optimization
– How to use performance prediction models to evaluate and justify enterprise data management alternatives, set performance expectations, verify results and organize a continuous proactive EDM process
Examples Illustrating the Best Practice of EDM Proactive Performance Management During Application and Information Life Cycle
Applying Modeling for Optimizing EDM Strategic Decisions– How to justify enterprise data warehouse– How to justify master data management
Applying Modeling for Optimizing EDM Tactical Decisions– How to reduce time of loading growing volume of data– How to reduce data access time– How to predict the impact of new application implementation
Applying Modeling for Optimizing EDM Operational Decisions– Predicting how change of the workload’s priority will affect performance– Comparison of actual results vs. expected and organizing continuous proactive
service level management
Summary
2© Boris Zibitsker, BEZ, St Louis CMG - Feb 12, 2008

Challenges of Enterprise Data Management
3
DataData
© Boris Zibitsker, BEZ, St Louis CMG - Feb 12, 2008
• Changing business demand• Loading more data• Increasing number of user• Implementing new applications• Upgrading hardware and software• How to optimize EDM to provide accurate and timely information
with minimum cost and with moving target

4
Scaling Tradeoffs in a Multi-tier Distributed Environment
Distribution: Adding more
servers, nodes
Centralization: Server consolidation
Data compression
More:CPUs/Server, JVM/Server
Disks/Server Reduce Queueing Time
Faster CPUs, Disks
Reduce Service Time
Parallelization
Concurrency DBMS Servers
Web Servers
Application Servers
Storage Subsystem
EDW
Sales Marketing HR
© Boris Zibitsker, BEZ, St Louis CMG - Feb 12, 2008

Optimization of Strategic, Tactical and Operational Enterprise Data Management
DecisionStrategic Decisions (Yearly)
Architecture: Centralized EDW vs. Distributed DW and DM vs. Master Data Management
Where to place data Where to run applications
Tactical Decisions (Weekly/Monthly)
Dormant data Indexes Partitioning Compression
Operational Decisions (Hourly) Concurrency Parallelism Priority Resource reallocation
Compare different options Select criteria of comparison,
like cost, response time, throughput, availability, accuracy, consistency, manageability, flexibility
Define relative importance/weight of each criteria
Build models showing relationship between different parameters and each criteria for each option
Find an optimum option/solution as a compromise between different criteria
5© Boris Zibitsker, BEZ, St Louis CMG - Feb 12, 2008

Wrong EDM Decisions Can Delay Action Time and Negatively Affect Business
© Boris Zibitsker, BEZ, St Louis CMG - Feb 12, 2008 6
ETL
Data Access
Action Time
Val
ue
lost
Bus Event
Bu
sin
es
s V
alu
e
Time
How Long Will it Take to Load and
Aggregate More Data?
How Long Will It Take to Access
More Data?
How Can the Accuracy and Timeliness of Information
Be Improved?
Information Action

Difference Between Efficiency and Effectiveness of EDM Decisions
Effectiveness Accurate and timely
information Ability to make right
decisions Impact on the
bottom line
Efficiency Cost Performance Scalability Availability Consistency
7
Str
ateg
y
Op
erat
ion
s Tac
tics
© Boris Zibitsker, BEZ, St Louis CMG - Feb 12, 2008

InputWorkloadsHardwareSoftware
Prediction Engine
Performance Prediction & Optimization
OutputRecommendation& ExpectationsBy Workload
OptionsHardwareSoftware
DBMS
PlanWorkload Growth
Database Size GrowthHardware Upgrade
Software ParametersNew Application
Server Consolidation
DBMS WizardsIndex AdviserMV Adviser
Data PartitioningData Compression
OptimizationEngine
8© Boris Zibitsker, BEZ, St Louis CMG - Feb 12, 2008
OSDBMSServer
Applica-tion
Server

9
Simplified Model of 3-tier Architecture
Max?Max?
1
2
n
CPUCPU
DiskDisk
MemoryMemory
Max?
1
2
n
CPUCPU
DiskDisk
MemoryMemory
ActiveSessions
Threadsor Active Sessions
Rejected Requests
Arriving requests
No
Rejected Requests DBMS
Servers
NetNet
Max?Max?
7575
1
2
n
CPUCPU
DiskDisk
MemoryMemory
Active Sessions
Rejected Requests
Users
Arriving Requests
Network Web Servers
NetNet
Client
200 125
75
60
15 5025
25
# of Threads & Active Sessions Control Concurrency
Memory Limitation
Level of Parallelism Affects Performance
Application Servers
© Boris Zibitsker, BEZ, St Louis CMG - Feb 12, 2008

Workload Characterization

Each Workload Has Unique Performance, Data & Resource Utilization Profiles
Table 1Table 1
Table 3Table 3 Table mTable m
Table 2Table 2
ApplAppl ApplAppl
SQ
L
UserUserUserUser UserUser UserUser
…… CPUCPU
DiskDisk
DiskDisk
CPUCPU
DiskDisk
UserUser
UserUser
Business Process
Workloads
Resource Utilization
Data
11© Boris Zibitsker, BEZ, St Louis CMG - Feb 12, 2008

Verification and ControlTrend Analysis, Baseline Analysis for Fixed/Rolling Period • Trend Analysis
Period-to-Period Comparisons & Change ValidationProactive Corrective Actions & New Expectations
Workload Centric Approach to Service Level Management
Operational DecisionsProblem Isolation
Current and Predicted Service BreachBusiness to Infrastructure Drill down
Zoom In / Out • Include / Exclude FiltersPerformance • Utilization • Data Access
Scheduling, Workload Management
Strategic Decisions Justification of Architecture: Setting Realistic SLO and SLACapacity Planning New Application Implementation Virtualization Consolidations
Tactical Decisions Concurrency Control Priority Database Tuning Index Creation Memory Adjustments Partitioning Compression Appl. Server Tuning #JVM & #JVM Threads Connection Pool Size
12© Boris Zibitsker, BEZ, St Louis CMG - Feb 12, 2008

13
Typical Steps of Applying Modeling During Application and Information Life Cycle
Application Life Cycle Feasibility study New application
implementation Performance
management Capacity planning Disaster recovery Application
consolidation
Information Life Cycle
Data loading (ETL) Data modeling Database tuning Data growth Backup and restore Data replication Data consolidation Enterprise data
management Information
integration
Measu
re
Ch
ara
cte
rize
Pla
n
Ad
vis
e
Man
ag
e
Mod
el &
Op
tim
ize
© Boris Zibitsker, BEZ, St Louis CMG - Feb 12, 2008

Example of Configuration Planning Tasks for Multi-tier Distributed Environment
For each workload, identify how many users can be supported by one JVM
How many JVMs will be required to support each of the workloads
The number of servers required to support all workloads
The optimum number of CPUs per server
CPU type and speed Server memory size Number of host channels Storage subsystem type
Control unit cache size Number of disk channels Number of disks per server Maximum number of active
sessions within DBMS server per workload
Dispatching priority for each workload
Maximum degree of parallelism
Indexing Materialized views Partitioning Data compression
14© Boris Zibitsker, BEZ, St Louis CMG - Feb 12, 2008

Performance Prediction

Predicting Impact of Workload Growth
This Month
Next Month
In 2 Months
In 3 Months
In 4 Months
Arrival Rate (Req/sec)
5 6 7 8 9Service Time (sec) 0.1 0.12 0.14 0.16 0.18Utilization (%) 0.5 0.6 0.7 0.8 0.9Response Time (sec) 0.2 0.3 0.46 0.8 1.8
A = 5 Req / sec Scpu = 0.1 sec
Utilization Law U=A*SUcpu = 5 Req/sec * 0.1sec = 0.5
Response Time law R=S/(1-U)Rcpu = 0.1 sec / (1 - 0.5) = 0.2 sec
Little’s Law N = A * R
CPU
Based on expected workload growth of 20% per month, predict when the system will not be able to meet SLO (0.6 sec).
What will be the impact of doubling CPU speed?
How long will the system satisfy SLO?
16© Boris Zibitsker, BEZ, St Louis CMG - Feb 12, 2008

Predicting Impact of Doubling CPU Speed
This Month
Next Month
In 2 Months
In 3 Months
In 4 Months
Arrival Rate (Req/sec)
5 6 7 8 9Service Time (sec) 0.1 0.12 0.14 0.16 0.18Utilization (%)
0.5 0.6 0.7 0.8 0.9Response Time (sec) 0.2 0.3 0.46 0.8 1.8Doubling CPU Speed 0.06 0.09 0.13 0.22 0.47
Based on expected workload growth of 20% per month, predict when the system will not be able to meet SLO (0.6 sec).
What will be the impact of doubling CPU speed?
How long will the system satisfy SLO?
17© Boris Zibitsker, BEZ, St Louis CMG - Feb 12, 2008

© Boris Zibitsker, BEZ, St Louis CMG - Feb 12, 2008 18
Example of Planning (see spreadsheet)
PlanAPPLICATION SERVER Now Q1 Q2 Q3 Q4 Q1 Q2 Q3 Q4
Arrival Rate (Tr/Sec) 2.50 3.00 3.50 4.00 4.50 3.00 3.50 4.00 4.50CPU Service Time per TR (MS) 120.00 120.00 120.00 120.00 120.00 120.00 60.00 60.00 60.00Number of I/Os per Tr 4.00 4.00 4.00 4.00 4.00 4.00 4.00 4.00 4.00Number of I/Os to Disk 1 per TR 2.00 2.00 2.00 2.00 2.00 2.00 2.00 2.00 2.00Number of I/Os to Disk 2 per TR 2.00 2.00 2.00 2.00 2.00 2.00 2.00 2.00 2.00CPU Utilization (0-1) 0.30 0.36 0.42 0.48 0.54 0.36 0.21 0.24 0.27 Disk1 Service Time (ms) 10.00 10.00 10.00 10.00 10.00 10.00 10.00 10.00 10.00Disk 2 Service Time (ms) 10.00 10.00 10.00 10.00 10.00 10.00 10.00 10.00 10.00DBMS SERVER
Arrival Rate (Tr/Sec) 2.50 3.00 3.50 4.00 4.50 3.00 3.50 4.00 4.50CPU Service Time per TR (MS) 160.00 160.00 160.00 160.00 160.00 160.00 160.00 160.00 160.00Number of I/Os per Tr 30.00 30.00 30.00 30.00 30.00 30.00 30.00 30.00 30.00Number of I/Os to Disk 1 per TR 20.00 20.00 20.00 20.00 20.00 20.00 20.00 20.00 20.00Number of I/Os to Disk 2 per TR 10.00 10.00 10.00 10.00 10.00 10.00 10.00 10.00 10.00CPU Utilization (0-1) 0.40 0.48 0.56 0.64 0.72 0.48 0.56 0.64 0.72 Disk1 Service Time (ms) 10.00 10.00 10.00 10.00 10.00 10.00 10.00 10.00 10.00Disk 2 Service Time (ms) 10.00 10.00 10.00 10.00 10.00 10.00 10.00 10.00 10.00
Workload Growth is 20% per Quarter Doubling AS CPU Speed Q2

© Boris Zibitsker, BEZ, St Louis CMG - Feb 12, 2008 19
Workload Characterization & Forecasting
Plan
APPLICATION SERVER Now Q1 Q2 Q3 Q4 Now Q1 Q2 Q3 Q4
Arrival Rate (Tr/Sec) 2.50 3.00 3.50 4.00 4.50 2.50 3.00 3.50 4.00 4.50
CPU Service Time per TR (MS) 120.00 120.00 120.00 120.00 120.00 120.00 120.00 120.00 120.00 120.00Number of I/Os per Tr 4.00 4.00 4.00 4.00 4.00 4.00 4.00 4.00 4.00 4.00
Number of I/Os to Disk 1 per TR 2.00 2.00 2.00 2.00 2.00 2.00 2.00 2.00 2.00 2.00
Number of I/Os to Disk 2 per TR 2.00 2.00 2.00 2.00 2.00 2.00 2.00 2.00 2.00 2.00CPU Utilization (0-1) 0.30 0.36 0.42 0.48 0.54 0.30 0.36 0.42 0.48 0.54 Disk1 Service Time (ms) 10.00 10.00 10.00 10.00 10.00 10.00 10.00 10.00 10.00 10.00Disk 2 Service Time (ms) 10.00 10.00 10.00 10.00 10.00 10.00 10.00 10.00 10.00 10.00DBMS SERVER
Arrival Rate (Tr/Sec) 2.50 3.00 3.50 4.00 4.50 2.50 3.00 3.50 4.00 4.50
CPU Service Time per TR (MS) 160.00 160.00 160.00 160.00 160.00 160.00 160.00 80.00 80.00 80.00Number of I/Os per Tr 30.00 30.00 30.00 30.00 30.00 30.00 30.00 30.00 30.00 30.00
Number of I/Os to Disk 1 per TR 20.00 20.00 20.00 20.00 20.00 20.00 20.00 20.00 20.00 20.00
Number of I/Os to Disk 2 per TR 10.00 10.00 10.00 10.00 10.00 10.00 10.00 10.00 10.00 10.00CPU Utilization (0-1) 0.40 0.48 0.56 0.64 0.72 0.40 0.48 0.28 0.32 0.36 Disk1 Service Time (ms) 10.00 10.00 10.00 10.00 10.00 10.00 10.00 10.00 10.00 10.00Disk 2 Service Time (ms) 10.00 10.00 10.00 10.00 10.00 10.00 10.00 10.00 10.00 10.00
Workload Growth is 20% per Quarter Doubling DBMS server CPU Speed Q2

© Boris Zibitsker, BEZ, St Louis CMG - Feb 12, 2008 20
Modeling AS Hardware Upgrade Impact
Performance PredictionApplication Server Now Q1 Q2 Q3 Q4 Q1 Q2 Q3 Q4
Performance PredictionScpu(ms) per Visit to CPU 24.000 24.000 24.000 24.000 24.000 24.000 12.000 12.000 12.000UCPU 0.300 0.360 0.420 0.480 0.540 0.360 0.210 0.240 0.270UDisk1 0.050 0.060 0.070 0.080 0.090 0.060 0.070 0.080 0.090UDisk2 0.050 0.060 0.070 0.080 0.090 0.060 0.070 0.080 0.090
CPU RT/Visit to CPU (sec) 0.034 0.038 0.041 0.046 0.052 0.038 0.015 0.016 0.016AS CPU RT per transaction 0.171 0.188 0.207 0.231 0.261 0.188 0.076 0.079 0.082Disk 1 Resp Time per Visit 0.011 0.011 0.011 0.011 0.011 0.011 0.011 0.011 0.011
Disk 1 AS Time per Transaction 0.021 0.021 0.022 0.022 0.022 0.021 0.022 0.022 0.022Disk 2 Resp Time per Visit 0.011 0.011 0.011 0.011 0.011 0.011 0.011 0.011 0.011Disk 2 AS Time per Transaction 0.021 0.021 0.022 0.022 0.022 0.021 0.022 0.022 0.022AS Response Time 0.214 0.230 0.250 0.274 0.305 0.230 0.119 0.122 0.126Relative AS RT Improvement 0.000 110.077 124.012 141.642DBMS Server Perf predictionScpu(ms) per Visit to CPU 5.161 5.161 5.161 5.161 5.161 5.161 5.161 5.161 5.161UCPU 0.400 0.480 0.560 0.640 0.720 0.480 0.560 0.640 0.720UDisk1 0.500 0.600 0.700 0.800 0.900 0.600 0.700 0.800 0.900UDisk2 0.250 0.300 0.350 0.400 0.450 0.300 0.350 0.400 0.450
CPU Resp Time for 1 Visit(sec) 0.009 0.010 0.012 0.014 0.018 0.010 0.012 0.014 0.018DBMS CPU RT/Req 0.267 0.308 0.364 0.444 0.571 0.308 0.364 0.444 0.571Disk 1 I/O Resp Time 0.020 0.025 0.033 0.050 0.100 0.025 0.033 0.050 0.100Disk 2 I/O Resp Time 0.013 0.014 0.015 0.017 0.018 0.014 0.015 0.017 0.018Disk 1 DBMS Time 0.400 0.500 0.667 1.000 2.000 0.500 0.667 1.000 2.000Disk 2 DBMS Time 0.133 0.143 0.154 0.167 0.182 0.143 0.154 0.167 0.182
DBMS Server Response Time 0.800 0.951 1.184 1.611 2.753 0.951 1.184 1.611 2.753Total Response Time 1.014 1.181 1.434 1.885 3.058 1.181 1.303 1.734 2.879Relative RT Improvement 0.000 10.049 8.758 6.205
Workload Growth is 20% per Quarter

© Boris Zibitsker, BEZ, St Louis CMG - Feb 12, 2008 21
Predicted AS Upgrade Impact
Predicted Response Time for Sales (sec)
0.000
0.500
1.000
1.500
2.000
2.500
3.000
3.500
1 2 3 4 5
Quarter
AS Response Time DBMS Server Response Time
AS CPU Upgrade Impact on RT
0.000
0.500
1.000
1.500
2.000
2.500
3.000
3.500
1 2 3 4
Quarter
AS Response Time DBMS Server Response Time
Predicted DBMS Server Response Time Components for Sales
0.000
0.500
1.000
1.500
2.000
2.500
3.000
1 2 3 4 5
Quarter
DBMS CPU RT/Req Disk 1 DBMS Time Disk 2 DBMS Time
AS Response Time
0.000
0.050
0.100
0.150
0.200
0.250
1 2 3 4
Quarter
AS Response Time
AS Response Time Components for Sales
0.000
0.050
0.100
0.150
0.200
0.250
0.300
0.350
1 2 3 4 5
Quarter
AS CPU RT per transaction Disk 1 AS Time per Transaction
Disk 2 AS Time per Transaction
Relative AS RT Improvement
0.000
20.000
40.000
60.000
80.000
100.000
120.000
140.000
160.000
1 2 3 4
Quarter
Relative AS RT Improvement
Relative RT Improvement
0.000
2.000
4.000
6.000
8.000
10.000
12.000
1 2 3 4
Quarter
Relative RT Improvement

© Boris Zibitsker, BEZ, St Louis CMG - Feb 12, 2008 22
Modeling DBMS Server Upgrade Impact
Plan
APPLICATION SERVER Now Q1 Q2 Q3 Q4 Now Q1 Q2 Q3 Q4
Arrival Rate (Tr/Sec) 2.50 3.00 3.50 4.00 4.50 2.50 3.00 3.50 4.00 4.50
CPU Service Time per TR (MS) 120.00 120.00 120.00 120.00 120.00 120.00 120.00 120.00 120.00 120.00Number of I/Os per Tr 4.00 4.00 4.00 4.00 4.00 4.00 4.00 4.00 4.00 4.00
Number of I/Os to Disk 1 per TR 2.00 2.00 2.00 2.00 2.00 2.00 2.00 2.00 2.00 2.00
Number of I/Os to Disk 2 per TR 2.00 2.00 2.00 2.00 2.00 2.00 2.00 2.00 2.00 2.00CPU Utilization (0-1) 0.30 0.36 0.42 0.48 0.54 0.30 0.36 0.42 0.48 0.54 Disk1 Service Time (ms) 10.00 10.00 10.00 10.00 10.00 10.00 10.00 10.00 10.00 10.00Disk 2 Service Time (ms) 10.00 10.00 10.00 10.00 10.00 10.00 10.00 10.00 10.00 10.00DBMS SERVER
Arrival Rate (Tr/Sec) 2.50 3.00 3.50 4.00 4.50 2.50 3.00 3.50 4.00 4.50
CPU Service Time per TR (MS) 160.00 160.00 160.00 160.00 160.00 160.00 160.00 80.00 80.00 80.00Number of I/Os per Tr 30.00 30.00 30.00 30.00 30.00 30.00 30.00 30.00 30.00 30.00
Number of I/Os to Disk 1 per TR 20.00 20.00 20.00 20.00 20.00 20.00 20.00 20.00 20.00 20.00
Number of I/Os to Disk 2 per TR 10.00 10.00 10.00 10.00 10.00 10.00 10.00 10.00 10.00 10.00CPU Utilization (0-1) 0.40 0.48 0.56 0.64 0.72 0.40 0.48 0.28 0.32 0.36 Disk1 Service Time (ms) 10.00 10.00 10.00 10.00 10.00 10.00 10.00 10.00 10.00 10.00Disk 2 Service Time (ms) 10.00 10.00 10.00 10.00 10.00 10.00 10.00 10.00 10.00 10.00
Workload Growth is 20% per Quarter Doubling DBMS server CPU Speed Q2
© Boris Zibitsker, BEZ, St Louis CMG - Feb 12, 2008 23
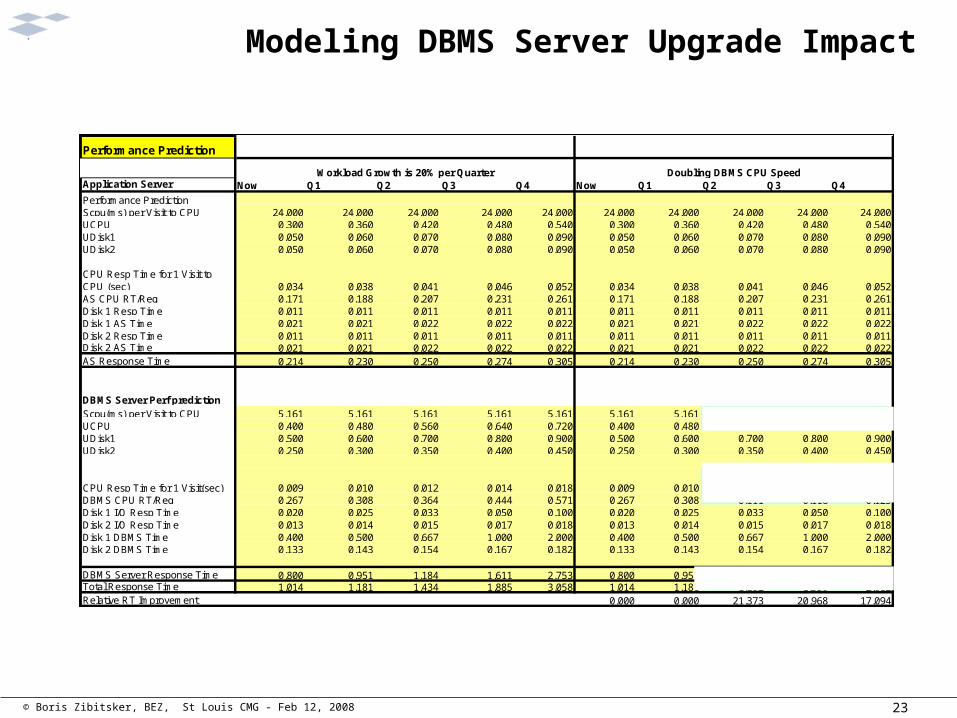
Modeling DBMS Server Upgrade Impact
Performance Prediction
Application Server Now Q1 Q2 Q3 Q4 Now Q1 Q2 Q3 Q4
Performance PredictionScpu(ms) per Visit to CPU 24.000 24.000 24.000 24.000 24.000 24.000 24.000 24.000 24.000 24.000UCPU 0.300 0.360 0.420 0.480 0.540 0.300 0.360 0.420 0.480 0.540UDisk1 0.050 0.060 0.070 0.080 0.090 0.050 0.060 0.070 0.080 0.090UDisk2 0.050 0.060 0.070 0.080 0.090 0.050 0.060 0.070 0.080 0.090
CPU Resp Time for 1 Visit to CPU (sec) 0.034 0.038 0.041 0.046 0.052 0.034 0.038 0.041 0.046 0.052AS CPU RT/Req 0.171 0.188 0.207 0.231 0.261 0.171 0.188 0.207 0.231 0.261Disk 1 Resp Time 0.011 0.011 0.011 0.011 0.011 0.011 0.011 0.011 0.011 0.011Disk 1 AS Time 0.021 0.021 0.022 0.022 0.022 0.021 0.021 0.022 0.022 0.022Disk 2 Resp Time 0.011 0.011 0.011 0.011 0.011 0.011 0.011 0.011 0.011 0.011Disk 2 AS Time 0.021 0.021 0.022 0.022 0.022 0.021 0.021 0.022 0.022 0.022AS Response Time 0.214 0.230 0.250 0.274 0.305 0.214 0.230 0.250 0.274 0.305
DBMS Server Perf predictionScpu(ms) per Visit to CPU 5.161 5.161 5.161 5.161 5.161 5.161 5.161 2.581 2.581 2.581UCPU 0.400 0.480 0.560 0.640 0.720 0.400 0.480 0.280 0.320 0.360UDisk1 0.500 0.600 0.700 0.800 0.900 0.500 0.600 0.700 0.800 0.900UDisk2 0.250 0.300 0.350 0.400 0.450 0.250 0.300 0.350 0.400 0.450
CPU Resp Time for 1 Visit(sec) 0.009 0.010 0.012 0.014 0.018 0.009 0.010 0.004 0.004 0.004DBMS CPU RT/Req 0.267 0.308 0.364 0.444 0.571 0.267 0.308 0.111 0.118 0.125Disk 1 I/O Resp Time 0.020 0.025 0.033 0.050 0.100 0.020 0.025 0.033 0.050 0.100Disk 2 I/O Resp Time 0.013 0.014 0.015 0.017 0.018 0.013 0.014 0.015 0.017 0.018Disk 1 DBMS Time 0.400 0.500 0.667 1.000 2.000 0.400 0.500 0.667 1.000 2.000Disk 2 DBMS Time 0.133 0.143 0.154 0.167 0.182 0.133 0.143 0.154 0.167 0.182
DBMS Server Response Time 0.800 0.951 1.184 1.611 2.753 0.800 0.951 0.932 1.284 2.307Total Response Time 1.014 1.181 1.434 1.885 3.058 1.014 1.181 1.182 1.559 2.612Relative RT Improvement 0.000 0.000 21.373 20.968 17.094
Workload Growth is 20% per Quarter Doubling DBMS CPU Speed

© Boris Zibitsker, BEZ, St Louis CMG - Feb 12, 2008 24
Predicted DBMS Server Upgrade Impact
Predicted Response Time for Sales (sec)
0.000
0.500
1.000
1.500
2.000
2.500
3.000
3.500
1 2 3 4 5
Quarter
AS Response Time DBMS Server Response Time
Predicted DBMS Server Response Time Components for Sales
0.000
0.500
1.000
1.500
2.000
2.500
3.000
1 2 3 4 5
Quarter
DBMS CPU RT/Req Disk 1 DBMS Time Disk 2 DBMS Time
Application Server Response Time Components for Sales
0.000
0.050
0.100
0.150
0.200
0.250
0.300
0.350
1 2 3 4 5
Quarter
AS CPU RT/Req Disk 1 AS Time Disk 2 AS Time
DBMS Server CPU Upgrade Impact
0.000
0.500
1.000
1.500
2.000
2.500
3.000
1 2 3 4 5
Quarter
AS Response Time DBMS Server Response Time
Relative RT Improvement
0.000
5.000
10.000
15.000
20.000
25.000
1 2 3 4 5
Relative RT Improvement

© Boris Zibitsker, BEZ, St Louis CMG - Feb 12, 2008 25
Predicted Parallel Processing Impact
PlanAPPLICATION SERVER Now Q1 Q2 Q3 Q4 Now Q1 Q2 Q3 Q4
Arrival Rate (Tr/Sec) 2.50 3.00 3.50 4.00 4.50 2.50 3.00 3.50 4.00 4.50
CPU Service Time per TR (MS) 120.00 120.00 120.00 120.00 120.00 120.00 120.00 120.00 120.00 120.00Number of I/Os per Tr 4.00 4.00 4.00 4.00 4.00 4.00 4.00 4.00 4.00 4.00# of I/Os to Disk 1 per TR 2.00 2.00 2.00 2.00 2.00 2.00 2.00 2.00 2.00 2.00# of I/Os to Disk 2 per TR 2.00 2.00 2.00 2.00 2.00 2.00 2.00 2.00 2.00 2.00CPU Utilization (0-1) 0.30 0.36 0.42 0.48 0.54 0.30 0.36 0.42 0.48 0.54 Disk1 Service Time (ms) 10.00 10.00 10.00 10.00 10.00 10.00 10.00 10.00 10.00 10.00Disk 2 Service Time (ms) 10.00 10.00 10.00 10.00 10.00 10.00 10.00 10.00 10.00 10.00DBMS SERVER
Arrival Rate (Tr/Sec) 2.50 3.00 3.50 4.00 4.50 2.50 3.00 3.50 4.00 4.50
CPU Service Time per TR (MS) 160.00 160.00 160.00 160.00 160.00 160.00 160.00 160.00 160.00 160.00Number of I/Os per Tr 30.00 30.00 30.00 30.00 30.00 30.00 30.00 30.00 30.00 30.00# of I/Os to Disk 1 per TR 20.00 20.00 20.00 20.00 20.00 20.00 15.00 15.00 15.00 15.00# of I/Os to Disk 2 per TR 10.00 10.00 10.00 10.00 10.00 10.00 15.00 15.00 15.00 15.00CPU Utilization (0-1) 0.40 0.48 0.56 0.64 0.72 0.40 0.48 0.56 0.64 0.72 Disk1 Service Time (ms) 10.00 10.00 10.00 10.00 10.00 10.00 10.00 10.00 10.00 10.00Disk 2 Service Time (ms) 10.00 10.00 10.00 10.00 10.00 10.00 10.00 10.00 10.00 10.00
Workload Growth is 20% per Quarter Parallel Processing and Balancing Disk Utilization

© Boris Zibitsker, BEZ, St Louis CMG - Feb 12, 2008 26
Predicted Parallel Processing Impact
Performance PredictionApplication Server Now Q1 Q2 Q3 Q4 Now Q1 Q2 Q3 Q4
Performance PredictionScpu(ms) per Visit to CPU 24.000 24.000 24.000 24.000 24.000 24.000 24.000 24.000 24.000 24.000UCPU 0.300 0.360 0.420 0.480 0.540 0.300 0.360 0.420 0.480 0.540UDisk1 0.050 0.060 0.070 0.080 0.090 0.050 0.060 0.070 0.080 0.090UDisk2 0.050 0.060 0.070 0.080 0.090 0.050 0.060 0.070 0.080 0.090
CPU Resp Time for 1 Visit to CPU (sec) 0.034 0.038 0.041 0.046 0.052 0.034 0.038 0.041 0.046 0.052AS CPU RT/Req 0.171 0.188 0.207 0.231 0.261 0.171 0.188 0.207 0.231 0.261Disk 1 Resp Time 0.011 0.011 0.011 0.011 0.011 0.011 0.011 0.011 0.011 0.011Disk 1 AS Time 0.021 0.021 0.022 0.022 0.022 0.021 0.021 0.022 0.022 0.022Disk 2 Resp Time 0.011 0.011 0.011 0.011 0.011 0.011 0.011 0.011 0.011 0.011Disk 2 AS Time 0.021 0.021 0.022 0.022 0.022 0.021 0.021 0.022 0.022 0.022AS Response Time 0.214 0.230 0.250 0.274 0.305 0.214 0.230 0.250 0.274 0.305
DBMS Server Perf prediction
Scpu(ms) per Visit to CPU 5.161 5.161 5.161 5.161 5.161 5.161 5.161 5.161 5.161 5.161UCPU 0.400 0.480 0.560 0.640 0.720 0.400 0.480 0.560 0.640 0.720UDisk1 0.500 0.600 0.700 0.800 0.900 0.500 0.450 0.525 0.600 0.675UDisk2 0.250 0.300 0.350 0.400 0.450 0.250 0.450 0.525 0.600 0.675
CPU Resp Time for 1 Visit(sec) 0.009 0.010 0.012 0.014 0.018 0.009 0.010 0.012 0.014 0.018DBMS CPU RT/Req 0.267 0.308 0.364 0.444 0.571 0.267 0.308 0.364 0.444 0.571Disk 1 I/O Resp Time 0.020 0.025 0.033 0.050 0.100 0.020 0.018 0.021 0.025 0.031Disk 2 I/O Resp Time 0.013 0.014 0.015 0.017 0.018 0.013 0.018 0.021 0.025 0.031Disk 1 DBMS Time 0.400 0.500 0.667 1.000 2.000 0.400 0.273 0.316 0.375 0.462Disk 2 DBMS Time 0.133 0.143 0.154 0.167 0.182 0.133 0.273 0.316 0.375 0.462
DBMS Server Response Time 0.800 0.951 1.184 1.611 2.753 0.800 0.427 0.498 0.597 0.747Total Response Time 1.014 1.181 1.434 1.885 3.058 1.014 0.657 0.748 0.871 1.052Relative Improvement RT 0.0 79.8 91.8 116.3 190.7
Workload Growth is 20% per Quarter Parallel Processing and Balancing Disk Utilization

© Boris Zibitsker, BEZ, St Louis CMG - Feb 12, 2008 27
Predicted Parallel Processing Impact
Predicted Response Time for Sales (sec)
0.000
0.500
1.000
1.500
2.000
2.500
3.000
3.500
1 2 3 4 5
Quarter
AS Response Time DBMS Server Response Time
Relative Improvement due to Paralleism
0.0
50.0
100.0
150.0
200.0
250.0
1 2 3 4 5
Series1
Predicted Parallel Processing Impact
0.000
0.200
0.400
0.600
0.800
1.000
1.200
1 2 3 4 5
AS Response Time DBMS Server Response Time

Strategic Decisions
How to Justify Enterprise Data Warehouse
Master Data ManagementHardware
DBMS

Optimization of Placement Data and Applications
© Boris Zibitsker, BEZ, St Louis CMG - Feb 12, 2008
Very Large Disks
LargeDisks
SmallDisks
Tapes Solid State
Data
EDWDW
AS AS AS
HubHub
Applications
29

EDW
Justification of EDWPredicting How EDW Will Affect ETL and Information Access Time
DataMart 3Data
Mart 3
DataMart 4Data
Mart 4
DataMart 2Data
Mart 2
DataMart 5Data
Mart 5
DataMart 1Data
Mart 1Source
SourceSource
Source ETL ETL
SourceSource
Information Access Time (DM)
SourceSource
SourceSource
SourceSource
Extract Extract Standard
Transform Standard
Transform
StageStage
StageStage
Data Mart Transform
Data Mart Transform
ETL(DM) Time
ETL (EDW)
DataMart 4Data
Mart 4
DataMart 5Data
Mart 5
Data Mart 3
Data Mart 3
DataMart 2Data
Mart 2
DataMart 1Data
Mart 1
DataMart 6Data
Mart 6
AA
BB CC∑(A,B)∑(A,B)
Information Access Time (EDW)
Factors Affecting EDW Justification:• Hardware cost• Software licenses• ETL process• Support personnel
30© Boris Zibitsker, BEZ, St Louis CMG - Feb 12, 2008

31
What Is the Best Architecture and Hardware Configuration for Specific EDW Workloads?
DB2 UDB vs. Oracle RAC vs. Teradata
© Boris Zibitsker, BEZ, St Louis CMG - Feb 12, 2008

Differences Between Parallel Processing on Teradata and Oracle
Limited # of Available AMP Worker Tasks
32© Boris Zibitsker, BEZ, St Louis CMG - Feb 12, 2008

Modeling Scaling Out
33© Boris Zibitsker, BEZ, St Louis CMG - Feb 12, 2008

Predicting Impact of Different Hardware Platforms and Configurations
34© Boris Zibitsker, BEZ, St Louis CMG - Feb 12, 2008

Prediction Results Show That Increase in # of Oracle RAC Nodes Will Reduces CPU Utilization, Improve Response Time
and Throughput, but Will Increase Contention for Disk
35© Boris Zibitsker, BEZ, St Louis CMG - Feb 12, 2008
I/O Rate * 10

36
Master Data Store (MDS)―Planning and Managing Challenges
What are the performance implications of supporting centralized Master Data Store vs. distributed repositories of Master Data?
ODS
EDW
DM
MDS MD
MD
MD
Current
Historical
© Boris Zibitsker, BEZ, St Louis CMG - Feb 12, 2008

37
What Are the Performance Implications of Supporting Centralized MDM vs. Distributed Repositories for
MDM? (Hub vs. Spoke Architectures)
HubHub
Start with hub and when frequency of accesses increases, consider spoke
Start with hub and when frequency of accesses increases, consider spoke
MDSCurrent & Historical Data
© Boris Zibitsker, BEZ, St Louis CMG - Feb 12, 2008

Tactical Decisions
How to Reduce Time to Load Growing Volume of Data
How to Reduce Data Access Time
How to Predict the Impact of New Application Implementation

39
Technology
Processes
Workload
Data
Increase in Volume of Data and Change of Pattern Accessing Data Affects Each Workload’s
Performance
Increase in volume of data and pattern of data access affects:
© Boris Zibitsker, BEZ, St Louis CMG - Feb 12, 2008
PredictFuture
Bottleneck
PredictFuture
Bottleneck
Identify Critical
WorkloadUsers, SQL
Tables, WhichWill CauseProblems
Identify Critical
WorkloadUsers, SQL
Tables, WhichWill CauseProblems
UseDBMS
Wizardsto Find Tuning
Options
UseDBMS
Wizardsto Find Tuning
Options
UseModeling to
Justify Change &
Verify Results
UseModeling to
Justify Change &
Verify Results
• ETL Time• Disk utilization• Aggregation and summarization time• Data access time• Session, thread usage time• Buffer utilization and hit ratio• DBMS server and application server CPU utilization• Internode communication utilization• Enterprise service bus utilization• Response time and throughput
• ETL Time• Disk utilization• Aggregation and summarization time• Data access time• Session, thread usage time• Buffer utilization and hit ratio• DBMS server and application server CPU utilization• Internode communication utilization• Enterprise service bus utilization• Response time and throughput

© Boris Zibitsker, BEZ, St Louis CMG - Feb 12, 2008 40
Predicting Database Tuning Impact Creation of the Index – See Spreadsheet

© Boris Zibitsker, BEZ, St Louis CMG - Feb 12, 2008 41
Predicting Database Tuning Impact
Plan
APPLICATION SERVER Now Q1 Q2 Q3 Q4 Now Q1 Q2 Q3 Q4
Arrival Rate (Tr/Sec) 2.50 3.00 3.50 4.00 4.50 2.50 3.00 3.50 4.00 4.50
CPU Service Time per TR (MS) 120.00 120.00 120.00 120.00 120.00 120.00 120.00 120.00 120.00 120.00Number of I/Os per Tr 4.00 4.00 4.00 4.00 4.00 4.00 4.00 4.00 4.00 4.00
Number of I/Os to Disk 1 per TR 2.00 2.00 2.00 2.00 2.00 2.00 2.00 2.00 2.00 2.00
Number of I/Os to Disk 2 per TR 2.00 2.00 2.00 2.00 2.00 2.00 2.00 2.00 2.00 2.00CPU Utilization (0-1) 0.30 0.36 0.42 0.48 0.54 0.30 0.36 0.42 0.48 0.54 Disk1 Service Time (ms) 10.00 10.00 10.00 10.00 10.00 10.00 10.00 10.00 10.00 10.00Disk 2 Service Time (ms) 10.00 10.00 10.00 10.00 10.00 10.00 10.00 10.00 10.00 10.00DBMS SERVER
Arrival Rate (Tr/Sec) 2.50 3.00 3.50 4.00 4.50 2.50 3.00 3.50 4.00 4.50
CPU Service Time per TR (MS) 160.00 160.00 160.00 160.00 160.00 160.00 160.00 160.00 160.00 160.00Number of I/Os per Tr 30.00 30.00 30.00 30.00 30.00 30.00 20.00 20.00 20.00 20.00
Number of I/Os to Disk 1 per TR 20.00 20.00 20.00 20.00 20.00 20.00 10.00 10.00 10.00 10.00
Number of I/Os to Disk 2 per TR 10.00 10.00 10.00 10.00 10.00 10.00 10.00 10.00 10.00 10.00CPU Utilization (0-1) 0.40 0.48 0.56 0.64 0.72 0.40 0.48 0.56 0.64 0.72 Disk1 Service Time (ms) 10.00 10.00 10.00 10.00 10.00 10.00 10.00 10.00 10.00 10.00Disk 2 Service Time (ms) 10.00 10.00 10.00 10.00 10.00 10.00 10.00 10.00 10.00 10.00
Workload Growth is 20% per Quarter Database Tuning

© Boris Zibitsker, BEZ, St Louis CMG - Feb 12, 2008 42
Predicting Database Tuning Impact
Performance Prediction
Application Server Now Q1 Q2 Q3 Q4 Now Q1 Q2 Q3 Q4
Performance PredictionScpu(ms) per Visit to CPU 24.000 24.000 24.000 24.000 24.000 24.000 24.000 24.000 24.000 24.000UCPU 0.300 0.360 0.420 0.480 0.540 0.300 0.360 0.420 0.480 0.540UDisk1 0.050 0.060 0.070 0.080 0.090 0.050 0.060 0.070 0.080 0.090UDisk2 0.050 0.060 0.070 0.080 0.090 0.050 0.060 0.070 0.080 0.090
CPU Resp Time for 1 Visit to CPU (sec) 0.034 0.038 0.041 0.046 0.052 0.034 0.038 0.041 0.046 0.052AS CPU RT/Req 0.171 0.188 0.207 0.231 0.261 0.171 0.188 0.207 0.231 0.261Disk 1 Resp Time 0.011 0.011 0.011 0.011 0.011 0.011 0.011 0.011 0.011 0.011Dist 1 AS Time 0.021 0.021 0.022 0.022 0.022 0.021 0.021 0.022 0.022 0.022Disk 2 Resp Time 0.011 0.011 0.011 0.011 0.011 0.011 0.011 0.011 0.011 0.011Disk 2 AS Time 0.021 0.021 0.022 0.022 0.022 0.021 0.021 0.022 0.022 0.022AS Response Time 0.214 0.230 0.250 0.274 0.305 0.214 0.230 0.250 0.274 0.305
DBMS Server Perf predictionScpu(ms) per Visit to CPU 5.161 5.161 5.161 5.161 5.161 5.161 7.619 7.619 7.619 7.619UCPU 0.400 0.480 0.560 0.640 0.720 0.400 0.480 0.560 0.640 0.720UDisk1 0.500 0.600 0.700 0.800 0.900 0.500 0.300 0.350 0.400 0.450UDisk2 0.250 0.300 0.350 0.400 0.450 0.250 0.300 0.350 0.400 0.450
CPU RT/1 Visit(sec) 0.009 0.010 0.012 0.014 0.018 0.009 0.015 0.017 0.021 0.027DBMS CPU RT/Req 0.267 0.308 0.364 0.444 0.571 0.267 0.308 0.364 0.444 0.571Disk 1 I/O Resp Time 0.020 0.025 0.033 0.050 0.100 0.020 0.014 0.015 0.017 0.018Disk 2 I/O Resp Time 0.013 0.014 0.015 0.017 0.018 0.013 0.014 0.015 0.017 0.018Disk 1 DBMS Time 0.400 0.500 0.667 1.000 2.000 0.400 0.143 0.154 0.167 0.182Disk 2 DBMS Time 0.133 0.143 0.154 0.167 0.182 0.133 0.143 0.154 0.167 0.182
DBMS Server Response Time 0.800 0.951 1.184 1.611 2.753 0.800 0.593 0.671 0.778 0.935Total Response Time 1.014 1.181 1.434 1.885 3.058 1.014 0.823 0.921 1.052 1.240Relative Improvement RT 0.000 43.371 55.667 79.212 146.641
Database TuningWorkload Growth is 20% per Quarter

© Boris Zibitsker, BEZ, St Louis CMG - Feb 12, 2008 43
Predicting Database Tuning Impact
Predicted Response Time for Sales (sec)
0.000
0.500
1.000
1.500
2.000
2.500
3.000
3.500
1 2 3 4 5
Quarter
AS Response Time DBMS Server Response Time
Database Tuning Impact
0.000
0.200
0.400
0.600
0.800
1.000
1.200
1.400
1 2 3 4 5
Quarter
AS Response Time DBMS Server Response Time
Relative Improvement RT
DB Tuning
0.000
20.000
40.000
60.000
80.000
100.000
120.000
140.000
160.000
1 2 3 4 5
Relative Improvement RT

44
Example: Can I load growing volume of data on time, and how will data load affect other workloads?
It will take 6 times longer to load growing volume of
data in 10 months. RT for HR application will increase almost 2 times & throughput for ETL will be
reduced almost 2 times
It will take 6 times longer to load growing volume of
data in 10 months. RT for HR application will increase almost 2 times & throughput for ETL will be
reduced almost 2 times
© Boris Zibitsker, BEZ, St Louis CMG - Feb 12, 2008
Transform
Extract
LoadTransform
Transport
ETL Source ETL Target

45
What is the Minimum Hardware Upgrade Required to Load Growing Volume of Data on Time?
© Boris Zibitsker, BEZ, St Louis CMG - Feb 12, 2008

46
What if we Increase the Number of Parallel ETL Utilities Loading Data in Parallel Starting Next Month (p2) and
Upgrade Hardware (p5)?
Increase in # of loads will allow significant
reduction of load time, but there will be very
significant elongation of the RT for HR, Marketing
and Sales workloads
Increase in # of loads will allow significant
reduction of load time, but there will be very
significant elongation of the RT for HR, Marketing
and Sales workloads
© Boris Zibitsker, BEZ, St Louis CMG - Feb 12, 2008

47
Predicted Impact of the Implementation of Parallel Processing Based on Oracle 10g RAC
Implementation of parallel processing
will improve response time for complex queries almost 2 times
Implementation of parallel processing
will improve response time for complex queries almost 2 times
© Boris Zibitsker, BEZ, St Louis CMG - Feb 12, 2008

© Boris Zibitsker, BEZ, St Louis CMG - Feb 12, 2008 48
Example Showing How Modeling Results Identify Potential Bottlenecks and SQL That Will
Cause Problems in the Future by Workload
When will SLO not be met?What will cause the problem?Who will cause the problem?How do you fix the problem?
What are database and application tuning alternatives?What are the expected savings?
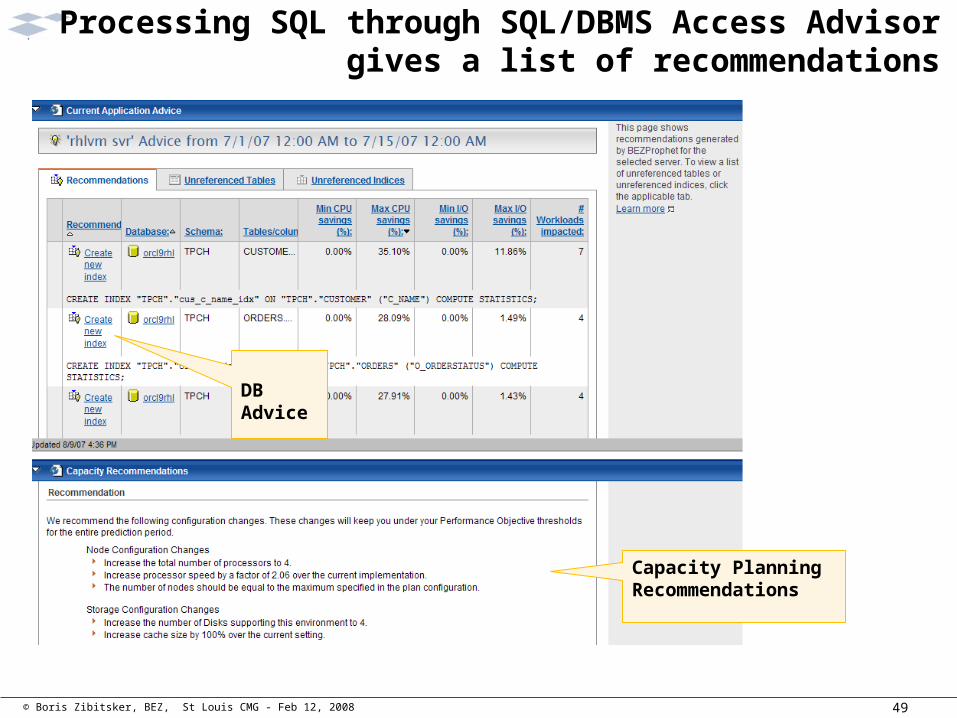
DBAdvice
Capacity PlanningRecommendations
Processing SQL through SQL/DBMS Access Advisor gives a list of recommendations
49© Boris Zibitsker, BEZ, St Louis CMG - Feb 12, 2008

Example Showing Predicted Impact of Recommended Indexes
50© Boris Zibitsker, BEZ, St Louis CMG - Feb 12, 2008

Predicted Data Compression Impact on Different Workloads
Data compression will have different impact on different
workloads. DW workloads with primarily SELECT type of requests
will benefit more.
Data compression will have different impact on different
workloads. DW workloads with primarily SELECT type of requests
will benefit more.
51© Boris Zibitsker, BEZ, St Louis CMG - Feb 12, 2008

Data partitioning will have a positive impact on performance
for all workloads.
Data partitioning will have a positive impact on performance
for all workloads.
Predicted Impact of Data Partitioning
52© Boris Zibitsker, BEZ, St Louis CMG - Feb 12, 2008

Performance Prediction Results Based on Oracle Memory Advisor Reflect the Impact of the Workload Growth and
Memory Pool Size Change
53© Boris Zibitsker, BEZ, St Louis CMG - Feb 12, 2008
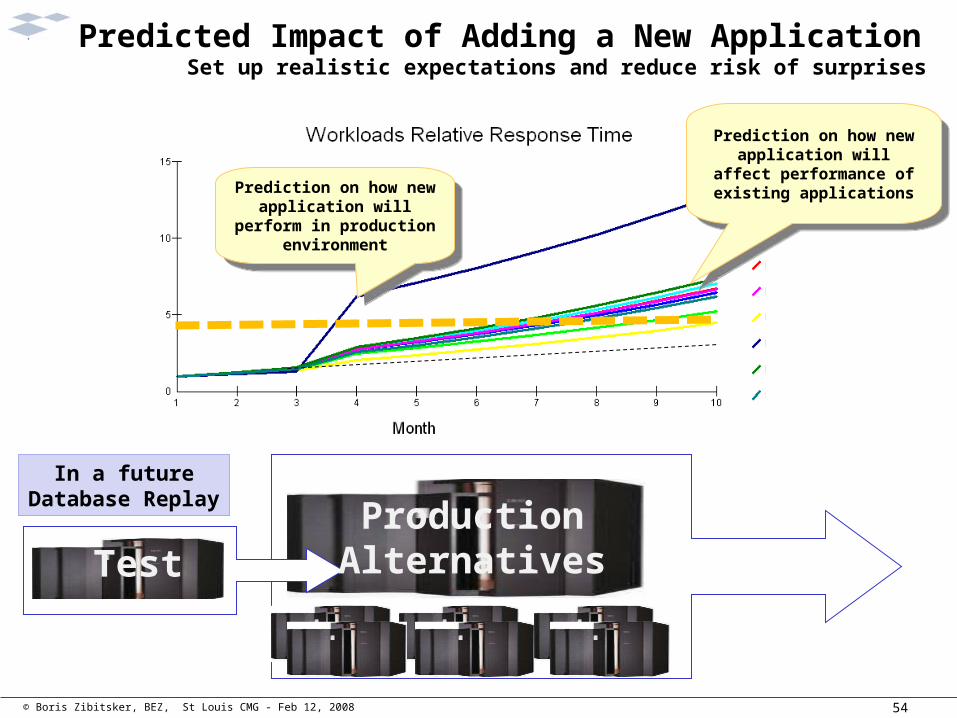
Predicted Impact of Adding a New Application Set up realistic expectations and reduce risk of surprises
Prediction on how new application will perform in production environment
Prediction on how new application will perform in production environment
Prediction on how new application will affect
performance of existing applications
Prediction on how new application will affect
performance of existing applications
TestProductionAlternatives
In a futureDatabase Replay
54© Boris Zibitsker, BEZ, St Louis CMG - Feb 12, 2008

Predicting New HR Application Implementation Impact
55© Boris Zibitsker, BEZ, St Louis CMG - Feb 12, 2008

Modeling Results Help Customers to Set Up Realistic SLO and Negotiate SLA for Major Workload
Hardware Configuration & TCO
SL
O
Users and IT select SLO level that will provide acceptable
performance with acceptable Total Cost of Ownership
(TCO)
Prediction results allow customers to negotiate SLA
between business and IT
For expected workload and database size growth, IT
guarantees delivery of a certain level of responsiveness and
throughput
Expected workload & DB growth
Predicted RT for one of the Workloads
SLA
56© Boris Zibitsker, BEZ, St Louis CMG - Feb 12, 2008

Operational Decisions
Workload Priority SchedulingOrganizing Continuous Proactive Performance
ManagementVirtual Tape Library

58
Predicting How Change of the Workload’s Priority Will Affect Performance
Sales workload priority increase will
improve Sales RT, but other workloads will
suffer
Sales workload priority increase will
improve Sales RT, but other workloads will
suffer
© Boris Zibitsker, BEZ, St Louis CMG - Feb 12, 2008

Comparison of Actual Results vs. Expected and Organizing Continuous Proactive Service Level Management
• Find difference between predicted results or expectations (red line) and actual measurement data
• Track how often the actual results do not meet expectation (SLA)
• When number of exceptions exceeds the threshold, generate alert
• Explain difference and develop new corrective recommendations
59© Boris Zibitsker, BEZ, St Louis CMG - Feb 12, 2008
• Identify when SLO will not be met for each workload
• Identify what will be a bottleneck
• Identify which workload will cause the performance degradation

60
Summary
Use modeling to evaluate options and justify EDM strategic, tactical and operational decisions to satisfy contradictive business requirements for timeliness and flexibility, accuracy, acceptable performance and minimum cost
Organize a continuous process of applying models for justifying EDM decisions, setting expectations, verifying results and finding effective proactive corrections during application and information life cycle
Workload characterization and modeling allow identification of which data and applications are used by individual lines of business and business processes, and focus EDM decisions and efforts on proactively addressing the most important strategic, tactical and operational IT issues
© Boris Zibitsker, BEZ, St Louis CMG - Feb 12, 2008

Thank You! Questions?Dr. Boris [email protected]


