30
Enterprise | Interest No disclosures for this presentation.

Enterprise | Interest
No disclosures for this presentation.
To test or not to test – that’s the questionStatus and lessons learned from checkpoint
inhibition in NSCLC
Egbert F. Smit MD PhD
Dept. Thoracic Oncology
Netherlands Cancer Institute

Checkpoint inhibition in NSCLC
<2015 >2015
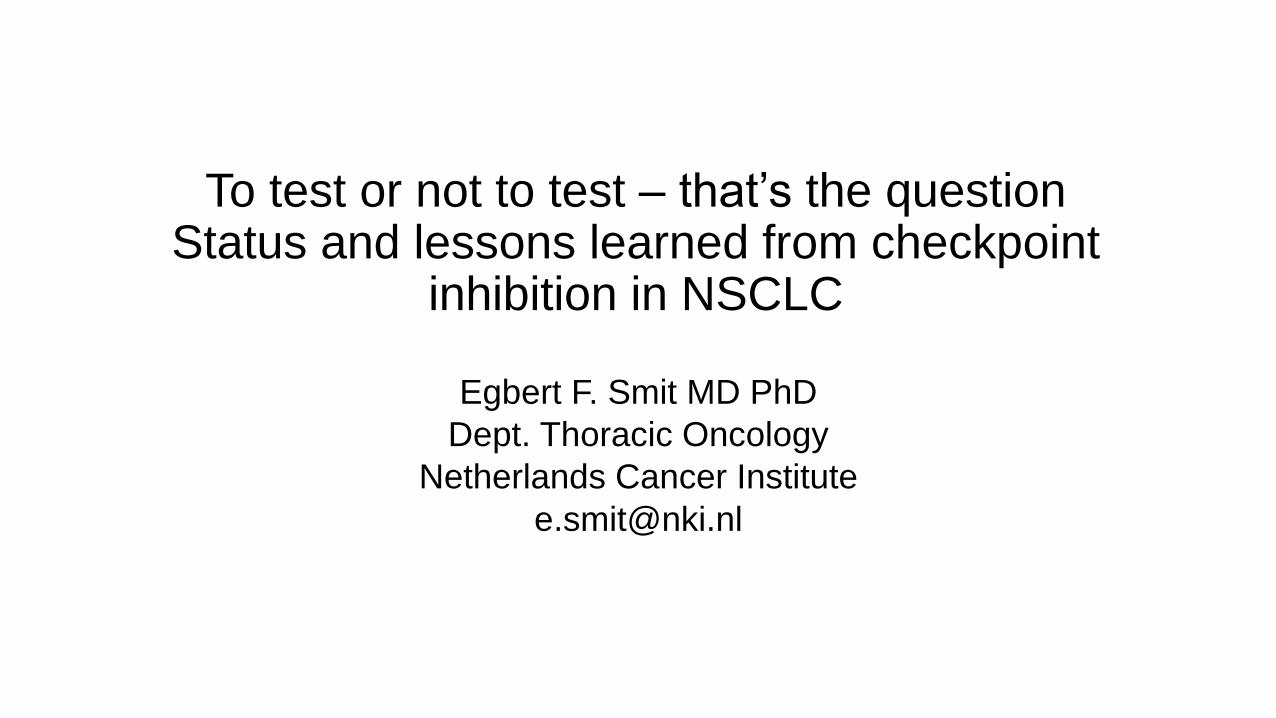
Phase I experience
Brahmer et al. NEJM 2012, Topalian et al. NEJM 2012
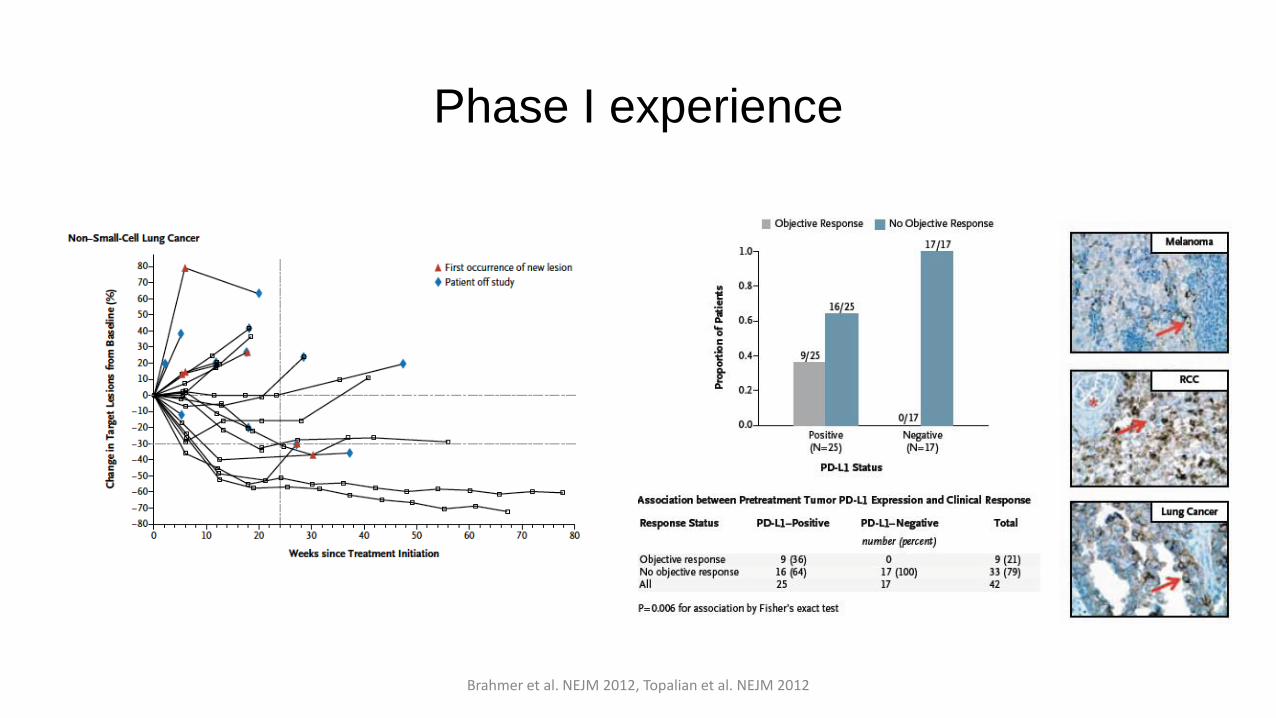
Subset of patients derives benefitNo responses in PD-L1 negative patients
Brahmer et al. NEJM 2012, Topalian et al. NEJM 2012
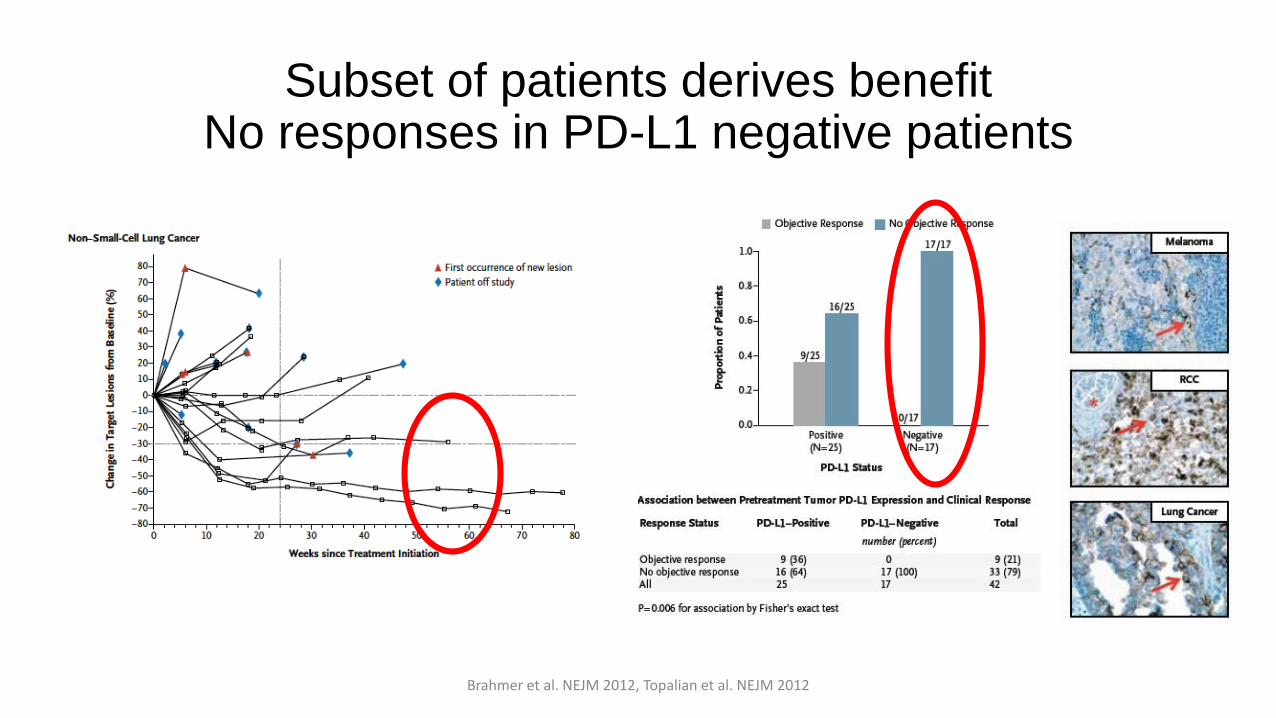
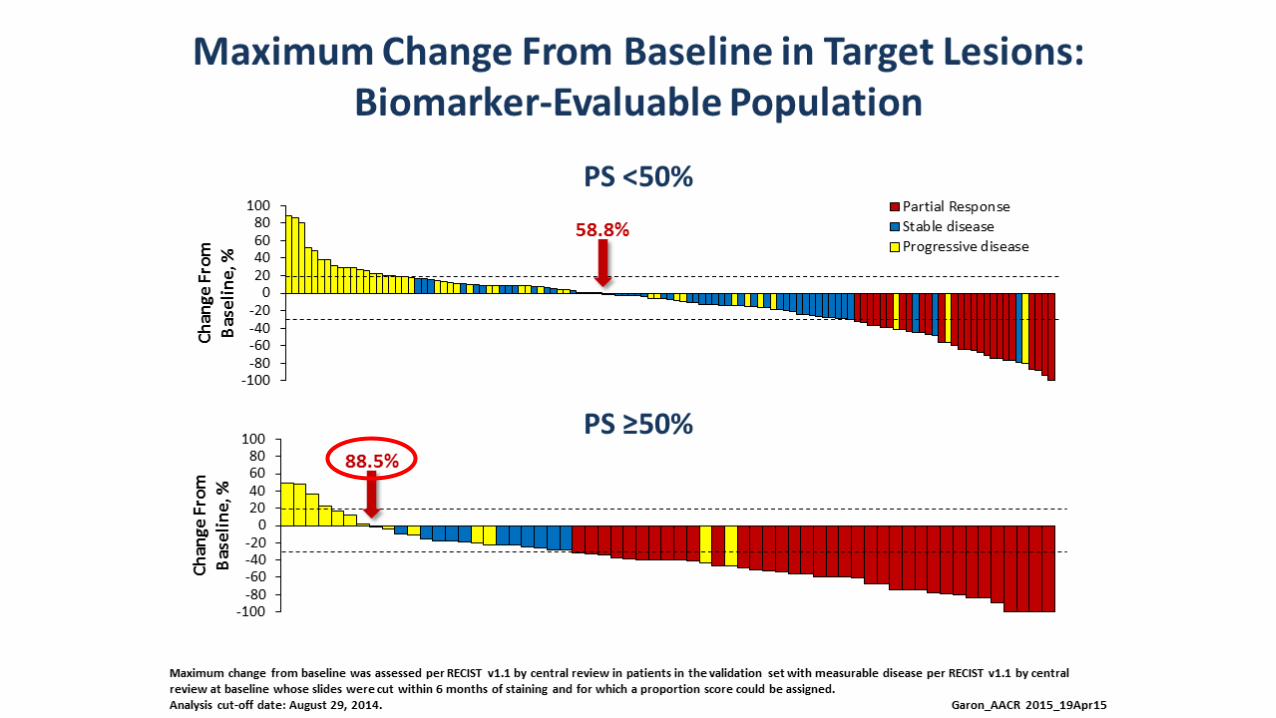
Pembrolizumab Phase I by tumor proportion score
Garon et al. NEJM 2015

Phase III experience
• In 2nd line treatment of NSCLC
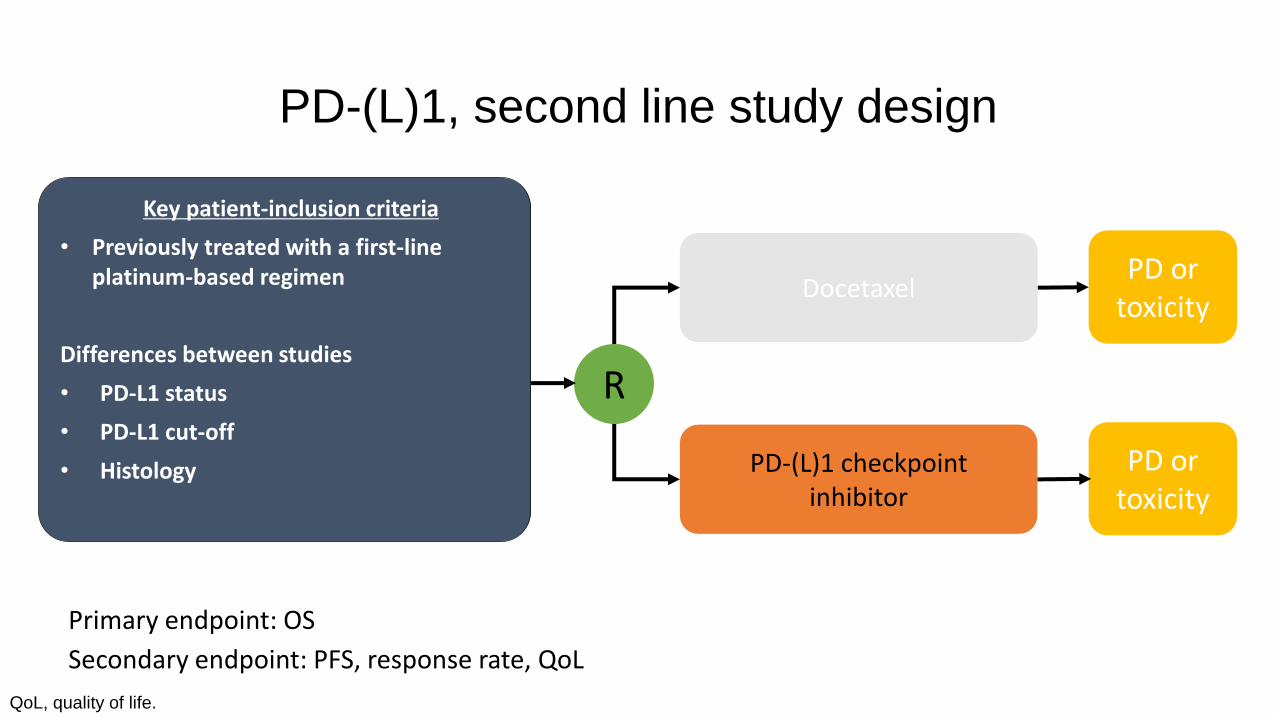
PD-(L)1, second line study design
QoL, quality of life.
PD-(L)1 checkpoint inhibitor
PD or toxicity
DocetaxelPD or
toxicity
Key patient-inclusion criteria
• Previously treated with a first-line platinum-based regimen
Differences between studies
• PD-L1 status
• PD-L1 cut-off
• Histology
R
Primary endpoint: OS
Secondary endpoint: PFS, response rate, QoL

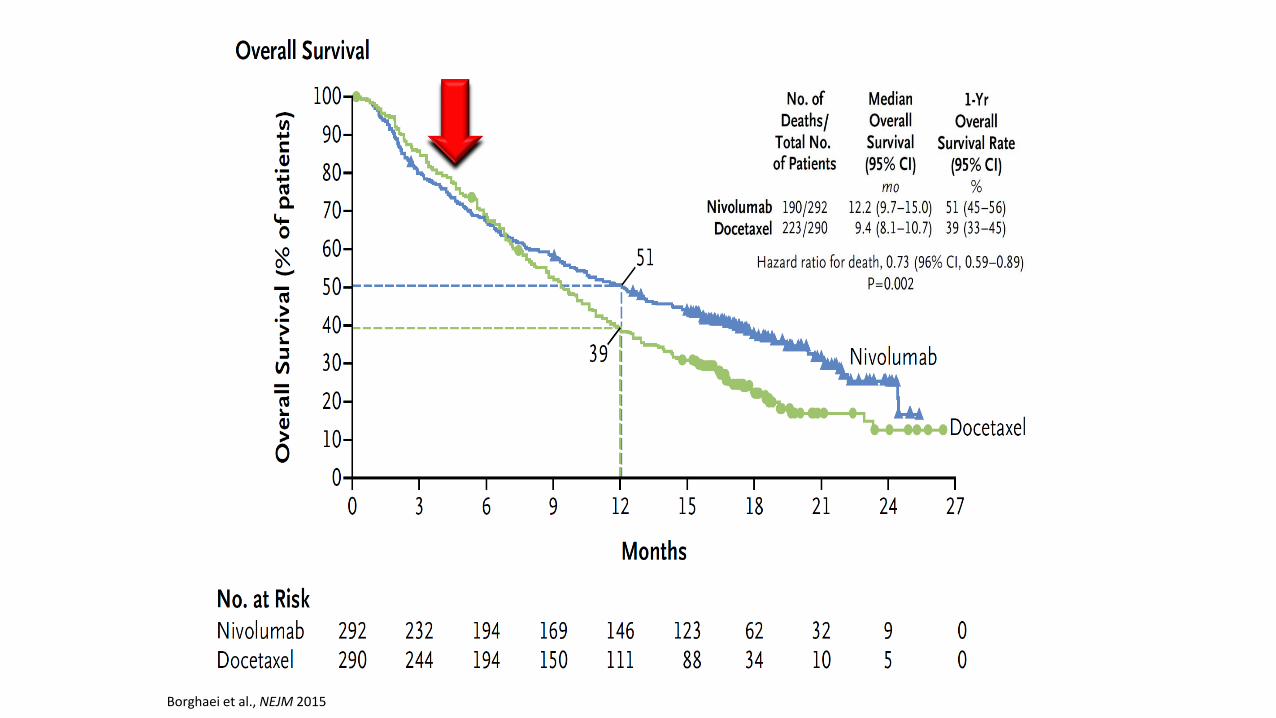
NivolumabNon-squamous, no PD-L1 selection
Borghaei H, et al. New Engl J Med. 2015;373:1627-39.
At risk, n
Nivolumab 292 232 194 169 146 123 62 32 9 0
Docetaxel 290 244 194 150 111 88 34 10 5 0
Deaths, n/Patients, N
Median OS(95% Cl), mo
1-year OS rate (95% Cl), %
Nivolumab 190/292 12.2 (9.7–15.0) 51 (45–56)Docetaxel 223/290 9.4 (8.1–10.7) 39 (33–45)
HR for death, 0.73 (95% Cl 0.59–0.89)p = 0.002
51
39
0 3 6 9 12 15 18 21 24 27
010203040
60708090
100
50
Time (months)
OS
(%)
Nivolumab
Docetaxel
Borghaei et al., NEJM 2015

OS by PD-L1 Expression
Borghaei et al., NEJM 2015
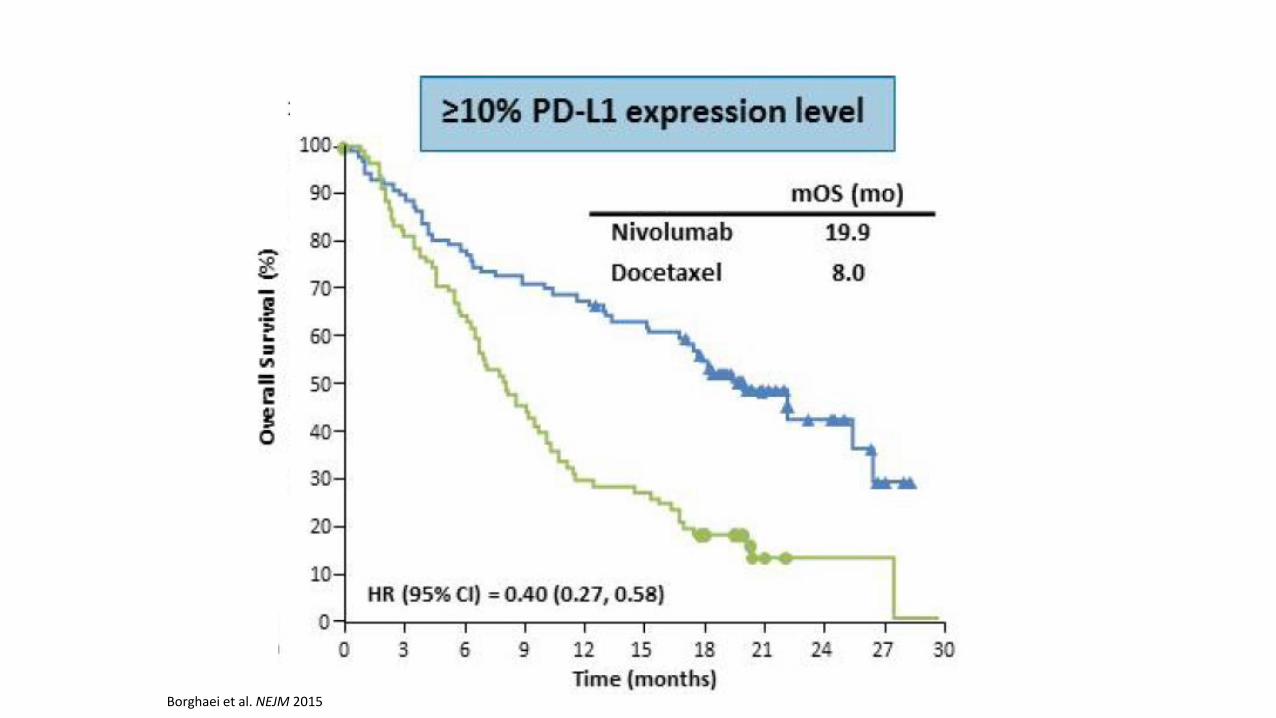
Borghaei et al. NEJM 2015
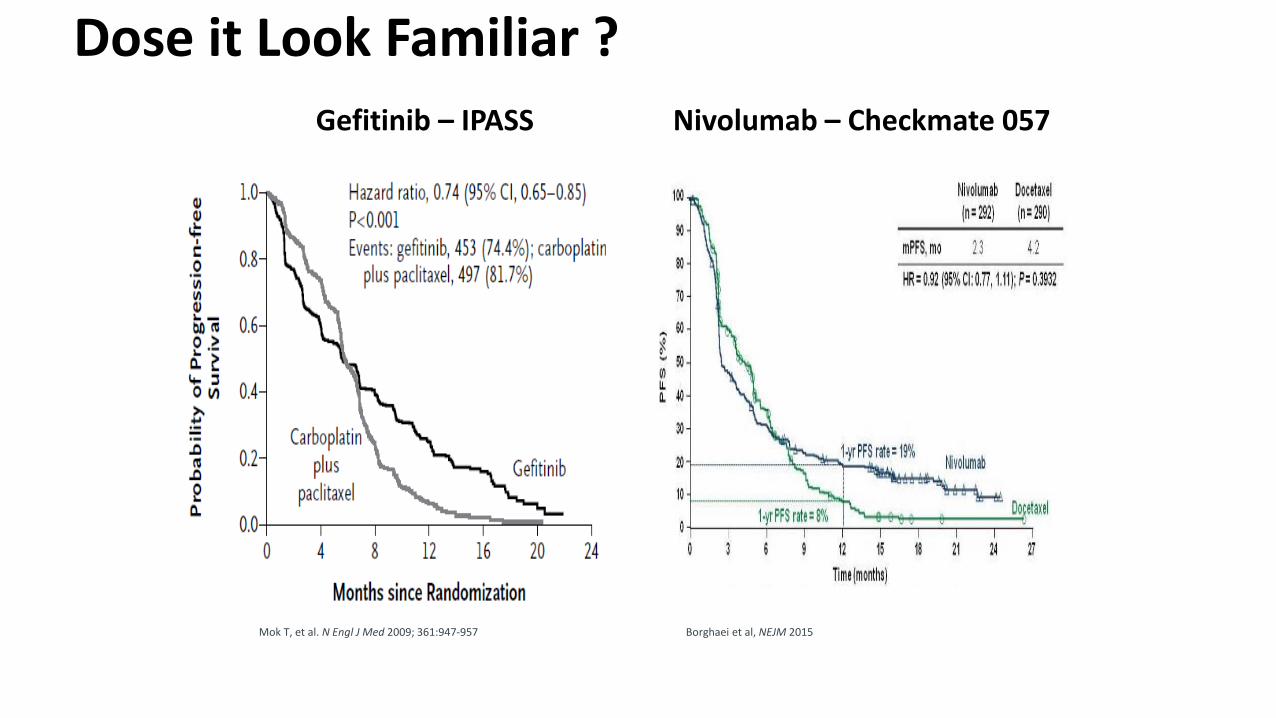
Dose it Look Familiar ?
Nivolumab – Checkmate 057 Gefitinib – IPASS
Mok T, et al. N Engl J Med 2009; 361:947-957 Borghaei et al, NEJM 2015

Patient Selection Works !
Nivolumab – Checkmate 057 Gefitinib – IPASS
Paz-Ares, ASCO, 2015Zhou et al. Lancet 2011
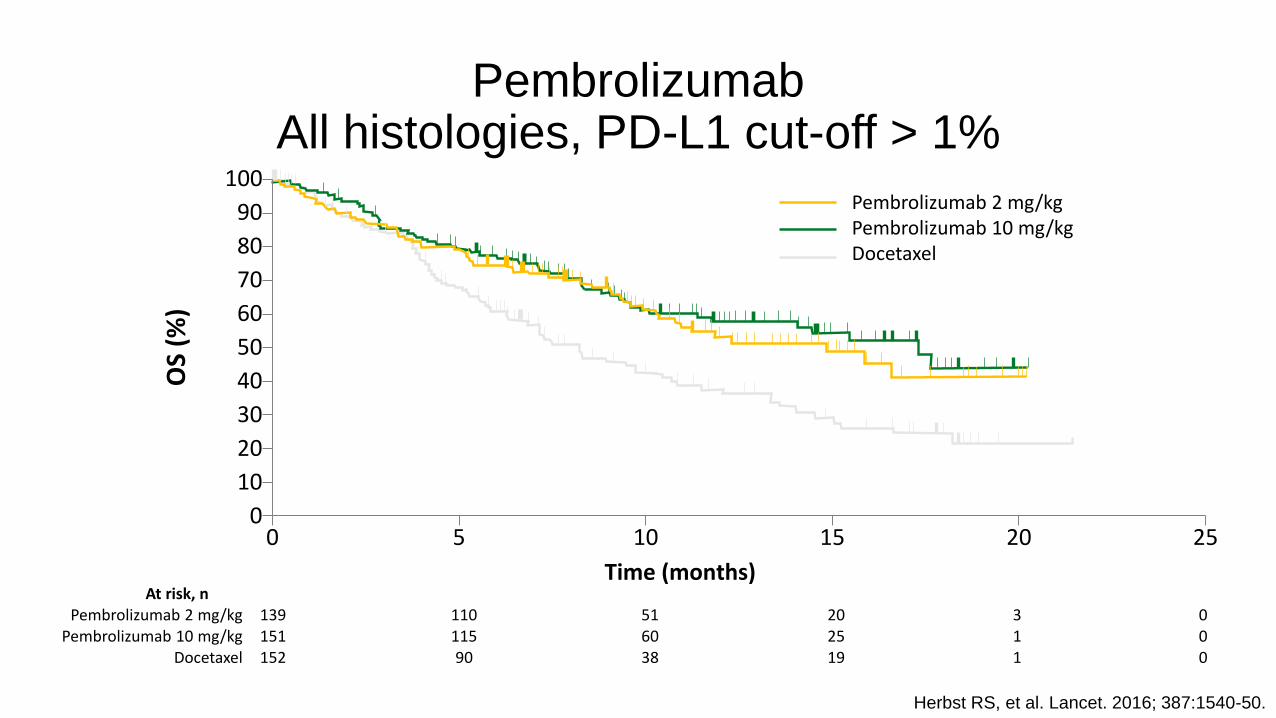
PembrolizumabAll histologies, PD-L1 cut-off > 1%
Herbst RS, et al. Lancet. 2016; 387:1540-50.
At risk, nPembrolizumab 2 mg/kg 139 110 51 20 3 0
Pembrolizumab 10 mg/kg 151 115 60 25 1 0Docetaxel 152 90 38 19 1 0
0
10
20
30
40
50
60
70
80
90
100
0 5 10 15 20 25
OS
(%)
Pembrolizumab 2 mg/kgPembrolizumab 10 mg/kgDocetaxel
Time (months)
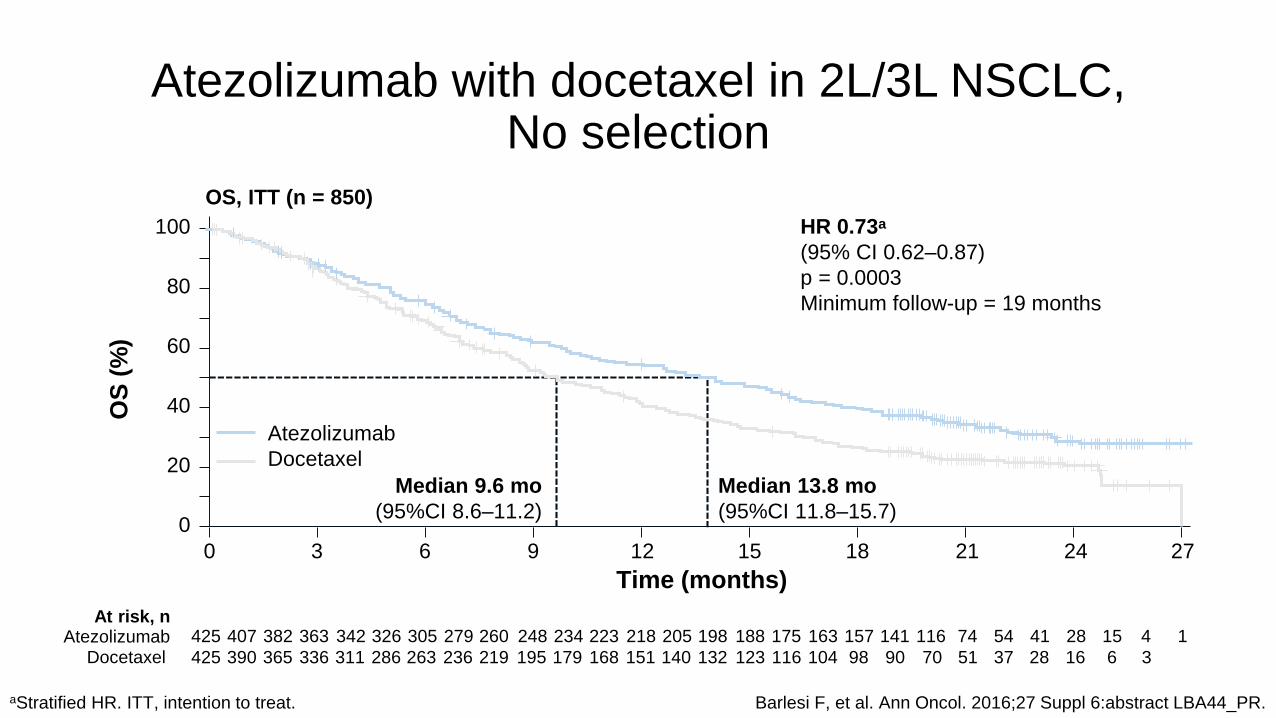
Atezolizumab with docetaxel in 2L/3L NSCLC,No selection
aStratified HR. ITT, intention to treat. Barlesi F, et al. Ann Oncol. 2016;27 Suppl 6:abstract LBA44_PR.
OS, ITT (n = 850)
HR 0.73a
(95% CI 0.62–0.87)
p = 0.0003
Minimum follow-up = 19 months
Time (months)
At risk, nAtezolizumab
Docetaxel
425 407 382 363
425
342 326 305 279 260 248 234 223 218 205 198 188 175 163 157 141 116 74 54 41 28 15 4 1
390 365 336 311 286 263 219 195 179 168 151 140 132 123 116 104 98 90 70 51 37 28 16 6 3236
OS
(%
)
Median 9.6 mo
(95%CI 8.6–11.2)
Median 13.8 mo
(95%CI 11.8–15.7)
2721 241815129630
100
80
60
40
20
0
Atezolizumab
Docetaxel
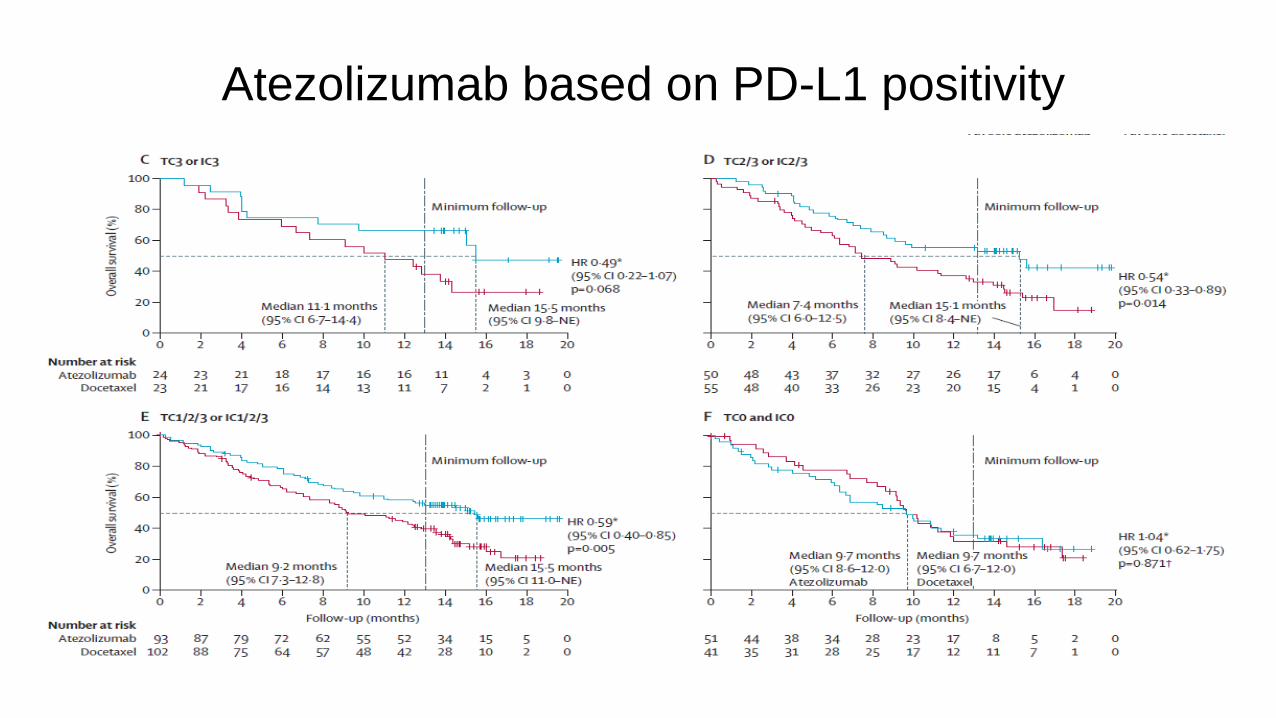
Atezolizumab based on PD-L1 positivity

Response Rate for Patientswith PD-L1 Negative NSCLC
Drug (Trial) Histology Testing Cut-off for PDL1<0
ORR
Nivolumab (Checkmate 017) Squamous Dako 28.8 <1% 17%
Nivolumab (Checkmate 057) Non-squamous Dako 28.8 <1% 9%
Atezolizumab (OAK) All histologiesVentanaSP142
TC0 + IC0 8%
Atezolizumab (Poplar) All histologies Ventana SP142 TC0 + IC0 7.8%
Durvalumab (phase I) All histologies Ventana SP263 <25% 5%
Pembrolizumab (phase I) All histologies Dako 22C3 <1% 8.1%
Avelumab (phase Ib) All histologies Not specified <1% 10%
Brahmer, NEJM 2015; Borghaei H et al. N Engl J Med 2015;373:1627-39; Fehrenbacher; Lancet 2016;
Garon, NEJM 2015; Rebelatto, ASCO 2015; Herbst, Lancet 2015; Barlesi ESMO 2016.
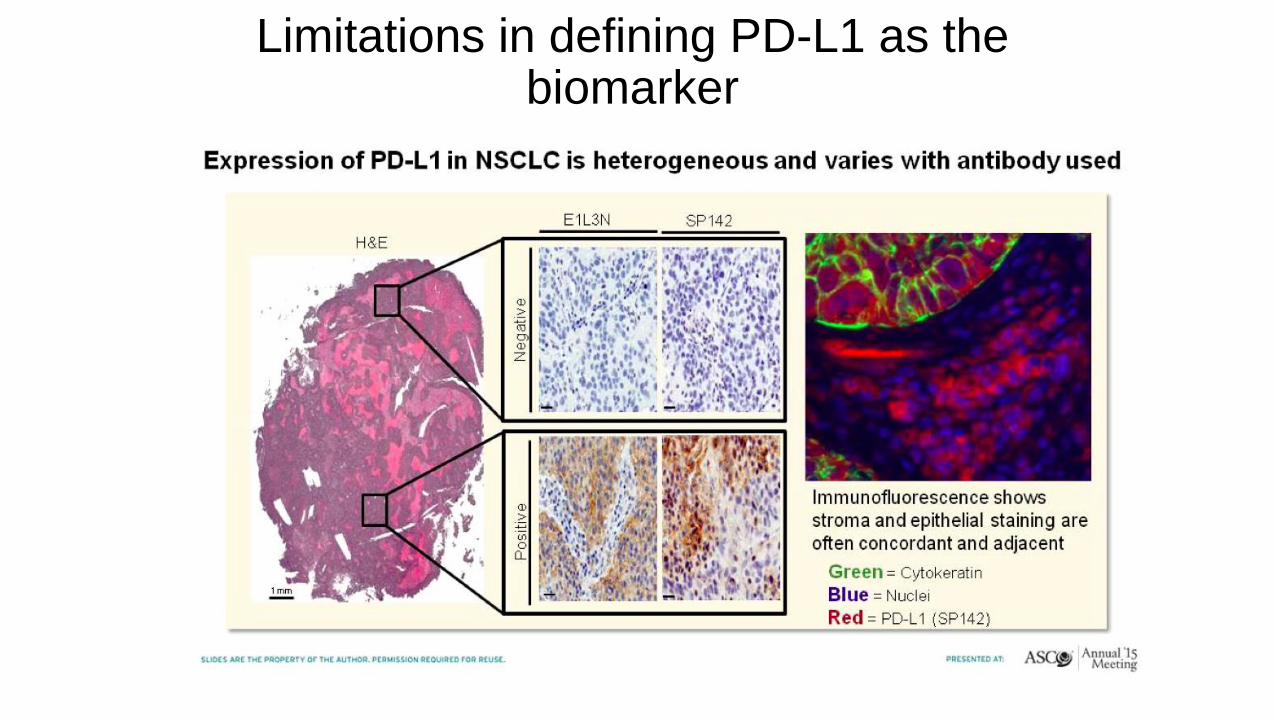
Limitations in defining PD-L1 as the biomarker
•PD-L1 “biomarker” is to be defined (mAB, platform & technique, criteria
& thresholds, tumour material & sampling)
•PD-L1 expression is dynamic
•PD-L1 is heterogeneous within tissue
•Cytoplasmic vs membranous?
•Quality of the biopsy
•Importance of co-localization with TILs

Phase III experience
• In 2nd line treatment of NSCLC
• In 1st line treatment of NSCLC
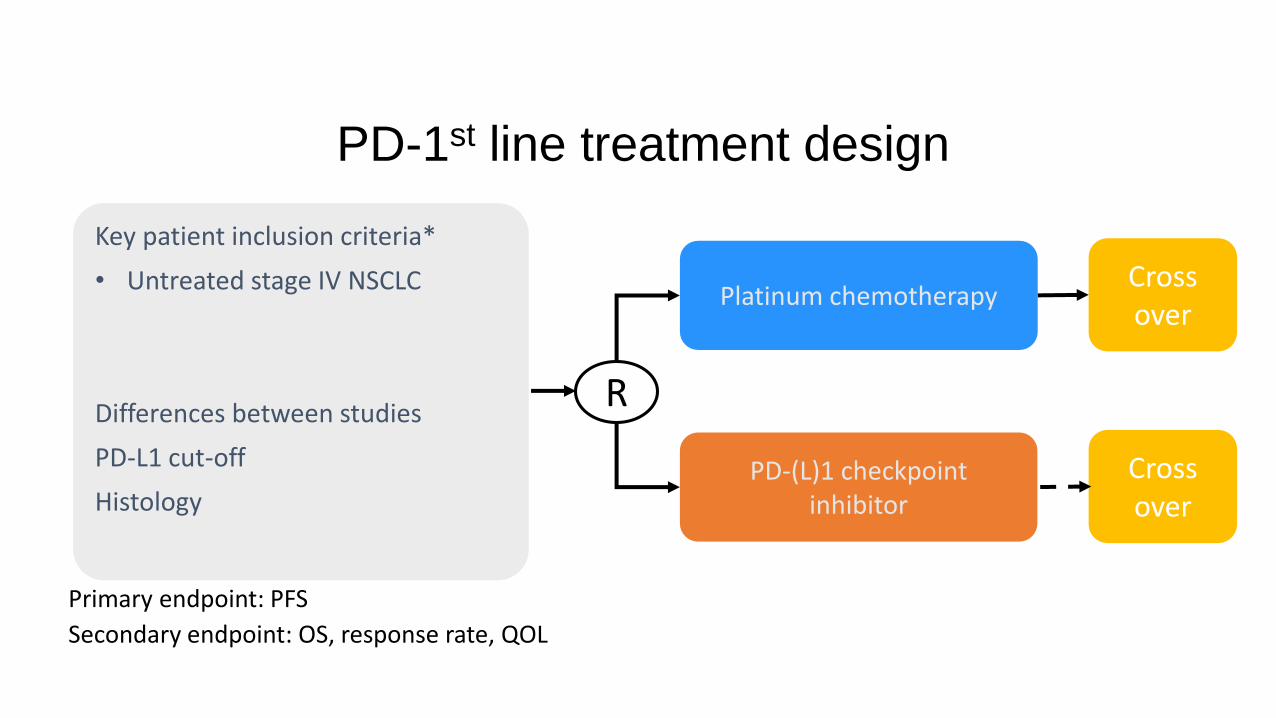
PD-1st line treatment design
Primary endpoint: PFS
Secondary endpoint: OS, response rate, QOL
PD-(L)1 checkpoint inhibitor
Cross over
Platinum chemotherapyCross over
Key patient inclusion criteria*
• Untreated stage IV NSCLC
Differences between studies
PD-L1 cut-off
Histology
R

KEYNOTE-024 study design (NCT02142738)
DoR, duration of response; ECOG, Eastern Cooperative Oncology Group; ORR, overall response rate; OS, overall survival; PD, progressive disease; TPS, tumour proportion score. Reck M, et al. Ann Oncol. 2016;27 Suppl 6:abstract LBA8_PR.
Key endpointsPrimary: PFS (RECIST v1.1 per blinded, independent central review)Secondary: OS, ORR, safetyExploratory: DoR
Key eligibility criteria
• Untreated stage IV NSCLC
• PD-L1 TPS ≥ 50%
• ECOG PS 0–1
• No activating EGFR mutation or ALKtranslocation
• No untreated brain metastases
• No active autoimmune disease requiring systemic therapy
Pembrolizumab 200 mg i.v. q3w
(2 years)
R (1:1)N = 305
PDaPembrolizumab
200 mg q3w for 2 years
Platinum-doublet chemotherapy
(4–6 cycles)
aTo be eligible for crossover, PD had to be confirmed by blinded, independent central radiology review and all safety criteria had to be met.
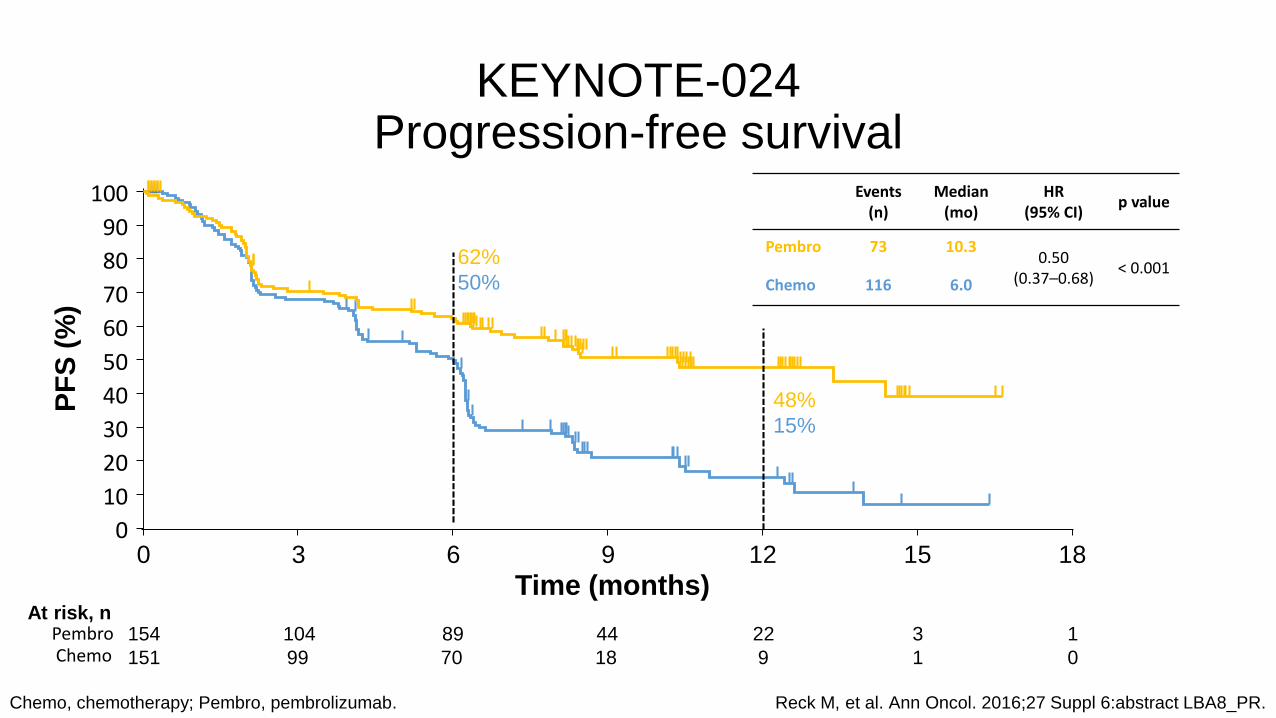
KEYNOTE-024 Progression-free survival
Chemo, chemotherapy; Pembro, pembrolizumab. Reck M, et al. Ann Oncol. 2016;27 Suppl 6:abstract LBA8_PR.
Events(n)
Median (mo)
HR (95% CI)
p value
Pembro 73 10.30.50
(0.37–0.68)< 0.001
Chemo 116 6.0
PF
S (
%)
62%
50%
0 3 6 9 12 15 180
10
20
30
40
50
60
70
80
90
100
Time (months)
48%
15%
At risk, n154 104 89 44 22 3 1
151 99 70 18 9 1 0
PembroChemo

Overall Survival
Data cut-off: May 9, 2016.
80%72%
0 3 6 9 12 15 18 210
102030405060708090
100
Time, months
OS,%
No. at risk
154 136 121 82 39 11 0151 123 106 64 34 7 0
21
70%54%
Events, n Median,
mo
HR
(95% CI)
P
Pembro 44 NR 0.60
(0.41-0.89)0.005
Chemo 64 NR
Reck M, et al. ESMO 2016; LBA08

aDako 28-8 validated; archival tumor samples obtained ≤6 months before enrollment were permitted; PD-L1 testing was centralizedbSquamous: gemcitabine 1250 mg/m2 + cisplatin 75 mg/m2; gemcitabine 1000 mg/m2 + carboplatin AUC 5; paclitaxel 200 mg/m2 + carboplatin AUC 6; Non-squamous:
pemetrexed 500 mg/m2 + cisplatin 75 mg/m2; pemetrexed 500 mg/m2 + carboplatin AUC 6; option for pemetrexed maintenance therapycNo washout required before crossover
Phase 3 CheckMate 026 Study Design:
Nivolumab vs Chemotherapy in First-line NSCLC
Nivolumab3 mg/kg IV Q2W
n = 271Randomize 1:1
Key eligibility criteria:
• Stage IV or recurrent NSCLC
• No prior systemic therapy for advanced disease
• No EGFR/ALK mutations sensitive to available targeted inhibitor therapy
• ≥1% PD-L1 expressiona
• CNS metastases permitted if adequately treated at least 2 weeks prior to randomization
Chemotherapy (histology dependent)b
Maximum of 6 cycles
n = 270
Disease progression or unacceptable toxicity
Disease progression
Crossover nivolumabc
(optional)
Tumor scans Q6W until wk48 then Q12W
Socinski et al. ESMO 2016; LBA07

No. of patients at risk:
Nivolumab 211 104 71 49 35 24 6 3 1 0
Chemotherapy 212 144 74 47 28 21 8 1 0 0
Nivolumab
Chemotherapy
Months
PFS
(%
)
2421181512963 27
100
80
60
40
0
20
0
Primary Endpoint (PFS per IRRC in ≥5% PD-L1+)CheckMate 026: Nivolumab vs Chemotherapy in First-line NSCLC
Nivolumab
n = 211
Chemotherapy
n = 212
Median PFS, months
(95% CI)
4.2
(3.0, 5.6)
5.9
(5.4, 6.9)
1-year PFS rate, % 23.6 23.2
All randomized patients (≥1% PD-L1+): HR = 1.17 (95% CI: 0.95, 1.43)
HR = 1.15 (95% CI: 0.91, 1.45), P = 0.2511
Socinski et al. ESMO 2016; LBA07
No. of patients at risk:
Nivolumab 211 186 156 133 118 98 49 14 4 0 0
Chemotherapy 212 186 153 137 112 91 50 15 3 1 0
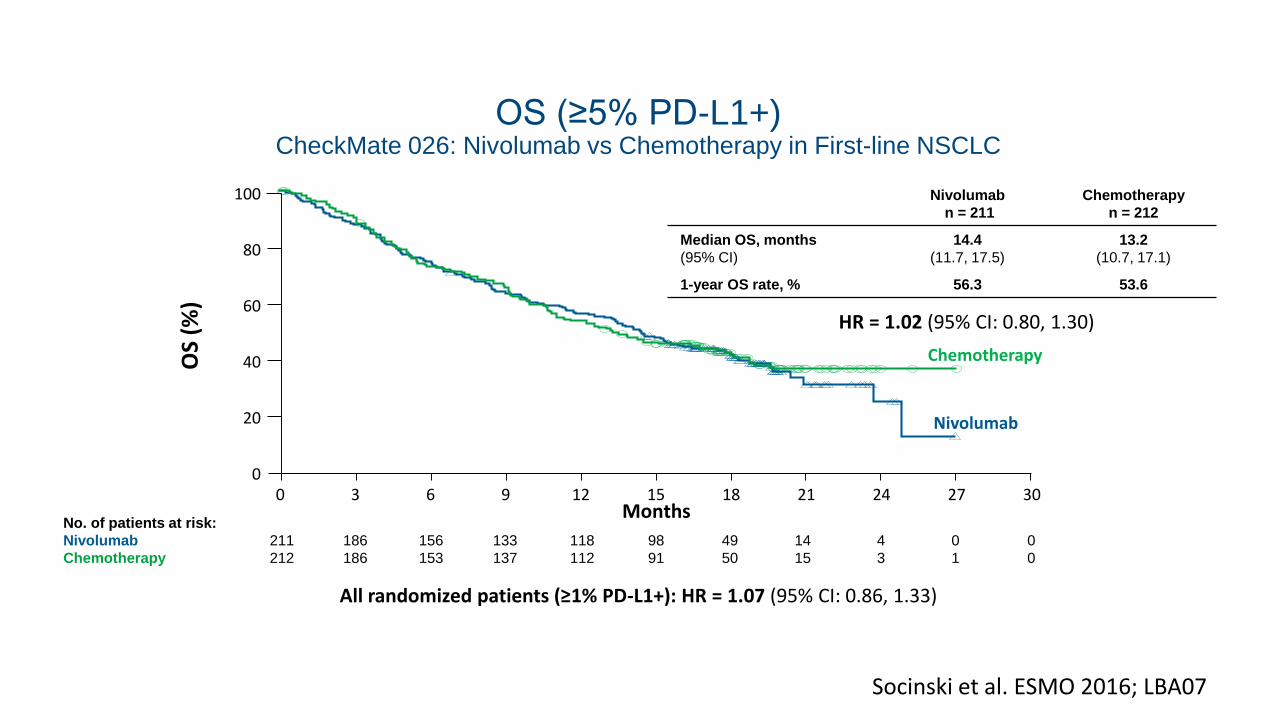
OS (≥5% PD-L1+)CheckMate 026: Nivolumab vs Chemotherapy in First-line NSCLC
Nivolumab
n = 211
Chemotherapy
n = 212
Median OS, months
(95% CI)
14.4
(11.7, 17.5)
13.2
(10.7, 17.1)
1-year OS rate, % 56.3 53.6
Months
OS
(%)
2421181512963 30
100
80
60
40
0
20
0 27
Nivolumab
Chemotherapy
All randomized patients (≥1% PD-L1+): HR = 1.07 (95% CI: 0.86, 1.33)
HR = 1.02 (95% CI: 0.80, 1.30)
Socinski et al. ESMO 2016; LBA07

A novel clinical useful test at the horizon?
Carbone et al. NEJM 2017

Lessons learned
• Immune checkpoint inhibition is effective in a subset of NSCLC patients
• These patients are (in part) defined by high PD-L1 expression
• Cooperation between pathologists and clinicians is crucial


![Brain metastases - University at Buffalo · related, and cancer remains the second leading cause of death [1]. Brain metastases are among the most feared ... Metastases from breast,](https://static.documents.pub/doc/80x56/5b0afd697f8b9aba628d14a0/brain-metastases-university-at-and-cancer-remains-the-second-leading-cause-of.jpg)


