23
All Contents © 2007 Burton Group. All rights reserved. Enterprise Security Metrics Pete Lindstrom

All Contents © 2007 Burton Group. All rights reserved.
Enterprise Security Metrics
Pete Lindstrom

2A Basic Model
TRANSACTIONS
INCIDENTS
CONTROLS
VALUE
LOSS

3A Basic Model
TRANSACTIONSmessages
program operations
sessions
flows
to external to external
INCIDENTS
CONTROLS
VALUE
LOSS
ENTERPRISE
CONTROLS
cost
cost

4Value
First level: estimate enterprise-wide losses
Threshold Loss Potential
User Productivity Unpaid overtime; alternative options
Hours x Rate x Downtime
Revenue Three-way-match; accounts receivable
Rev/Hr x Downtime; Shrinkage
Liquid Assets Manual reviews Allowances
Intellectual Property Legal costs Competitive revenue; market share

5Value and Loss
First level: estimate enterprise-wide losses
Threshold Loss Potential
User Productivity Unpaid overtime; alternative options
Hours x Rate x Downtime
Revenue Three-way-match; accounts receivable
Rev/Hr x Downtime; Shrinkage
Liquid Assets Manual reviews Allowances
Intellectual Property Legal costs Competitive revenue; market share
IT Productivity Direct costs Hours x Rate x Work
Legal/ Fines Legal dept fees Legal dept fees

6
Confid.Read
IntegrityModify
Avail.Delete
Use Ctl.Avail
Account.Misuse
User Prod. M H(recon)
H(mistakes)
H(worms and
viruses)
L
Revenue L H(robbery)
H H(snowstorm)
M
Liquid Assets L H(trust)
H M M
IP H(compete)
M H L L
IT Prod. H(forensics)
M M(restores)
M L
Legal/ Fines M/H(Privacy)
H(regulated)
L L ?
Estimating Loss
Second level: estimate losses for each type of compromise

7Classifying Value and Losses
The Ginsu approach to Unwanted Outcomes
Confidentiality
Integrity
Availability
Productivity
Liability
Dat
a/In
form
atio
nD
ata/
Info
rmat
ion
Res
ourc
es
Inbound(In-Transit)
Stored(At-Rest)
Outbound(In-Transit)
Attacks Compromises

8Risk and Control MetricsNetwork Layer: Flows
• Source IP, Dest IP, Dest Port• Inbound and/or Outbound
Host Layer: Sessions
• Sessions under management• Number of logins
Application Layer: Program Operations
• System calls• Application calls
Data Layer: Transactions
• Messages• Business Events (financial trades, purchase orders, published
articles, etc.)

9
Good Events Bad Events
ControlledControlled UncontrolledUncontrolled
Allowed Denied Allowed Denied
Success SuccessFailureFailureLuckyFailure
Total Events
(false positive) (omission) (false negative)
Risk and Control Metrics
5. Control Success / Failure

10Risk and Control Metrics
Illegitimate (malicious)
Legitimate
Negative (Deny)
(TP) True Positive
(FP) False Positive
Total Denies (TP + FP)
Allow (FN) False Negative
(TN) True Negative
Total Allows (TN + FN)
Total Malicious (TP + FN)
Total Legitimate (TN + FP)
Total Events
Test
Resu
lt
ActualTesting Outcomes
SensitivityTP / (TP + FN)
SpecificityTN / (TN + FP)
PositivePredictive Value
TP / (TP + FP)
NegativePredictive ValueTN / (TN + FN)
PrevalenceTP+FN / Total
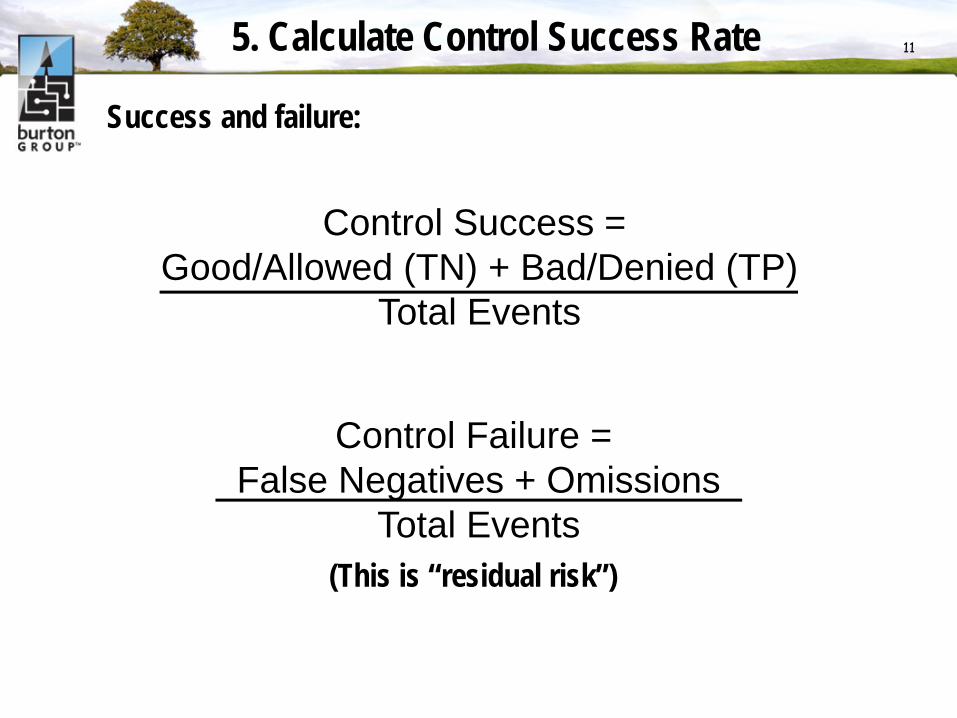
115. Calculate Control Success Rate
Success and failure:
Control Success = Good/Allowed (TN) + Bad/Denied (TP)
Total Events
Control Failure = False Negatives + Omissions
Total Events(This is “residual risk”)

12
Legitimate Email Spam
Controlled Uncontrolled
Allowed Filtered
Success SuccessFailureFailureLuckyFailure
Email Messages
(false pos) (omission) (false neg)
Uncontrolled Controlled
Allowed Filtered
Risk =Spam
Email Msgs
1
2
1
2
43
Coverage =ControlledEmail Msgs 2
3 4+Effectiveness =SuccessEmail Msgs 2
5 6+
65 7 8
“Resid” Risk =IncidentsEmail Msgs 2
7 8+
Example 1: Email Risk

13
Legitimate Calls Overflows
Controlled Uncontrolled
Allowed Blocked
Success SuccessFailureFailureLuckyFailure
System Calls
(false pos) (omission) (false neg)
Uncontrolled Controlled
Allowed Blocked
Risk =OverflowsSys Calls
1
2
1
2
43
Coverage =ControlledSys Calls 2
3 4+Effectiveness =SuccessSys Calls 2
5 6+
65 7 8
“Resid” Risk =IncidentsSys Calls 2
7 8+
Example 2: Buffer Overflow Risk

14Classifying Value and Losses
The Ginsu approach to Unwanted Outcomes
Confidentiality
Integrity
Availability
Productivity
Liability
Dat
a/In
form
atio
nD
ata/
Info
rmat
ion
Res
ourc
es
Inbound(In-Transit)
Stored(At-Rest)
Outbound(In-Transit)
Sniff Copy (“steal”) Leak
Spoof, Replay, Insert Modify Redirect
Overload Delete Overload
Overload Distract Consume
Relay/Bounce Abuse (illegal) Propagate
Attacks Compromises

15Risk and Control Metrics
Three faces of risk:
• Manifest Risk – The risk of attack or compromise associated with system events. (Activity)
• Inherent Risk – the risk associated with the “possibility” of attack due to the availability or exposure of targets. (Asset)
• Contributory Risk – the risk related to control process failure and/or incompletene. (Admin)

16Elements of Controls
Manifest Risk Metrics – IT Events (activity)A.Total EventsB.Total AddressedC.Legitimate AllowsD.Legitimate DeniesE.False PositivesF.False NegativesG.Time PeriodH.Cost

17Elements of Compliance
Target Resources (asset)A.Total PopulationB.Total AddressedC.Total Control PointsD.ErrorsE.Exceptions (approved)F.Time PeriodG.FTEsH.Cost

18Elements of Administration
Security Activities (admin)A.RequestsB.ErrorsC.Time to CompleteD.Time PeriodE.FTEsF.Cost
Process Effectiveness: B/AStaff Productivity: A/EFrequency: A/DCycle Time: D/ACost Effectiveness: F/A

19What’s the Status Quo?
Vulnerability Management
• Total Systems• Avg Time to Patch (days)
Identity Management
• Awareness Training• Total Accounts• Adds/Deletes• Password Resets• Time Period
Incident Metrics
• Malware incidents• User-based incidents
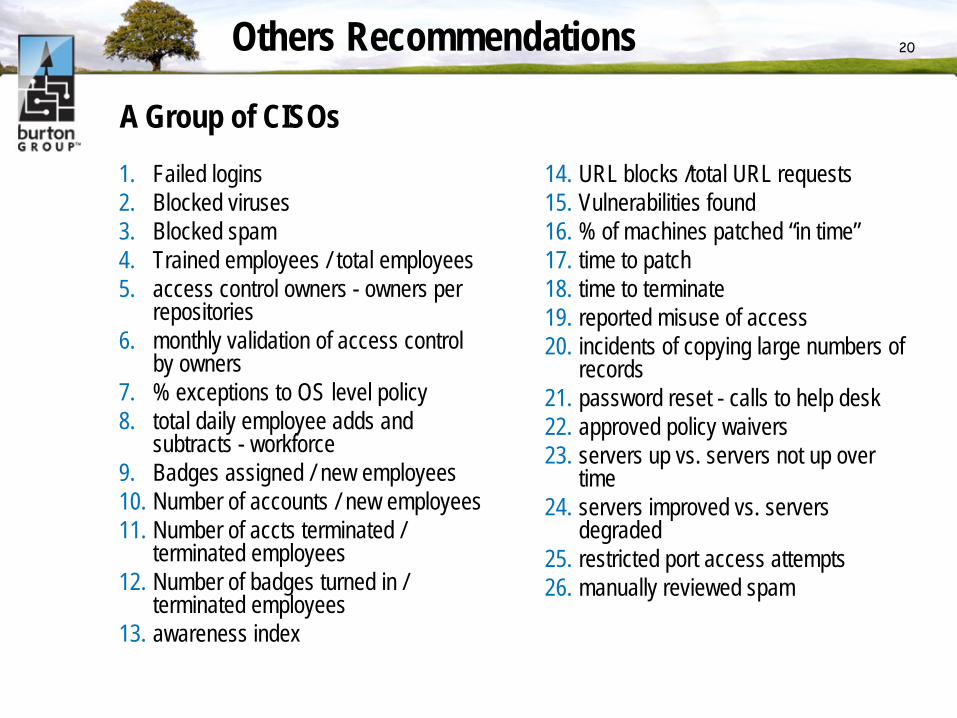
20Others Recommendations
1. Failed logins2. Blocked viruses3. Blocked spam4. Trained employees / total employees5. access control owners - owners per
repositories6. monthly validation of access control
by owners7. % exceptions to OS level policy8. total daily employee adds and
subtracts - workforce9. Badges assigned / new employees10. Number of accounts / new employees11. Number of accts terminated /
terminated employees12. Number of badges turned in /
terminated employees13. awareness index
14. URL blocks /total URL requests15. Vulnerabilities found16. % of machines patched “in time”17. time to patch18. time to terminate19. reported misuse of access20. incidents of copying large numbers of
records21. password reset - calls to help desk22. approved policy waivers23. servers up vs. servers not up over
time24. servers improved vs. servers
degraded25. restricted port access attempts26. manually reviewed spam
A Group of CISOs

21Value-Based Metrics
• IAV (Information Asset Value): dollar amount of how much info assets are worth. Since most people appear concerned about valuing assets I have two prescriptions: 1) read Kenneth Feinberg's "What is Life Worth?" to realize that EVERYTHING can be valued, and it only has to be "right" to the people involved; and 2) use IT Spending as a placeholder and potentially change the word "value" to "cost." (This is sort of like balance sheet stuff).
• Transactions: (I count flows, sessions, program operations, and data transactions). Used to understand the volume of activity that occurs online within the context of human usage and value.
• Value (Cost) per Transaction: IAV / Transactions

22Risk / Control Metrics• Risk (or Attack Ratio): the number of bad events over total events, expressed
as a ratio. This number would assert, for example, that 1 of every 250,000 events is an attack.
• Control Coverage: a metric that addresses the breadth of a control. For example, 95% control coverage means that 5% of the activity in an environment associated with that control is not evaluated.
• Control Success Rate: (Total controlled events minus (false positives plus false negatives)) all over total controlled events.
• CPTs (Controls per transaction): the average number of control events being applied to any single transaction. This applies to inline "gateway" controls like authentication, user access control, system access control, nips, hips that evaluate activity and either allow it or deny it.
• Exposure Index: the total number of attackable items for any given resource. This may be as simple as open ports or as complex as some derivative of Howard/Wing's RASQ. It also relates to control coverage, sort of like potential vs. kinetic energy.
• CPC (Cost per control): a dollar measure that divides the total security spend by the total CPTs above.

All Contents © 2007 Burton Group. All rights reserved.
Thanks!
Pete LindstromSenior AnalystBurton [email protected]


![Spencer Lindstrom [selected works 2012]](https://static.documents.pub/doc/80x56/568c38741a28ab02359efd41/spencer-lindstrom-selected-works-2012.jpg)


