16
Enterprise Systems and Innovations Benjamin Engelstätter ZEW Mannheim CoInvest Lisbon, Portugal March, 18 - 19 2010
| Date post: | 26-Dec-2015 |
| Category: |
Documents |
| Upload: | clement-bruce |
| View: | 216 times |
| Download: | 0 times |
Enterprise Systems and Innovations
Benjamin Engelstätter
ZEW Mannheim
CoInvest Lisbon, Portugal
March, 18 - 19 2010

Brief IntroductionEnterprise Systems (ES)
Software to control, manage and support business processes
Three Main Branches• Customer Relationship Management (CRM): Front Office• Enterprise Resource Management (ERP): Middle Office• Supply Chain Management (SCM): Back Office
Additional Types• Technical Software (CAx)• MES, PLM, …
Market• 39 billion USD for complex enterprise systems in 2008, 1.9 Bil. Euro in Germany• Market for large firms is satisfied, SMEs are now focused• especially ERP, SCM and CRM spread out worldwide

Enterprise Systems and Innovations
Enterprise Resource Planning • standardizes complex interfaces and automates financial transactions • collects and updates firm intern data in real-time
Supply Chain Management• coordinates flow of information, materials and finances along the value chain• improves operational and business planning with real-time planning capabilities
Customer Relationship Management• provides a firm-wide centralized database of customer information• offers a complete view of customer needs and wants
Possible Effects on Innovations• SCM & ERP identify bottlenecks and shortages• generated databases provide exact information facilitating process enhancements• CRM database can be used as information source for product innovations
Contribution
Effects on Innovation
• First empirical evidence of the impact of adopting any of the
three main enterprise systems on firms’ innovational
performance
• process as well as product innovations are concerned
• 1st Step: Revealing impacts of enterprise systems on
probabilities to innovate
• 2nd Step: Revealing impacts of ES on number of realized
innovations

LiteratureDirect Effects on Innovation
• ERP facilitate the building of business innovations (Shang & Seddon, 2000)
• customer preferences retrieved via CRM improve innovational success
(Joshi & Sharma, 2004)
• ES allow people to be more innovative (Davenport, 1998)
Indirect Effects on Innovation
• business units more innovative if in central network position (Tsai, 2001)
• more innovation through upstream /downstream contacts to suppliers and
customers (Chriscuolo et al., 2004)
• organizational flexibility leads to increased innovative activity (Hempell & Zwick,
2005)
→ ES offer advantages in all categories and might foster innovational performance

Research Methodology
Innovation/Knowledge Production Function
output of innovation process represents result of several research linked inputs
(1) zi* = Xi’β1 + IDi’β2 + ESi’β3 +εi zi = 1 if zi* ≥ 0; zi = 0 otherwise
Number of innovations
(2) yi* = Zi’λ1 + IDi’λ2 + ESi’λ3 +γi yi= yi* if zi = 1; yi= 0 if zi = 0
Variableszi – Product/Process Innovation
yi – Number of Product/Process
Innovation
Zi / Xi – determinants affecting innovation
IDi – control dummies for industry sector
ESi – Enterprise Systems in use
εi / γi – standard error term

Estimation Procedure
Procedure
• Maximum Likelihood
• count data corner solution with 2-part model
• 2 alternatives:
- Hurdle model
- Zero-inflated model
• both allow for separate treatment of zeros and strictly positive
outcomes
• 2 possible distributions:
- Poisson
- Negative-binomial
Possible Models
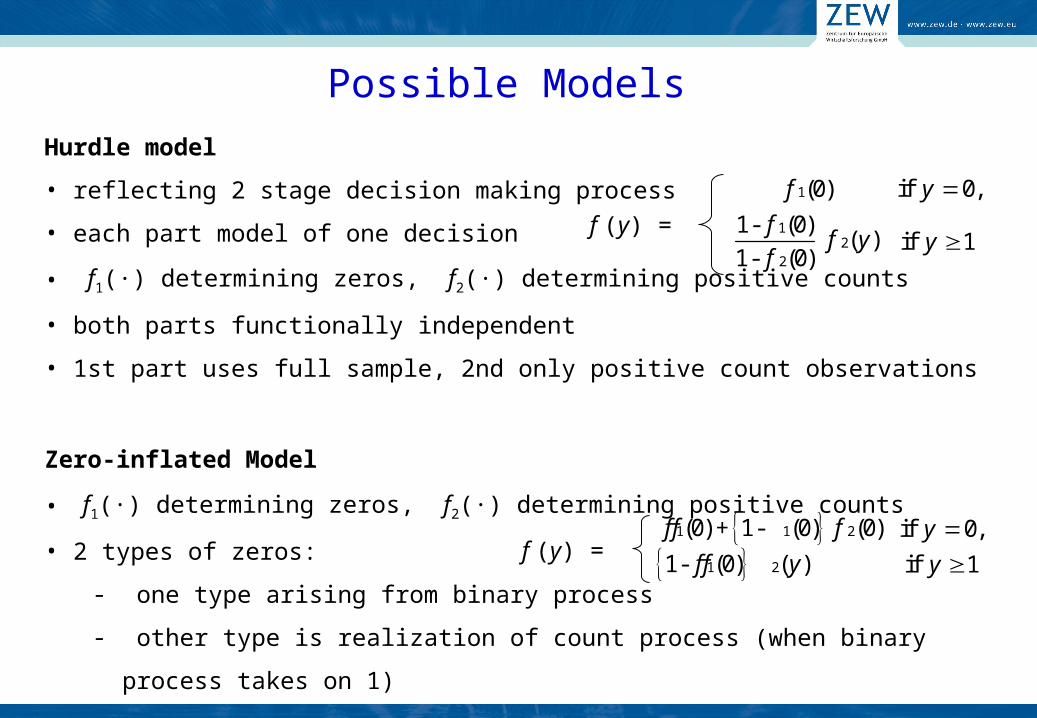
Hurdle model
• reflecting 2 stage decision making process
• each part model of one decision
• f1(·) determining zeros, f2(·) determining positive counts
• both parts functionally independent
• 1st part uses full sample, 2nd only positive count observations
Zero-inflated Model
• f1(·) determining zeros, f2(·) determining positive counts
• 2 types of zeros:
- one type arising from binary process
- other type is realization of count process (when binary process takes on
1)
1
12
2
(0)
1- (0)( )
1- (0)
f
ff y
f
if 0,
if 1
y
y
f (y) =
1 1 2
1 2
(0) + 1- (0) (0)
1- (0) ( )
f f f
f f y
if 0,
if 1
y
y
f (y) =

Database
ZEW ICT Survey
• computer-aided telephone survey
• specific focus on diffusion and use of ICT in German companies
• one recent ICT topic specifically covered each wave
• each wave contains about 4000 firms with 5+ employees
• seven branches of manufacturing, seven selected service sectors
• five waves (2000, 2002, 2004, 2007, 2010)
• waves of 2004 and 2007 used in current analysis

VariablesTable 1: Summary statistics
Variable MeanStd. Dev. DV2
Software Use 04 Mean DV2
process innovations 04-06 0.635 yes no software 0.231 yes
number of process innovations 3.103 4.057 ERP 0.635 yes
product innovations 04-06 0.600 yes SCM 0.434 yes
number of process innovations 5.005 9.639 CRM 0.524 yes
process innovations last period 0.755 yes all three 0.275 yes
product innovations last period 0.654 yes
labor1 213.0 636.4 Additional control variables
share of computer workers 0.469 0.329 working hours3 0.704 yes
share of highly skilled workers 0.226 0.259 job rotation 0.191 yes
share of medium skilled workers 0.557 0.262 quality circles 0.425 yes
ISO certificated 0.444 yes own cost units4 0.386 yes
East Germany 0.267 yes workgroups5 0.623 yes
Number of Observations 989
Notes: 1 Labor is measured in total number of employees. 2 Dummy variable. 3 Accounts for working hours. 4 Units with own cost and result responsibilty. 5 Self dependent workgroups; Source: ZEW ICT survey 2004, 2007. Own calculations.

Descriptive Evidence and Model Selection
Table 2: Descriptive analysis
No system
All systems ERP SCM CRM
recent process innovator 0.478 0.790 0.726 0.767 0.726
number of process innovations mean
1.783(2.774)
4.039(4.252)
3.764(4.402
)
3.935(4.424
)
3.590(4.274
)
recent product innovator 0.408 0.728 0.667 0.700 0.681
number of product innovations mean
2.142(5.045)
7.167(10.82)
6.002(10.15
)
6.859(10.87
)
6.197(10.45
)
Notes: Standard Errors in parentheses. Source: ZEW ICT survey 2004, 2007 and own calculations.
Process innovations Product innovations
Vuong-Test 6.050*** 7.830***
Llhd.-ratio Test
449.220*** 2864.020***
Notes: *** p<0.01, ** p<0.05, * p<0.1; Source: ZEW ICT survey 2004, 2007 and own calculations.
Table 3: Model selection
Zero-inflated neg. bin. model selected in both cases

Results – Process Innovations
Specification (1) Specification (2)
ProbitModel
Neg. Bin.Model
ProbitModel
Neg. Bin.Model
ISO certification -0.270**(0.140)
0.230**(0.092)
-0.137(0.149)
0.196**(0.095)
Process innovations last period -0.377**
(0.130)0.262***(0.098)
-0.310**(0.139)
0.242**(0.105)
Enterprise Resource Planning -0.141
(0.136)0.282***(0.105)
-0.110(0.138)
0.279***(0.105)
Supply Change Management -0.318**
(0.137)0.064
(0.089)-0.284*(0.153)
0.059(0.096)
Customer Relationship Management
-0.181(0.133)
-0.068(0.094)
-0.198(0.141)
-0.103(0.095)
ControlsIndustry, East,Size, Workforce
Char
Industry, East,Size,
Workforce Char
Industry, East, Size, Workforce
Char, Org Factors
Industry, East, Size, Workforce
Char, Org Factors
Number of Observations 890 (547 non-zero, 343 zero)
Table 4: Determinants of the number of process innovations, zero-inflated neg. bin. estimates
Notes: *** p<0.01, ** p<0.05, * p<0.1; robust standard errors in parentheses. Overdispersion coefficient alpha highly significant (not reported). Source: ZEW ICT survey 2004, 2007 and own calculations.

Marginal Effects and Robustness Checks - Process Innovations
Spec. 1 Spec. 2
overall marg. effect ERP 0.972***
(0.291)0.923***(0.294)
overall marg. effect SCM 0.624**
(0.292)0.556*(0.300)
overall marg. effect CRM 0.057
(0.288)-0.024(0.288)
Table 5: Marginal Effects (short-term)
Spec. 1 Spec. 2
overall marg. effect ERP 0.856**
(0.360)0.913**(0.376)
overall marg. effect SCM 0.415
(0.457)0.271
(0.447)
overall marg. effect CRM 0.122
(0.391)0.019
(0.383)
Table 6: Marginal Effects (medium-term, ES use 02)
Notes: *** p<0.01, ** p<0.05, * p<0.1; robust standard errors in parentheses. Source: ZEW ICT survey 2004, 2007 and own calculations.
Controls
0.013(0.015)
CRM
0.031**(0.015)
SCM
0.011(0.014)
ERP
0.030**(0.013)
Product innovations last period
0.120***(0.040)
Share of high skilled workers
workforce characteristics, ISO, former process innovator n. s.
Dependent variable: R&D spending in share of total sales in 2006 (OLS)
Table 7: R&D spending and ES usage
Industry, East,Size, Org Factors

Results – Product Innovations
Specification (1) Specification (2)
ProbitModel
Neg. Bin.Model
ProbitModel
Neg. Bin.Model
ISO certification -0.364**(0.172)
-0.135(0.142)
-0.345**(0.174)
-0.109(0.138)
Product innovations last period -1.067***
(0.152)-0.010(0.182)
-1.051***(0.151)
-0.031(0.177)
Enterprise Resource Planning -0.085
(0.170)0.027
(0.150)-0.144(0.173)
-0.091(0.155)
Supply Change Management 0.135
(0.182)0.116
(0.140)0.153
(0.180)0.070
(0.134)
Customer Relationship Management
-0.296*(0.161)
0.084(0.129)
-0.326**(0.163)
0.012(0.126)
ControlsIndustry, East,Size, Workforce
Char
Industry, East,Size,
Workforce Char
Industry, East, Size, Workforce
Char, Org Factors
Industry, East, Size, Workforce
Char, Org Factors
Number of Observations 886 (490 non-zero, 396 zero)
Table 8: Determinants of the number of product innovations, zero-inflated neg. bin. estimates
Notes: *** p<0.01, ** p<0.05, * p<0.1; robust standard errors in parentheses. Overdispersion coefficient alpha highly significant (not reported). Source: ZEW ICT survey 2004, 2007 and own calculations.

Marginal Effects - Product Innovations
Specification 1
Specification 2
overall marg. effect ERP 0.345
(0.728)-0.084(0.757)
overall marg. effect SCM 0.238
(0.730)-0.035(0.704)
overall marg. effect CRM 1.156*
(0.675)0.866
(0.654)
Table 9: Marginal Effects (short-term)
Specification 1
Specification 2
overall marg. effect ERP -0.385
(1.089)-0.611(1.139)
overall marg. effect SCM -0.390
(0.984)-0.344(0.973)
overall marg. effect CRM 1.544
(1.130)1.522
(1.137)
Table 10: Marginal Effects (medium-term, software use 02)
Notes: *** p<0.01, ** p<0.05, * p<0.1; robust standard errors in parentheses. Source: ZEW ICT survey 2004, 2007 and own calculations.
ConclusionMain Results
• ERP+SCM positively impacts number of process innovations
• SCM usage lowers probability of being a non-innovator in case of process
innovations
• both results stable for short and medium-run
• CRM users face a higher probability to product innovate (only short-term based)
Implications
• manager should not only focus on possibly huge costs and expected fast
evolving performance benefits when purchasing or upgrading ES
• increased process innovational performance via SCM and ERP might even
reduce costs
• product innovations realized based on CRM data might increase financial
performance via opening up new markets


