ORIGINAL RESEARCH ARTICLE published: 18 February 2015 doi: 10.3389/fncom.2015.00016 EEG entropy measures in anesthesia Zhenhu Liang 1 , Yinghua Wang 2,3 , Xue Sun 1 , Duan Li 4 , Logan J. Voss 5 , Jamie W. Sleigh 5 , Satoshi Hagihira 6 and Xiaoli Li 2,3 * 1 Institute of Electrical Engineering, Yanshan University, Qinhuangdao, China 2 State Key Laboratory of Cognitive Neuroscience and Learning and IDG/McGovern Institute for Brain Research, Beijing Normal University, Beijing, China 3 Center for Collaboration and Innovation in Brain and Learning Sciences, Beijing Normal University, Beijing, China 4 Institute of Information Science and Engineering, Yanshan University, Qinhuangdao, China 5 Department of Anesthesia, Waikato Hospital, Hamilton, New Zealand 6 Department of Anesthesiology, Osaka University Graduate School of Medicine, Osaka, Japan Edited by: Tobias Alecio Mattei, Ohio State University, USA Reviewed by: Raoul Rashid Nigmatullin, Kazan Federal University, Russia Fengyu Cong, Dalian University of Technology, China *Correspondence: Xiaoli Li, State Key Laboratory of Cognitive Neuroscience and Learning and IDG/McGovern Institute for Brain Research; Center for Collaboration and Innovation in Brain and Learning Sciences, Beijing Normal University, Beijing 100875, China e-mail: [email protected]Highlights: Twelve entropy indices were systematically compared in monitoring depth of anesthesia and detecting burst suppression. Renyi permutation entropy performed best in tracking EEG changes associated with different anesthesia states. Approximate Entropy and Sample Entropy performed best in detecting burst suppression. Objective: Entropy algorithms have been widely used in analyzing EEG signals during anesthesia. However, a systematic comparison of these entropy algorithms in assessing anesthesia drugs’ effect is lacking. In this study, we compare the capability of 12 entropy indices for monitoring depth of anesthesia (DoA) and detecting the burst suppression pattern (BSP), in anesthesia induced by GABAergic agents. Methods: Twelve indices were investigated, namely Response Entropy (RE) and State entropy (SE), three wavelet entropy (WE) measures [Shannon WE (SWE), Tsallis WE (TWE), and Renyi WE (RWE)], Hilbert-Huang spectral entropy (HHSE), approximate entropy (ApEn), sample entropy (SampEn), Fuzzy entropy, and three permutation entropy (PE) measures [Shannon PE (SPE), Tsallis PE (TPE) and Renyi PE (RPE)]. Two EEG data sets from sevoflurane-induced and isoflurane-induced anesthesia respectively were selected to assess the capability of each entropy index in DoA monitoring and BSP detection. To validate the effectiveness of these entropy algorithms, pharmacokinetic/pharmacodynamic (PK/PD) modeling and prediction probability (P k ) analysis were applied. The multifractal detrended fluctuation analysis (MDFA) as a non-entropy measure was compared. Results: All the entropy and MDFA indices could track the changes in EEG pattern during different anesthesia states. Three PE measures outperformed the other entropy indices, with less baseline variability, higher coefficient of determination (R 2 ) and prediction probability, and RPE performed best; ApEn and SampEn discriminated BSP best. Additionally, these entropy measures showed an advantage in computation efficiency compared with MDFA. Conclusion: Each entropy index has its advantages and disadvantages in estimating DoA. Overall, it is suggested that the RPE index was a superior measure. Investigating the advantages and disadvantages of these entropy indices could help improve current clinical indices for monitoring DoA. Keywords: EEG, anesthesia, entropy, pharmacokinetic/pharmacodynamic modeling, depth of anesthesia monitoring INTRODUCTION In the operating room, general anesthesia is important to guar- antee successful surgery and ensure patients’ safety and comfort. For anesthesia, the reliable monitoring of anesthetic drug effects on the brain is a clinical concern for anesthesiologists (Monk et al., 2005). The central nervous system (CNS) is the main target of anesthetic drugs. Originated in CNS, the electroencephalo- gram (EEG) reflects the neural activities of brain, and has been widely used as a surrogate parameter to quantify the anesthetic drug effect (Rampil, 1998; Bruhn et al., 2006; Jameson and Sloan, Frontiers in Computational Neuroscience www.frontiersin.org February 2015 | Volume 9 | Article 16 | 1 COMPUTATIONAL NEUROSCIENCE
Transcript
ORIGINAL RESEARCH ARTICLEpublished: 18 February 2015
doi: 10.3389/fncom.2015.00016
EEG entropy measures in anesthesiaZhenhu Liang1, Yinghua Wang2,3, Xue Sun1, Duan Li4, Logan J. Voss5, Jamie W. Sleigh5,
Satoshi Hagihira6 and Xiaoli Li2,3*
1 Institute of Electrical Engineering, Yanshan University, Qinhuangdao, China2 State Key Laboratory of Cognitive Neuroscience and Learning and IDG/McGovern Institute for Brain Research, Beijing Normal University, Beijing, China3 Center for Collaboration and Innovation in Brain and Learning Sciences, Beijing Normal University, Beijing, China4 Institute of Information Science and Engineering, Yanshan University, Qinhuangdao, China5 Department of Anesthesia, Waikato Hospital, Hamilton, New Zealand6 Department of Anesthesiology, Osaka University Graduate School of Medicine, Osaka, Japan
Edited by:
Tobias Alecio Mattei, Ohio StateUniversity, USA
Reviewed by:
Raoul Rashid Nigmatullin, KazanFederal University, RussiaFengyu Cong, Dalian University ofTechnology, China
*Correspondence:
Xiaoli Li, State Key Laboratory ofCognitive Neuroscience andLearning and IDG/McGovernInstitute for Brain Research;Center for Collaboration andInnovation in Brain and LearningSciences, Beijing Normal University,Beijing 100875, Chinae-mail: [email protected]
Highlights:
� Twelve entropy indices were systematically compared in monitoring depth of anesthesiaand detecting burst suppression.
� Renyi permutation entropy performed best in tracking EEG changes associated withdifferent anesthesia states.
� Approximate Entropy and Sample Entropy performed best in detecting burstsuppression.
Objective: Entropy algorithms have been widely used in analyzing EEG signals duringanesthesia. However, a systematic comparison of these entropy algorithms in assessinganesthesia drugs’ effect is lacking. In this study, we compare the capability of 12 entropyindices for monitoring depth of anesthesia (DoA) and detecting the burst suppressionpattern (BSP), in anesthesia induced by GABAergic agents.
Methods: Twelve indices were investigated, namely Response Entropy (RE) andState entropy (SE), three wavelet entropy (WE) measures [Shannon WE (SWE),Tsallis WE (TWE), and Renyi WE (RWE)], Hilbert-Huang spectral entropy (HHSE),approximate entropy (ApEn), sample entropy (SampEn), Fuzzy entropy, and threepermutation entropy (PE) measures [Shannon PE (SPE), Tsallis PE (TPE) and Renyi PE(RPE)]. Two EEG data sets from sevoflurane-induced and isoflurane-induced anesthesiarespectively were selected to assess the capability of each entropy index in DoAmonitoring and BSP detection. To validate the effectiveness of these entropy algorithms,pharmacokinetic/pharmacodynamic (PK/PD) modeling and prediction probability (Pk )analysis were applied. The multifractal detrended fluctuation analysis (MDFA) as anon-entropy measure was compared.
Results: All the entropy and MDFA indices could track the changes in EEG pattern duringdifferent anesthesia states. Three PE measures outperformed the other entropy indices,with less baseline variability, higher coefficient of determination (R2) and predictionprobability, and RPE performed best; ApEn and SampEn discriminated BSP best.Additionally, these entropy measures showed an advantage in computation efficiencycompared with MDFA.
Conclusion: Each entropy index has its advantages and disadvantages in estimating DoA.Overall, it is suggested that the RPE index was a superior measure. Investigating theadvantages and disadvantages of these entropy indices could help improve current clinicalindices for monitoring DoA.
Keywords: EEG, anesthesia, entropy, pharmacokinetic/pharmacodynamic modeling, depth of anesthesia
monitoring
INTRODUCTIONIn the operating room, general anesthesia is important to guar-antee successful surgery and ensure patients’ safety and comfort.For anesthesia, the reliable monitoring of anesthetic drug effectson the brain is a clinical concern for anesthesiologists (Monk
et al., 2005). The central nervous system (CNS) is the main targetof anesthetic drugs. Originated in CNS, the electroencephalo-gram (EEG) reflects the neural activities of brain, and has beenwidely used as a surrogate parameter to quantify the anestheticdrug effect (Rampil, 1998; Bruhn et al., 2006; Jameson and Sloan,
Frontiers in Computational Neuroscience www.frontiersin.org February 2015 | Volume 9 | Article 16 | 1
2006). However, only limited information can be obtained fromthe EEG signals purely by waveform observation. With the devel-opment of signal processing, various methods have been appliedto analyze, identify or detect mental disorders and consciousnessmechanisms from EEG signals (Okogbaa et al., 1994; Natarajanet al., 2004; Abásolo et al., 2006), as well as evaluating the effectsof anesthesia.
In recent decades, numerous attempts have been made todevelop an index for describing anesthetic drug effects on thebrain, including zero crossing frequency, spectral edge, waveletanalysis, high-order spectral analysis etc. These studies laid thefoundation of commercial EEG-based monitors of depth of anes-thesia (DoA), such as BIS (Aspect Medical Systems, Newton, MA)(Bruhn et al., 2006; Ellerkmann et al., 2010) and M-entropy (GEHealthcare, Helsinki, Finland) (Viertiö-Oja et al., 2004; Bruhnet al., 2006). Many of these methods are derived from linear the-ories. However, various studies have shown that the EEG is anon-stationary signal that exhibits non-linear or chaotic behav-iors (Elbert et al., 1994; Pritchard et al., 1995; Zhang et al.,2001; Natarajan et al., 2004). This prompted many researchers toadopt non-linear analysis methods in anesthesia study, for exam-ple largest Lyapunov exponent (Fell et al., 1996), Hurst exponent(Alvarez-Ramirez et al., 2008), fractal analysis (Klonowski et al.,2006; Gifani et al., 2007; Liang et al., 2012), detrended fluctua-tion analysis (DFA) (Jospin et al., 2007; Nguyen-Ky et al., 2010b),recurrence analysis (Huang et al., 2006), and non-linear entropies(Bruhn et al., 2001; Li et al., 2008a). In particular, non-linearentropy methods describing the complexity of EEG signals, havereceived considerable attention.
The word “entropy” was first proposed as a thermodynamicprinciple by Clausius (1867). It describes the distribution proba-bility of molecules of gaseous or fluid systems. In 1949, Claude E.Shannon introduced entropy into information theory to describethe distribution of signal components (Shannon and Weaver,1949). So far, numerous entropy algorithms have been proposedand used to quantify DoA, covering Spectral entropy [whichincludes Response Entropy (RE) and State entropy (SE)] (Viertiö-Oja et al., 2004; Klockars et al., 2012), Approximate entropy(ApEn) (Bruhn et al., 2000), Sample entropy (SampEn) (Richmanand Moorman, 2000), Fuzzy entropy (FuzzyEn) (Chen et al.,2007), Shannon Permutation entropy (SPE) (Li et al., 2008a,2012), Shannon Wavelet entropy (SWE) (Särkelä et al., 2007), andHilbert-Huang spectral entropy (HHSE) (Li et al., 2008b).
Spectral Entropy is the method applied in the commercialM-Entropy Module (Viertiö-Oja et al., 2004). It consists of twoparameters: Response Entropy (RE) and State Entropy (SE). SEprimarily includes the spectrum of the EEG signal from 0.8 to32 Hz, and RE includes electromyogram activity from 0.8 to 47 Hz(Viertiö-Oja et al., 2004). Shannon Wavelet entropy (SWE) is theShannon entropy in the wavelet domain, which indicates signalvariation at each frequency scale (Rosso et al., 2001). And theHilbert–Huang spectral entropy (HHSE) is the Shannon entropybased on the Hilbert–Huang transform proposed by Huang et al.(1998). HHSE has been successfully applied to the anesthetic EEGsignals (Li et al., 2008b).
The above methods are based on the frequency spectrum.Whereas many entropy methods are based on the time series
and phase space analysis. ApEn is an algorithm derived fromthe Kolmogorov-Sinai entropy (Pincus, 1991). It quantifies thepredictability of subsequent amplitude values of a signal. Aprevious investigation showed that ApEn correlates well withthe concentration of desflurane (Bruhn et al., 2000). However,ApEn lacks relative consistency and is highly dependent on datalength, SampEn was proposed to overcome ApEn’s limitationby removing self-matching and relieving its bias (Richman andMoorman, 2000). SampEn has been used for analyzing EEG sig-nals (Montirosso et al., 2010; Yoo et al., 2012). FuzzyEn wasproposed by Chen et al. (2007). It is based on the fuzzy member-ship functions to define the vectors’ similarity, using the soft andcontinuous boundaries of fuzzy functions to ensure the continu-ity and the validity of FuzzyEn’s definition (Chen et al., 2009).SPE was introduced by Bandt and Pompe (2002). It is a com-plexity measure based on symbolic dynamics (Bandt and Pompe,2002). Because of its simple concept and fast computation, SPEhas been widely used in EEG signal analysis (Cao et al., 2004;Li et al., 2007, 2008a). Furthermore, its derivatives, multi-scalepermutation entropy (Li et al., 2010) and composite permutationentropy index (Olofsen et al., 2008) have been successfully appliedto analyze EEG signals during anesthesia.
However, “No one knows what entropy really is, so in a debateyou will always have the advantage.” This statement is true forEEG analysis today (Ferenets et al., 2006). Each entropy index hasits own advantages and disadvantages, but how does their perfor-mance compare when evaluating the effect of anesthesia on brainactivity? To this end, some researchers have compared the per-formance of different entropy methods for anesthesia monitoring(Sleigh et al., 2001, 2005; Bein, 2006). Unfortunately, these arti-cles analyzed no more than three entropies. To our knowledge, asystematic comparison of the performance of them in assessinganesthesia drug effect is lacking. In this study, we aim to com-pare the capability of several commonly used entropy indices formonitoring DoA.
We noticed that definitions of all the above entropies arebased on Shannon information theory, which belongs to a short-range or extensive concept. However, the physical systems espe-cially the biomedical systems are often characterized by eitherlong-range interactions, long-term memories, or multifractality(Zunino et al., 2008). To describe these characters, two general-ized forms of entropy were proposed: Renyi entropy (Renyi, 1970)and Tsallis entropy (q-entropy) (Tsallis et al., 1998). For exam-ple Tsallis entropy has a parameter q for non-extensity. If q > 1,the entropy is more sensitive to events that occur often, whereasif 0 < q < 1 it is more sensitive to the events that occur seldom(Maszczyk and Duch, 2008). In the limit q → 1, it coincides withShannon entropy. These generalized entropies can provide addi-tional informational about the importance of specific events, suchas outliers or rare events. The two classes of entropies and theircombinations with current signal processing methods have beenalready applied in EEG analysis (Bezerianos et al., 2003; Tonget al., 2003; Inuso et al., 2007) and often been proved advan-tageous than the Shannon version (Zunino et al., 2008; Arefianet al., 2009). To make the research more instructive, we believe ituseful to investigate these non-extensive entropy measures alongwith those extensive Shannon entropies in DoA monitoring. In
Frontiers in Computational Neuroscience www.frontiersin.org February 2015 | Volume 9 | Article 16 | 2
this study, we involved the Tsallis wavelet entropy (TWE) andRenyi wavelet entropy (RWE) proposed by Rosso et al. (2003,2006), as well as the Tsallis permutation entropy (TPE) pro-posed by Zunino et al. (2008) and a new Renyi permutationentropy (RPE).
For illustrative purpose, we divide the entropies into twofamilies:
(1) Entropies in the time-frequency domain: RE, SE, SWE, TWE,RWE, and HHSE;
(2) Entropies in the time domain: ApEn, SampEn, FuzzyEn, SPE,TPE, and RPE.
In this work, their performance for monitoring DoA were com-pared. Using data sets obtained during sevoflurane and isofluraneanesthesia, we quantified for each index the responsiveness toloss of consciousness, computation complexity and the ability todetect BSP. Pharmacokinetic/pharmacodynamic (PK/PD) mod-eling and prediction probability statistics were applied to evaluatethe efficiency of each index for tracking anesthetic concentra-tion. Additionally, in order to prove the efficiency of the entropyapproaches, two non-linear dynamic methods: DFA (Jospin et al.,2007) and multifractal DFA (MDFA) (Kantelhardt et al., 2002)are compared.
ENTROPY INDICESThe computation of each entropy index is briefly described asfollows.
SPECTRAL ENTROPY (RE AND SE)Spectral Entropy quantifies the probability density function(PDF) of the signal power spectrum in the frequency domain.The detail of the Spectral Entropy algorithm can be seen in Inouyeet al. (1991) and Rezek and Roberts (1998). Spectral Entropy con-sists of the RE and the SE. RE is computed over a frequency rangefrom 0.8 to 47 Hz while SE is computed over the frequency rangefrom 0.8 to 32 Hz. The normalization step for RE and SE aredefined as follows:
RE = Hsp0.8−47
log (N0.8−47)(1)
SE = Hsp0.8−32
log (N0.8−47)(2)
where Hsp0.8−47 and Hsp0.8−32 means the sum of spectral powerbetween 0.8 and 47 Hz, and 0.8 to 32 Hz, respectively. And N0.8−47
equals the total number of frequency components in the range0.8–47 Hz. Spectral Entropy describes the degree of skewness inthe frequency distribution. For example, in the normalized case,the Spectral Entropy of a pure sine wave with a single spectralpeak is 0, while that of white noise is 1.
WAVELET ENTROPY (SWE, TWE, AND RWE)WE differentiates specific brain states under spontaneous orstimulus-related conditions and recognizes the time localiza-tions of a dynamic process. To calculate Wavelet Entropy, wavelet
energy Ej of a signal is determined at each scale j as follows:
Ej =∑Lj
k = 1d(k)2 (3)
where k and Lj are the summation index and the number of coef-ficients at each scale j with in a given epoch, respectively. The totalenergy over all scales is obtained by:
Etotal =∑
j
Ej =∑
j
∑Lj
k = 1dj(k)2 (4)
Then wavelet energy is divided by total energy to obtain therelative wavelet energy at each scale j:
pj = Ej
Etotal= Ej∑
j Ej=
∑Lj
k = 1 d(k)2
∑j
∑Lj
k = 1dj(k)2(5)
SWE is calculated from Shannon entropy of pj distributionbetween scales as follows:
S(s) = −∑
jpj log pj (6)
The detail of the algorithm used in this study can be seen inSärkelä et al. (2007).
And the TWE is defined as,
S(T)q = 1
q − 1
∑j
[pj − (
pj)q]
(7)
where q is a non-extensity parameter.Based on the definition of Renyi entropy (Renyi, 1970), the
RWE is defined as Rosso et al. (2006):
S(R)a = 1
1 − alog
[∑j
(pj
)a]
(8)
For S(S)q , the normalized SWE is
SWE = S(s)/ log NJ (9)
where NJ is the number of wavelet resolution levels.
And S(T)q is normalized by dividing
[1 − N
1 − qJ
]/(q − 1),
defined by Rosso et al. (2003):
TWE = S(T)q[
1 − N1 − qJ
]/(q − 1)
(10)
Further, the normalized S(R)a is defined as Maszczyk and Duch
(2008):
RWE = S(R)a
log NJ(11)
The values of three WE measures depend on the wavelet basisfunction, the number of decomposed layers (n) and the data
Frontiers in Computational Neuroscience www.frontiersin.org February 2015 | Volume 9 | Article 16 | 3
length (N). Furthermore, the TWE and RWE are related to theparameters q and a respectively. Among these parameters, thewavelet basis function is most important. Because of the lack of afixed criterion, it is very difficult to select an appropriate waveletbasis function in practical applications and many studies chooseit based on experiments. The details of the selection process inthis study can be found in Supplement Material 1.
HILBERT-HUANG SPECTRAL ENTROPY (HHSE)HHSE is based on the Hilbert-Huang transform, which appliesthe Shannon entropy concept to the Hilbert-Huang spectrum.The detail of the algorithm is seen in Li et al. (2008b). Fora given non-stationary signal x(t), the EMD method decom-poses the signal into a series of intrinsic mode functions (IMFs),Cn (1, 2, . . . , M), where M is the number of IMFs. The signal x(t)can be written by:
x (t) =∑n − 1
i = 1imf (t)i + rn (t) (12)
Apply the Hilbert transform to the IMF components,
Z (t) = imf (t) + iH[imf (t)
] = a (t) ei∫
ω(t)dt (13)
in which a (t) =√
imf 2 (t) + H2[imf (t)
], ω (t) =
ddt
[arctan (H
[imf (t)
]/imf (t))
], where ω (t) and a(t) are
the instantaneous frequency and amplitude, respectively, of theIMFs.
The Hilbert-Huang marginal spectrum is defined by:
h (ω) =∫
H (ω, t) dt (14)
To simplify the representation, the Hilbert-Huang spectrum isdenoted as a function of frequency (f ) instead of angular fre-quency (ω). The marginal spectrum is normalized by:
h(f) = h(f )/
∑h(f ) (15)
Next, the Shannon entropy concept is applied to the Hilbert-Huang spectrum, and Hilbert-Huang spectral entropy is obtainedby:
HHSE = −∑
fh
(f)
log(
h(f))
(16)
The HHSE values are mainly affected by the frequency resolutionand data length (N). For accurate computation, the frequency res-olution is chosen as 0.1 Hz. N directly influences the EMD. Ingeneral, the boundary effect may be induced if N is too large ortoo small, which can contaminate the data and distort the powerspectrum. The selection of N in this study is given in SupplementMaterial 1.
APPROXIMATE ENTROPY (ApEn)ApEn is derived from Kolmogorov entropy. It was introduced byPincus (1991). It can be used to analyze a finite length signal
and describe its unpredictability or randomness. Its computationinvolves embedding the signal into the phase space and estimat-ing the rate of increment in the number of phase space patternswithin a predefined value r, when the embedding dimension ofphase space increases from m to m + 1.
For a time series x (i), 1 ≤ i ≤ N of finite length N, reconsti-tute the N − m + 1 vectors Xm(i) following the form:
Xm (i) = {x (i) , x (i + 1) , . . . , x(i + m − 1)} ,
i = 1, 2, . . . , N − m + 1 (17)
where m is the embedding dimension.Let Cm
i (r) be the probability that any vector Xm(j) is withindistance r of Xm (i), defined as:
Cmi (r) = 1
N − m + 1
∑N−m+1
j = 1�
(dm
ij − r);
i, j = 1, 2, . . . , N − m + 1 (18)
where d is the distance between the vectors Xm(i) and Xm(j),
defined as:
dmij = d
[Xm
i , Xmj
]= max
(∣∣x (i + k) − x(j − k)∣∣) ,
k = 0, 1, . . . , m (19)
and � is the Heaviside function.After that, define a parameter �m(r):
�m (r) = (N − m + 1)−1∑N − m + 1
i = 1ln Cm
i (r) (20)
Next, when the dimension changes to m + 1, the above process isrepeated.
�m + 1 (r) = (N − m)−1∑N − m
i = 1ln Cm + 1
i (r) (21)
Finally, the approximate entropy is defined by:
ApEn (m, r, N) = �m (r) − �m + 1(r) (22)
The detailed algorithm is seen in Bruhn et al. (2000). The ApEnindex is influenced by data length (N), tolerance (r) and embed-ding dimension (m). According to Pincus (1991) and Bruhn et al.(2000), N is recommended to be 1000, r 0.1∼0.25 of the stan-dard deviation of the signal and m 2∼3. The selection of theseparameters is described in Supplement Material 1.
SAMPLE ENTROPY (SampEn)The SampEn proposed by Richman and Moorman (2000) isbased on ApEn but differs from it in three ways to remove bias:
(1) SampEn eliminates self-matches;(2) To avoid ln 0 caused by removing self-matches, SampEn
computes the additional operation of the total number oftemplate well-matches prior to the logarithmic operation.
Frontiers in Computational Neuroscience www.frontiersin.org February 2015 | Volume 9 | Article 16 | 4
(3) In order to have an equal number of patterns for both embed-ding dimension m and m + 1, the time series reconstitutionin SampEn have N − m rows instead of N − m + 1 in ApEnin embedding dimension m.
The first step of calculating SampEn is the same as ApEn. Whenthe embedding dimension is m, the total number of templatematches is:
Bm(r) = (N − m)−1∑N − m
i = 1Cm
i (r) (23)
Similarly, when the embedding dimension is m + 1, the totalnumber of template matches is:
Am(r) = (N − m)−1∑N − m
i = 1Cm + 1
i (r) (24)
Finally, the SampEn of the time series is estimated by:
SampEn (r, m, N) = − lnAm(r)
Bm(r)(25)
SampEn is based on ApEn, so its parameter selection procedure issimilar to that of ApEn (see Supplement Material 1).
FUZZY ENTROPY (FuzzyEn)Zadeh introduced the concept of “fuzzy set” (Zadeh, 1965). Fuzzyset provides a mechanism for measuring the degree to which apattern belongs to a given class, by introducing the concept of“membership degree” having a fuzzy function uc(x). The nearerthe value uc(x) is to unity, the higher the membership grade of x inthe set C will be. Inspired by this, Chen et al. (2007) developed theFuzzyEn based on SampEn. FuzzyEn uses the fuzzy membershipfunction u(dm
ij , r) to obtain the similarity between Xmi and Xm
jinstead of the Heaviside function.
FuzzyEn is based on SampEn, so its parameter selection issimilar to that of SampEn (see Supplement Material 1).
PERMUTATION ENTROPY (SPE, TPE, AND RPE)There are three types of PE measures involved in this study. PE isan ordinal analysis method, in which a given time series is dividedinto a series of ordinal patterns for describing the order relationsbetween the present and a fixed number of equidistant past val-ues (Bandt, 2005). The advantage of this method is its simplicity,robustness and low computational complexity (Li et al., 2007).
For an N-point normalized time series {x(i) : 1 ≤ i ≤ N},firstly the time series is reconstructed:
where τ is the time delay, m is the embedding dimension.Then, rearrange Xi in an increasing order:
{x(i + (
j1 − 1)τ) ≤ x
(i + (
j2 − 1)τ)) ≤ · · ·
≤ x(i + (
jm − 1)τ}
(27)
There are m! permutations for m dimensions. Each vector Xi canbe mapped to one of the m! permutations.
Next, the probability of the jth permutation occurring pj canbe defined as:
pj = nj∑m!j = 1 nj
(28)
where nj is the number of times the jth permutation occurs.Based on the probability of the jth permutation pj, we define
SPE, TPE and RPE as follows.SPE is just the Shannon entropy associated with the probability
distribution pj:
S(s)1 = −
∑m!j = 1
pjlog pj (29)
And the normalized SPE is:
SPEn = S(S)1
S(s)1,max
=∑m!
j = 1 pjlog pj
log (m!) (30)
Based on the definition of Tsallis entropy, Zunino et al., proposedthe normalized TPE and defined it as Zunino et al. (2008):
TPE =∑m!
j = 1
(pj − p
qj
)1 − (m!)1 − q
(31)
Furthermore, the normalized RPE measure based on the Renyientropy and permutation probability distribution pj is:
RPEn =log
∑m!j = 1 pa
j
(1 − a) ln m! (32)
In Li et al. (2008a, 2010, 2012), SPE was used to evaluate theeffect of sevoflurane and isoflurane anesthesia on the brain. Inthis study, the parameters of m = 6 and τ = 1 are selected forsevoflurane anesthesia as proposed in Li et al. (2008a). The SPE’sparameters for isoflurane anesthesia are the same as those pro-posed by Li et al. (2012). TPE and RPE are first used in DoAmeasure, therefore selection of the appropriate parameters of TPEand RPE should be based on the experiments. The details of theselection process is shown in Supplement Material 1.
MATERIALS AND STATISTICAL METHODSSUBJECTS AND EEG RECORDINGSEEG data set during sevoflurane-induced anesthesiaIn this study, the first data set we used was from a previousstudy (McKay et al., 2006), in which 19 patients aged 18–63 yearswere recruited from Waikato Hospital, Hamilton, New Zealand.The subjects were scheduled for elective gynecologic, general, ororthopedic surgery. All patients fasted for at least 6 h before anes-thesia and received no premedication. Patients were AmericanSociety of Anesthesiologists physical status I or II and signed writ-ten informed consent following approval by the Waikato Hospitalethics committee.
Frontiers in Computational Neuroscience www.frontiersin.org February 2015 | Volume 9 | Article 16 | 5
Before application of Ag/AgCl electrodes, the skin was carefullycleaned with an alcohol swab to ensure electrode-skin impedanceof less than 7.5 k�. A composite electrode, the Entropy™ Sensor,composed of a self-adhering flexible band holding three elec-trodes were used to record the EEG signals between the foreheadand temple (active = FpZ, earth = Fp1, and reference = F8).RE and SE were measured every 5 s with a plug-in M-EntropyS/5 Module (Datex-Ohmeda). The sevoflurane concentration wasmeasured at the mouth at 100/s (McKay et al., 2006). All datawere recorded and stored on a laptop computer. Off-line analysiswas performed using the MATLAB (version 8, MathWorks Inc.)software.
EEG data set during isoflurane-induced anesthesiaThe second data set contains 29 patients (9 men and 20 women,age 33–77 year) receiving elective abdominal surgery duringcombined isoflurane general anesthesia and epidural anesthe-sia (Hagihira et al., 2002). These patients had no neurologicor psychiatric disorders and didn’t receive medication with anydrugs known to influence anesthesia. The data recordings wereapproved by the Osaka Prefectural Habikino Hospital and allpatients gave written informed consent.
Each patient was injected intramuscularly with 0.5 mgatropine before entering the operating room. Initially, an epidu-ral catheter was placed at the appropriate spinal location. Then,after confirming the effect of epidural analgesia, 3 mg/kg thiopen-tal was used to induce anesthesia. Anesthesia was subsequentlymaintained with isoflurane, oxygen, and nitrogen after tra-cheal intubation. Vecuronium was given as required. Lidocaine1% (80–110 mg/h; initial dose, 90–100 mg) was administeredepidurally. Patients received controlled ventilation to maintainadequate oxygenation and normocapnia. To keep mean bloodpressure at 60 mmHg, dopamines were administered as requiredat a dose of 2–5 µg/(kg·min).
Before induction of anesthesia, five EEG electrodes (A1, A2,FP1, FP2, and FPz) were attached to the patients according tothe International 10–20 System. FPz was used as the groundelectrode. The EEG signal used was recorded from a unipo-lar lead (FP1-A1) through a 514 X-2 EEG telemetry system(GE Marquette, Tokyo, Japan) with sample frequency of 512 Hz(another Fp2-A2 channel was not analyzed). Isoflurane was ini-tially increased to 1.5% and then stepped down to 0.7%. Theend-tidal concentration of isoflurane was purposely maintainedat set levels (1.5, 1.3, 1.1, 0.9, and 0.7%) for 30 min at each level.The EEG recordings at 0.3 and 0.5% isoflurane were collectedimmediately after the operation. The concentration of isofluranewas continuously monitored and recorded by Canomac (Datex,Helsinki, Finland). The BSP was evident in six of the 29 EEGrecordings.
The two data sets used can be obtained by asking the authorsof corresponding original papers.
EEG PREPROCESSINGAll the EEG recordings were preprocessed by following the stepsoutlined in Li et al. (2010) before further analysis. Firstly, datapoints whose amplitude values exceeded a threshold determinedby mean and standard deviation (SD) statistics were removed as
outliers. Then, the filter function filter.m was used to remove thefrequency components higher than 60 Hz. This FIR filter ensuresthat phase information is not distorted. Thirdly the stationarywavelet transform was used to reduce electro-oculogram (EOG)artifact. Finally, an inverse filter was used to detect and removeEMG and other high-amplitude transient artifacts.
PHARMACOKINETIC/PHARMACODYNAMIC MODELINGTo derive the relationship between effect-site anesthetic drugconcentration and the measured EEG index, PK/PD modelingwas used. These methods have been successfully used to eval-uate the proposed EEG indices (Li et al., 2008a; Olofsen et al.,2008). It describes the relationship between drug dose and itseffect through two successive physiological processes (McKayet al., 2006). The pharmacokinetic (PK) side of the modeldescribes the changes in blood concentration of the drug overtime, while the pharmacodynamic (PD) aspect shows the relationbetween the concentration of drug at its effect site and its mea-sured effect. The simplest effect site model is a first order model,defined as:
dCeff/dt = keo(Cet − Ceff) (33)
where Ceff denotes the effect-site concentration, keo is the first-order rate constant for efflux from the effect compartment andCet is the end-tidal concentration.
In addition, a non-linear inhibitory sigmoid Emax model wasused to describe the relationship between the estimated Ceff andthe measured EEG indices.
Effect = Emax − (Emax − Emin) × Cγ
eff
ECγ50 + Cγ
eff
(34)
where Effect is the processed EEG measure, Emax and Emin respec-tively are the maximum and minimum Effect for each individual,ECγ
50 is the drug concentration that causes 50% of the maxi-mum Effect and γ is the slope of the concentration–responserelationship.
The coefficient of determination R2 is calculated by:
R2 = 1 −∑n
i = 1
(yi − yi
)2
∑ni = 1
(yi − y
)2(35)
where yi is the measured Effect for a given time and yi is corre-sponding modeled Effect.
Ceff is estimated by iteratively running the above model with aseries of keo values, with the optimal keo yielding the greatest R2
for each patient.
MDFA EXPONENTKantelhardt et al., proposed the MDFA method to describe thenon-stationary time series, which is based on a generalizationDFA method (Kantelhardt et al., 2002). Nguyen-Ky et al., usedthe moving-average DFA method to monitoring the DoA andthe results showed that DFA could accurately estimate a patient’shypnotic state (Nguyen-Ky et al., 2010a).
Frontiers in Computational Neuroscience www.frontiersin.org February 2015 | Volume 9 | Article 16 | 6
For a time series x(t) of length N, the main computationprocedure of MDFA consists of three steps.
Step 1. Construct the profile as the equation showed below,
y(j) =
∑j
i= [x (i) − 〈x〉] (36)
where 〈x〉 represents the average value of x(t).Step 2. Divide the new profile
{y(j)}
into Ns = N/s non-overlapping segments of equal length s. Since the record length Nmay not be a multiple of the considered time scale s, a short partat the end of the profile will remain in most cases. In order not todisregard this part of record, the same procedure is repeated start-ing from the other end of the profile
{y(j)}
. Thus, 2Ns segmentsare obtained altogether.
Step 3. Calculate the local trend for each segment by a least-square fit of the data and calculate the variance F2 (s, v). Thus,the qth order fluctuation function is calculated as follows:
Fq (s) ={
1
2Ns
∑2N
v = 1
[F2 (s, v)
q/2}1/q
(37)
If q = 0, then
F0 (s) = exp
{1
4Ns
∑2Ns
v = 1ln
[F2(s, v)
]}(38)
It is obvious that when q = 2, we have the standard DFA proce-dure.
MFDFA characterizes the evolution of Fq (s) is a function ofthe segment length s. Modeling fluctuations that present a power-law behavior between Fq (s) and s, Fq(s) ∝ sh(q), where the h(q) isgeneralized Hurst exponent.
For the multifractal time series, the scaling behavior is sensitivewith the parameter q. For positive q, h(q) describes the scalingbehavior of the segments with large fluctuations. On the contrary,for negative q, h(q) is sensitive to small fluctuations. For moredetail of the MDFA method, see in Kantelhardt et al. (2002).
In this study, we only considered the influence of q withthe MDFA measure. The selection of parameter is described inSupplement Material 1.
STATISTICAL ANALYSISTo further evaluate the correlation between the measured EEGindex and underlying anesthetic drug effect, prediction probabil-ity (Pk) statistics were applied, as described in Smith et al. (1996).Given two random data points with different Ceff, Pk describesthe probability that the measured EEG index correctly predictsthe Ceff of the two points. Its definition is:
Pk = Pc + Ptx/2
Pc + Pd + Ptx(39)
where Pc, Pd and Ptx separate the probability that two data pointsdrawn at random, independently and with replacement from thepopulation are a concordance, a discordance or an x-only tie. Avalue of 1 means that the EEG index is perfectly concordant withCeff; whereas a value of 0.5 means the EEG index is obtained by
chance. When the monotonic relation between the drug concen-tration and the EEG index is negative, the resultant Pk value isreplaced by 1 − Pk.
In addition, The Kolmogorov–Smirnov test was used to deter-mine whether the data sets were normally distributed. To assessthe index stability during the awake state and the sensitivity tothe induction process, the relative coefficient of variation (CV)(Li et al., 2008a) was used. Kruskal-Wallis test was used to deter-mine the significant difference of the index values between awake,induction, anesthesia and recovery states.
RESULTSFirst we used these entropy measures on EEG data from sevoflu-rane anesthesia. Figure 1A shows a preprocessed EEG recordingand the derivative from the EEG signal during the whole sevoflu-rane induction process, from awake to induction, then to deepanesthesia, and finally to recovery. With deepening anesthesia,the mean amplitude of the EEG gradually increased and then theamplitude decreased in the state of recovery. The concurrent end-tidal sevoflurane concentration is represented by the black linegiven in Figure 1B. It can be regarded as the drug concentration inblood, derived from the recorded sevoflurane concentration at themouth (represented by gray line). The changes in RE, SE, SWE,TWE, RWE, HHSE, ApEn, SampEn, FuzzyEn, SPE, TPE, RPE,and MDFA corresponding to the EEG recording are successivelygiven in Figures 1C–K. As can be seen, all the entropy indicesgenerally followed the changes in EEG pattern as the drug con-centration increased and decreased. And MDFA had the oppositetrend with entropy indices.
Then we analyzed the EEG recording during isoflurane anes-thesia using the same entropy algorithms and MDFA methods.Figures 2A,B are the EEG recording and isoflurane end-tidalconcentration respectively. It can be seen that the drug concentra-tion increased and then decreased. Figures 2C–K shows the sameentropy and MDFA indices as Figures 1C–K, and demonstrateequivalent trends, in line with changes in drug concentration.
Loss of consciousness (LOC) is the most important clinicaltime point during anesthesia. We investigated the ability of theseentropies in tracking LOC. Figure 3 demonstrates the changesin each index around LOC, from LOC−30 s to LOC+30 s forall subjects during sevoflurane anesthesia. For these plots, indexvalues were normalized to between 0 and 1. It can be seen inFigures 3A–N that MDFA(−8) decreased most rapidly, followedby SWE. Thus, the MDFA with q = −8 appeared to be the mostsensitive to LOC. To verify this, we calculated the absolute slopevalues (mean ± SD) of the linear-fitted polynomials vs. time forthese indices, as shown in Figure 3O. As can be seen, the absoluteslope value for MDFA(−8) (0.44 ± 0.22) is largest, followed bySWE (0.43 ± 0.23).
To further compare the ability of the indices to distinguishdifferent anesthesia states, the sevoflurane anesthesia procedurewas divided into four states, i.e., awake, induction, deep anesthe-sia, and recovery. For each index, a box plot is given in Figure 4.The data was not normally distributed, so the statistics of the19 patients undergoing sevoflurane anesthesia were expressed asmedian (min—max), as shown in Table 1. All the entropy indicesmonotonically decreased as anesthesia deepened, then increased
Frontiers in Computational Neuroscience www.frontiersin.org February 2015 | Volume 9 | Article 16 | 7
FIGURE 1 | An EEG recording from a patient undergoing sevoflurane
anesthesia and corresponding entropy indices vs. time. (A) PreprocessedEEG recording. (B) Sevoflurane concentration recorded at the mouth (grayline) and the derived end-tidal sevoflurane concentration (black line). (C–J)
The time course of the studied EEG derivative. The indices are calculatedover a window of 10 s with an overlap of 75%. (K) The time course of MDFAat q = 2 [MDFA(2)] and q = −8 [MDFA(−8)]. The window and overlapselection are similar with entropy measures.
FIGURE 2 | An EEG recording from a patient in isoflurane anesthesia
and calculated indices. (A) Preprocessed EEG recording, re-sampled at128 Hz. (B) Recording of the isoflurane end-tidal concentration. (C–J)
Time course of entropy indices, with a time interval of 10 s and 5 soverlap. (K) Time course of MDFA measures with a time interval of 10and 5 s overlap.
Frontiers in Computational Neuroscience www.frontiersin.org February 2015 | Volume 9 | Article 16 | 8
FIGURE 3 | Entropy and MDFA analysis around the time of LOC for
subject undergoing sevoflurane anesthesia (n = 19). (A–N) Thenormalized indices around LOC (from LOC − 30 s to LOC + 30 s) forall subjects. The red plus sign denotes the point of LOC. (O)
Statistical analysis of the absolute slope of the linear-fitted polynomialsvs. time for studied indices. Bar height indicates the mean value, andthe lower and upper line are the 95% confidence interval of eachindex.
FIGURE 4 | Box plots of RE, SE, SWE, TWE, RWE, HHEn, ApEn, SampEn, FuzzyEn, SPE, TPE, RPE, MDFA(2) and MDFA(-8) (A–N) at awake (I), induction
(II), deep anesthesia (III) and recovery (IV) states.
during recovery. The MDFA indices have an opposite trend withthe entropy measures. These are consistent with the results inFigure 1. The overlap of three types of PE (SPE, TPE, and RPE)values between the awake and deep anesthesia states were smallerthan the other indices. This means the PE has a better abilityto separate these states and a greater robustness for individualdifferences.
To estimate the baseline variability and the sensitivity to theinduction process of each index, the CV value of all the indicesfor the sevoflurane data set are computed and the results are givenin Table 2. During the awake state, the CV value of SampEn was0.095, which was the highest; The CV value of TPE was 0.003, sig-nificantly lower than MDFA(2) (0.240) and MDFA(−8) (0.125)and the other indices. The CV values of SPE and RPE were lower
Frontiers in Computational Neuroscience www.frontiersin.org February 2015 | Volume 9 | Article 16 | 9
RE, response entropy in the M-entropy module; SE, state entropy; SWE, Shannon wavelet entropy; TWE, Tsallis wavelet entropy; RWE, Renyi wavelet entropy;
Table 2 | The CV of the studied indices at different anesthetic states.
Awake Induction Deep RoC
RE 0.025 0.149 0.047 0.052
SE 0.016 0.122 0.047 0.050
SWE 0.080 0.338 0.177 0.077
TWE 0.024 0.161 0.063 0.038
RWE 0.043 0.276 0.127 0.057
HHSE 0.029 0.089 0.027 0.024
ApEn 0.040 0.193 0.064 0.043
SampEn 0.095 0.259 0.087 0.094
FuzzyEn 0.089 0.193 0.088 0.073
SPE 0.006 0.115 0.028 0.025
TPE 0.003 0.138 0.030 0.028
RPE 0.004 0.219 0.043 0.041
MDFA(2) 0.240 0.176 0.046 0.100
MDFA(-8) 0.125 0.256 0.047 0.097
than other indices as well. The lower CV value of PE illustratesthat PE measures were less sensitive to noise, while MDFA meth-ods were least robust against noise. During induction, the CV ofSWE (0.338) was the highest. This demonstrates that SWE had afaster response speed compared to the other indices.
In order to verify the performance of all the indices for moni-toring DoA and detecting the burst suppression state, we analyzedthe isoflurane anesthesia data set, in which some subjects enteredinto the burst suppression state during deep anesthesia. Theresults are given in histogram form and shown in Figure 5. All theindices except SE and MDFA decreased with increasing isofluraneconcentration. During burst suppression, only ApEn and SampEncontinued to decrease. This means that the ApEn and SampEnalgorithms could be used to evaluate DoA including detection of
the burst suppression state, without the need for SupplementaryMethods. The tabulated results for each index at the differentisoflurane concentrations and BSP are presented in Table 3. TheCV of the indices show that PE (0.033) outperformed the othersin awake state (0% concentration) (see Table 4). And the CV oftwo MDFA measures were relative higher in awake state. It indi-cate that MDFA algorithms were no better than some entropymeasures in anti-noise performance.
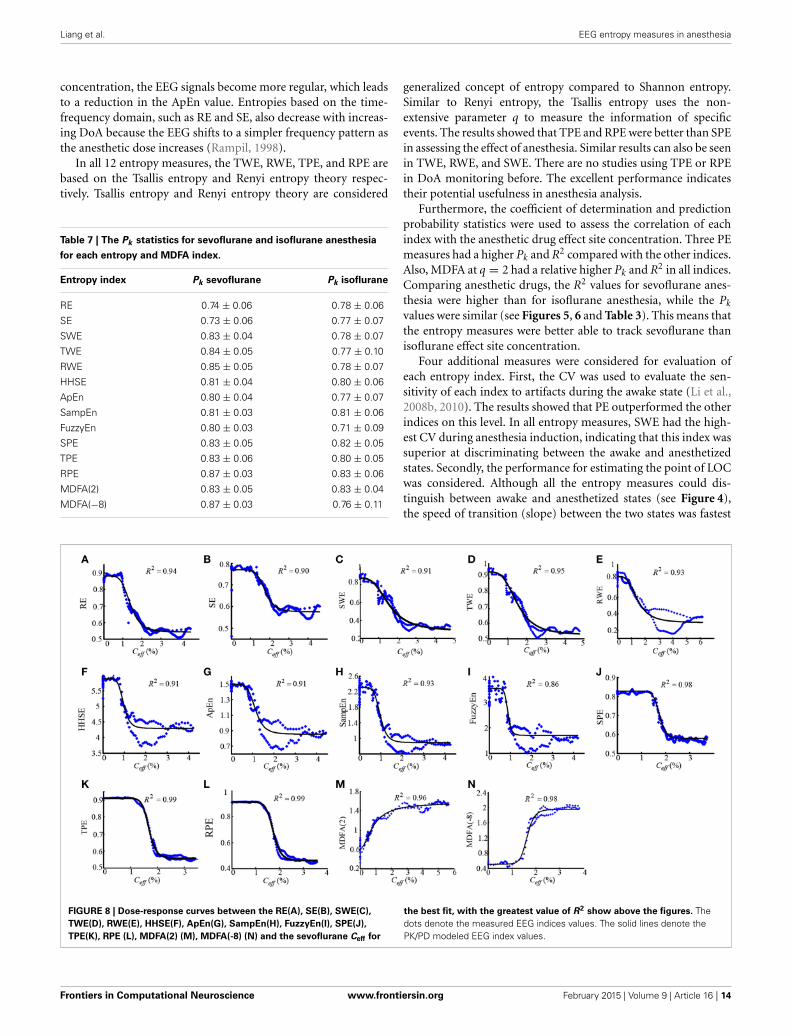
To further compare the performance of the studied indices,PK/PD modeling was performed to describe the relationshipbetween the index values and the estimated sevoflurane andisoflurane effect-site concentration. Tables 5, 6 give these param-eters for isoflurane and sevoflurane anesthesia respectively, inwhich the maximum coefficient of determination (R2) gives thecorrelation between the index values and the anesthetic effect siteconcentration. Figures 6A,B show the R2 values of the indices forthe two data sets. Figure 6A shows the R2 values for sevoflurane.It can be seen that R2 for TPE (0.95, 95% confidence interval0.92–0.98) was significantly higher than the other entropy indices.Figure 6B shows R2 values for isoflurane. Again, R2 for SPE (0.81)was higher than the other entropy indices. Although R2 of MDFAwith q = 8 was relative higher in sevoflurane anesthesia, the valuein isoflurane anesthesia was lower. The statistical analysis alsoshows that for the same entropy algorithm, the mean R2 valuefor sevoflurane was significantly higher than for isoflurane.
To assess the performance of the indices to correctly predictdrug effect-site concentrations, we evaluated the prediction prob-ability Pk of all the indices from the PK/PD modeling for all thesubjects, as shown in Figures 7A,B. And the statistical results areshown in Table 7. Overall, most Pk values of indices for sevoflu-rane were higher than for isoflurane. For sevoflurane, Pk of RPEand MDFA were equal (0.87, 95% confidence interval is 0.83–0.90 and 0.83–0.92 respectively), slightly higher than RWE (0.85)and TWE 0.81 (95% confidence interval 0.79–0.84). Also, Pk of
Frontiers in Computational Neuroscience www.frontiersin.org February 2015 | Volume 9 | Article 16 | 10
RPE was higher than that of TPE and SPE. Similarly, Pk of RWEwas highest in three WE methods. It means that Renyi entropyhad a better performance in predicting drug effect-site concentra-tions comparing with Shannon entropy and Tsallis entropy. Thedifferences between RPE and the other indices were statisticallysignificant (all p < 0.05, paired t-test), except for MDFA(-8). Andthe difference between RPE and TPE, SPE were statistically signif-icant (p = 0.03 and 0.01 respectively, paired t-test), which meansthat RPE had a stronger ability to track the sevoflurane effect-siteconcentration during anesthesia. In order to get a more intuitivecomparison, the best curve fits of all indices against the effect-site
concentration are demonstrated for both sevoflurane (Figure 8)and isoflurane (Figure 9).
To compare the timeliness performance of each index in track-ing DoA, we recorded the computing time of each index for thesame subject. 20 EEG recordings from the two data sets wereselected. The calculate epoch length (N) of each algorithm isequal to 10 s, and the overlap select 5.0 s. The computing time for1 min of EEG data compared for each index is given in Table 8.The fastest index was WE (0.025 ± 0.001 s). The RE/SE and PEcomputation times were 0.096 ± 0.008 s and 0.545 ± 0.016 srespectively. The MDFA (16.338 ± 0.280 s) was the slowest.
Frontiers in Computational Neuroscience www.frontiersin.org February 2015 | Volume 9 | Article 16 | 11
The desktop computer used for this test had the following con-figuration: Intel Core i3 CPU, 4 cores at 2.93 GHz, with 2 GB ofRAM, running Windows XP professional operating system.
DISCUSSION AND CONCLUSIONIn this study, we investigated the performance of 12 entropy algo-rithms to assess the effect of GABAergic anesthetic agents onEEG activity, including RE, SE, SWE, TWE, RWE, HHSE, ApEn,SampEn, FuzzyEn, SPE, TPE, and RPE. Two data sets includ-ing sevoflurane and isoflurane anesthesia were employed as thetest samples for evaluating the entropy algorithms. We comparedtheir performance in estimating the DoA and detecting the burstsuppression pattern. PK/PD modeling and prediction probability
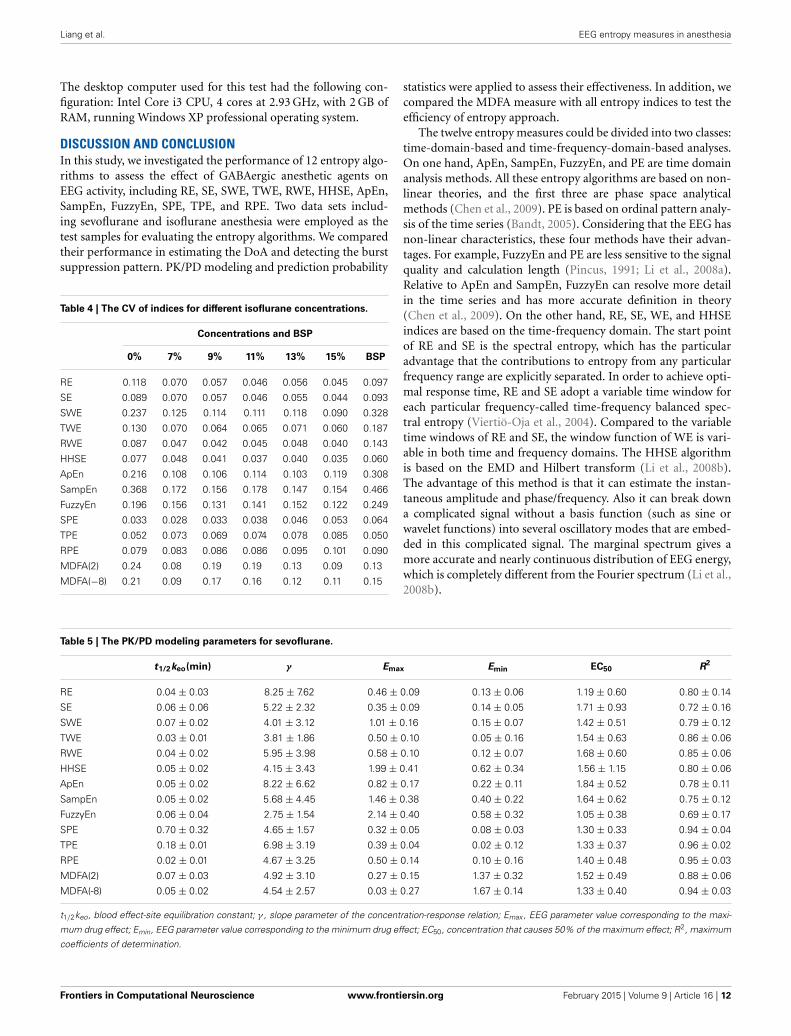
Table 4 | The CV of indices for different isoflurane concentrations.
Concentrations and BSP
0% 7% 9% 11% 13% 15% BSP
RE 0.118 0.070 0.057 0.046 0.056 0.045 0.097
SE 0.089 0.070 0.057 0.046 0.055 0.044 0.093
SWE 0.237 0.125 0.114 0.111 0.118 0.090 0.328
TWE 0.130 0.070 0.064 0.065 0.071 0.060 0.187
RWE 0.087 0.047 0.042 0.045 0.048 0.040 0.143
HHSE 0.077 0.048 0.041 0.037 0.040 0.035 0.060
ApEn 0.216 0.108 0.106 0.114 0.103 0.119 0.308
SampEn 0.368 0.172 0.156 0.178 0.147 0.154 0.466
FuzzyEn 0.196 0.156 0.131 0.141 0.152 0.122 0.249
SPE 0.033 0.028 0.033 0.038 0.046 0.053 0.064
TPE 0.052 0.073 0.069 0.074 0.078 0.085 0.050
RPE 0.079 0.083 0.086 0.086 0.095 0.101 0.090
MDFA(2) 0.24 0.08 0.19 0.19 0.13 0.09 0.13
MDFA(−8) 0.21 0.09 0.17 0.16 0.12 0.11 0.15
statistics were applied to assess their effectiveness. In addition, wecompared the MDFA measure with all entropy indices to test theefficiency of entropy approach.
The twelve entropy measures could be divided into two classes:time-domain-based and time-frequency-domain-based analyses.On one hand, ApEn, SampEn, FuzzyEn, and PE are time domainanalysis methods. All these entropy algorithms are based on non-linear theories, and the first three are phase space analyticalmethods (Chen et al., 2009). PE is based on ordinal pattern analy-sis of the time series (Bandt, 2005). Considering that the EEG hasnon-linear characteristics, these four methods have their advan-tages. For example, FuzzyEn and PE are less sensitive to the signalquality and calculation length (Pincus, 1991; Li et al., 2008a).Relative to ApEn and SampEn, FuzzyEn can resolve more detailin the time series and has more accurate definition in theory(Chen et al., 2009). On the other hand, RE, SE, WE, and HHSEindices are based on the time-frequency domain. The start pointof RE and SE is the spectral entropy, which has the particularadvantage that the contributions to entropy from any particularfrequency range are explicitly separated. In order to achieve opti-mal response time, RE and SE adopt a variable time window foreach particular frequency-called time-frequency balanced spec-tral entropy (Viertiö-Oja et al., 2004). Compared to the variabletime windows of RE and SE, the window function of WE is vari-able in both time and frequency domains. The HHSE algorithmis based on the EMD and Hilbert transform (Li et al., 2008b).The advantage of this method is that it can estimate the instan-taneous amplitude and phase/frequency. Also it can break downa complicated signal without a basis function (such as sine orwavelet functions) into several oscillatory modes that are embed-ded in this complicated signal. The marginal spectrum gives amore accurate and nearly continuous distribution of EEG energy,which is completely different from the Fourier spectrum (Li et al.,2008b).
Table 5 | The PK/PD modeling parameters for sevoflurane.
t1/2keo, blood effect-site equilibration constant; γ , slope parameter of the concentration-response relation; Emax , EEG parameter value corresponding to the maxi-
mum drug effect; Emin, EEG parameter value corresponding to the minimum drug effect; EC50, concentration that causes 50% of the maximum effect; R2, maximum
coefficients of determination.
Frontiers in Computational Neuroscience www.frontiersin.org February 2015 | Volume 9 | Article 16 | 12
FIGURE 6 | Statistical analysis of the sevoflurane and isoflurane
anesthesia datasets for each of the entropy and MDFA indices. (A)
Maximum coefficient of determination values for sevoflurane anesthesia
(n = 19). For comparison, the R2 values for each index are expressed by adifferent sign and color. (B) The R2 value of the same entropy indices forisoflurane anesthesia (n = 20).
FIGURE 7 | Statistical analysis of prediction probability (Pk ) values for sevoflurane and isoflurane anesthesia. (A) The Pk values for each entropy andMDFA index under sevoflurane anesthesia (n = 19). (B) The Pk values for each index during isoflurane anesthesia (n = 20).
Although each entropy algorithm has theoretical advantageswith respect to the characterization of EEG recordings dur-ing GABAergic anesthesia, we still need to assess the practicalperformance from several perspectives. In qualitative terms, allthe indices are effective at tracking the changes of drug con-centration through the EEG analysis. As demonstrated in thepresented figures and tables, all the entropies decreased with
deepening anesthesia. However, there are quantitative differencesbetween indices for different anesthesia states. This is becausethe principles underlying each algorithm are entirely different.Entropies based on the time domain, ApEn for example, measurethe predictability of future amplitude values of the electroen-cephalogram based on the knowledge of one or two previousamplitude values. With increasing GABAergic anesthetic drug
Frontiers in Computational Neuroscience www.frontiersin.org February 2015 | Volume 9 | Article 16 | 13
concentration, the EEG signals become more regular, which leadsto a reduction in the ApEn value. Entropies based on the time-frequency domain, such as RE and SE, also decrease with increas-ing DoA because the EEG shifts to a simpler frequency pattern asthe anesthetic dose increases (Rampil, 1998).
In all 12 entropy measures, the TWE, RWE, TPE, and RPE arebased on the Tsallis entropy and Renyi entropy theory respec-tively. Tsallis entropy and Renyi entropy theory are considered
Table 7 | The Pk statistics for sevoflurane and isoflurane anesthesia
for each entropy and MDFA index.
Entropy index Pk sevoflurane Pk isoflurane
RE 0.74 ± 0.06 0.78 ± 0.06
SE 0.73 ± 0.06 0.77 ± 0.07
SWE 0.83 ± 0.04 0.78 ± 0.07
TWE 0.84 ± 0.05 0.77 ± 0.10
RWE 0.85 ± 0.05 0.78 ± 0.07
HHSE 0.81 ± 0.04 0.80 ± 0.06
ApEn 0.80 ± 0.04 0.77 ± 0.07
SampEn 0.81 ± 0.03 0.81 ± 0.06
FuzzyEn 0.80 ± 0.03 0.71 ± 0.09
SPE 0.83 ± 0.05 0.82 ± 0.05
TPE 0.83 ± 0.06 0.80 ± 0.05
RPE 0.87 ± 0.03 0.83 ± 0.06
MDFA(2) 0.83 ± 0.05 0.83 ± 0.04
MDFA(−8) 0.87 ± 0.03 0.76 ± 0.11
generalized concept of entropy compared to Shannon entropy.Similar to Renyi entropy, the Tsallis entropy uses the non-extensive parameter q to measure the information of specificevents. The results showed that TPE and RPE were better than SPEin assessing the effect of anesthesia. Similar results can also be seenin TWE, RWE, and SWE. There are no studies using TPE or RPEin DoA monitoring before. The excellent performance indicatestheir potential usefulness in anesthesia analysis.
Furthermore, the coefficient of determination and predictionprobability statistics were used to assess the correlation of eachindex with the anesthetic drug effect site concentration. Three PEmeasures had a higher Pk and R2 compared with the other indices.Also, MDFA at q = 2 had a relative higher Pk and R2 in all indices.Comparing anesthetic drugs, the R2 values for sevoflurane anes-thesia were higher than for isoflurane anesthesia, while the Pk
values were similar (see Figures 5, 6 and Table 3). This means thatthe entropy measures were better able to track sevoflurane thanisoflurane effect site concentration.
Four additional measures were considered for evaluation ofeach entropy index. First, the CV was used to evaluate the sen-sitivity of each index to artifacts during the awake state (Li et al.,2008b, 2010). The results showed that PE outperformed the otherindices on this level. In all entropy measures, SWE had the high-est CV during anesthesia induction, indicating that this index wassuperior at discriminating between the awake and anesthetizedstates. Secondly, the performance for estimating the point of LOCwas considered. Although all the entropy measures could dis-tinguish between awake and anesthetized states (see Figure 4),the speed of transition (slope) between the two states was fastest
FIGURE 8 | Dose-response curves between the RE(A), SE(B), SWE(C),
TPE(K), RPE (L), MDFA(2) (M), MDFA(-8) (N) and the sevoflurane Ceff for
the best fit, with the greatest value of R2 show above the figures. Thedots denote the measured EEG indices values. The solid lines denote thePK/PD modeled EEG index values.
Frontiers in Computational Neuroscience www.frontiersin.org February 2015 | Volume 9 | Article 16 | 14
for SWE, while SE had the slowest transition. Thirdly, the per-formance for discriminating different drug concentrations wasconsidered, especially the ability to distinguish the burst suppres-sion state. The mean ± SD value of the indices showed that allthe entropy measures can distinguish different drug concentra-tions, while only ApEn and SampEn have the ability to distinguishburst suppression from the other states. This means that, if usingPE as a DoA index, an additional method for detecting the burstsuppression pattern would need to be incorporated, such as Non-linear Energy Operator (NLEO) (Särkelä et al., 2002). The resultsare in accordance with the findings during desflurane anesthesiafor ApEn (Bruhn et al., 2000) and sevoflurane anesthesia for PEand HHSE (Li et al., 2008b, 2010). Finally, the computing timewas used to assess algorithm complexity. The results showed thatthe WE index is the fastest algorithm of all the entropy indicestested. HHSE was the slowest: its computing time for the samedata length was about 580 times longer that for WE. In orderto improve the computational efficiency, the parallelized method
based on the graphics processing unit has been proposed (Chenet al., 2010).
The efficiency of these entropy measures were compared withother two non-linear dynamic measures, the MDFA with q = 2and −8, where MDFA with q = 2 is a standard DFA measure. Theresults and statistics show that MDFA were better in some aspectscompared to some of entropy measures, such as sharper slopein LOC, higher Pk and R2 for sevoflurane (almost equal to RPE)measure. However, there are several shortcomings in MDFA mea-sures. First, CVs of MDFA in awake state were higher comparedto those of entropy indices. Second, MDFA could not distinguishthe burst suppression state from other states. Most importantly,the computing time of MDFA is the longest in all algorithms,even longer than HHSE, which means that MDFA algorithms arenot suitable for real time DoA monitoring. Therefore, entropyapproaches are capable for monitoring the EEG changes in anes-thesia, and are often advantageous in computation efficiency.
Although this study covers a number of entropy methodsand two types of anesthesia, the research has its limitations.For instance, errors caused by individual variability, e.g., age,physical wellness, intraoperative tolerance are hard to controlbecause of the difficulty in data collection in clinical practice.Besides, Interactions between EEG activities and drug concentra-tions could be studied using finer-grained paradigm, for instanceby increasing the drug concentration in a stepwise pattern.Additionally, optimal parameters for each entropy measure maynot have been achieved and need further investigation.
This study doesn’t provide an absolute measure of “depth”of clinical anesthesia, nor of consciousness for the preventionof intra-operative recall; but rather focuses on understandingthe inner workings of each entropy index, and explores whetherthese indices correlate with GABAergic drug effect. Having a good
Frontiers in Computational Neuroscience www.frontiersin.org February 2015 | Volume 9 | Article 16 | 15
understanding of the strengths and weaknesses of each measure isnecessary before possibly applying them within a clinical context.
In conclusion, each entropy measure has its advantages, andseveral indices show promise as a simple open-source methodfor quantifying the brain effects of GABAergic drugs. In partic-ular, the PE indices perform better than other entropy indicesas an EEG derivative in several aspects, especially for RPE mea-sure. However, further work is required to accurately quantify theburst suppression pattern. Also, to be useful as a clinical measure,each algorithm still needs additional parameter and computationefficiency optimizations.
ACKNOWLEDGMENTSThis research was supported by National Natural ScienceFoundation of China (No. 61304247, 61203210 and 61271142),China Postdoctoral Science Foundation (2014M551051)and Applied basic research project in Hebei province (No.12966120D).
SUPPLEMENTARY MATERIALThe Supplementary Material for this article can be found onlineat: http://www.frontiersin.org/journal/10.3389/fncom.2015.
00016/abstract
REFERENCESAbásolo, D., Hornero, R., Espino, P., Alvarez, D., and Poza, J. (2006). Entropy analy-
sis of the EEG background activity in Alzheimer’s disease patients. Physiol. Meas.27, 241. doi: 10.1088/0967-3334/27/3/003
Alvarez-Ramirez, J., Echeverria, J. C., and Rodriguez, E. (2008). Performance of ahigh-dimensional R/S method for Hurst exponent estimation. Phys. A Statist.Mech. Appl. 387, 6452–6462. doi: 10.1016/j.physa.2008.08.014
Arefian, N. M., Zali, A. R., Seddighi, A. S., Fathi, M., Teymourian, H., Dabir, S.,et al. (2009). Clinical analysis of eeg parameters in prediction of the depth ofanesthesia in different stages: a comparative study. Tanaffos 8, 46–53.
Bandt, C. (2005). Ordinal time series analysis. Ecol. Modell. 182, 229–238. doi:10.1016/j.ecolmodel.2004.04.003
Bandt, C., and Pompe, B. (2002). Permutation entropy: a natural com-plexity measure for time series. Phys. Rev. Lett. 88, 174102. doi:10.1103/PhysRevLett.88.174102
Bein, B. (2006). Entropy. Best Pract. Res. Clin. Anaesthesiol. 20, 101–109. doi:10.1016/j.bpa.2005.07.009
Bezerianos, A., Tong, S., and Thakor, N. (2003). Time-dependent entropy estima-tion of EEG rhythm changes following brain ischemia. Ann. Biomed. Eng. 31,221–232. doi: 10.1114/1.1541013
Bruhn, J., Lehmann, L. E., Röpcke, H., Bouillon, T. W., and Hoeft, A. (2001).Shannon entropy applied to the measurement of the electroencephalo-graphic effects of desflurane. Anesthesiology 95, 30–35. doi: 10.1097/00000542-200107000-00010
Bruhn, J., Myles, P., Sneyd, R., and Struys, M. (2006). Depth of anaesthesia mon-itoring: what’s available, what’s validated and what’s next? Br. J. Anaesth. 97,85–94. doi: 10.1093/bja/ael120
Bruhn, J., Röpcke, H., and Hoeft, A. (2000). Approximate entropy as an electroen-cephalographic measure of anesthetic drug effect during desflurane anesthesia.Anesthesiology 92, 715–726. doi: 10.1097/00000542-200003000-00016
Cao, Y., Tung, W., Gao, J., Protopopescu, V., and Hively, L. (2004). Detectingdynamical changes in time series using the permutation entropy. Phys. Rev. Ser.E 70, 46217–46217. doi: 10.1103/PhysRevE.70.046217
Chen, D., Li, D., Xiong, M., Bao, H., and Li, X. (2010). GPGPU-aided ensem-ble empirical-mode decomposition for EEG analysis during anesthesia. Inform.Technol. Biomed. IEEE Trans. 14, 1417–1427. doi: 10.1109/TITB.2010.2072963
Chen, W., Wang, Z., Xie, H., and Yu, W. (2007). Characterization of surfaceEMG signal based on fuzzy entropy. Neural Syst. Rehabil. Eng. IEEE Trans. 15,266–272. doi: 10.1109/TNSRE.2007.897025
Chen, W., Zhuang, J., Yu, W., and Wang, Z. (2009). Measuring complex-ity using FuzzyEn, ApEn, and SampEn. Med. Eng. Phys. 31, 61–68. doi:10.1016/j.medengphy.2008.04.005
Clausius, R. (1867). The Mechanical Theory of Heat: with its Applications to theSteam-Engine and to the Physical Properties of Bodies. London: John van Voorst.
Elbert, T., Ray, W. J., Kowalik, Z. J., Skinner, J. E., Graf, K. E., and Birbaumer, N.(1994). Chaos and physiology: deterministic chaos in excitable cell assemblies.Physiol. Rev. 74, 1–48.
Ellerkmann, R. K., Soehle, M., Riese, G., Zinserling, J., Wirz, S., Hoeft, A., et al.(2010). The Entropy Module and Bispectral Index as guidance for propofol-remifentanil anaesthesia in combination with regional anaesthesia comparedwith a standard clinical practice group. Anaesth. Intensive Care 38, 159–166.
Fell, J., Röschke, J., Mann, K., and Schäffner, C. (1996). Discrimination ofsleep stages: a comparison between spectral and nonlinear EEG mea-sures. Electroencephalogr. Clin. Neurophysiol. 98, 401–410. doi: 10.1016/0013-4694(96)95636-9
Ferenets, R., Lipping, T., Anier, A., Jantti, V., Melto, S., and Hovilehto, S.(2006). Comparison of entropy and complexity measures for the assess-ment of depth of sedation. Biomed. Eng. IEEE Trans. 53, 1067–1077. doi:10.1109/TBME.2006.873543
Gifani, P., Rabiee, H., Hashemi, M., Taslimi, P., and Ghanbari, M. (2007). Optimalfractal-scaling analysis of human EEG dynamic for depth of anesthesia quantifi-cation. J. Franklin Inst. 344, 212–229. doi: 10.1016/j.jfranklin.2006.08.004
Hagihira, S., Takashina, M., Mori, T., Mashimo, T., and Yoshiya, I. (2002). Changesof electroencephalographic bicoherence during isoflurane anesthesia combinedwith epidural anesthesia. Anesthesiology 97, 1409–1415. doi: 10.1097/00000542-200212000-00012
Huang, L., Wang, W., and Singare, S. (2006). “Recurrence quantification analysis ofEEG predicts responses to incision during anesthesia,” in Neural InformationProcessing, eds I. King, J. Wang, L.-W. Chan, and D. Wang (Hong Kong:Springer), 58–65.
Huang, N. E., Shen, Z., Long, S. R., Wu, M. L. C., Shih, H. H., Zheng, Q. N., et al.(1998). The empirical mode decomposition and the Hilbert spectrum for non-linear and non-stationary time series analysis. Proc. R. Soc. Math. Phys. Eng. Sci.454, 903–995. doi: 10.1098/rspa.1998.0193
Inouye, T., Shinosaki, K., Sakamoto, H., Toi, S., Ukai, S., Iyama, A., et al. (1991).Quantification of EEG irregularity by use of the entropy of the power spec-trum. Electroencephalogr. Clin. Neurophysiol. 79, 204–210. doi: 10.1016/0013-4694(91)90138-T
Inuso, G., La Foresta, F., Mammone, N., and Morabito, F. C. (2007). “Brain activityinvestigation by EEG processing: wavelet analysis, kurtosis and Renyi’s entropyfor artifact detection,” in Information Acquisition, 2007. ICIA’07. InternationalConference on: IEEE (Jeju), 195–200.
Jameson, L. C., and Sloan, T. B. (2006). Using EEG to monitor anesthe-sia drug effects during surgery. J. Clin. Monit. Comput. 20, 445–472. doi:10.1007/s10877-006-9044-x
Jospin, M., Caminal, P., Jensen, E. W., Litvan, H., Vallverdú, M., Struys, M. M.,et al. (2007). Detrended fluctuation analysis of EEG as a measure of depth ofanesthesia. Biomed. Eng. IEEE Trans. 54, 840–846. doi: 10.1109/TBME.2007.893453
Kantelhardt, J. W., Zschiegner, S. A., Koscielny-Bunde, E., Havlin, S., Bunde,A., and Stanley, H. E. (2002). Multifractal detrended fluctuation analysisof nonstationary time series. Phys. A Statist. Mech. Appl. 316, 87–114. doi:10.1016/S0378-4371(02)01383-3
Klockars, J. G., Hiller, A., Munte, S., Van Gils, M. J., and Taivainen, T. (2012).Spectral entropy as a measure of hypnosis and hypnotic drug effect of totalintravenous anesthesia in children during slow induction and maintenance.Anesthesiology 116, 340–351. doi: 10.1097/ALN.0b013e3182410b5e
Klonowski, W., Olejarczyk, E., Stepien, R., Jalowiecki, P., and Rudner, R.(2006). Monitoring the depth of anaesthesia using fractal complexity method.Complex. Mundi. Emerg. Pattern. Nat. 333–342. doi: 10.1142/9789812774217_0031
Li, D., Liang, Z., Wang, Y., Hagihira, S., Sleigh, J. W., and Li, X. (2012). Parameterselection in permutation entropy for an electroencephalographic measure ofisoflurane anesthetic drug effect. J. Clin. Monit. Comput. 27, 113–123. doi:10.1007/s10877-012-9419-0
Li, D., Li, X., Liang, Z., Voss, L. J., and Sleigh, J. W. (2010). Multiscale permutationentropy analysis of EEG recordings during sevoflurane anesthesia. J. Neural Eng.7:046010. doi: 10.1088/1741-2560/7/4/046010
Frontiers in Computational Neuroscience www.frontiersin.org February 2015 | Volume 9 | Article 16 | 16
Li, X., Cui, S., and Voss, L. J. (2008a). Using permutation entropy to measurethe electroencephalographic effects of sevoflurane. Anesthesiology 109, 448. doi:10.1097/ALN.0b013e318182a91b
Li, X., Li, D., Liang, Z., Voss, L. J., and Sleigh, J. W. (2008b). Analysis of depthof anesthesia with Hilbert–Huang spectral entropy. Clin. Neurophysiol. 119,2465–2475. doi: 10.1016/j.clinph.2008.08.006
Li, X., Ouyang, G., and Richards, D. A. (2007). Predictability analysis ofabsence seizures with permutation entropy. Epilepsy Res. 77, 70. doi:10.1016/j.eplepsyres.2007.08.002
Liang, Z., Li, D., Ouyang, G., Wang, Y., Voss, L. J., Sleigh, J. W., et al. (2012).Multiscale rescaled range analysis of EEG recordings in sevoflurane anesthesia.Clin. Neurophysiol. 123, 681–688. doi: 10.1016/j.clinph.2011.08.027
Maszczyk, T., and Duch, W. (2008). “Comparison of Shannon, Renyi and Tsallisentropy used in decision trees,” in Artificial Intelligence and Soft Computing–ICAISC 2008, eds L. Rutkowski, R. Tadeusiewicz, L. A. Zadeh, and J. M. Zurada(Zakopane: Springer), 643–651.
McKay, I. D. H., Voss, L. J., Sleigh, J. W., Barnard, J. P., and Johannsen, E. K. (2006).Pharmacokinetic-pharmacodynamic modeling the hypnotic effect of sevoflu-rane using the spectral entropy of the electroencephalogram. Anesth. Analg. 102,91–97. doi: 10.1213/01.ane.0000184825.65124.24
Monk, T. G., Saini, V., Weldon, B. C., and Sigl, J. C. (2005). Anesthetic manage-ment and one-year mortality after noncardiac surgery. Anesth. Analg. 100, 4.doi: 10.1213/01.ANE.0000147519.82841.5E
Montirosso, R., Riccardi, B., Molteni, E., Borgatti, R., and Reni, G. (2010). Infant’semotional variability associated to interactive stressful situation: a novel analysisapproach with Sample Entropy and Lempel–Ziv Complexity. Infant Behav. Dev.33, 346–356. doi: 10.1016/j.infbeh.2010.04.007
Natarajan, K., Acharya, R., Alias, F., Tiboleng, T., and Puthusserypady, S. K. (2004).Nonlinear analysis of EEG signals at different mental states. Biomed. Eng. Online3:7. doi: 10.1186/1475-925X-3-7
Nguyen-Ky, T., Wen, P., and Li, Y. (2010a). An improved detrended moving-averagemethod for monitoring the depth of anesthesia. Biomed. Eng. IEEE Trans. 57,2369–2378. doi: 10.1109/TBME.2010.2053929
Nguyen-Ky, T., Wen, P., and Li, Y. (2010b). Improving the accuracy of depth ofanaesthesia using modified detrended fluctuation analysis method. Biomed.Signal Process. Control 5, 59–65. doi: 10.1016/j.bspc.2009.03.001
Okogbaa, O. G., Shell, R. L., and Filipusic, D. (1994). On the investigation of theneurophysiological correlates of knowledge worker mental fatigue using theEEG signal. Appl. Ergon. 25, 355–365. doi: 10.1016/0003-6870(94)90054-X
Olofsen, E., Sleigh, J., and Dahan, A. (2008). Permutation entropy of the electroen-cephalogram: a measure of anaesthetic drug effect. Br. J. Anaesth. 101, 810–821.doi: 10.1093/bja/aen290
Pincus, S. M. (1991). Approximate entropy as a measure of system complexity. Proc.Natl. Acad. Sci. U.S.A. 88, 2297–2301. doi: 10.1073/pnas.88.6.2297
Pritchard, W. S., Duke, D. W., and Krieble, K. K. (1995). Dimensional analy-sis of resting human EEG II: surrogate-data testing indicates nonlinearity butnot low−dimensional chaos. Psychophysiology 32, 486–491. doi: 10.1111/j.1469-8986.1995.tb02100.x
Rampil, I. J. (1998). A primer for EEG signal processing in anesthesia.Anesthesiology 89, 980–1002. doi: 10.1097/00000542-199810000-00023
Renyi, A. (1970). Probability Theory. Amsterdam: North-Holland.Rezek, I., and Roberts, S. J. (1998). Stochastic complexity measures for phys-
iological signal analysis. Biomed. Eng. IEEE Trans. 45, 1186–1191. doi:10.1109/10.709563
Richman, J. S., and Moorman, J. R. (2000). Physiological time-series analysis usingapproximate entropy and sample entropy. Am. J. Physiol. Heart Circ. Physiol.278, H2039–H2049.
Rosso, O. A., Blanco, S., Yordanova, J., Kolev, V., Figliola, A., Schurmann, M.,et al. (2001). Wavelet entropy: a new tool for analysis of short durationbrain electrical signals. J. Neurosci. Methods 105, 65–76. doi: 10.1016/S0165-0270(00)00356-3
Rosso, O., Martin, M., Figliola, A., Keller, K., and Plastino, A. (2006). EEG analysisusing wavelet-based information tools. J. Neurosci. Methods 153, 163–182. doi:10.1016/j.jneumeth.2005.10.009
Rosso, O., Martin, M., and Plastino, A. (2003). Brain electrical activity analysisusing wavelet-based informational tools (II): tsallis non-extensivity and com-plexity measures. Phys. A Statist. Mech. Appl. 320, 497–511. doi: 10.1016/S0378-4371(02)01529-7
Särkelä, M., Mustola, S., Seppänen, T., Koskinen, M., Lepola, P., Suominen,K., et al. (2002). Automatic analysis and monitoring of burst suppressionin anesthesia. J. Clin. Monit. Comput. 17, 125–134. doi: 10.1023/A:1016393904439
Särkelä, M. O. K., Ermes, M. J., Van Gils, M. J., Yli-Hankala, A. M., Jäntti, V. H., andVakkuri, A. P. (2007). Quantification of epileptiform electroencephalographicactivity during sevoflurane mask induction. Anesthesiology 107, 928–938. doi:10.1097/01.anes.0000291444.68894.ee
Shannon, C. E., and Weaver, W. (1949). The Mathematical Theory ofCommunication. Urbana: University of Illinois Press.
Sleigh, J., Voss, L., and Barnard, J. (2005). What are electroencephalogram entropiesreally measuring? Int. Cong. Ser. 1283, 231–234. doi: 10.1016/j.ics.2005.06.048
Sleigh, J. W., Olofsen, E., Dahan, A., de Goede, J., and Steyn-Ross, A. (2001).“Entropies of the EEG: the effects of general anaesthesia,” in Paper Presented atthe 5th International Conference on Memory, Awareness and Consciousness (NewYork, NY).
Smith, W. D., Dutton, R. C., and Smith, T. N. (1996). Measuring the performanceof anesthetic depth indicators. Anesthesiology 84, 38–51. doi: 10.1097/00000542-199601000-00005
Tong, S., Bezerianos, A., Malhotra, A., Zhu, Y., and Thakor, N. (2003).Parameterized entropy analysis of EEG following hypoxic–ischemic braininjury. Phys. Lett. A 314, 354–361. doi: 10.1016/S0375-9601(03)00949-6
Tsallis, C., Mendes, R., and Plastino, A. R. (1998). The role of constraints withingeneralized nonextensive statistics. Phys. A Statist. Mech. Appl. 261, 534–554.doi: 10.1016/S0378-4371(98)00437-3
Viertiö-Oja, H., Maja, V., Särkelä, M., Talja, P., Tenkanen, N., Tolvanen-Laakso, H.,et al. (2004). Description of the Entropy™ algorithm as applied in the Datex-Ohmeda S/5™ Entropy Module. Acta Anaesthesiol. Scand. 48, 154–161. doi:10.1111/j.0001-5172.2004.00322.x
Yoo, C. S., Jung, D. C., Ahn, Y. M., Kim, Y. S., Kim, S. G., Yoon, H., et al. (2012).Automatic detection of seizure termination during electroconvulsive therapyusing sample entropy of the electroencephalogram. Psychiatry Res. 195, 76–82.doi: 10.1016/j.psychres.2011.06.020
Zadeh, L. A. (1965). Fuzzy sets. Inform. Control 8, 338–353. doi: 10.1016/S0019-9958(65)90241-X
Zhang, X. S., Roy, R. J., and Jensen, E. W. (2001). EEG complexity as a measure ofdepth of anesthesia for patients. Biomed. Eng. IEEE Trans. 48, 1424–1433. doi:10.1109/10.966601
Zunino, L., Pérez, D., Kowalski, A., Martín, M., Garavaglia, M., Plastino, A.,et al. (2008). Fractional Brownian motion, fractional Gaussian noise, andTsallis permutation entropy. Phys. A Statist. Mech. Appl. 387, 6057–6068. doi:10.1016/j.physa.2008.07.004
Conflict of Interest Statement: The authors declare that the research was con-ducted in the absence of any commercial or financial relationships that could beconstrued as a potential conflict of interest.