Climate Change Mitigation Policy & Economic Growth: Lessons from the Brazilian Case Prof. Emilio Lèbre La Rovere Head of CentroClima/COPPE/UFRJ COPPE - Institute of Graduate Studies and Research in Engineering UFRJ - Federal University of Rio de Janeiro OECD Global Environment Forum Session 3 Environmental Degradation and Economic Growth Paris, 24 October 2016
Transcript
Climate Change Mitigation Policy & Economic Growth: Lessons from the Brazilian Case
Prof. Emilio Lèbre La Rovere
Head of CentroClima/COPPE/UFRJ COPPE - Institute of Graduate Studies and Research in
Engineering UFRJ - Federal University of Rio de Janeiro
OECD Global Environment Forum Session 3
Environmental Degradation and Economic Growth Paris, 24 October 2016
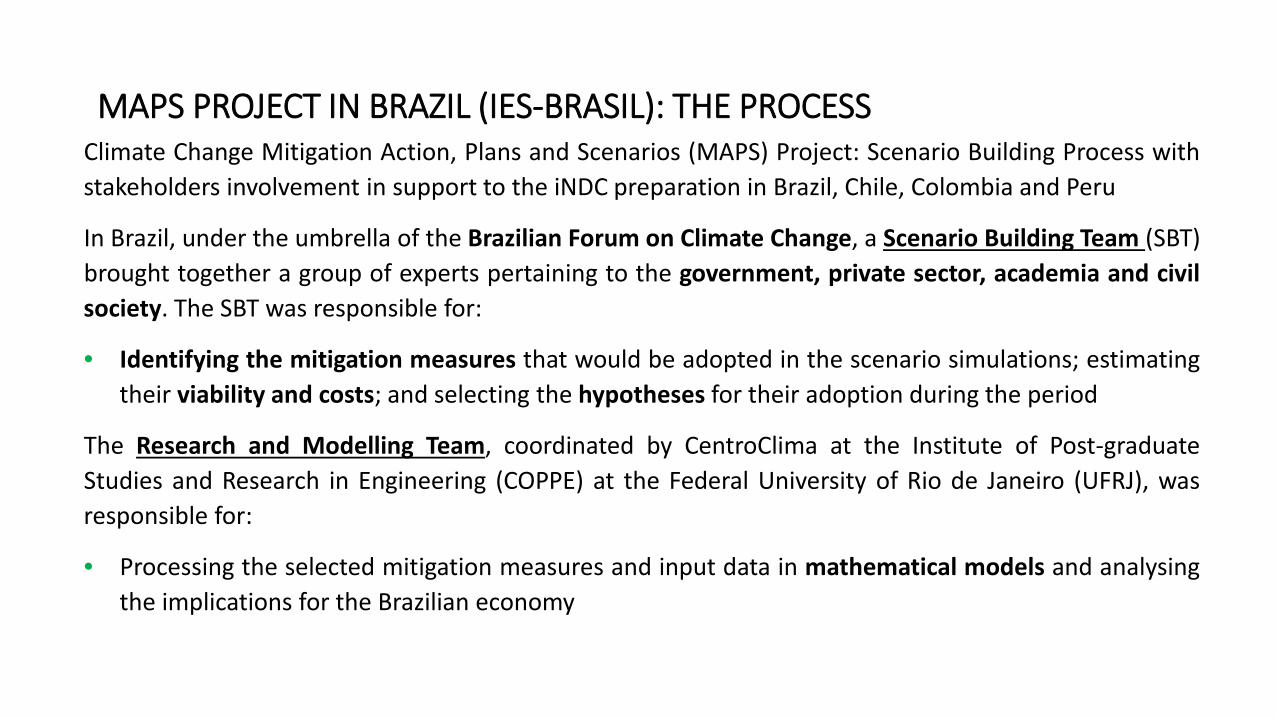
MAPS PROJECT IN BRAZIL (IES-BRASIL): THE PROCESS Climate Change Mitigation Action, Plans and Scenarios (MAPS) Project: Scenario Building Process with stakeholders involvement in support to the iNDC preparation in Brazil, Chile, Colombia and Peru
In Brazil, under the umbrella of the Brazilian Forum on Climate Change, a Scenario Building Team (SBT) brought together a group of experts pertaining to the government, private sector, academia and civil society. The SBT was responsible for:
• Identifying the mitigation measures that would be adopted in the scenario simulations; estimating their viability and costs; and selecting the hypotheses for their adoption during the period
The Research and Modelling Team, coordinated by CentroClima at the Institute of Post-graduate Studies and Research in Engineering (COPPE) at the Federal University of Rio de Janeiro (UFRJ), was responsible for:
• Processing the selected mitigation measures and input data in mathematical models and analysing the implications for the Brazilian economy
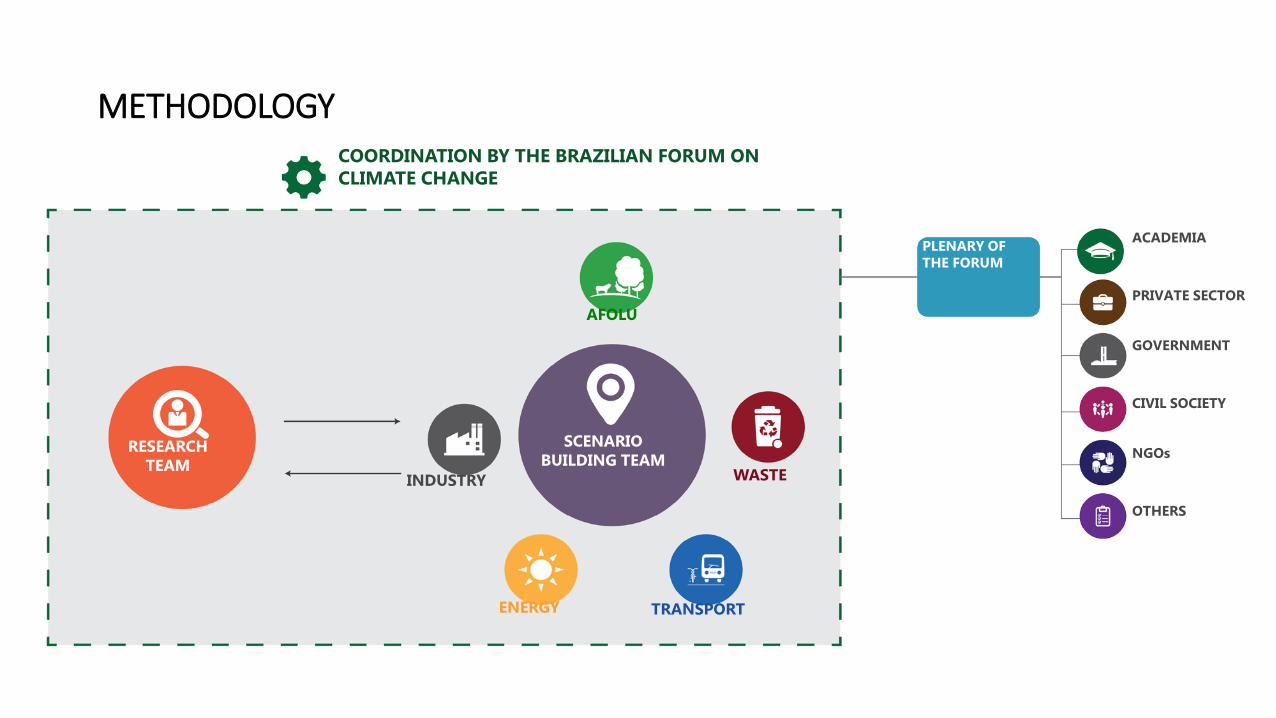
METHODOLOGY COORDINATION BY THE BRAZILIAN FORUM ON CLIMATE CHANGE
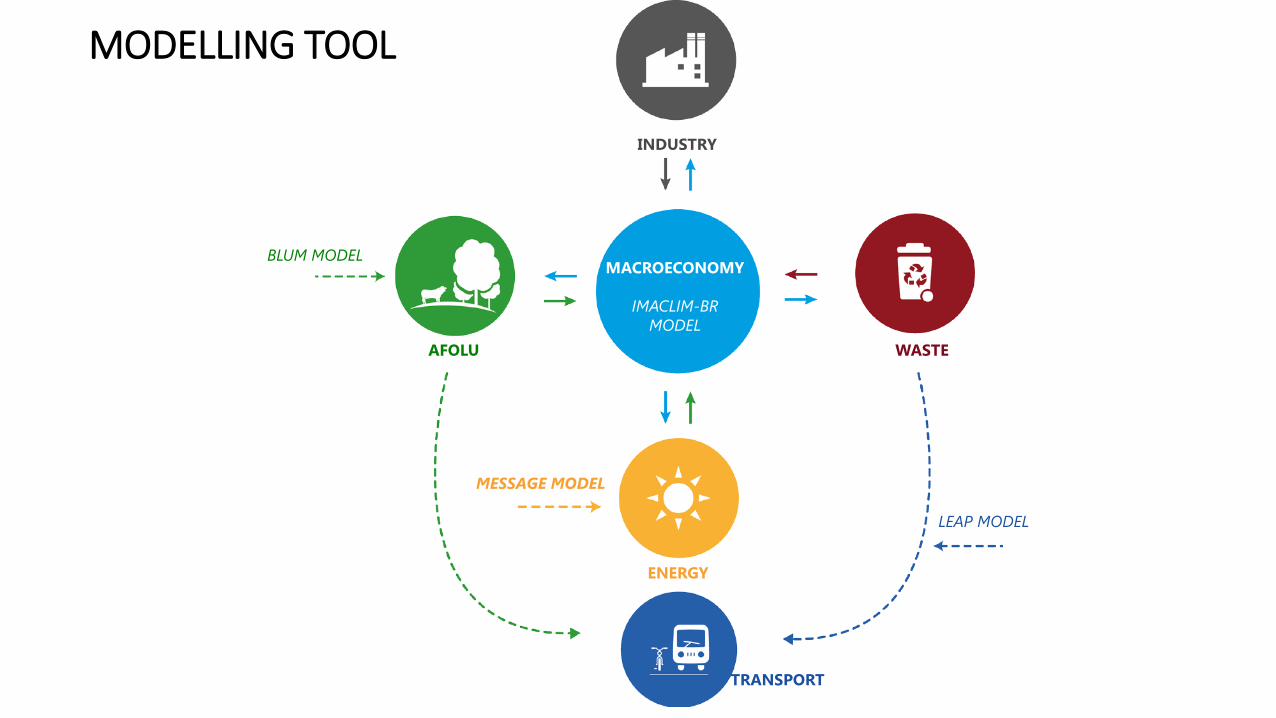
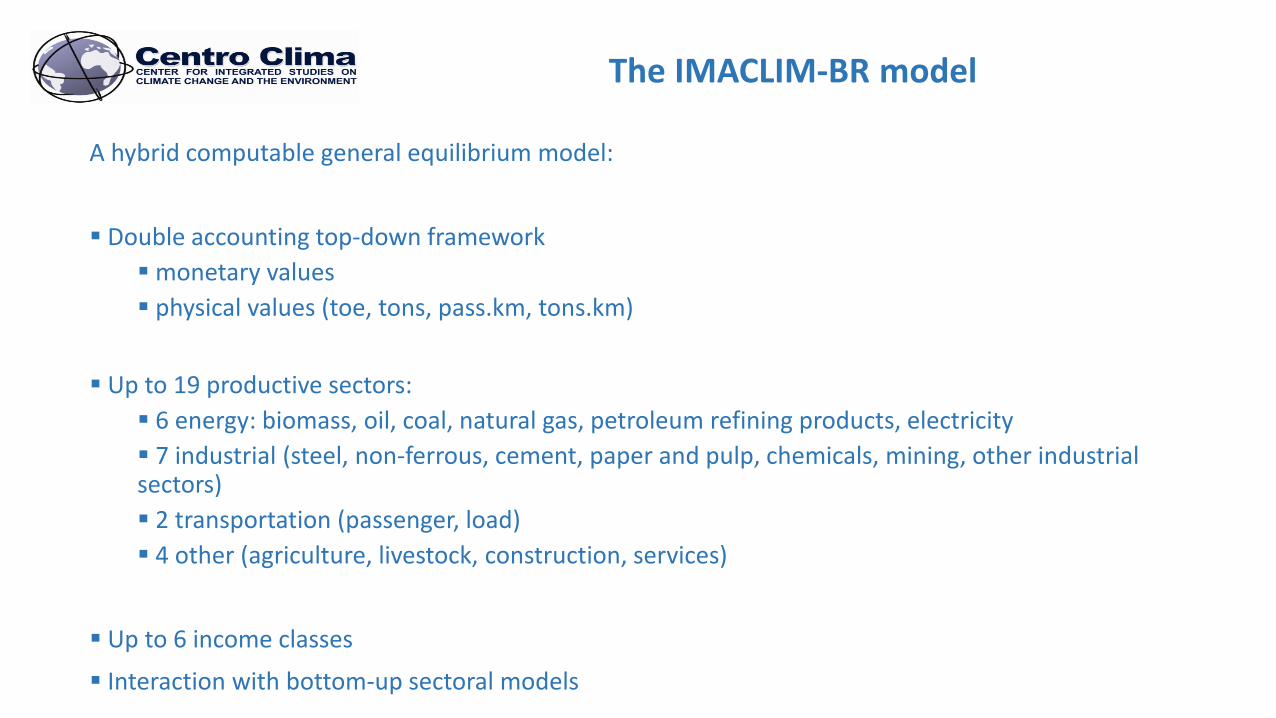
6 energy: biomass, oil, coal, natural gas, petroleum refining products, electricity 7 industrial (steel, non-ferrous, cement, paper and pulp, chemicals, mining, other industrial sectors) 2 transportation (passenger, load) 4 other (agriculture, livestock, construction, services)
Up to 6 income classes
Interaction with bottom-up sectoral models
The IMACLIM-BR model
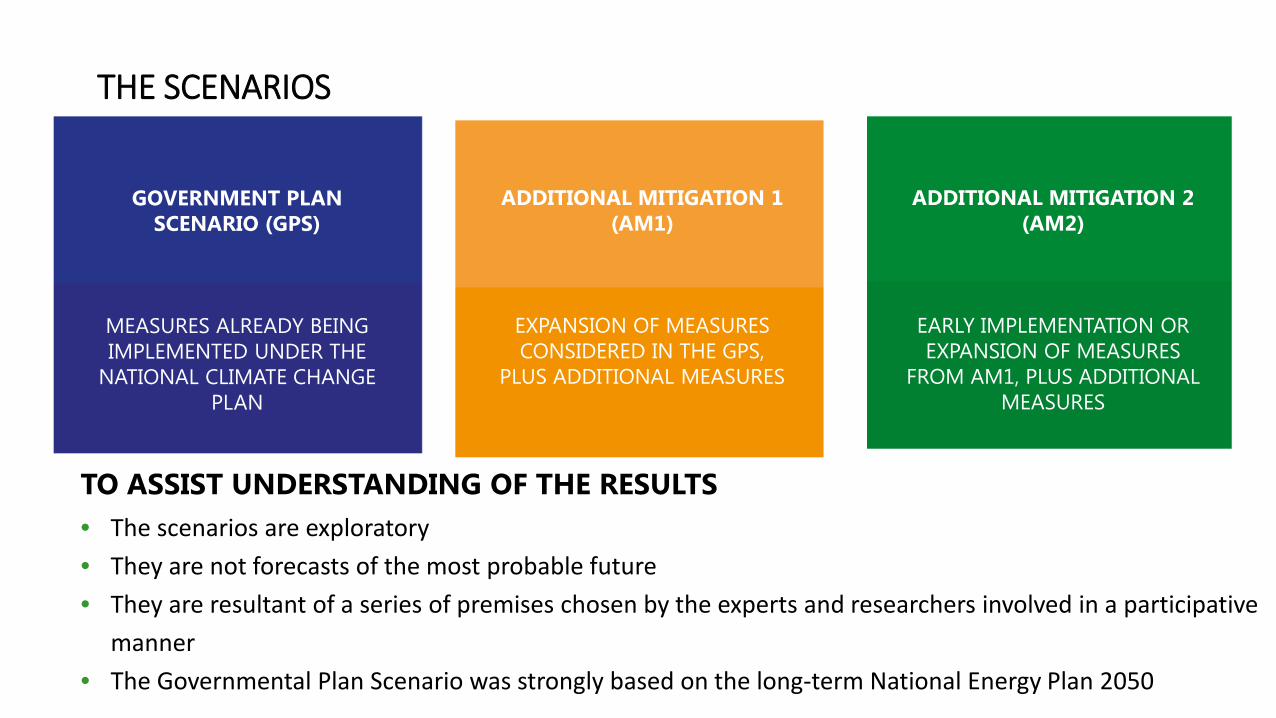
THE SCENARIOS
TO ASSIST UNDERSTANDING OF THE RESULTS • The scenarios are exploratory • They are not forecasts of the most probable future • They are resultant of a series of premises chosen by the experts and researchers involved in a participative
manner • The Governmental Plan Scenario was strongly based on the long-term National Energy Plan 2050
GOVERNMENT PLAN
SCENARIO (GPS)
MEASURES ALREADY BEING IMPLEMENTED UNDER THE
NATIONAL CLIMATE CHANGE PLAN
ADDITIONAL MITIGATION 1 (AM1)
EXPANSION OF MEASURES CONSIDERED IN THE GPS,
PLUS ADDITIONAL MEASURES
ADDITIONAL MITIGATION 2 (AM2)
EARLY IMPLEMENTATION OR EXPANSION OF MEASURES
FROM AM1, PLUS ADDITIONAL MEASURES
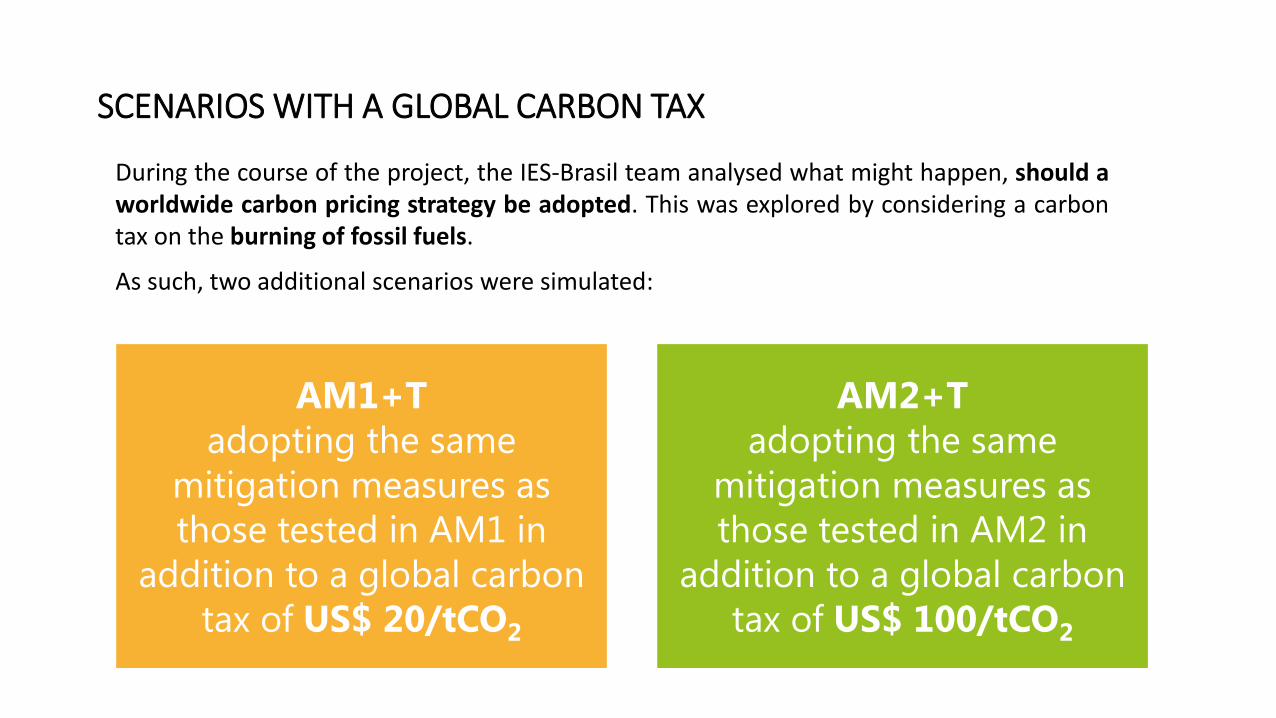
SCENARIOS WITH A GLOBAL CARBON TAX
During the course of the project, the IES-Brasil team analysed what might happen, should a worldwide carbon pricing strategy be adopted. This was explored by considering a carbon tax on the burning of fossil fuels.
As such, two additional scenarios were simulated:
AM1+T adopting the same
mitigation measures as those tested in AM1 in
addition to a global carbon tax of US$ 20/tCO2
AM2+T adopting the same
mitigation measures as those tested in AM2 in
addition to a global carbon tax of US$ 100/tCO2
1372
2583
2075 2017
1214 1272
1669
1144
1306
1042
1026
500
1500
2500
1990 1995 2000 2005 2010 2015 2020 2025 2030
CPG MA1 MA2GPS AM1 AM2
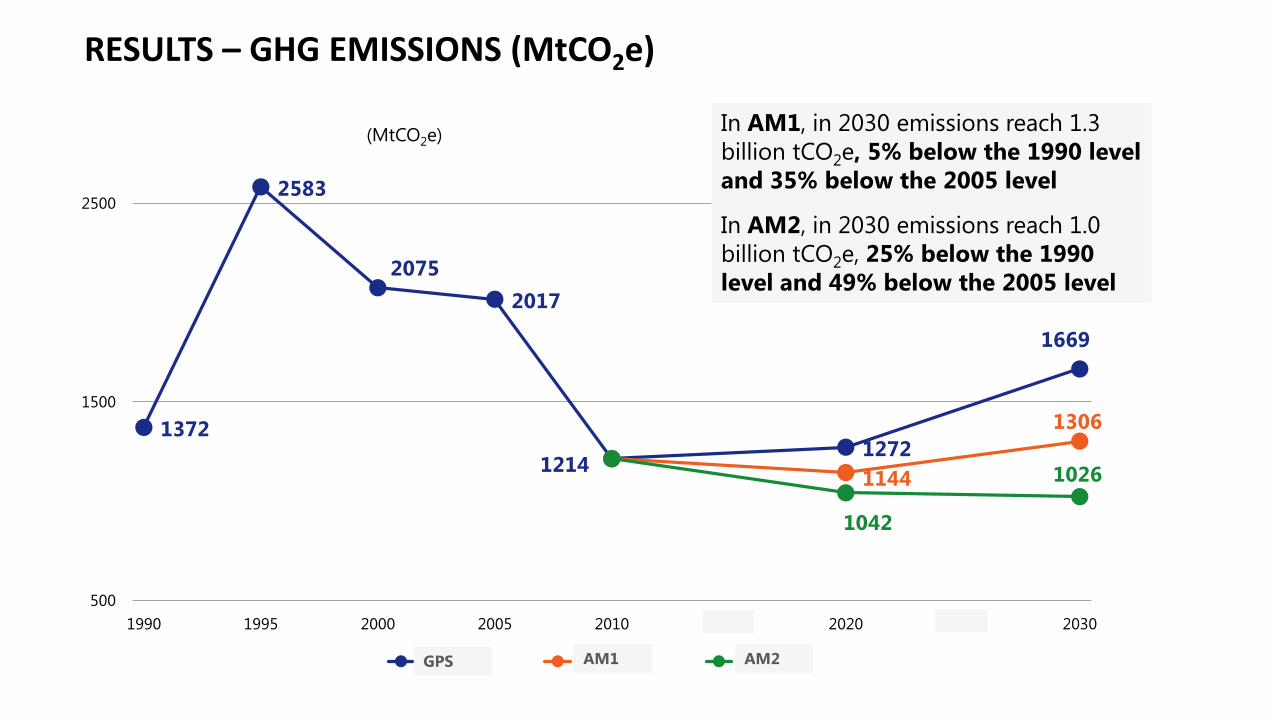
In AM1, in 2030 emissions reach 1.3 billion tCO2e, 5% below the 1990 level and 35% below the 2005 level
In AM2, in 2030 emissions reach 1.0 billion tCO2e, 25% below the 1990 level and 49% below the 2005 level
RESULTS – GHG EMISSIONS (MtCO2e)
(MtCO2e)
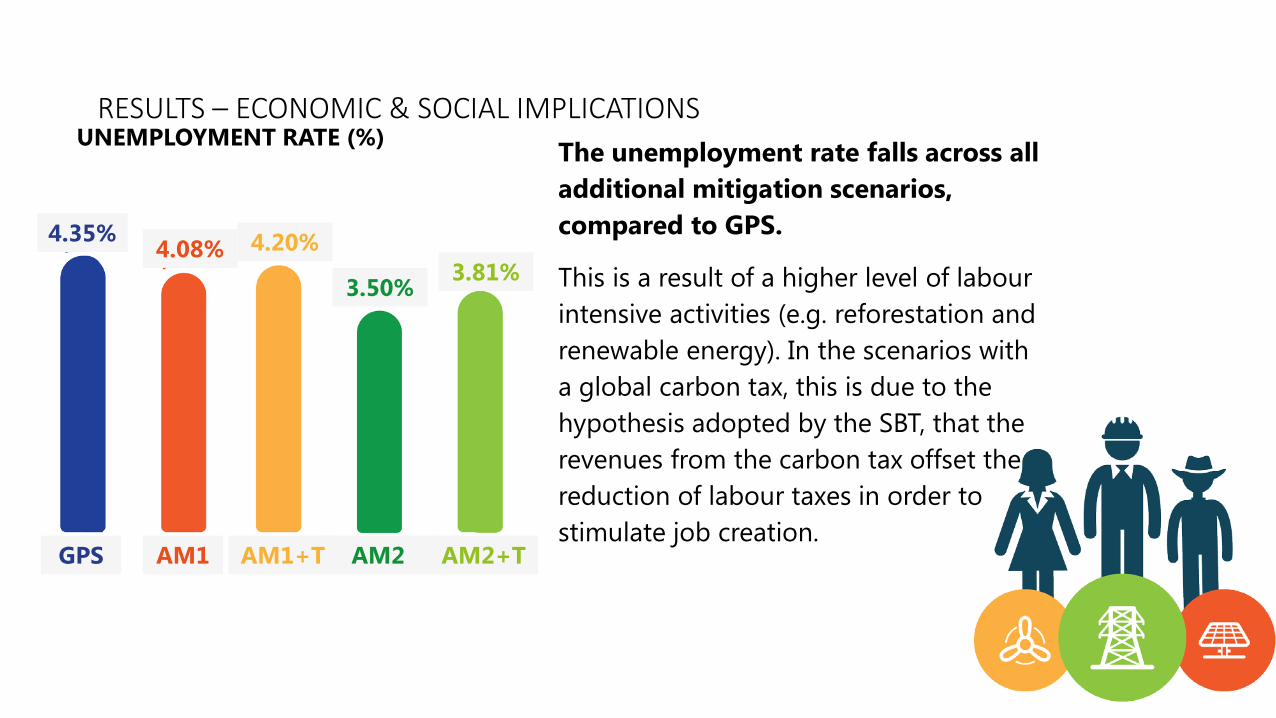
RESULTS – ECONOMIC & SOCIAL IMPLICATIONS The unemployment rate falls across all additional mitigation scenarios, compared to GPS.
This is a result of a higher level of labour intensive activities (e.g. reforestation and renewable energy). In the scenarios with a global carbon tax, this is due to the hypothesis adopted by the SBT, that the revenues from the carbon tax offset the reduction of labour taxes in order to stimulate job creation.
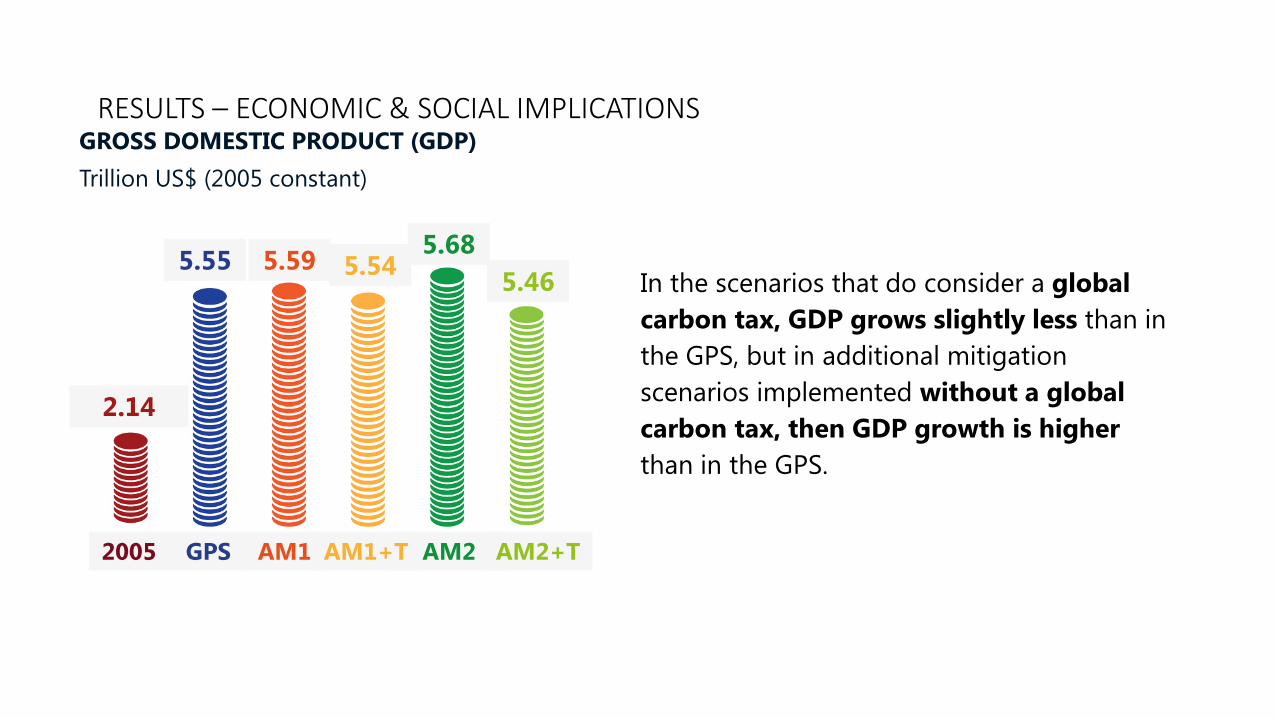
In the scenarios that do consider a global carbon tax, GDP grows slightly less than in the GPS, but in additional mitigation scenarios implemented without a global carbon tax, then GDP growth is higher than in the GPS.
2.14
5.55 5.59 5.54 5.68
5.46
2005 AM2 GPS AM1 AM1+T AM2+T
RESULTS – ECONOMIC & SOCIAL IMPLICATIONS
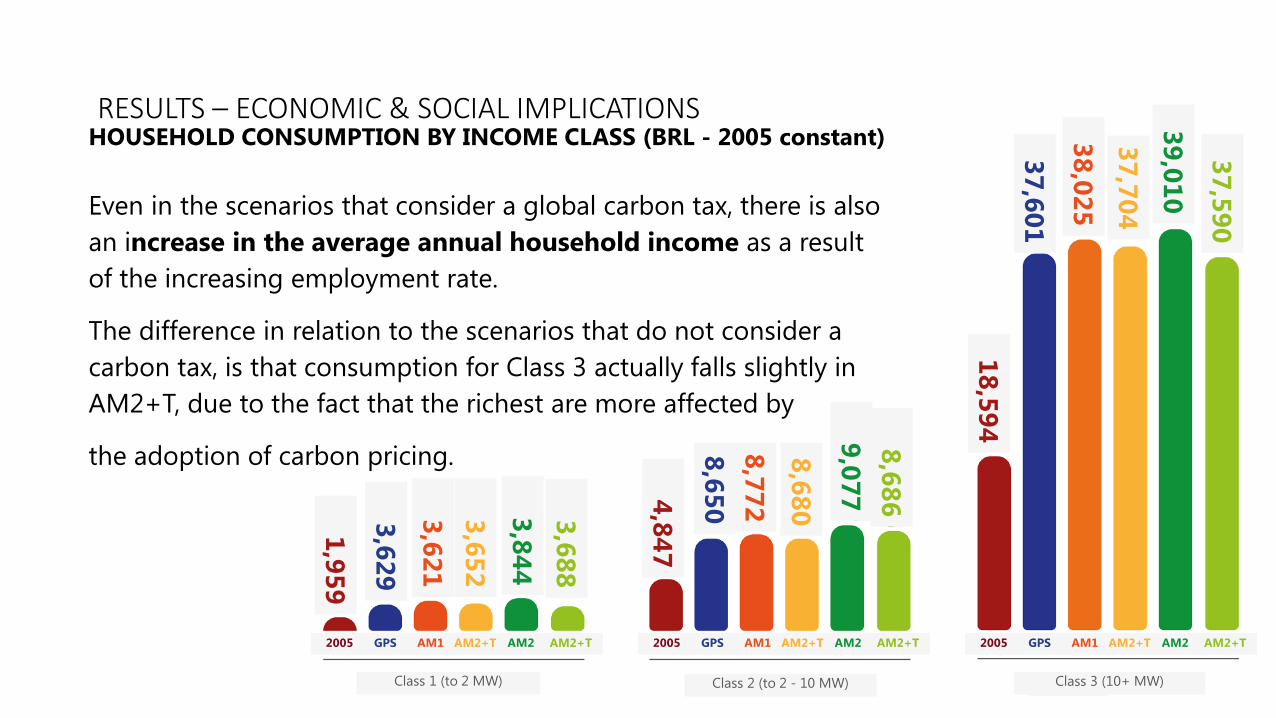
Even in the scenarios that consider a global carbon tax, there is also an increase in the average annual household income as a result of the increasing employment rate.
The difference in relation to the scenarios that do not consider a carbon tax, is that consumption for Class 3 actually falls slightly in AM2+T, due to the fact that the richest are more affected by
the adoption of carbon pricing.
HOUSEHOLD CONSUMPTION BY INCOME CLASS (BRL - 2005 constant)
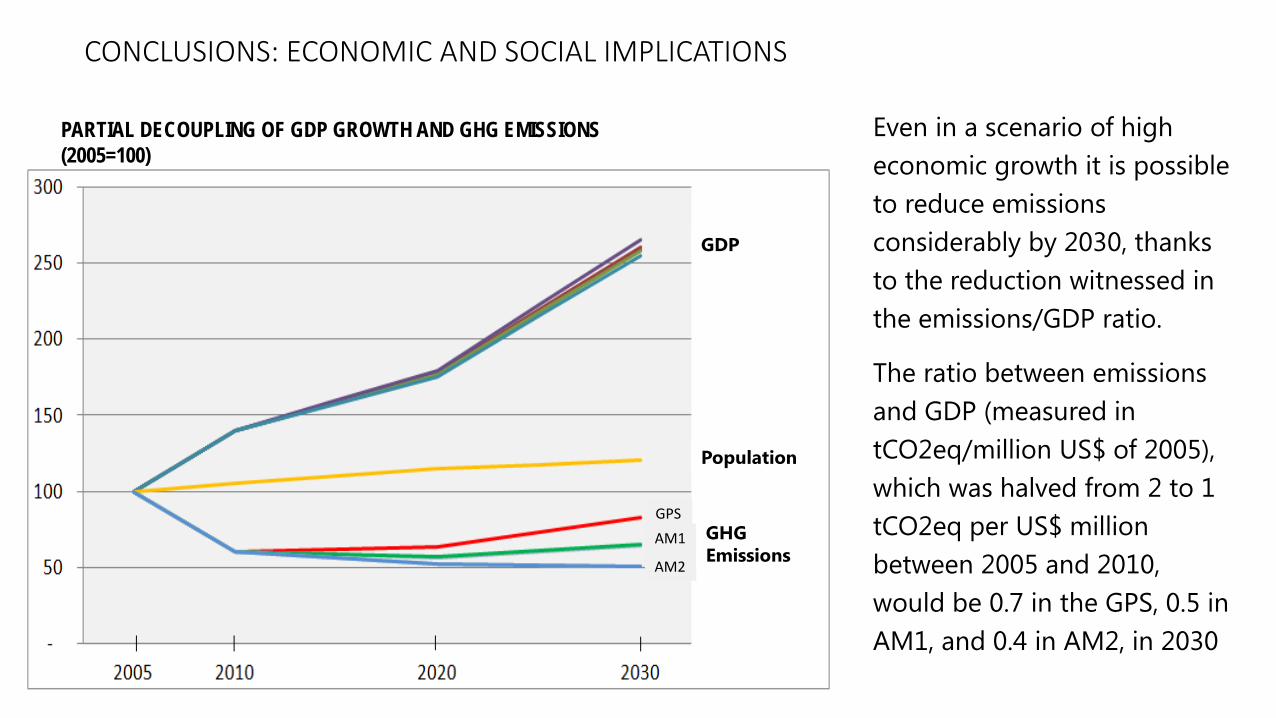
Even in a scenario of high economic growth it is possible to reduce emissions considerably by 2030, thanks to the reduction witnessed in the emissions/GDP ratio.
The ratio between emissions and GDP (measured in tCO2eq/million US$ of 2005), which was halved from 2 to 1 tCO2eq per US$ million between 2005 and 2010, would be 0.7 in the GPS, 0.5 in AM1, and 0.4 in AM2, in 2030
PARTIAL DECOUPLING OF GDP GROWTH AND GHG EMISSIONS (2005=100)
GPS AM1
AM2
GDP
Population
GHG Emissions
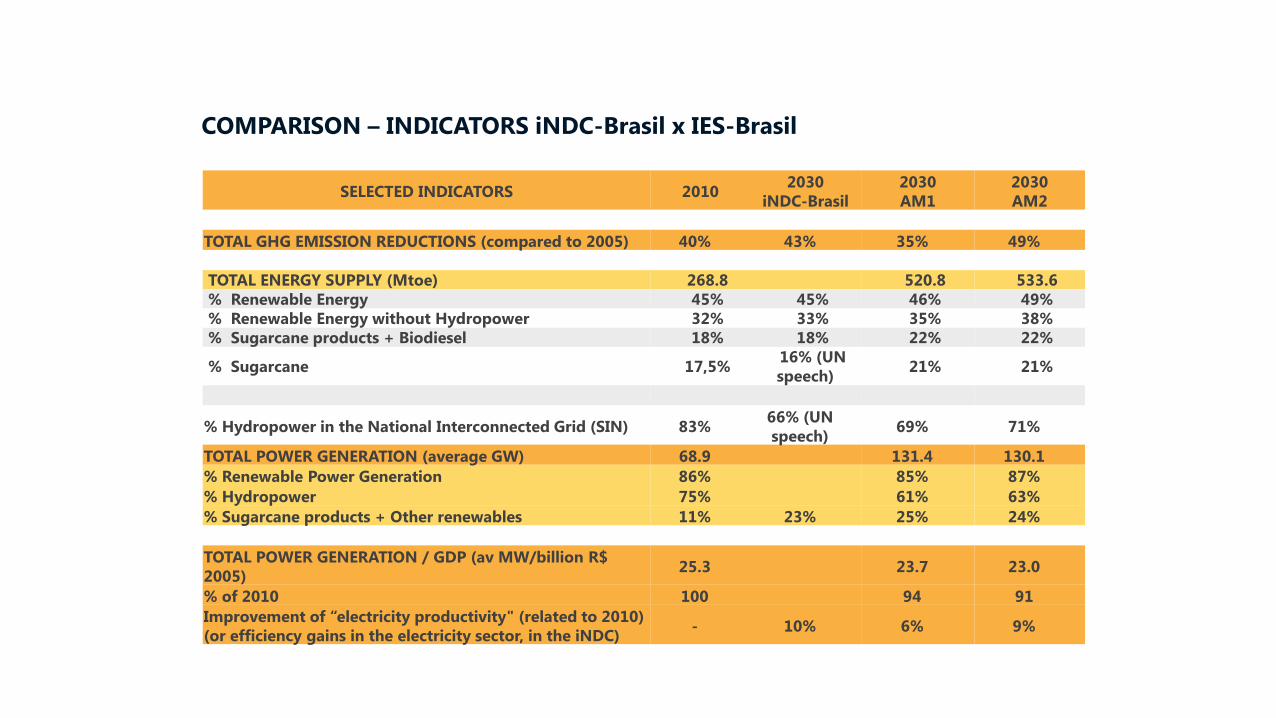
COMPARISON – INDICATORS iNDC-Brasil x IES-Brasil
SELECTED INDICATORS 2010 2030 iNDC-Brasil
2030 AM1
2030 AM2
TOTAL GHG EMISSION REDUCTIONS (compared to 2005) 40% 43% 35% 49%
TOTAL ENERGY SUPPLY (Mtoe) 268.8 520.8 533.6 % Renewable Energy 45% 45% 46% 49% % Renewable Energy without Hydropower 32% 33% 35% 38% % Sugarcane products + Biodiesel 18% 18% 22% 22%
% Sugarcane 17,5% 16% (UN speech) 21% 21%
% Hydropower in the National Interconnected Grid (SIN) 83% 66% (UN speech) 69% 71%
TOTAL POWER GENERATION (average GW) 68.9 131.4 130.1 % Renewable Power Generation 86% 85% 87% % Hydropower 75% 61% 63% % Sugarcane products + Other renewables 11% 23% 25% 24%
TOTAL POWER GENERATION / GDP (av MW/billion R$ 2005) 25.3 23.7 23.0
% of 2010 100 94 91 Improvement of “electricity productivity" (related to 2010) (or efficiency gains in the electricity sector, in the iNDC) - 10% 6% 9%
Outcomes of IES-Brasil: capacity building, evidence generation, impact on policy making :
• A Scenario Building Team mobilised for IES-Brasil and motivated to go forward, involving the key stakeholders of the country
• Evidence about the opportunities to get positive economic and social implications from climate change mitigation policies
• Policy-relevant inputs to the iNDC, future review of voluntary goals and a long-term Low Emission Development Strategy
Illustration of the Relevance of a dialogue between quantitative research, qualitative storylines and policy making