46
IAEA Isotopes in groundwater management
IAEA
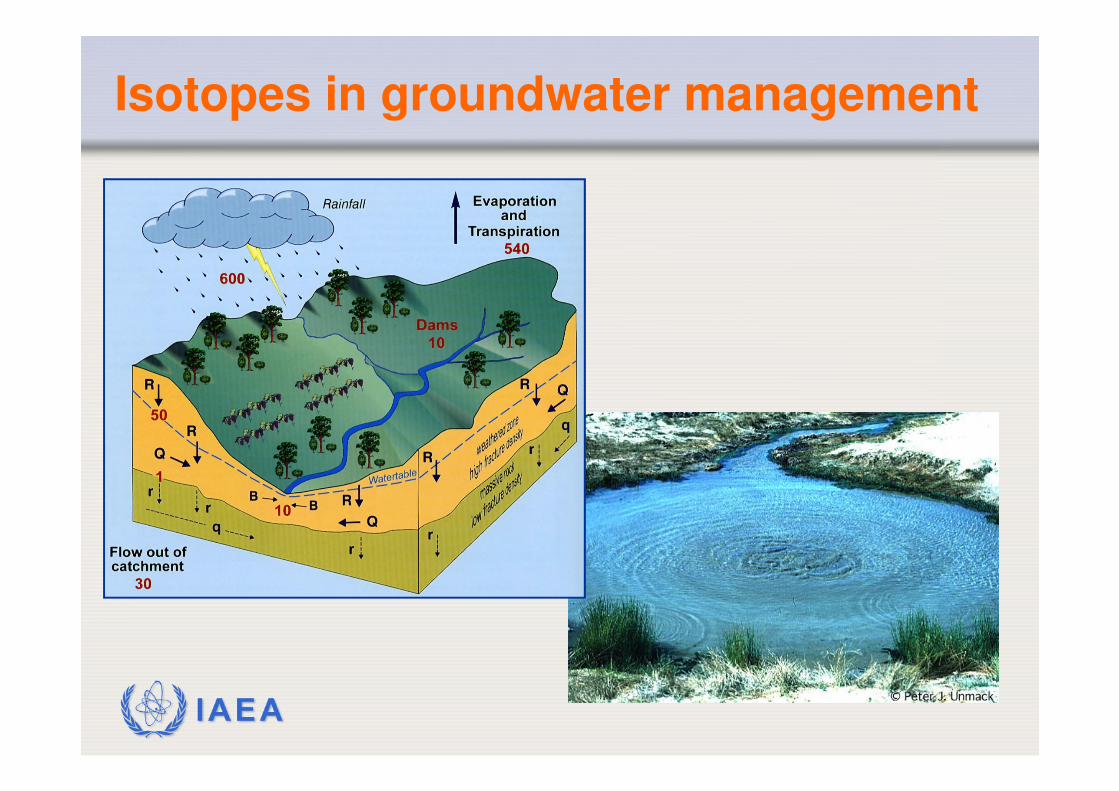
Isotopes in groundwater management
IAEA
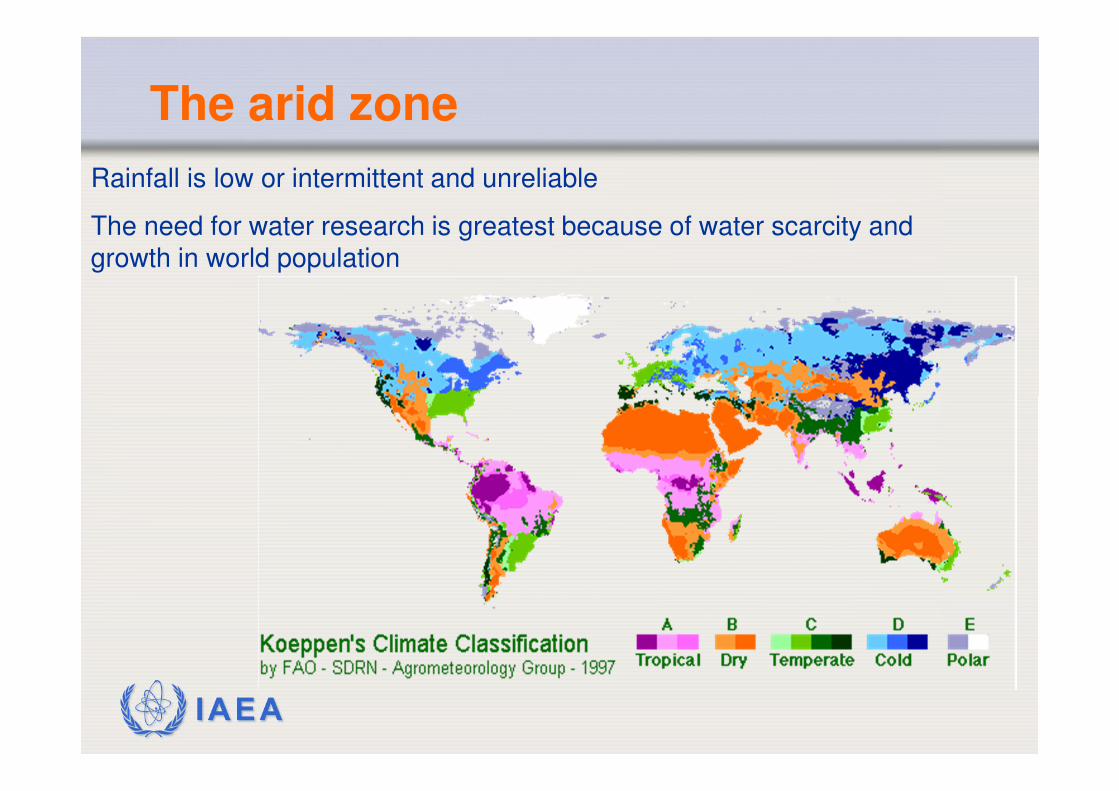
The arid zone
Rainfall is low or intermittent and unreliable
The need for water research is greatest because of water scarcity and growth in world population
IAEA
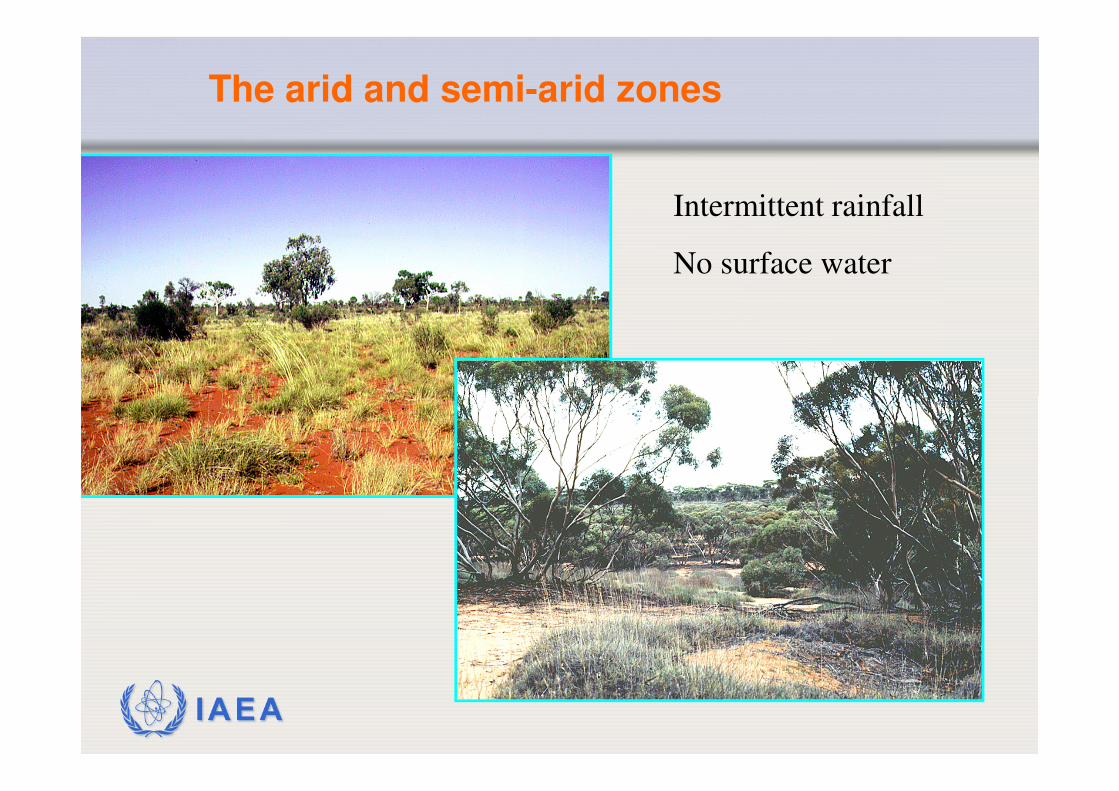
Intermittent rainfall
No surface water
The arid and semi-arid zones
IAEA
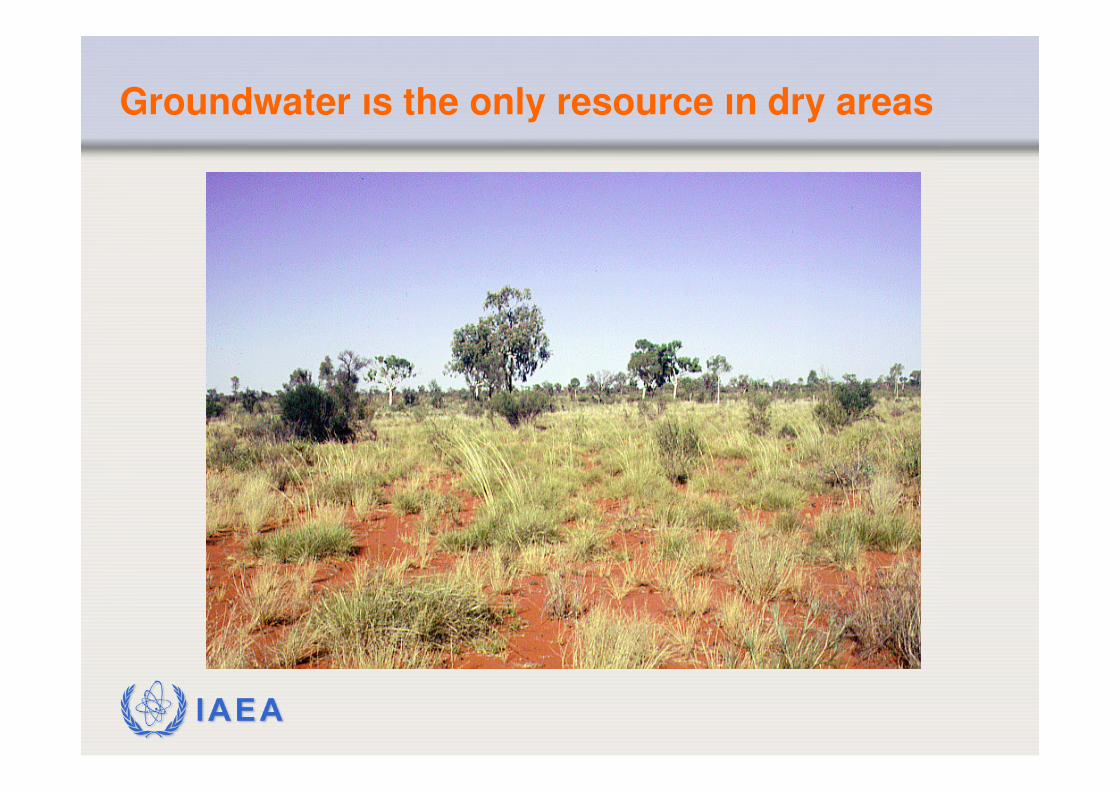
Groundwater ıs the only resource ın dry areas
IAEA
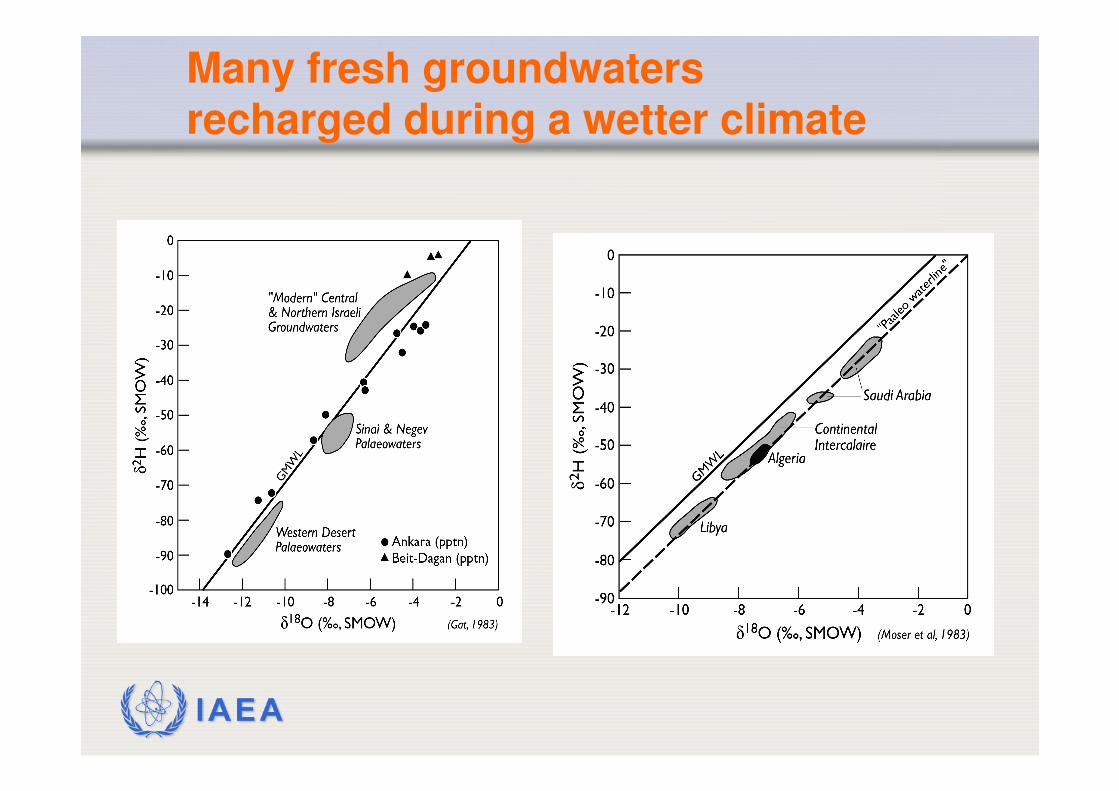
Many fresh groundwaters recharged during a wetter climate
IAEA
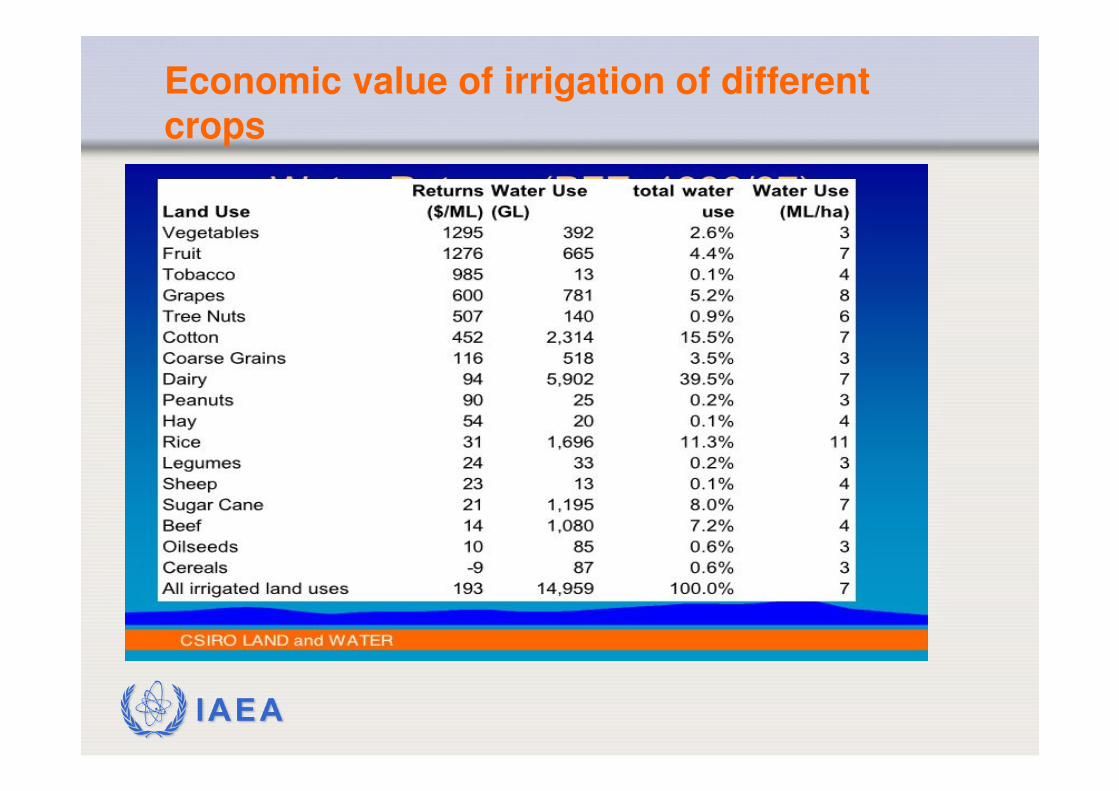
Economic value of irrigation of different crops
IAEA
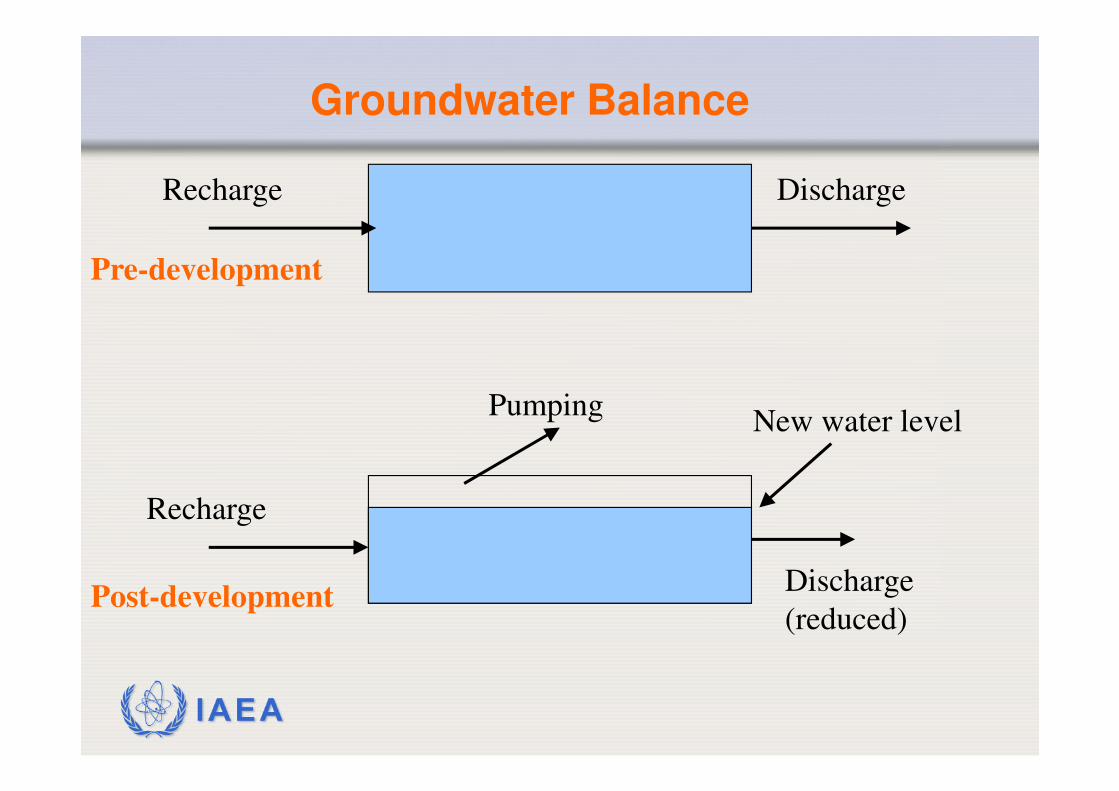
Recharge
Recharge
Discharge
Discharge
(reduced)
Groundwater Balance
PumpingNew water level
Pre-development
Post-development
IAEA
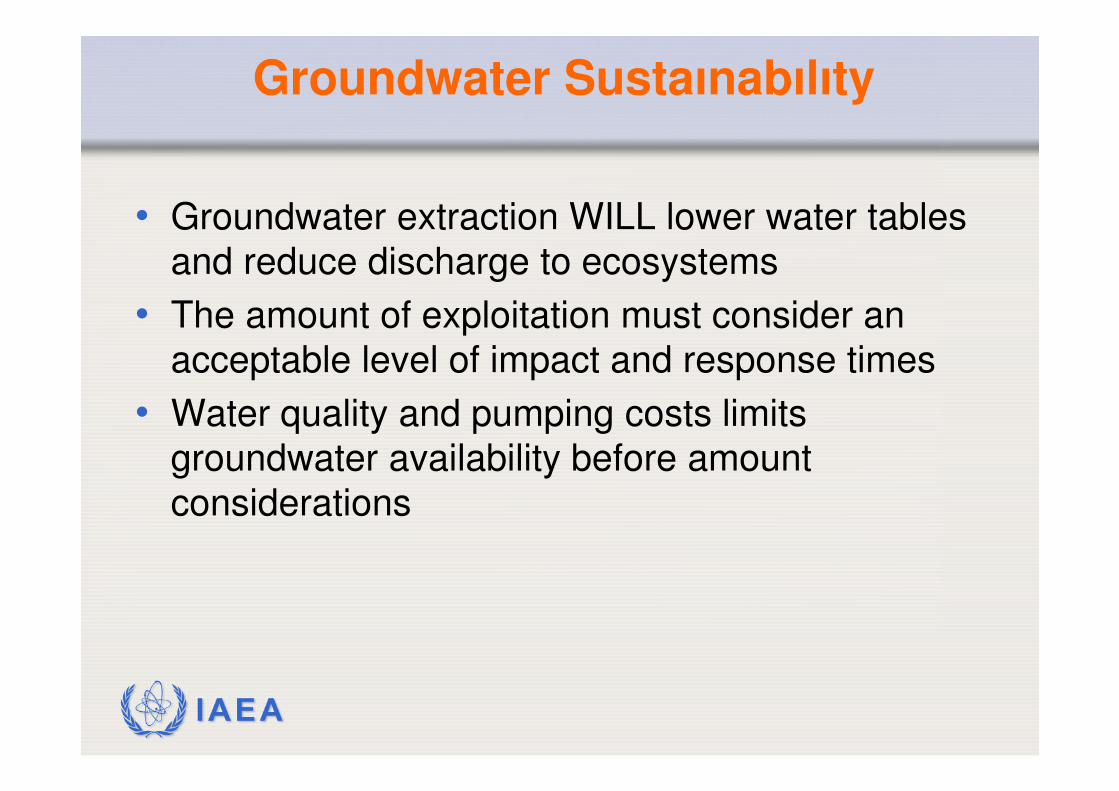
Groundwater Sustaınabılıty
• Groundwater extraction WILL lower water tables
and reduce discharge to ecosystems
• The amount of exploitation must consider an
acceptable level of impact and response times
• Water quality and pumping costs limits
groundwater availability before amount
considerations
IAEA
Why use isotopes to study groundwater?
• Dating groundwater – rates of flow and recharge
• Direct measurement of flow systems
• Fingerprinting sources of pollution
• Reconstructing past history
• Interactions with surface waters
IAEA
1940 1950 1960 1970 1990 2000YEAR
600
400
200
0
T.U
.
1980
200
100
0
10
9a
tom
s m
-2
Cl
H
36
3
C14
250
150
200
pm
c
100
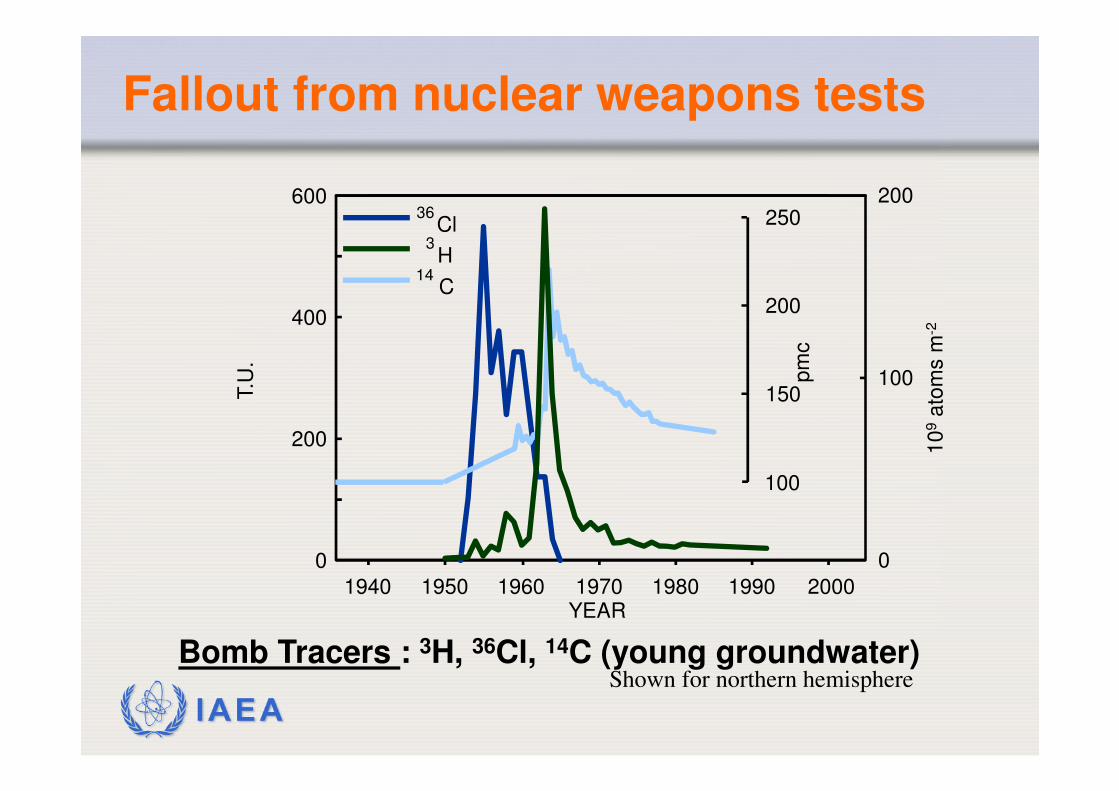
Bomb Tracers : 3H, 36Cl, 14C (young groundwater)Shown for northern hemisphere
Fallout from nuclear weapons tests
IAEA
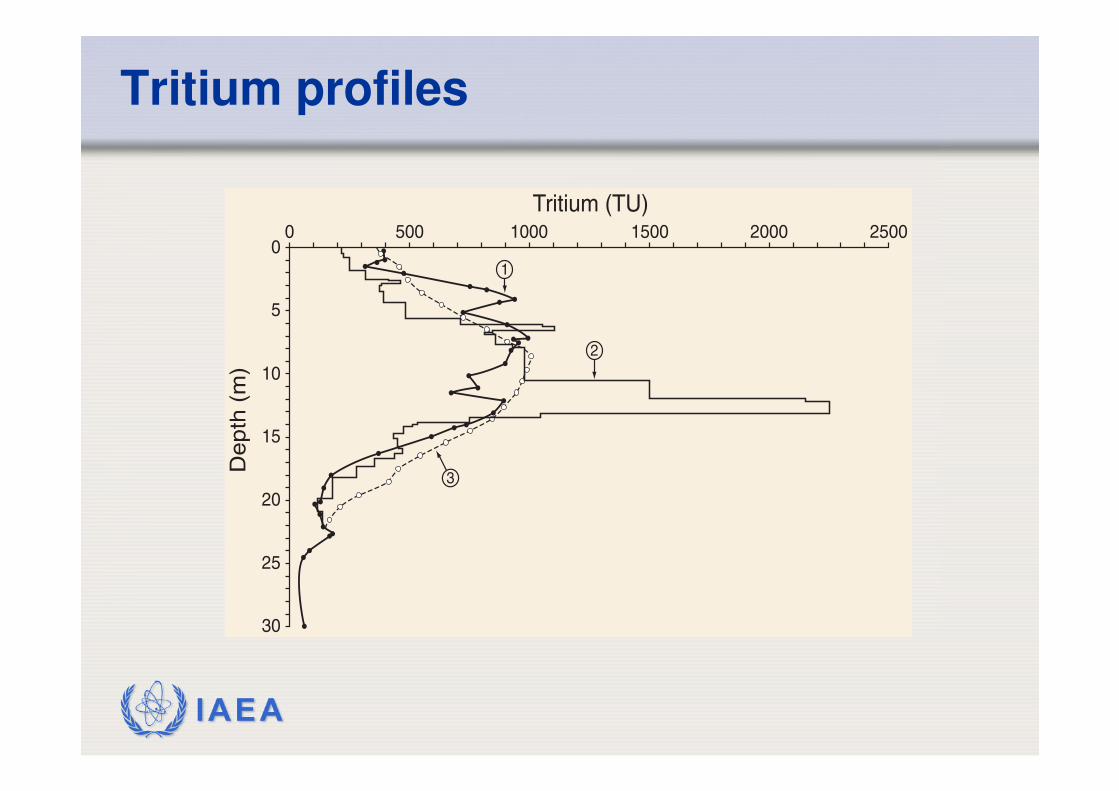
Tritium profiles
00
5
10
15
20
25
30
500 1000 1500 2000 2500
3
2
1
Depth
(m
)
Tritium (TU)
IAEA
0
5
10
15
20
25
30
35
0 5 10 15 20 25 30
shallowdeep
Distance from Danube (km)
3 H/3
He
age
(yea
rs)
(800 m/y)
530 m/y
1
2
3
4
5
6
78
9
17
1013
12
111516
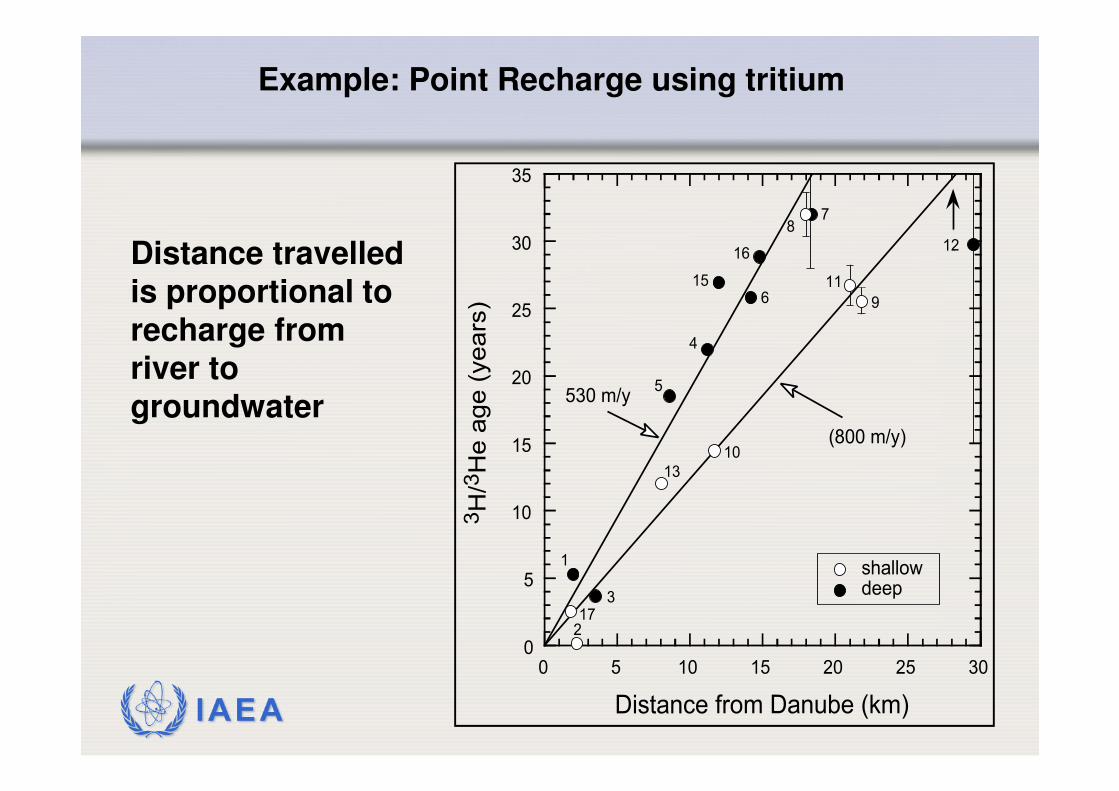
Example: Point Recharge using tritium
Distance travelled is proportional to recharge from river to groundwater
IAEA
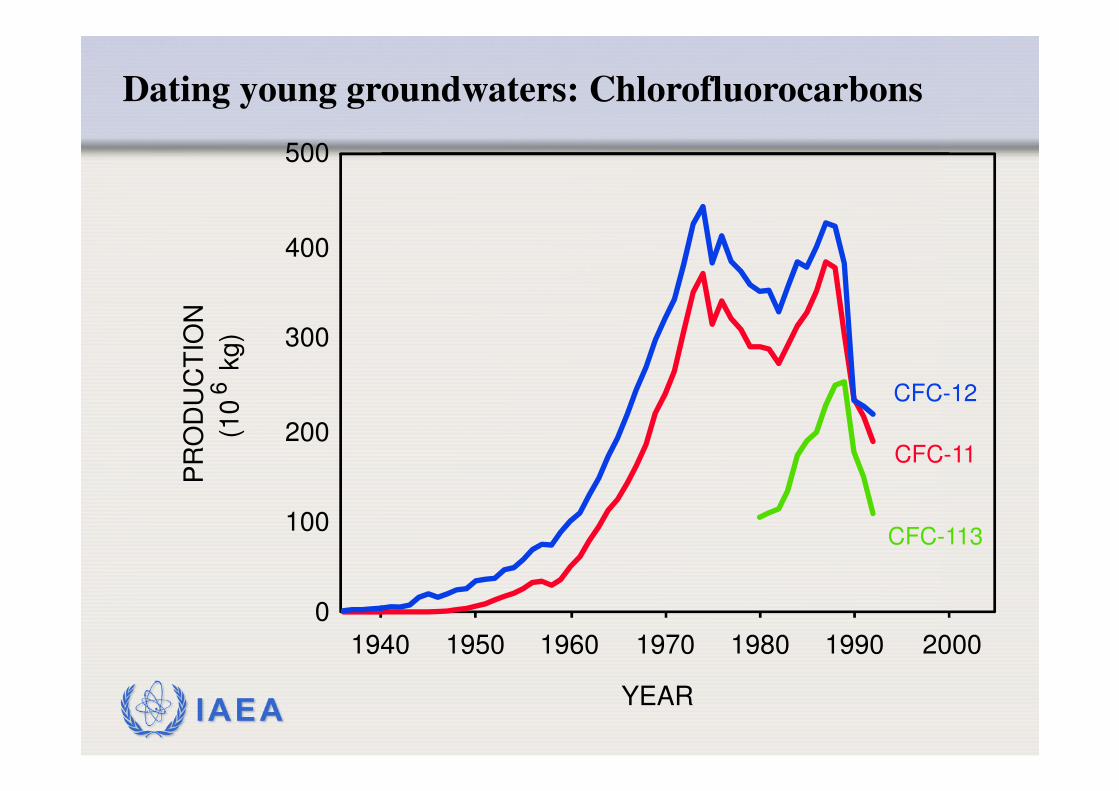
1940 1950 1960 1970 1990 2000
YEAR
500
400
300
200
100
0
CFC-12
CFC-11
(10
kg
)
1980
CFC-113
6P
RO
DU
CT
ION
Dating young groundwaters: Chlorofluorocarbons
IAEA
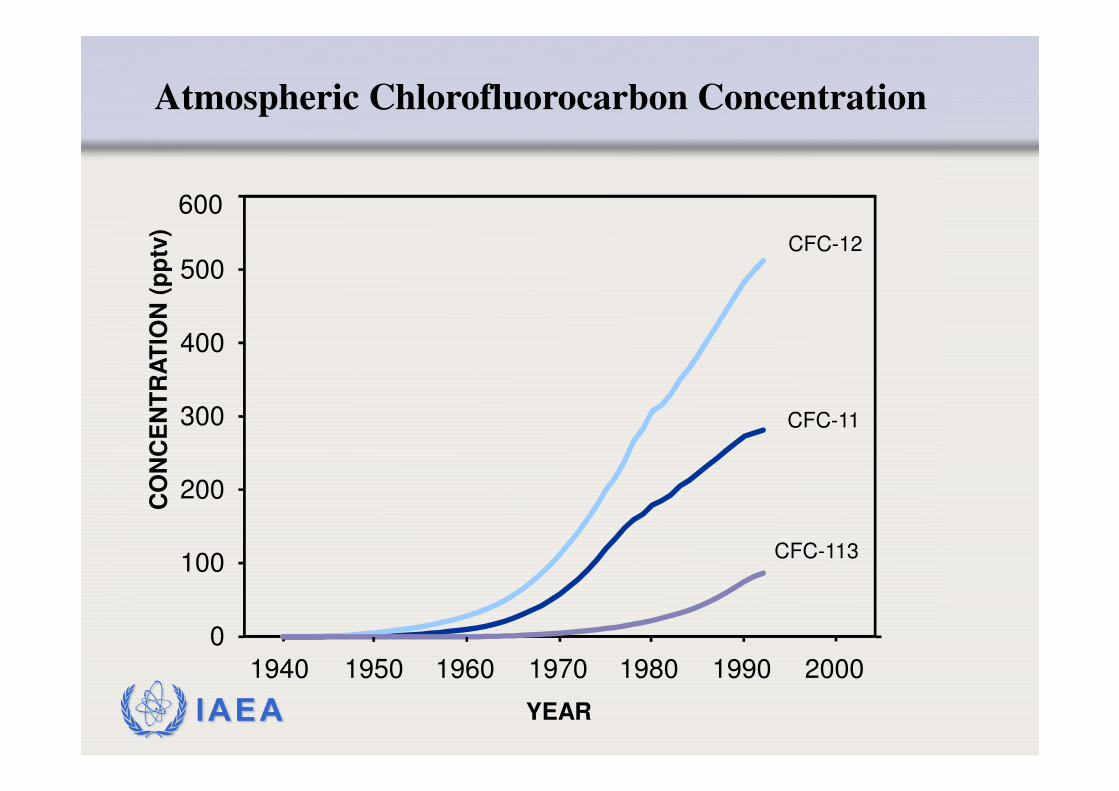
1940 1950 1960 1970 1980 2000
600
500
400
300
200
100
0
CFC-113
CFC-11
CFC-12
CO
NC
EN
TR
AT
ION
(p
ptv
)
1990
YEAR
Atmospheric Chlorofluorocarbon Concentration
IAEA
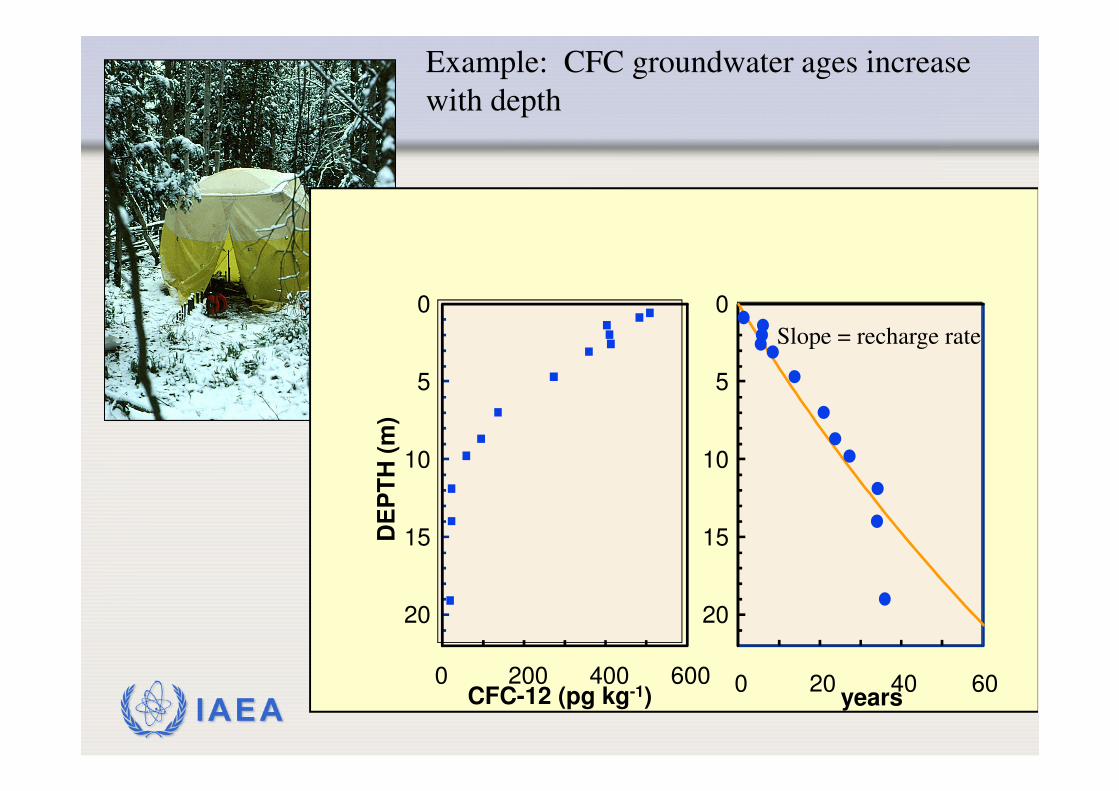
0
5
10
15
20
DE
PT
H (
m)
0 20 40 60CFC-12 (pg kg-1)
0 200 400 600years
0
5
10
15
20
Example: CFC groundwater ages increase
with depth
Slope = recharge rate
IAEA
Isotopes in the arid zone
• Environmental tracers have produced their most useful results in the arid zone
• Isotopes often provide unique information in such regions – recharge rates, flow rates

IAEA
Many fresh groundwaters recharged during a wetter climate
IAEA
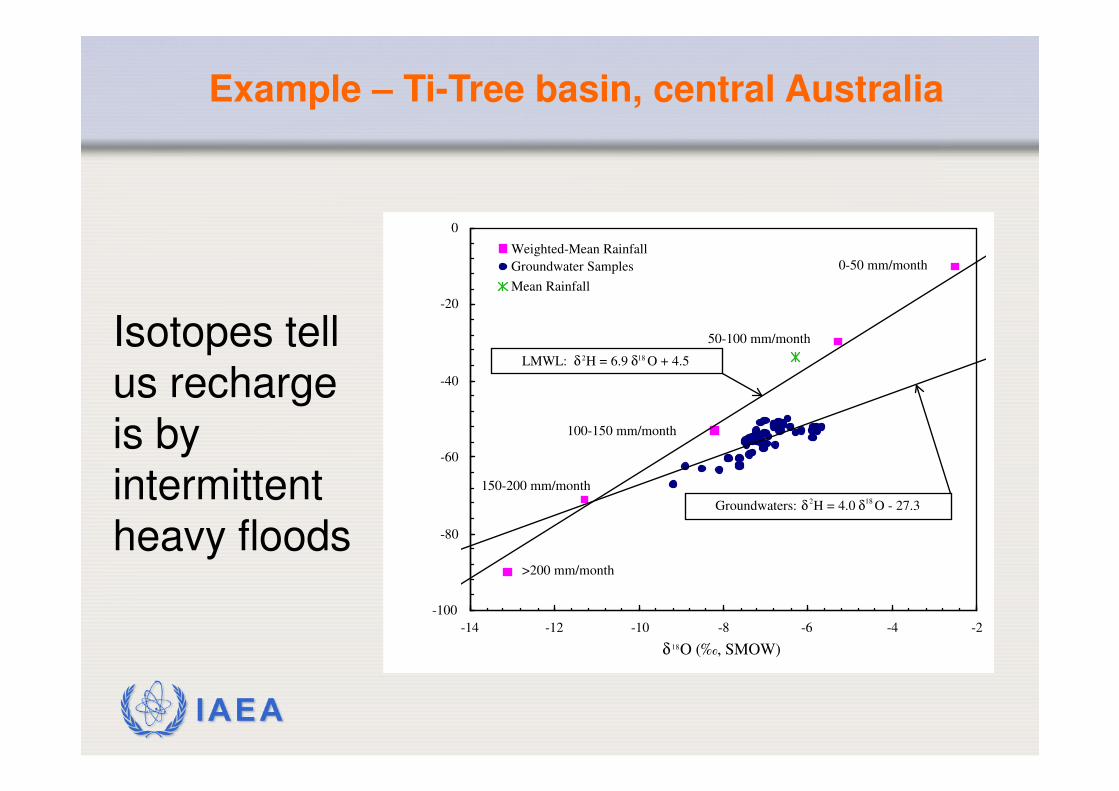
Isotopes tell us recharge is by intermittent heavy floods
-100
-80
-60
-40
-20
0
-14 -12 -10 -8 -6 -4 -2
δ 18O (‰, SMOW)
Weighted-Mean Rainfall
Groundwater Samples
Mean Rainfall
0-50 mm/month
>200 mm/month
150-200 mm/month
100-150 mm/month
50-100 mm/month
LMWL: δ 2H = 6.9 δ18 O + 4.5
Groundwaters: δ2H = 4.0 δ
18O - 27.3
Example – Ti-Tree basin, central Australia
IAEA
Groundwater dating
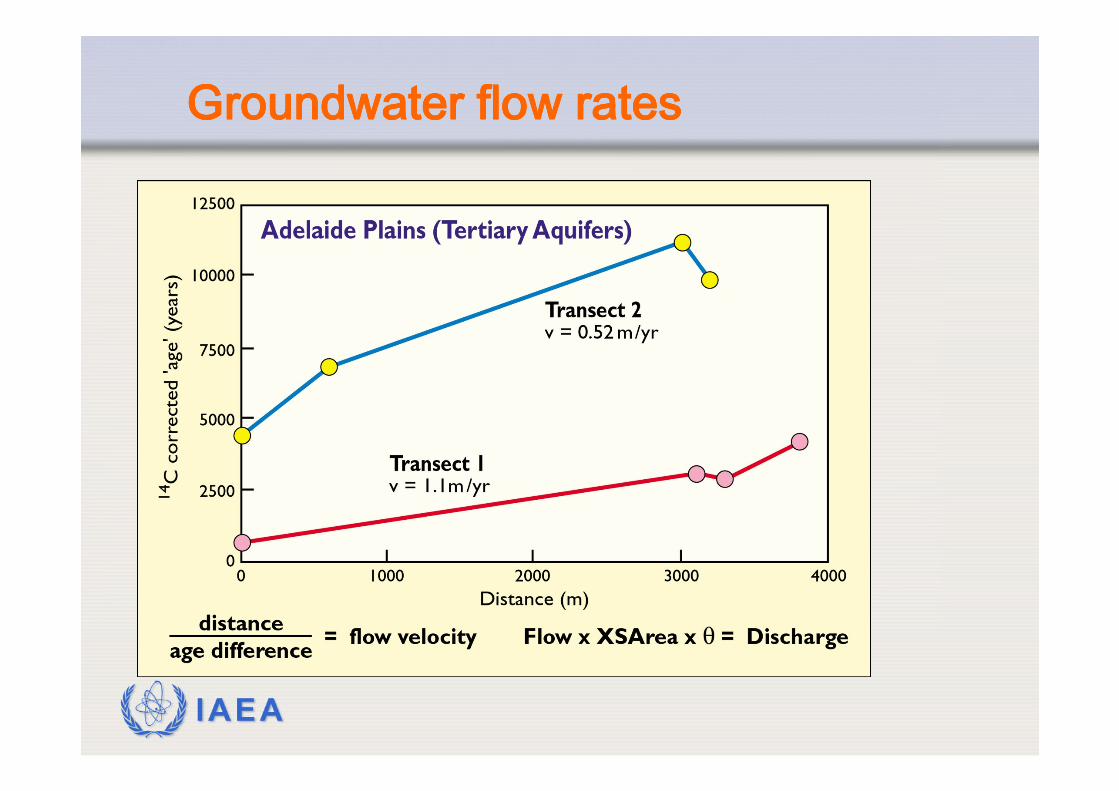
• Horizontal flow rates
• Estimation of groundwater discharge
• Renewable or non-renewable?
IAEA
IAEA
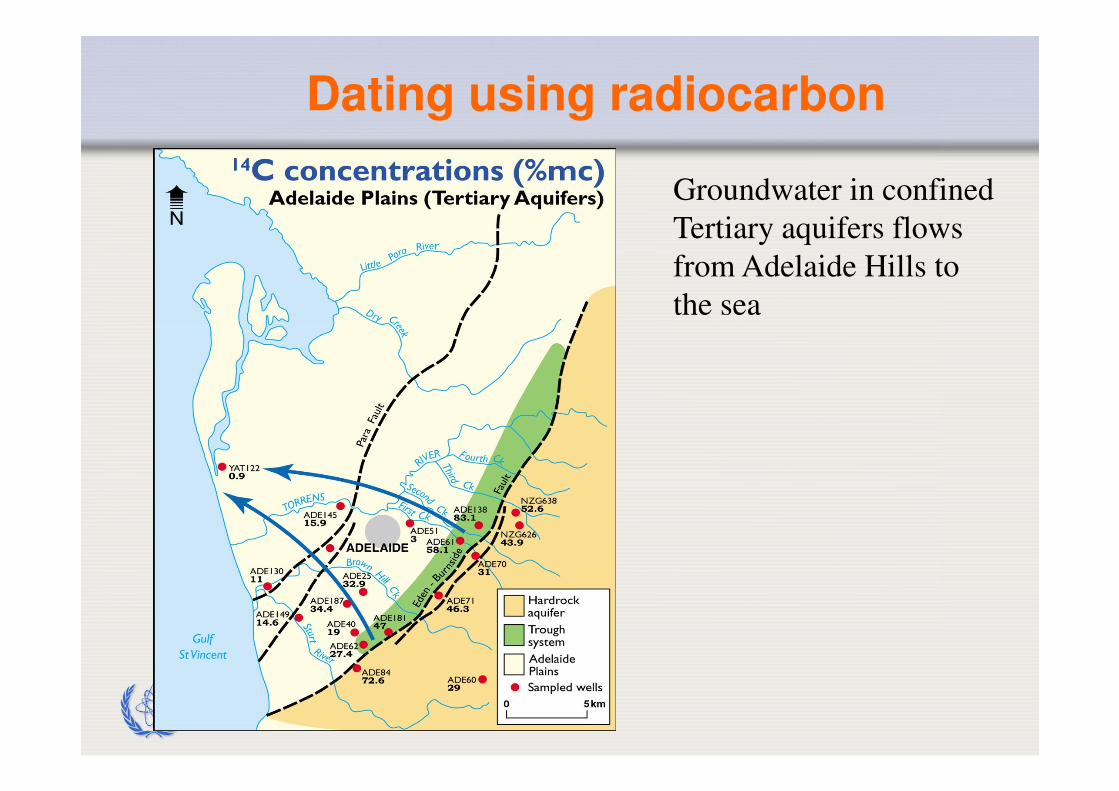
Groundwater in confined
Tertiary aquifers flows
from Adelaide Hills to
the sea
Dating using radiocarbon
IAEA
Groundwater flow ratesGroundwater flow ratesGroundwater flow ratesGroundwater flow rates
IAEA
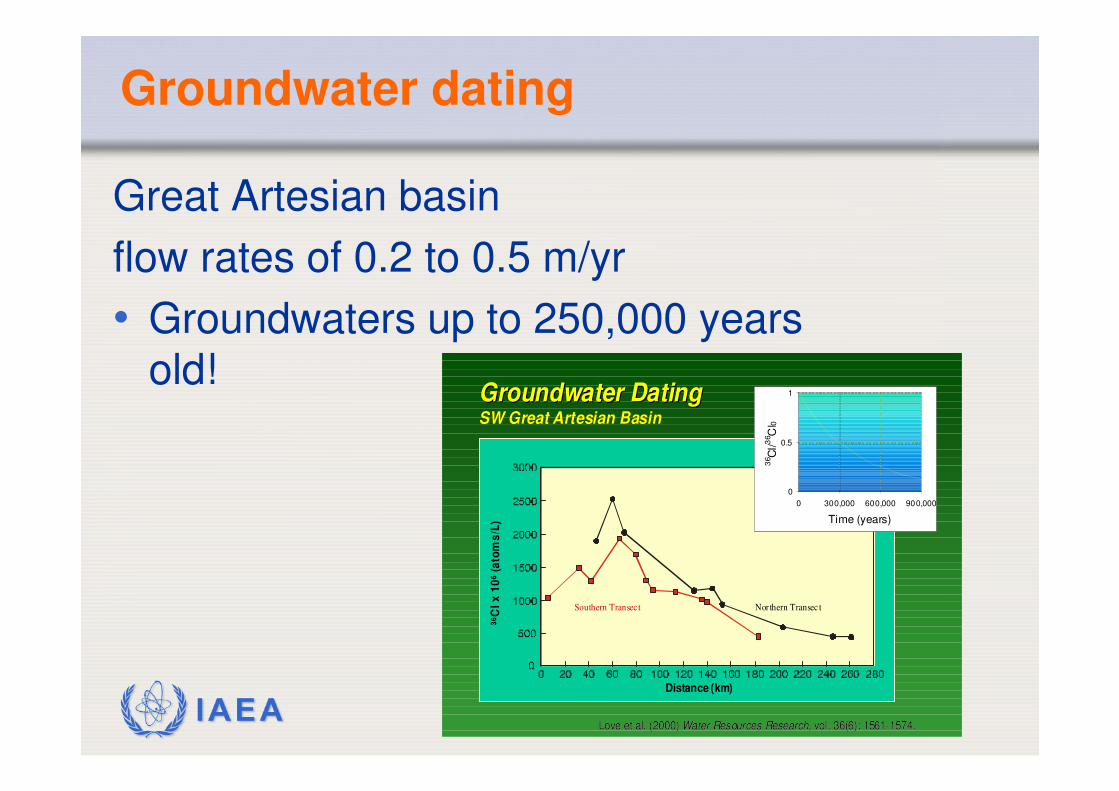
Groundwater dating
Great Artesian basin
flow rates of 0.2 to 0.5 m/yr
• Groundwaters up to 250,000 years old!
Groundwater DatingGroundwater DatingSW Great Artesian BasinSW Great Artesian Basin
Love et al. (2000) Love et al. (2000) Water Resources ResearchWater Resources Research, vol. 36(6): 1561-1574., vol. 36(6): 1561-1574.
Northern Transec tSouthern Transect
Distance (km)
36C
l x
10
6 (
ato
ms
/L)
0
0.5
1
0 300,000 600,000 900,000
Time (years)
36 C
l/3
6 Cl 0
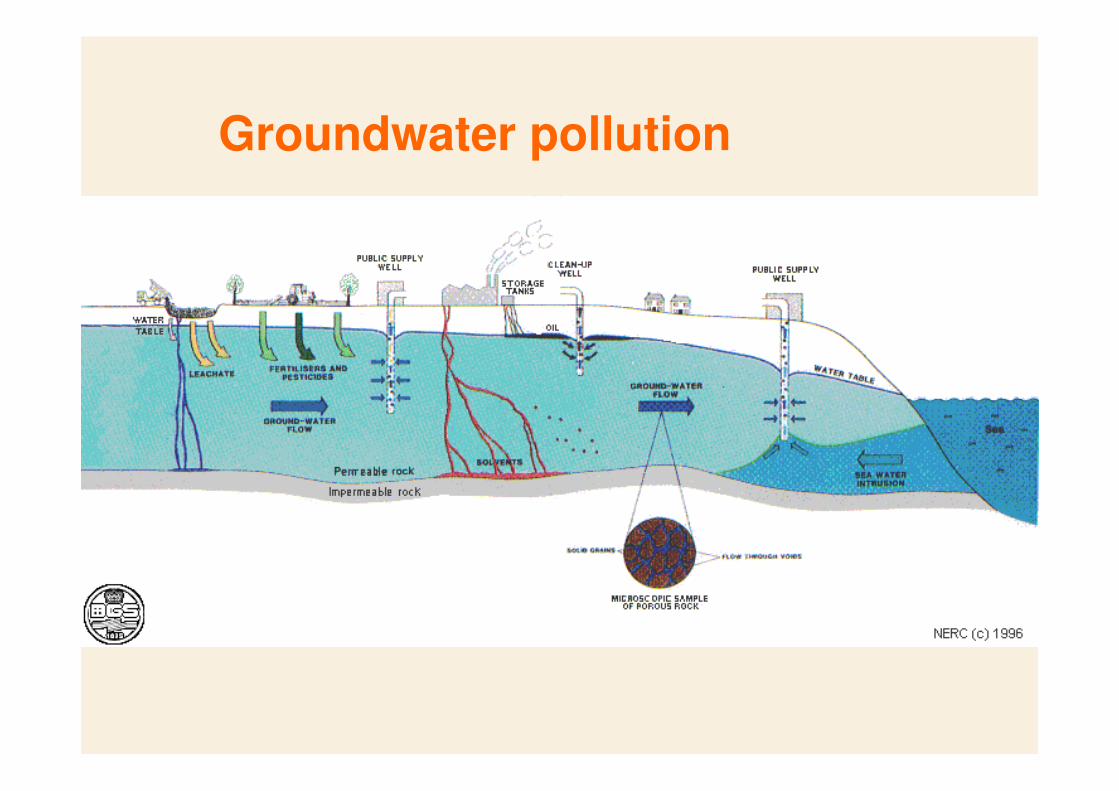
Sources of groundwater pollution
Groundwater pollution
IAEA
1940 1950 1960 1970 1980 19900
500
1000
1500
2000
NO
3-
co
nce
ntr
atio
n (
µm
ol L
-1)
0
1000
2000
3000
4000
5000
NO
3-
flu
x (
mo
l h
a-1
yr-
1)
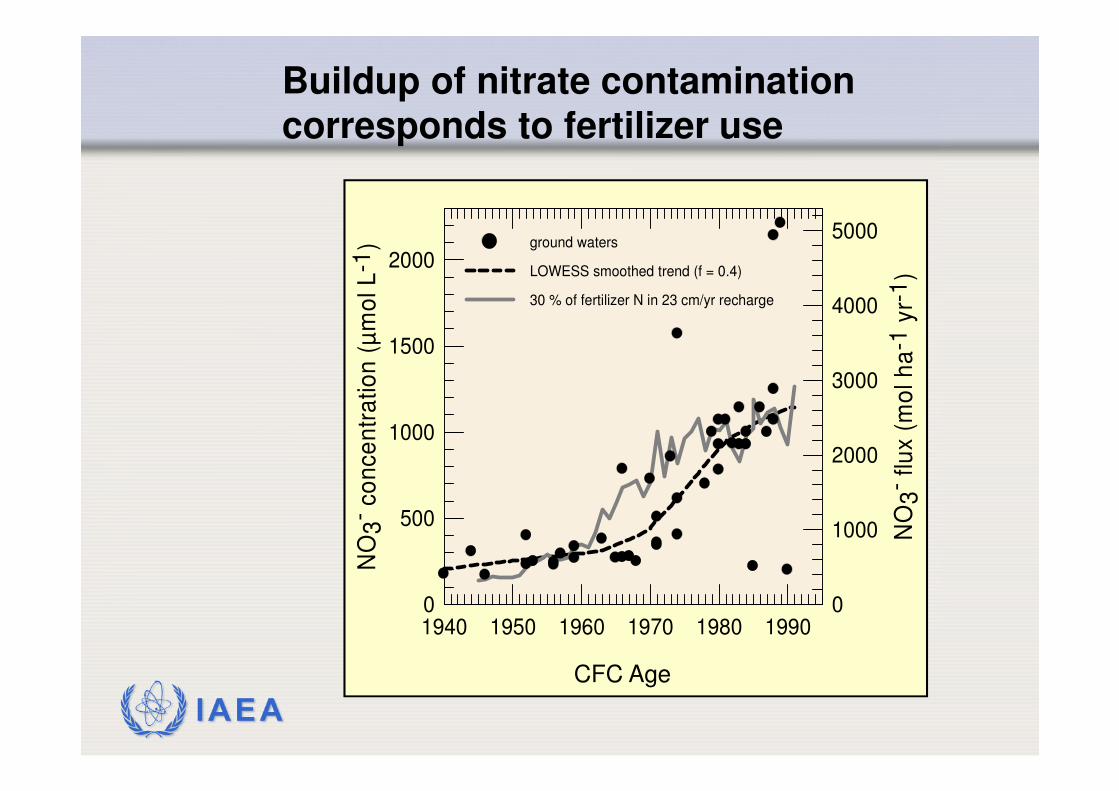
ground waters
LOWESS smoothed trend (f = 0.4)
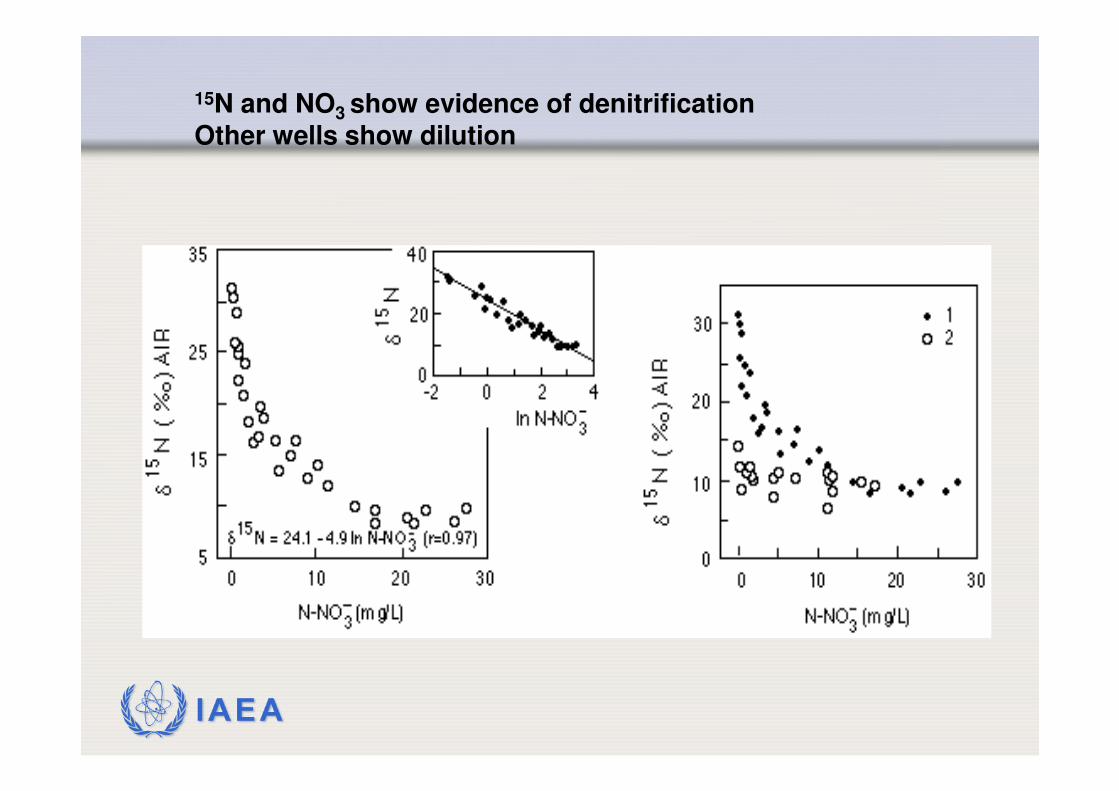
30 % of fertilizer N in 23 cm/yr recharge
CFC Age
Buildup of nitrate contamination corresponds to fertilizer use
IAEA
15N and NO3 show evidence of denitrificationOther wells show dilution
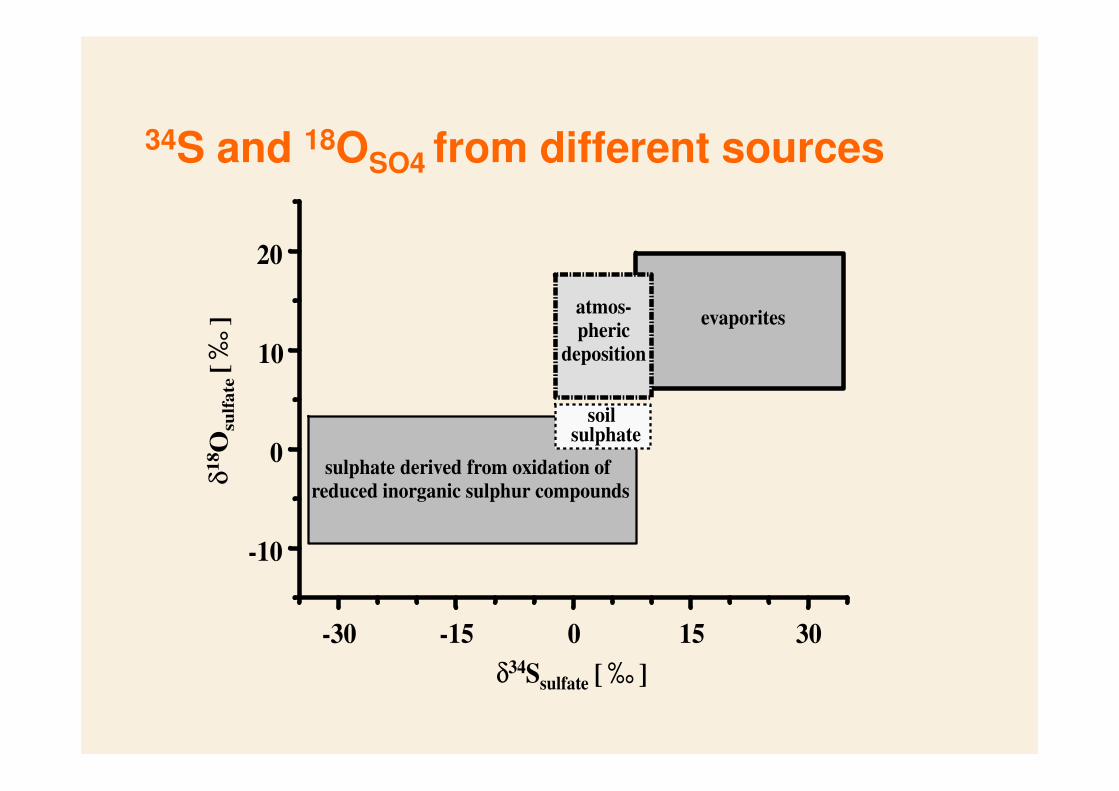
34S and 18OSO4 from different sources
-10
0
10
20
δ1
8O
sulf
ate
-30 -15 0 15 30
δ34Ssulfate
evaporitesatmos-
pheric
deposition
soilsulphate
sulphate derived from oxidation of
reduced inorganic sulphur compounds
[‰
]
[ ‰ ]
IAEA
Recent anthropogenic change
• History of land-use impacts on water balance
• Are systems becoming increasingly eutrophic?
IAEA
0 200m
1B
7570
4020
2 3
Pump offtake
0
60 ������������yyyyyyyyyyyy����yyyy �y��������������� ��������������������������������������������������������������� ������������120
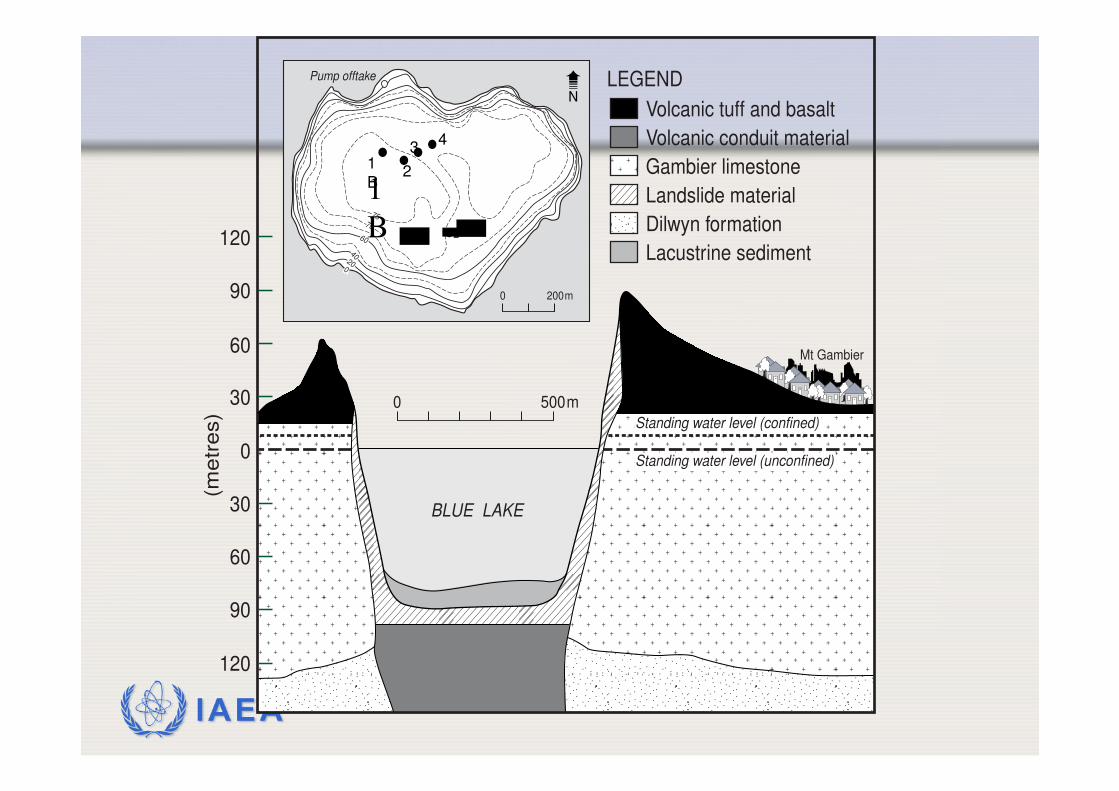
Volcanic tuff and basalt
LEGEND
90
60
30
(me
tre
s)
0
30
60
90
120
Volcanic conduit material
Gambier limestone
Landslide material
Dilwyn formation
Mt Gambier
Lacustrine sediment
0 500m
BLUE LAKE
Standing water level (unconfined)
Standing water level (confined)
1
B
1B
2
34
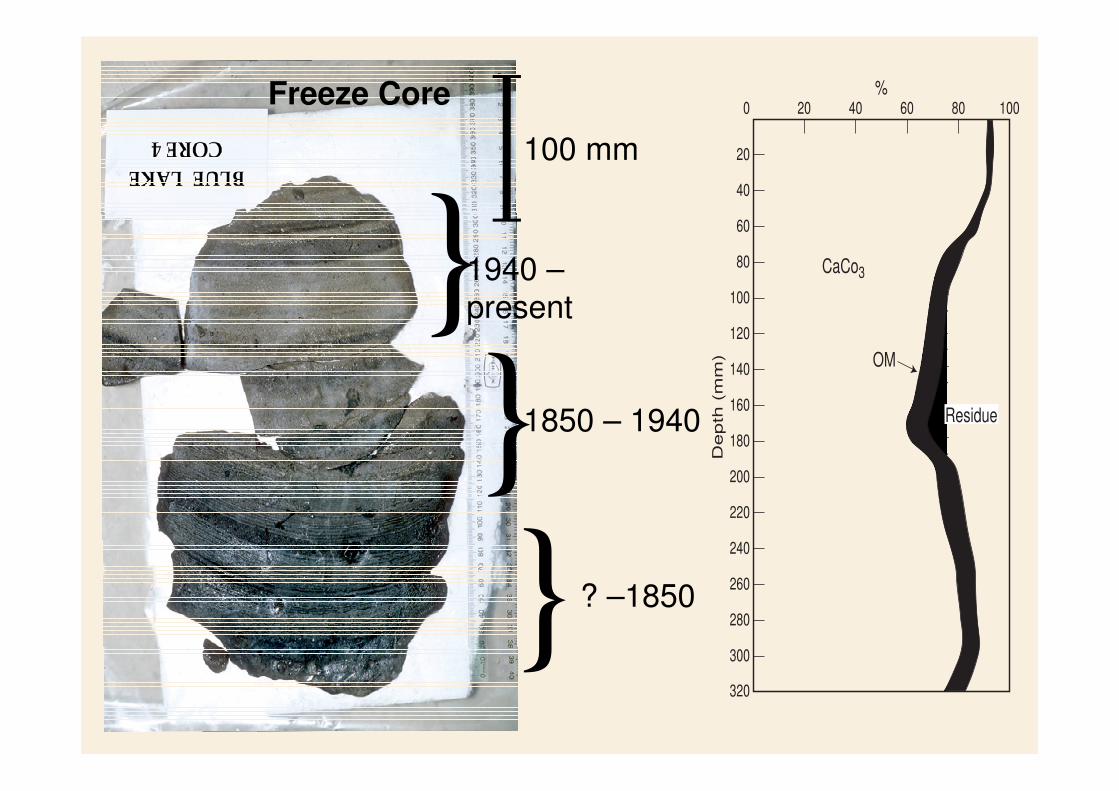
1940 –present
100 mm
}1850 – 1940
? –1850
}}
Freeze Core
���������������������������yyyyyyyyyyyyyyyyyyyyyyyyyyy20 40
%
CaCo3
OM
Depth
(m
m)
60 80 1000
20
40
60
80
100
120
140
160
180
200
220
240
260
280
300
320
Residue
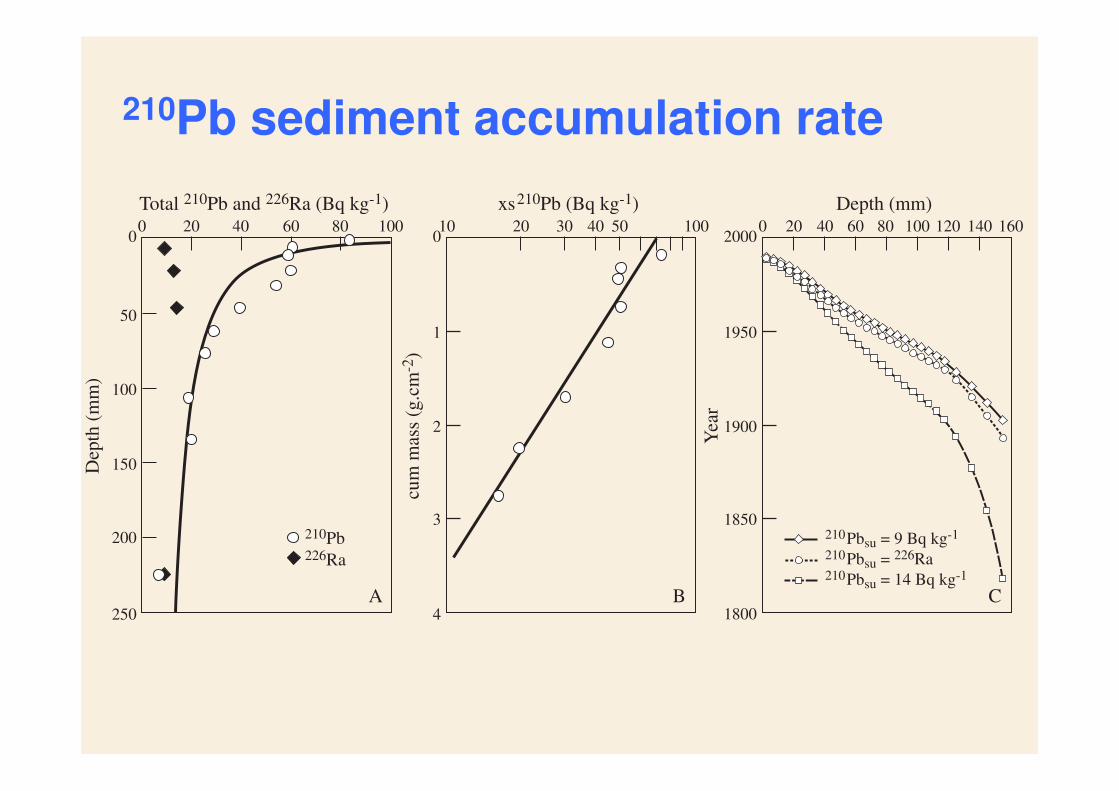
210Pb sediment accumulation rate
20 40 600
Total 210Pb and 226Ra (Bq kg-1)
210Pb 226Ra
A B
Dep
th (
mm
)
80 1000
150
100
50
200
250
cum
mas
s (g
.cm
-2)
0
3
2
1
4
20 30 4010
xs210Pb (Bq kg-1)
210Pbsu = 9 Bq kg-1
50 100
C
Yea
r
2000
1850
1800
1900
1950
20 40 60 80 100 120 140 1600
Depth (mm)
210Pbsu = 226Ra210Pbsu = 14 Bq kg-1
1800
1820
1840
1860
1880
1900
1920
1940
1960
1980
2000Y
ear
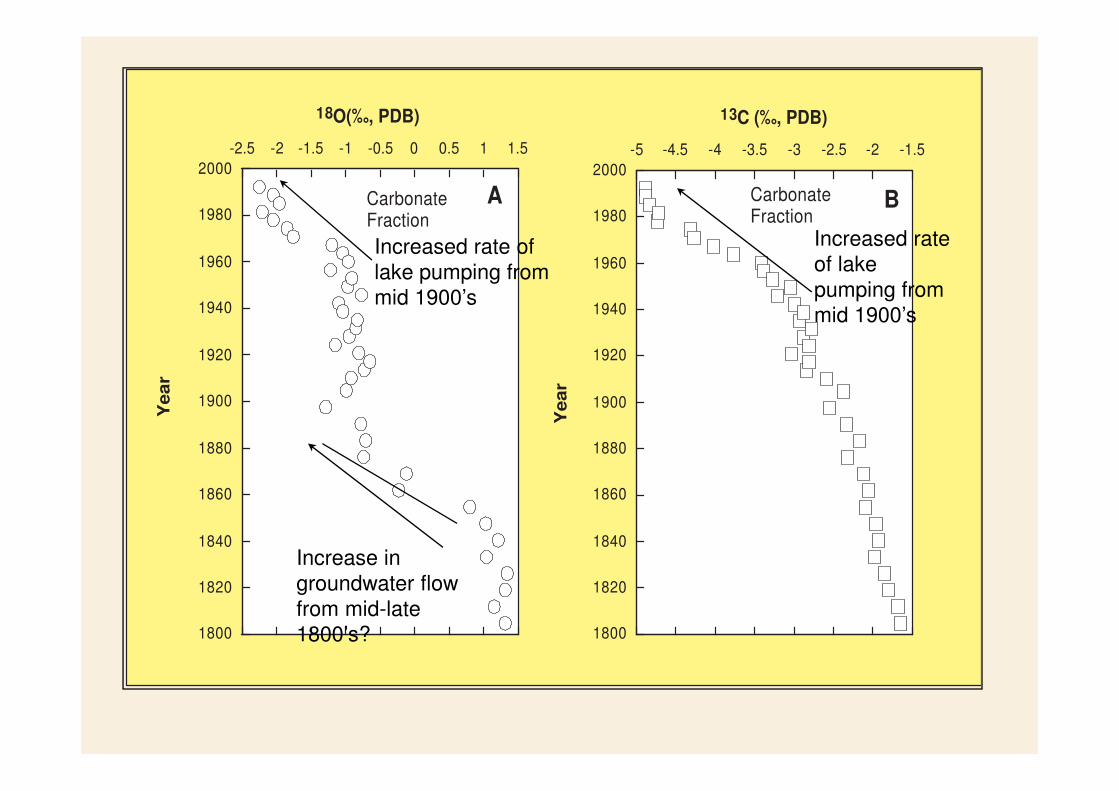
-2.5 -2 -1.5 -1 -0.5 0 0.5 1 1.5
d 18O(‰, PDB)
Carbonate
Fraction
1800
1820
1840
1860
1880
1900
1920
1940
1960
1980
2000
Year
-5 -4.5 -4 -3.5 -3 -2.5 -2 -1.5
d 13C (‰, PDB)
Carbonate
Fraction
A B
Increase in
groundwater flow
from mid-late 1800’s?
Increased rate of
lake pumping from mid 1900’s
Increased rate
of lake
pumping from mid 1900’s
IAEA
Isotope applications in eco-hydrology
• Surface water – groundwater interactions
• Water sources for vegetation
IAEA
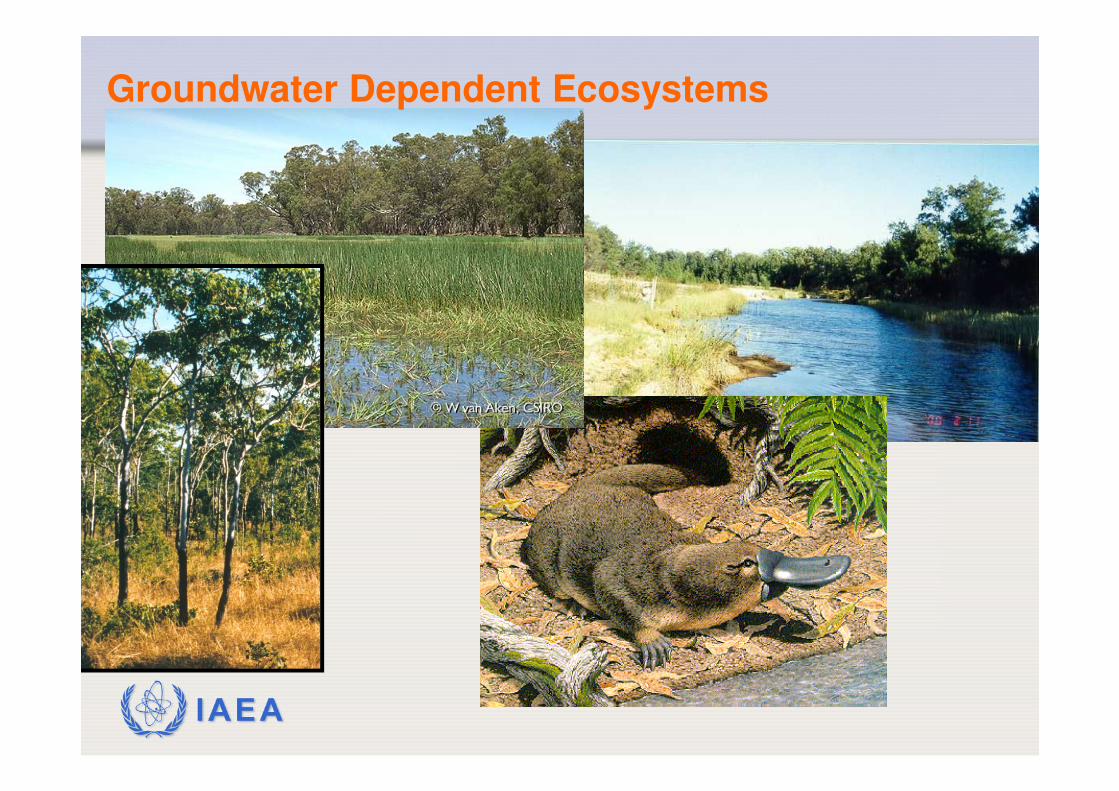
Groundwater Dependent Ecosystems
IAEA
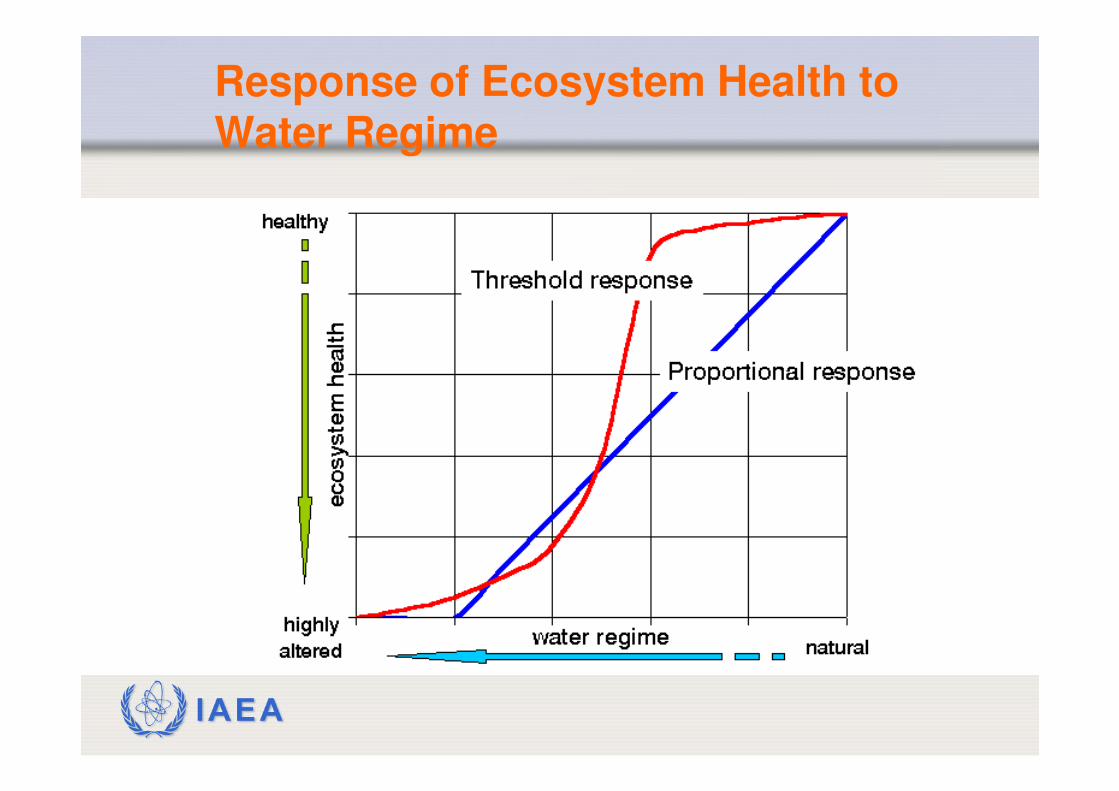
Response of Ecosystem Health to Water Regime
IAEA
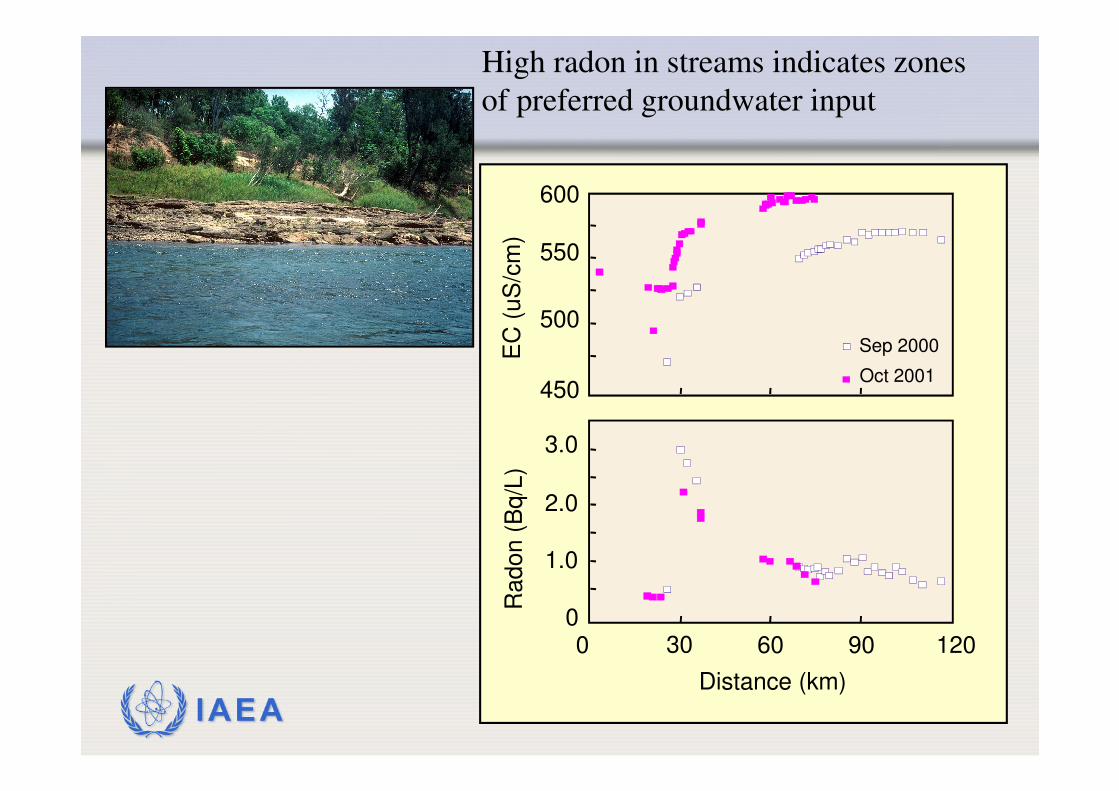
Sep 2000
Oct 2001
120
3.0
600
Radon (
Bq/L
)
550
500
450
2.0
1.0
0
EC
(uS
/cm
)
60 90300
Distance (km)
High radon in streams indicates zones
of preferred groundwater input
1000
500
1500
2000
2500
222
Rn
(m
Bq
/L)
Metres upstream of gauging station
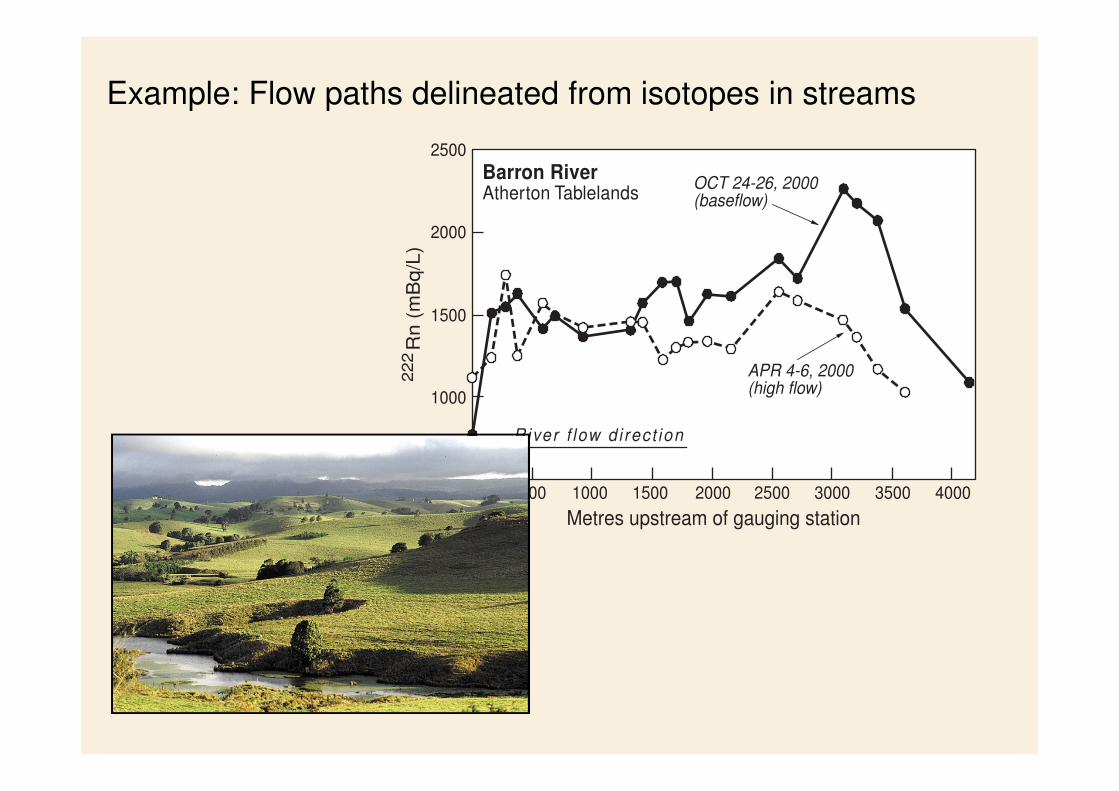
OCT 24-26, 2000 (baseflow)
APR 4-6, 2000 (high flow)
Barron River Atherton Tablelands
River f low d i rect ion
0 500 1000 1500 2000 2500 3000 3500 4000
Example: Flow paths delineated from isotopes in streams
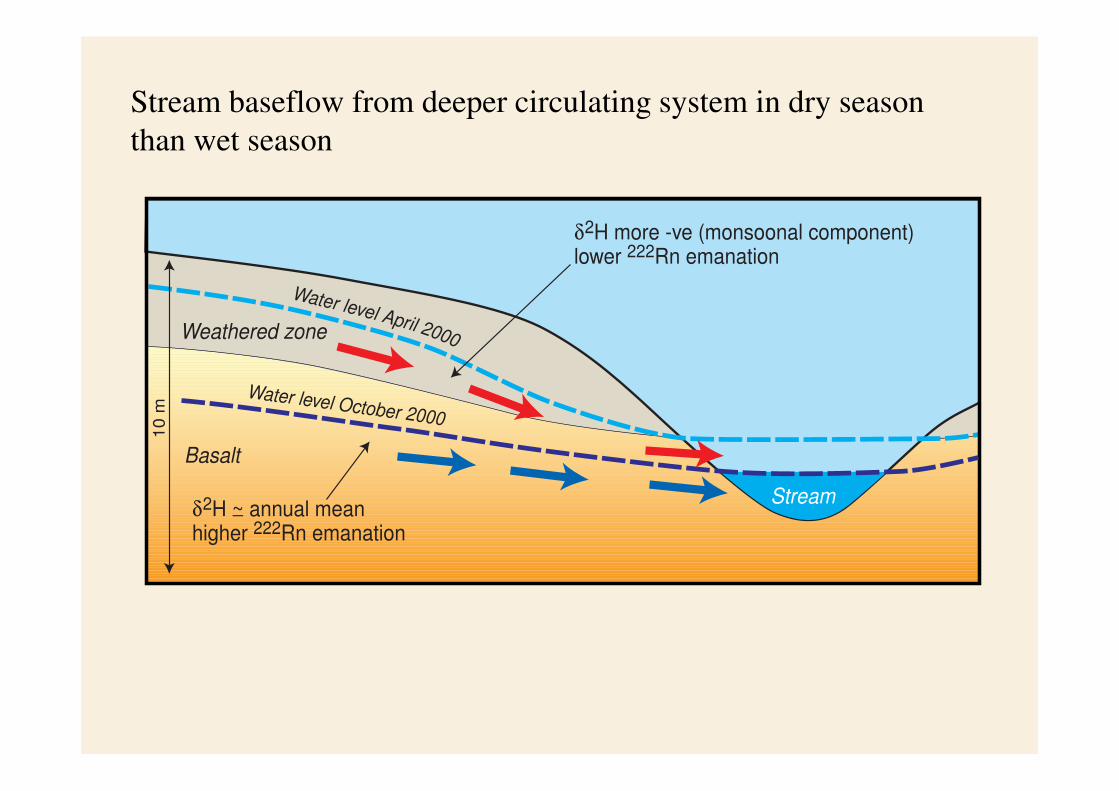
Water level April 2000
Water level October 2000
δ2H more -ve (monsoonal component) lower 222Rn emanation
Basalt
Weathered zone
δ2H ~ annual mean higher 222Rn emanation
−
10
m
Stream
Stream baseflow from deeper circulating system in dry season
than wet season
IAEA
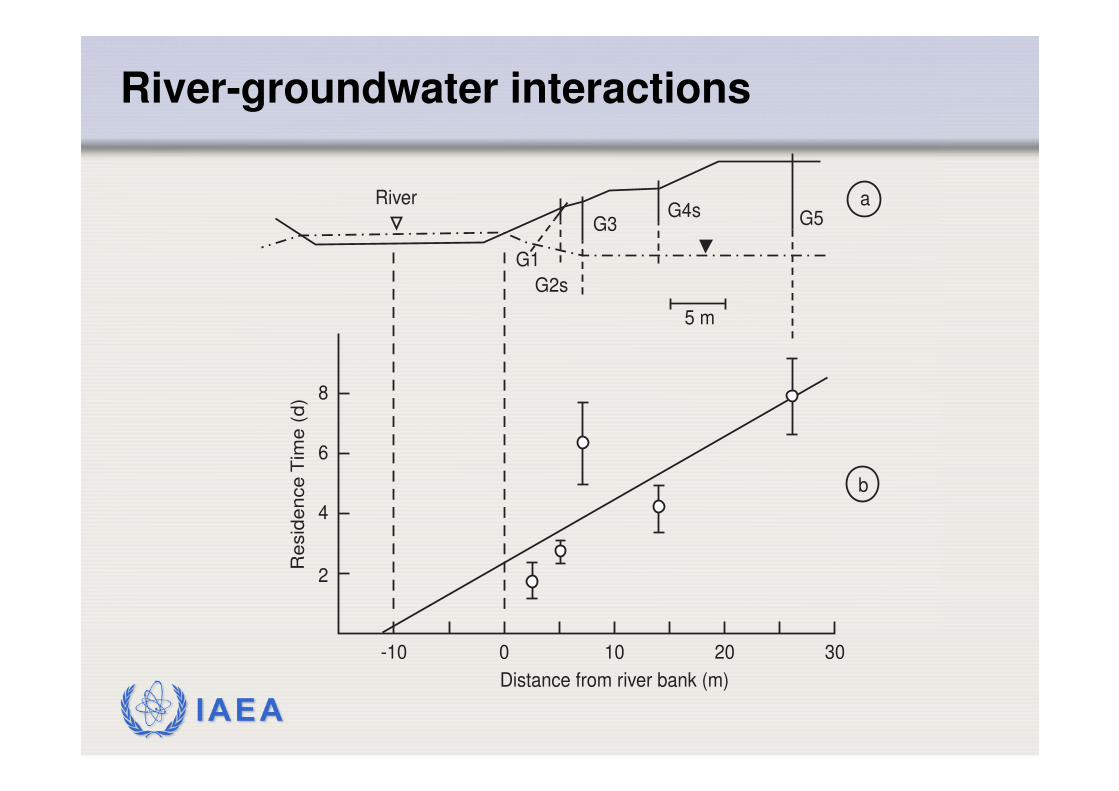
River-groundwater interactions
River
G1
G2s
G3G4s
5 m
aG5
b
8
6
4
2
-10 0 10
Distance from river bank (m)
Resid
ence T
ime (
d)
20 30

IAEA
Superficial aquifer
Banksia
Water table
Do trees use soil water or groundwater?
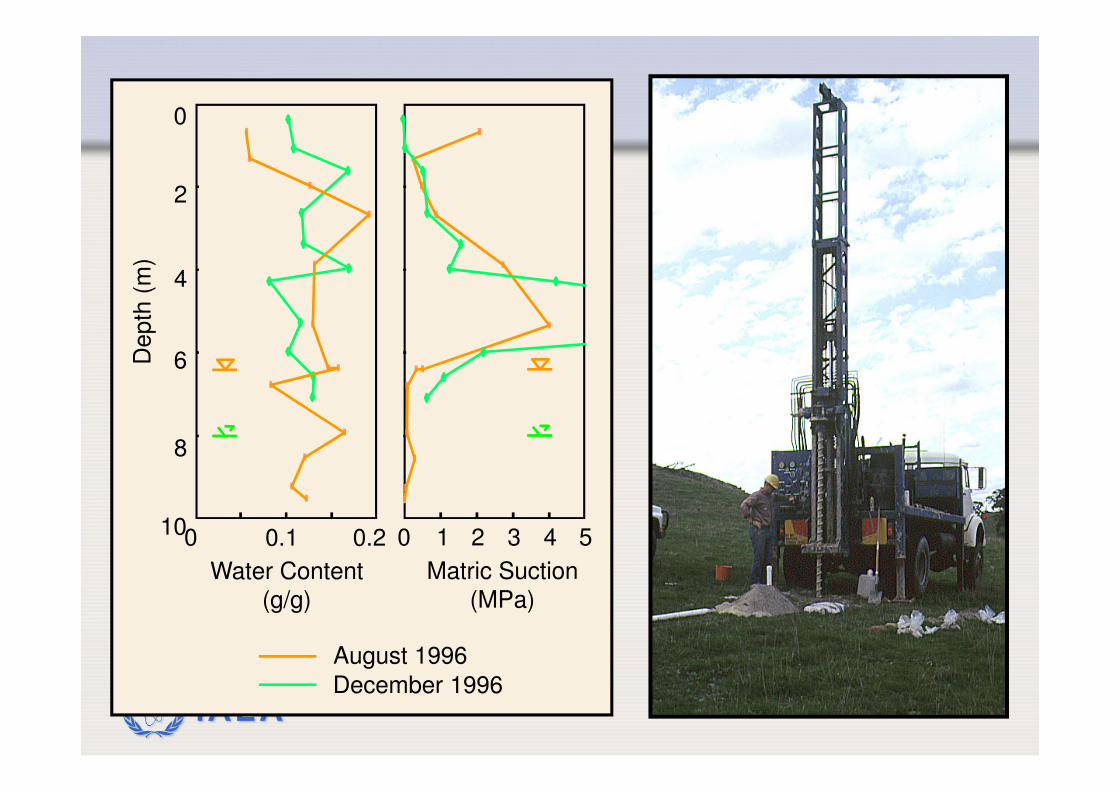
IAEA
0 0.1 0.210
8
6
4
2
0
1 2 3 4 50
Depth
(m
)
Water Content (g/g)
Matric Suction (MPa)
August 1996
December 1996
IAEA
DE
PT
H
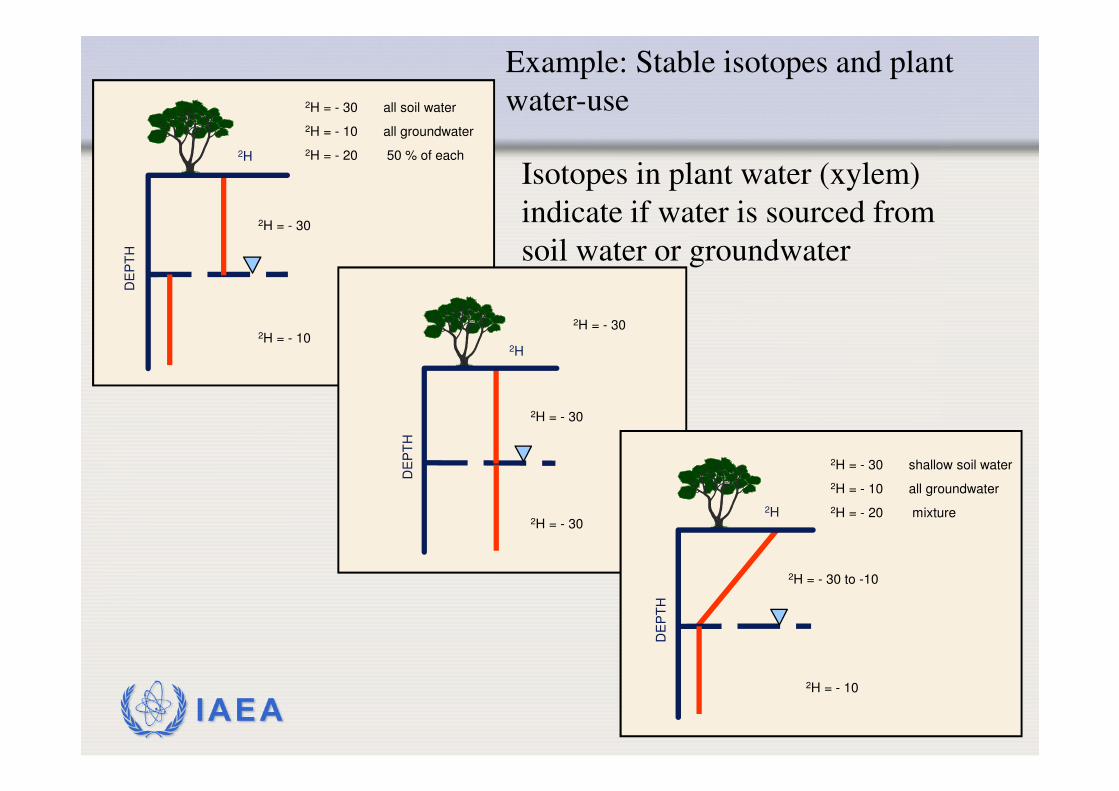
2H
2H = - 30 all soil water
2H = - 10 all groundwater
2H = - 20 50 % of each
2H = - 10
2H = - 30
DE
PT
H
2H
2H = - 30 shallow soil water
2H = - 10 all groundwater
2H = - 20 mixture
2H = - 10
2H = - 30 to -10
DE
PT
H
2H
2H = - 30
2H = - 30
2H = - 30
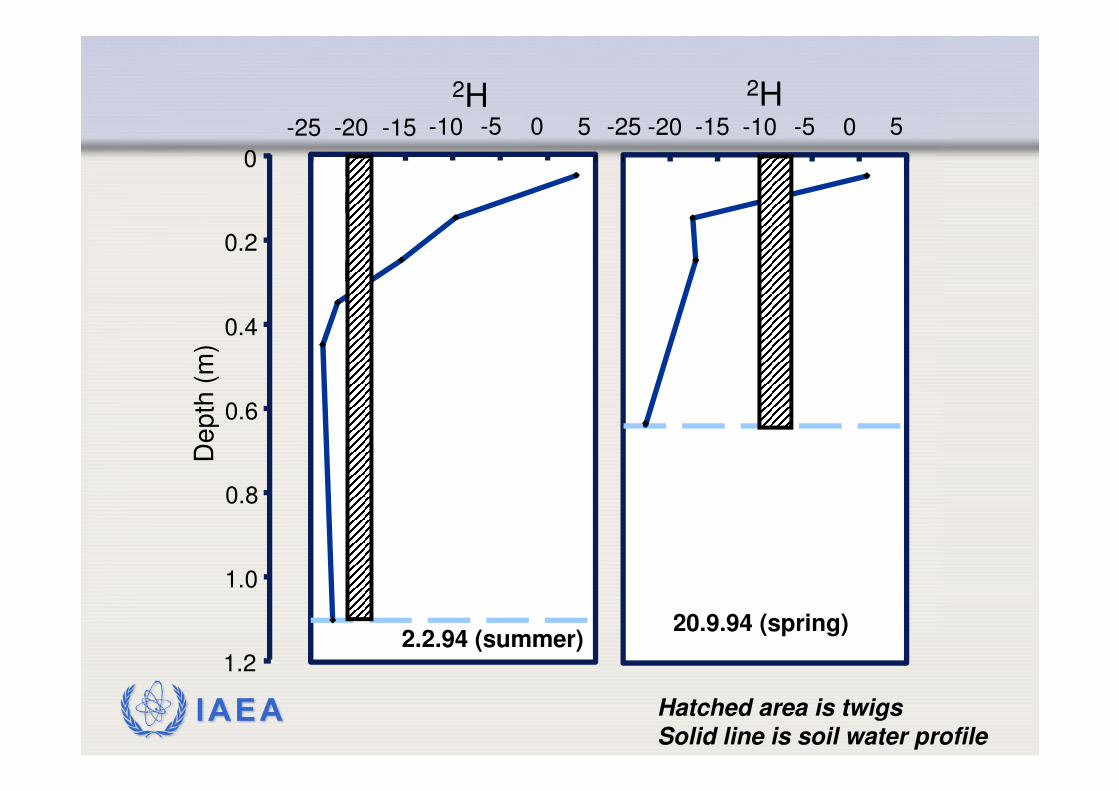
Example: Stable isotopes and plant
water-use
Isotopes in plant water (xylem)
indicate if water is sourced from
soil water or groundwater
IAEA
-25 -20 -15 -10 -5 0 5-25 -20 -15 -10 -5 0 5
20.9.94 (spring)2.2.94 (summer)
0
0.2
0.4
0.6
0.8
1.0
1.2
De
pth
(m
)
2H 2H
Hatched area is twigs
Solid line is soil water profile
IAEA
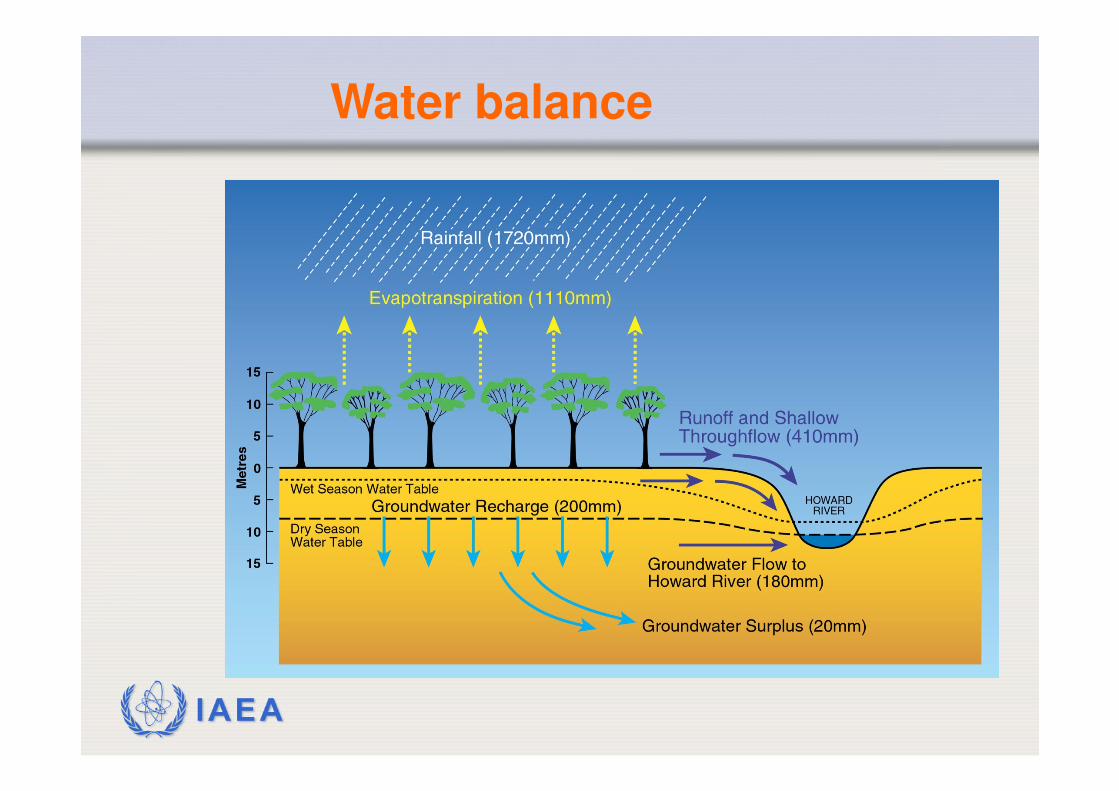
Water balance
IAEA
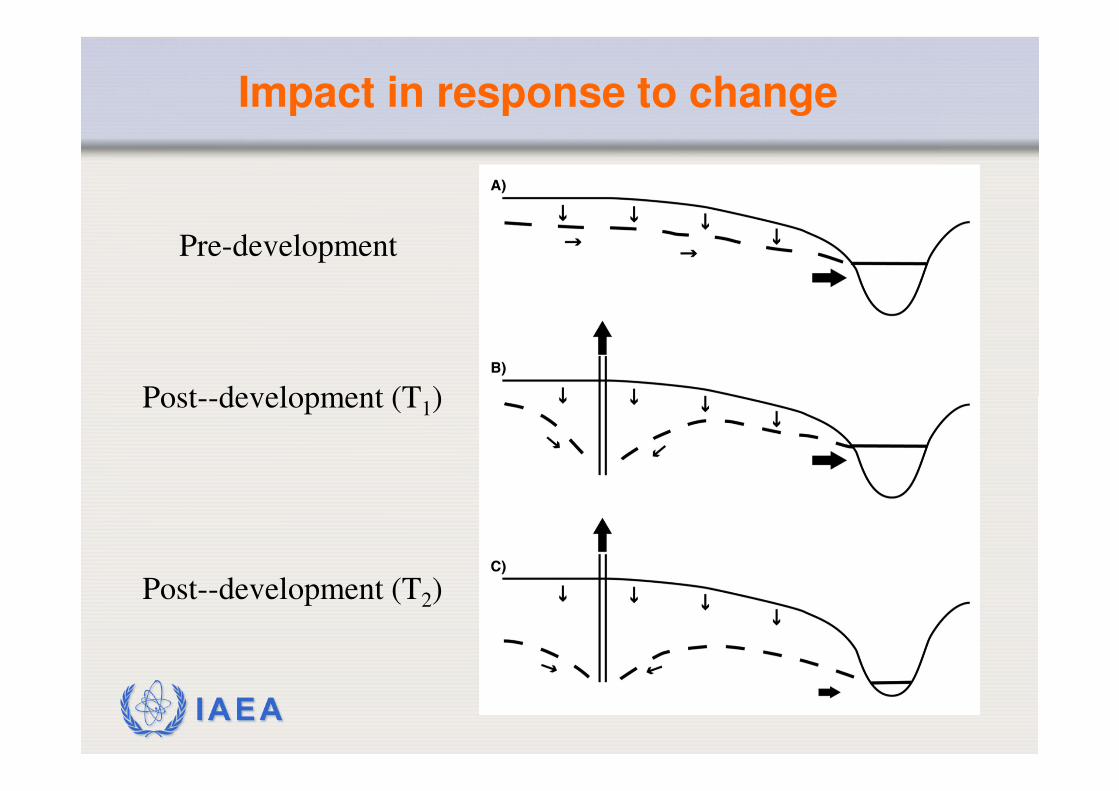
Pre-development
Post--development (T1)
Post--development (T2)
Impact in response to change
IAEA
Summary
� Environmental tracers give direct information about the groundwater flow systems over time
� Isotopes are especially powerful tracers of contaminant sources and fate
�Surface water- groundwater interactions and ecohydrology is a new frontier for these methods


