Kingdom of Lesotho ENVIRONMENT AND ENERGY STATISTICS REPORT Ministry of Development Planning Bureau of Statistics PO Box 455, Maseru 100, Lesotho Tel: +266 22 323 852/22 326 393 Fax: +266 22 310 177 E-mail: [email protected]Website: www.bos.gov.ls MASERU, AUGUST 2012
Transcript
Kingdom of Lesotho
ENVIRONMENT AND ENERGY STATISTICS REPORT
Ministry of Development Planning Bureau of Statistics
Mission: To coordinate the National Statistical System(NSS) and produce accurate, timely and reliable culturally relevant and internationally comparable statistical data for evidence-based planning, decision making, research, policy, program formulation and monitoring and evaluation to satisfy the needs of users and producers.
i
Table of Contents Page Acronyms ........................................................................................................... vii Definition of Terms ............................................................................................. viii Foreword ............................................................................................................. xi Acknowledgements .............................................................................................. xii CHAPTER 1 ......................................................................................................... 1 INTRODUCTION ................................................................................................... 1
1.1 Background ........................................................................................................1 1.1.1 Energy ..........................................................................................................1
1.1.2 Land Use .......................................................................................................2
1.1.3 Air and Climate Change .................................................................................2
1.1.4 Water ............................................................................................................3
Table 22: Number of Households by Type of Toilet Facility Used and Urban/Rural Residence - 2006 .......... 41
Table 23: Number of Households by Type of Solid Waste Disposal and Region in 2006. .............................. 42
vi
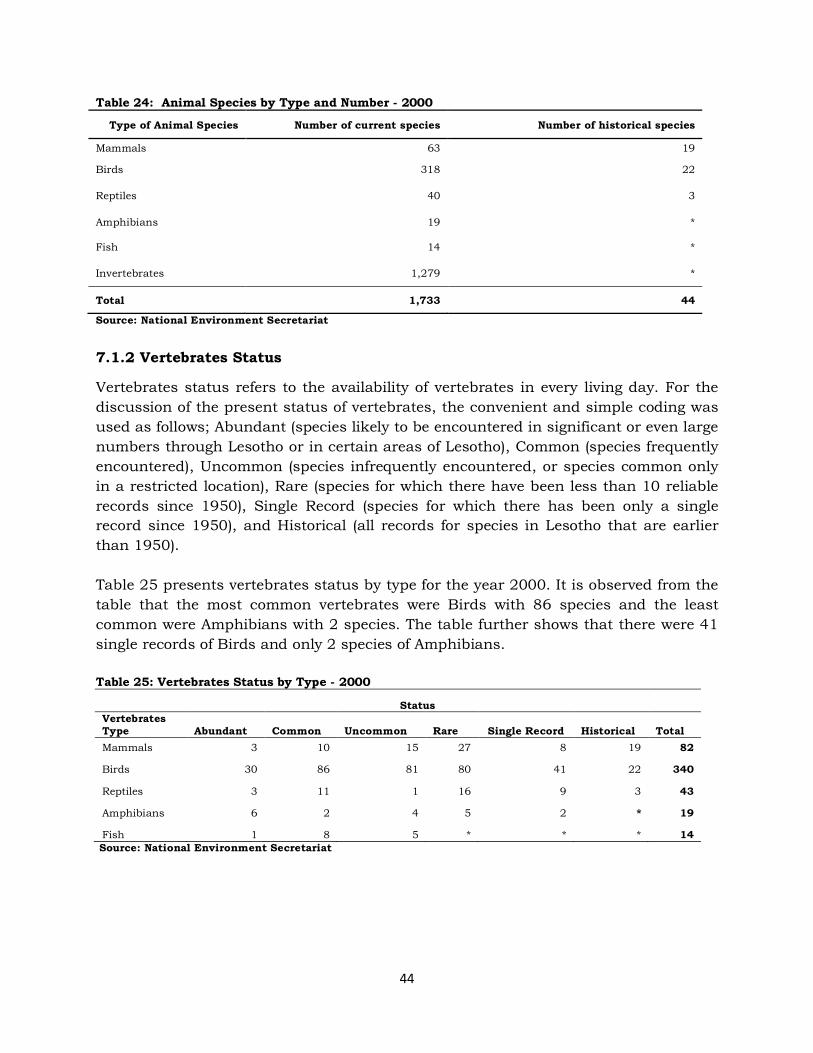
Table 24: Animal Species by Type and Number - 2000 ............................................................................... 44
Table 25: Vertebrates Status by Type - 2000 ............................................................................................... 44
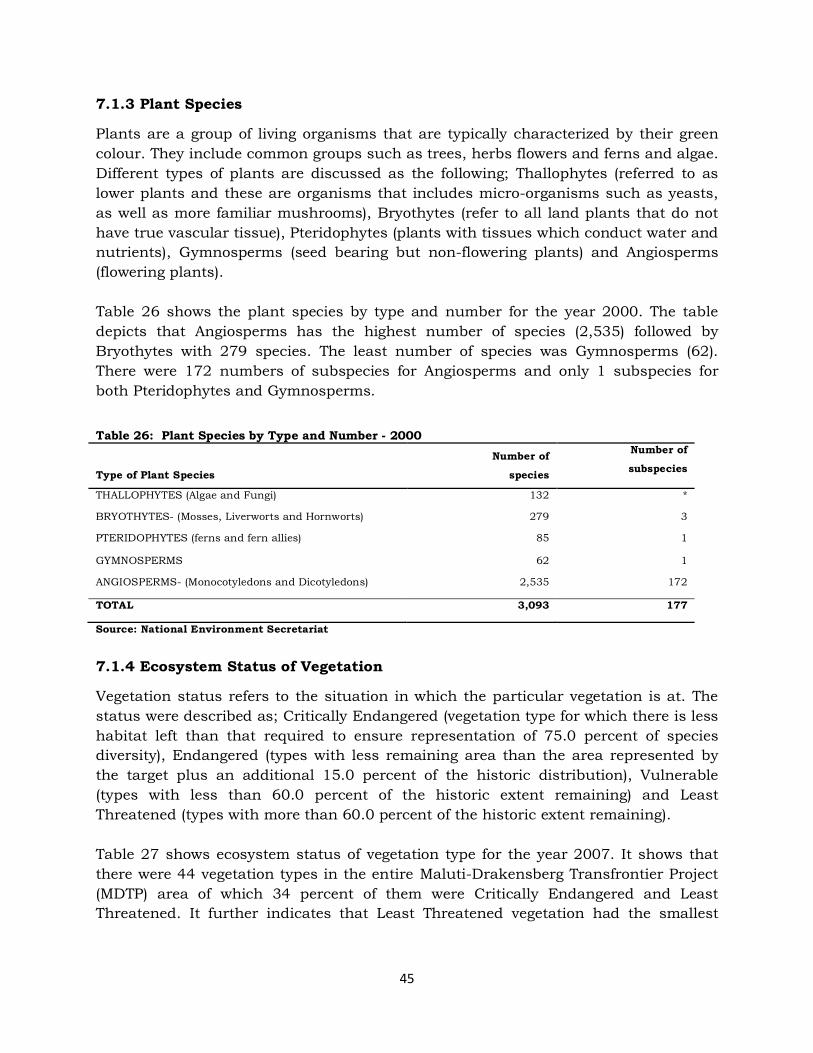
Table 26: Plant Species by Type and Number - 2000 ................................................................................... 45
Table 27: Ecosystem Status of Vegetation Types - 2007 .............................................................................. 46
Table 28: Areal Distribution across the MDTP Planning Domain in Hectares (ha) by Wetland Types - 2007 . 48
vii
ACRONYMS
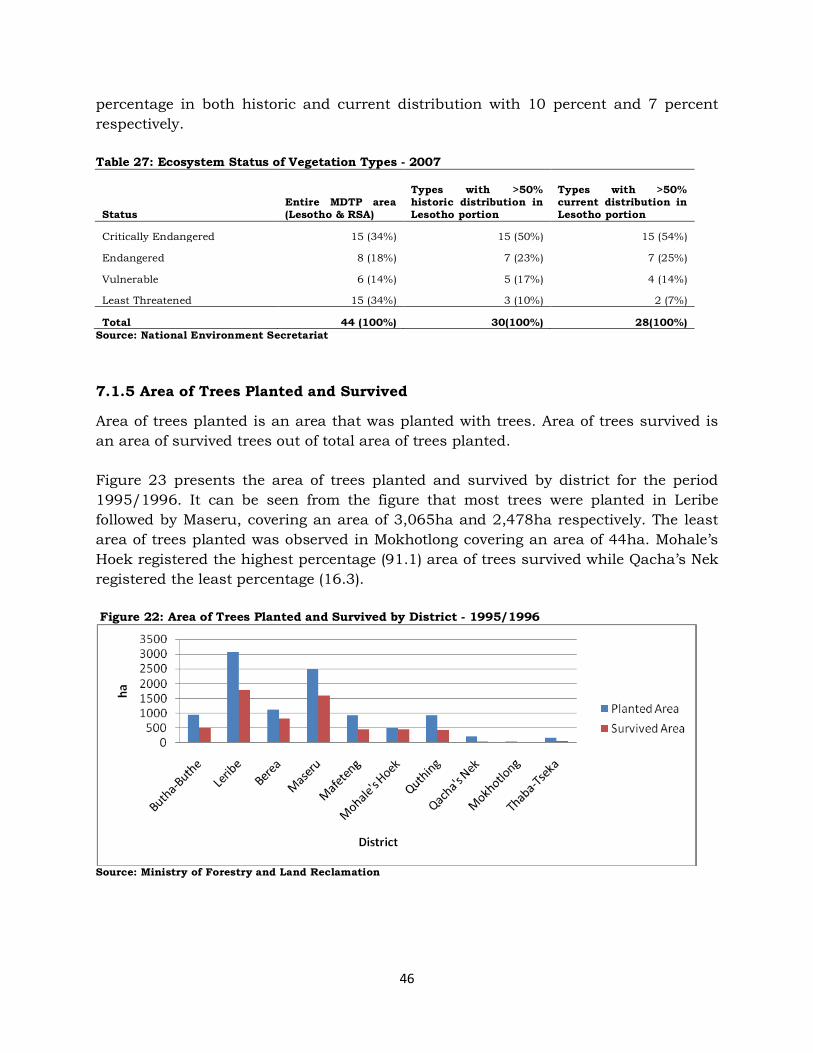
BOS Bureau of Statistics CBD Convention on Biological Diversity CEDAMA Committee for Environmental Data Management CH4 Methane CO Carbon Monoxide CO2 Carbon Dioxide EU European Union FAO Food and Agriculture Organization Gg Gigagrams GHG Green House Gases Ha Hectares HBS Household Budget Surveys IWRM Integrated Water Resources Management KL Kilolitres Km2 Square Kilometers L Litres LAN Lime Ammonium Nitrate LHDA Lesotho Highlands Development Authority LPG Liquefied Petroleum Gas LU Land Use MCC Maseru City Council MDGs Millennium Development Goals MDTP Maluti-Drakensberg Transfrontier Project Mg Magnesium mm Millimeters mt Metrictonnes MWh Megawatt hour N2 Nitrogen N2O Nitrous Oxides NFAP National Forestry Action Plan NOX Nitrogen Oxides NV-VOCS Non-Methane Volatile Organic Compounds O2 Oxygen RSA Republic of South Africa SO2 Sulphur Dioxide Ton Tonnes UN United Nations UNFDES United Nations Framework for Development of Environment Statistics VIP Ventilated Improved Pit latrine WHO World Health Organization
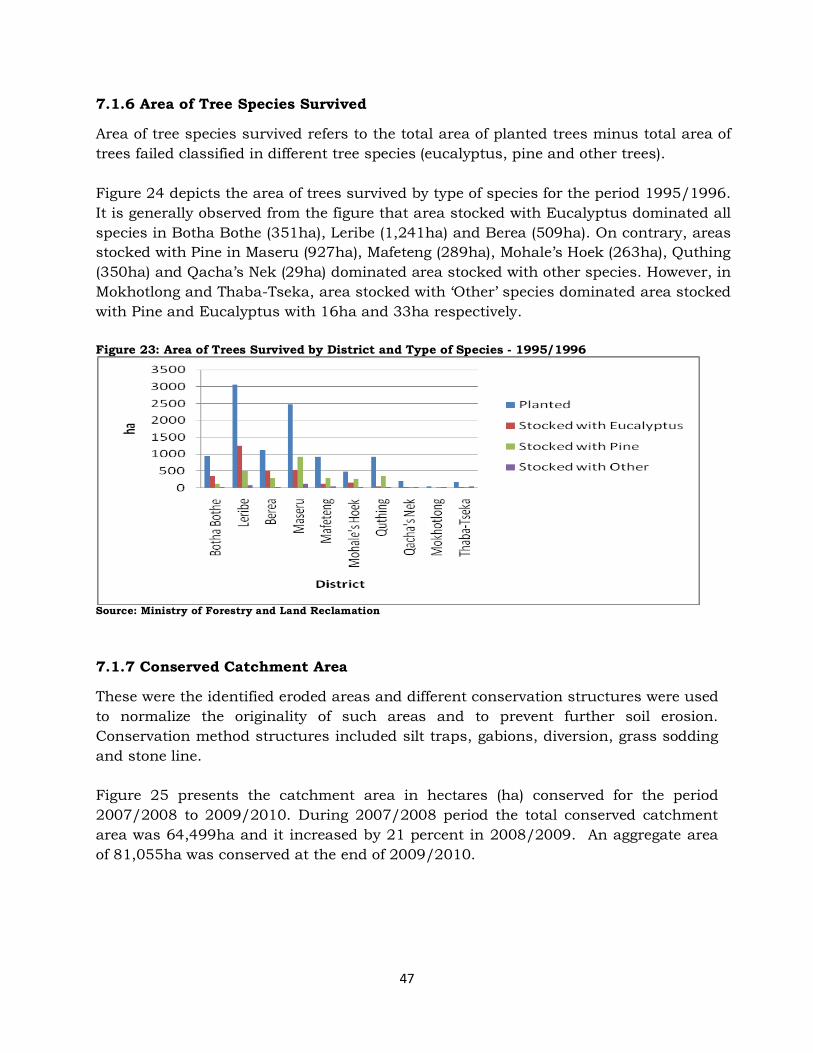
viii
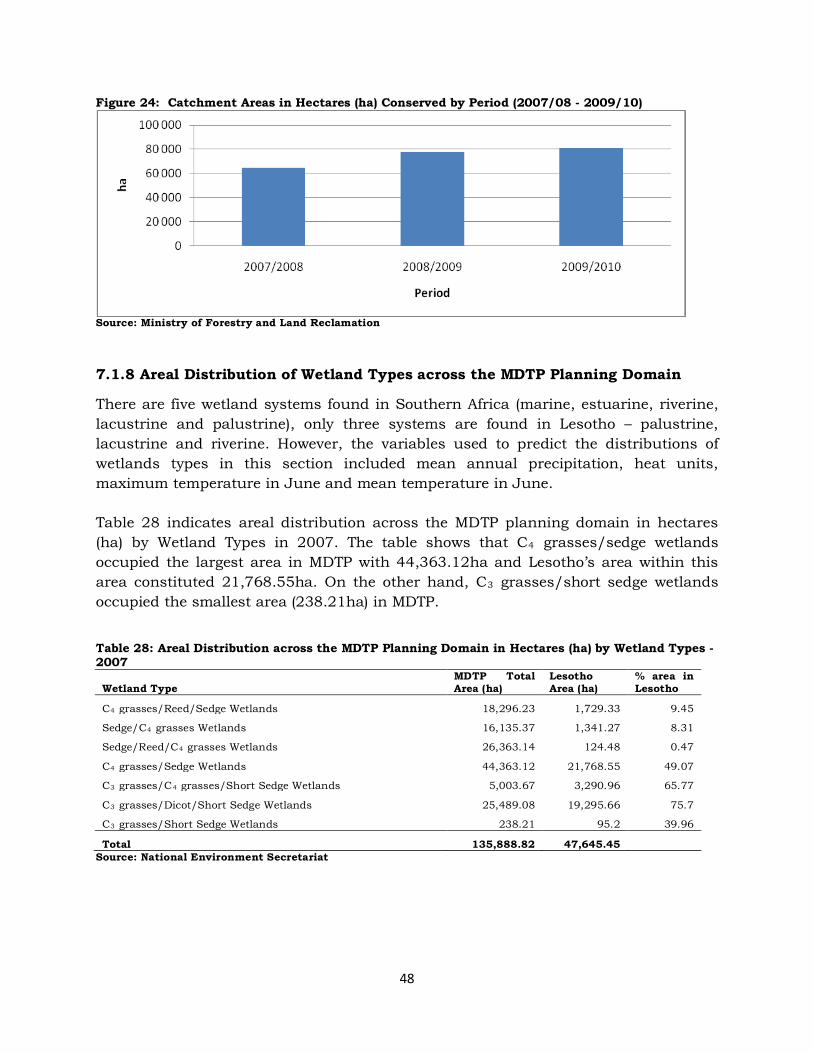
DEFINITION OF TERMS
Peat: Dark fibrous material created when “decomposition fails to keep pace with the
production of organic matter”. It is the first stage of transformation of plant material
into coal.
Coke: Coke is manufactured through coal pyrolysis. Coal pyrolysis means the heating
of coal in an oxygen-free atmosphere to produce gases, liquids and a solid residue
(char or coke).
Lignite: Dark brown to black combustible mineral with characteristics between peat
and coal.
Liquefied Petroleum Gases: LPGs are light paraffinic hydrocarbons derived from the
refinery processes, crude oil stabilisation and natural gas processing plants. LPGs are
normally liquefied under pressure for transportation and storage.
Crude Oil: A mineral oil of natural origin comprising mixture of hydrocarbons and
associated impurities, such as sulphur.
Fossil Fuels: These are taken from natural resources from biomass in the geological
past
LAND USE
Arable land refers to all land generally under rotation whether for temporary crops or
meadows, or left fallow.
Area covered by forests refers to Land under forestry or no land use, spanning more
than 0.005 km2 (0.5 hectares); with trees higher than 5 meters and a canopy cover of
more than 10 percent, or trees able to reach these thresholds in situ.
Area covered by other wooded land refers land under forestry or no land use,
spanning more than 0.005 km2 (0.5 hectares); with trees higher than 5 meters and a
canopy cover of 5-10 percent, or trees able to reach these thresholds in situ; or with a
combined cover of shrubs, bushes and trees above 10 percent.
Salinity is the net increase in salt concentration in the top soil leading to declining
productivity or biodiversity.
Inorganic fertilizer is a chemical (synthetic) fertilizer used to improve plant growth by
supplying nutrients.
Organic fertilizer refers to natural material added to the soil to supply nutrients
essential to the growth of plants.
ix
Pesticides: In the process of plant growth, pesticides are used to kill, repel or control
certain forms of animals live that are considered to be pests.
Soil erosion is when soil is naturally removed by the action of water and wind. Wind
and water erosion (sheet, rill and gully) of soil can be measured as net loss and
applied to one of four categories: light, moderate, strong and extreme.
AIR AND CLIMATE CHANGE
Sulphur Dioxide is the chemical compound made up of one atom of sulphur and two
atoms of oxygen.
Nitrogen oxides are chemical compounds of nitrogen and oxygen produced from the
combustion of fossil fuels. Nitrogen oxides are formed when fuel burns at high
temperatures.
Non-Methane Volatile Organic Compounds is a group of solvent-like organic
compounds that easily evaporate at normal temperatures.
Carbon Dioxide is a chemical compound composed of two atoms of oxygen covalently
bonded to a single atom of carbon.
Methane is a chemical compound composed of one carbon atom and four hydrogen
atoms.
Nitrous Oxide is a chemical compound with two atoms of nitrogen and one atom of
oxygen.
Carbon Monoxide is the compound made of one carbon atom and one oxygen atom. It
is produced when there is an incomplete oxidation during combustion.
Rainfall is the type of precipitation that occurs when water vapour in the atmosphere
condenses into droplets that can no longer be suspended in the air.
WATER
Water resources are sources of water that are potentially useful to humans. It is
naturally replenished by precipitation in a form of rain, hail, snow etc.
Water export is water that is transferred from one country to the other as a
commodity through pipelines.
WASTE
Municipal waste collected is all waste collected by or on behalf of municipalities.
The Environment and Energy Statistics Report of 2012 is the first report produced by the Bureau of Statistics to provide statistics on Energy, Land use, Air and Climate Change, Water, Waste and Biodiversity. The findings in this report will provide valuable information for policy makers.
Data in this report was mainly collected as secondary data from different producers who use it as administrative data or produce it for other users. The intended baseline for data compilation was five years (2006-2010); but eventually left it open to any period upon realizing that there was difficulty finding data over this period.
The Bureau of Statistics wishes to confer sincere gratitude to all line ministries and stakeholders for their great contribution in the production of this report.
Mrs Liengoane Lefosa
Director, Bureau of Statistics
xii
ACKNOWLEDGEMENTS
The Bureau of Statistics (BOS) publications draw most information from households (through household-based surveys), different line ministries as well as other private organizations. This implies that their continued cooperation plays a major role in the compilation and analysis of official statistics. It is worth noting that without this cooperation, a wide range of statistics published would not be available. Information provided is treated with confidentiality as stipulated in Statistics Act 2001. BOS wishes to thank the following organizations and line ministries for their contribution with data for the realization of the Environment and Energy Statistics Report:
1. Lesotho Highlands Development Authority (LHDA) 2. Water and Sanitation Company (WASCO) 3. Lesotho Electricity Company (LEC) 4. Committee for Environmental Data Management (CEDAMA) 5. Lesotho Meteorological Services (LMS) 6. Ministry of Forestry and Land Reclamation (MoFLR) 7. Ministry of Tourism, Environment and Culture (MTEC) 8. Ministry of Natural Resources - Department of Energy 9. Maseru City Council (MCC)
There may be other institutions and organizations not cited above which have been
very instrumental to the production of this report; their contribution is very much
appreciated and recognized.
1
CHAPTER 1
INTRODUCTION
1.1 Background
The background of energy, land use, air and climate change, water, waste and biodiversity statistics is presented in this chapter. The environmental concerns have increasingly become the subject of mainstream policies. Sustainable development has been generally advocated as the best approach to integrating environmental concerns into national and international socio-economic development. Such integration needs to be supported by similarly integrated databases. From the outset, the scope and contents of environment statistics have therefore included; bio-physical data, related social, demographic and economic statistics (United Nations Publication, 1991). Natural resources are under increasing pressure, threatening public health and developments leading to water shortages, soil exhaustion, loss of forests, air and water pollution, as stated in the report “Towards environmental pressure indicators for the EU (1999)”. The world’s population is growing and improving living standards without destroying the environment is a global challenge. This environment and energy statistics report is the first publication produced by the Bureau of Statistics (BOS). The document is structured in a way that it will take the users through different sources of Environment and Energy Statistics data, as well as informing users about the content and the arrangement of the data in general. The presentation of the report will change for the subsequent reports; each theme will have an independent report. The report is divided into six sections with components of the environment as outlined in the United Nations Statistics Division (UNSD) and Framework of Development of Environment Statistics (FDES). These components include Flora, Fauna, Atmosphere, Water, Land or Soil (sub-divided into Surface and Sub-surface) and finally the Human settlement.
1.1.1 Energy The energy sector is characterized by high reliance on biomass for cooking and heating purposes and a low level of energy consumed from commercial sources (electricity, petroleum, coal and gas). Electricity in Lesotho is supplied by hydropower and has been largely sufficient to meet local demand especially in summer. Electricity supply must always equal demand in order to obtain equilibrium. In winter however, there is electricity importation from Republic of South Africa and Mozambique. Solar energy is utilised by some households for lighting, powering audio and visual equipment. Other
2
commercial fuels such as petroleum products and coal are imported from Republic of South Africa. The Lesotho Highlands Development Authority (LHDA) also exports some electricity to RSA when the local demand has been met especially during night hours since electricity cannot be stored.
1.1.2 Land Use The scope of environment statistics includes the media of the natural environment (air/climate, water, land/soil), the biota found within these media and human settlements. Land being one of the environmental media, it is still a major concern for sustainable development even in Lesotho. Therefore, land use statistics plays a pivotal role in monitoring land and land resources usage. “The Basotho way of life underpinned by the principle and the understanding that land and natural resources are strictly communal; that is land belongs to the nation (mobu ke oa sechaba) and it is also the inalienable right of every Mosotho to have access to land, water, pasture, woodland and wild life. This notion, characteristic of the tragedy of the commons, has serious implication in respect of land and land resources use and management. In most instances, proper management and sustainable use of resources is a foreign metaphor to most Basotho. Consequently, land and land resources are under a serious threat” (Lesotho State of Environment Report, 2002). Land use information is needed for various reasons including the following;
• Different land uses affect the natural equilibrium of ecosystems differently- dissimilar impacts on the sustainable flow of goods and services,
• Land resources are finite and usually scarce, • Competition among various land uses (e.g. urban expansion into agricultural
areas), • Thus, knowledge of current land use (and land resources) is needed for
formulating changes leading to sustainable use of the resources.
1.1.3 Air and Climate Change Earth’s atmosphere is full of invisible gases, some of which are greenhouse gases (GHGs). Greenhouse gases insulate the Earth, that is, they trap the sun's heat and keep the planet warm enough to sustain life. However, undue concentrations of GHGs pose a hazard to environmental health and causes climate change and global warming, hence the necessity of a continuous monitoring of their emissions. Air becomes polluted when it contains substances which have a harmful effect on the health of people, animals and vegetation. The main causes of air pollution include transport, domestic combustion and industrial processes.
3
Good air quality is essential for our health, quality of life and environment. The study that was conducted in 1997 revealed that Lesotho had net emission of approximately 2,109.89 Gigagrams (Gg) of green house gases (GHGs). The study showed that in 1994 Lesotho was releasing about 5,149.09 Gg of GHGs while absorbing 3, 039.20 Gg of CO2. Lesotho’s air is considered clean because most of emissions emitted are absorbed. (Lesotho Second State of Environment Report, 2002).
1.1.4 Water Earth’s surface is covered by 70.0 percent of water but fresh water constitute only 2.5 percent of which 1.5 is frozen in a form of glaciers and polar ice and 1.0 percent is left for human use. Water is Lesotho’s most valuable and abundant natural resource. It is a key determinant of economic growth and also a resource that must be carefully managed as part of sustainable development. This makes Lesotho a relatively water-abundant country in the middle of the water-stressed area of Southern Africa. Water is essential for life, as well as indispensable resource for the economy, while playing a fundamental role in the climate regulation cycle. The sources of drinking water include rivers, lakes, streams, ponds, reservoirs and springs. Today’s water crisis is not an issue of scarcity, but of access and this is the case with Lesotho. Cities and slums grow at an increasing rates and the situation is alarming because harmful substances from waste generated affect water quality in different sources.
1.1.5 Waste The generation of waste by society may be viewed as a sign of the inefficient use of resources, the root cause of pollution and the associated environmental degradation. On the other hand, increased waste generation is an expected consequence of development and must be systematically managed in order to conserve resources and protect the environment. However, expanding economies, increased production of goods together with an expanding population are seen as the main drivers for waste generation. Major environmental problems include air and odour pollution from burning of uncollected garbage, odour and disease vectors stemming from uncollected rubbish in poor neighborhoods. These problems however can be reduced with recently improved collection and disposal services (UN Publications, 2001). Solid waste disposal is a major problem in Lesotho, with indiscriminate dumping roadsides, near markets and other public places.
4
1.1.6 Biodiversity The Biodiversity Convention signed by the heads of over 150 governments at Rio de Janeiro in June 1992 has helped to articulate the growing global concern for saving and sharing the genetic wealth of our planet. The major objectives of the convention were the conservation of biological diversity, the sustainable use of its components and the fair and equitable sharing of the benefits (www.CBD.int). Despite their importance to human well-being, forests and wetlands are amongst the most threatened ecosystem types. Deforestation is still alarmingly high and poses a major threat to water catchments and the quantity and quality of available fresh water. Concurrently, it is estimated that half of the world’s wetlands have been lost since 1900, resulting in adverse effects for many natural cycles and an unprecedented loss of biodiversity (http://en.wikipedia.org/wiki/Wetland). It is becoming widely recognized that wetland loss is a major contributing factor in increasing flood risk, particularly for cities. There are, however, some positive trends due to better usage of these ecosystems through the conservation of their valuable functions in order to address water security needs. In 2000, Lesotho ratified the Convention on Biological Diversity (CBD). The country acknowledged that conservation of biological diversity is an important subject. This commits Lesotho to the international intent to achieve a significant reduction of biological diversity loss, thus contributing to poverty reduction and to the benefit of all life on earth. “Poor rangeland management, rapid population growth, poverty, excessive exploitation, and disturbance by humans threaten the biological resources of Lesotho. Poor management of rangeland has resulted in severe land degradation and loss of biological diversity. Population pressure and poverty leaves local communities with no choice but to over-exploit biological resources at their disposal” (Environment Country report, 2002). The major driving forces of loss of biodiversity are population, poverty, unemployment, number of livestock, climate change, construction of housing and emissions of GHGs.
1.2 Objectives The environment statistics as compiled in this report will address the following objectives:
• to inform policy makers in drawing up evidence-based environmental management policies, strategies and laws
• to provide stakeholders with information • to identify and state environmental resource base and depletion in Lesotho
1.3 Methodology In compiling the environmental statistics Media approach was adopted. The media approach organizes environmental issues from the perspective of the major environmental components of air, water, land/soil, biota and the man-made environment.
1.3.1 Data Collection Environment statistics are interdisciplinary in nature. Their sources are dispersed, however, over a variety of data-collecting institutions, and a similar variety of methods are applied in their compilation. Environment statistics aim to overcome this heterogeneity by providing a synthetic presentation of data from various subject areas and sources. Therefore, majority of data in this report is the secondary data collected from various stakeholders as administrative records. Data published in this report were collected from different sources including Government Ministries and Non-governmental Organizations (NGOs) as well as private sector. Some were derived from specialized studies conducted by BOS undertaken to address certain environmental concerns or as part of the components or characteristics of such a survey (imports, population data and/or agricultural statistics).
1.4 Data limitations
The data has some gaps whereby some tables lack completeness in the data sets. This in turn results in a set of information which does not sufficiently answer some questions about environmental status and concerns in the trends. Many record keepers asserted that they do not have sufficient resources to continuously and consistently update their records. There are also concerns in some indicator categories which are representative of the country whose data is outdated and therefore demand fresh studies. The base periods are not the same for all the data sets, because data sets that could be equally pegged on the same period could not be found.
1.5 Report Structure This report is a compendium of different media sections sub-reports. It consists of six sections arranged in the following chronological order: Energy Statistics (data on the use of petroleum products, electricity and renewable energy), Land Use Statistics (data on area under agric environmental indicators, forests and other wooded land, area affected by soil erosion and salinity), Air and Climate Change Statistics (data on emissions of greenhouse gases, temperatures and rainfall), Water Statistics (data on sources of drinking water, water exports and water quality), Waste Statistics (data on waste management) and Biodiversity statistics (data on flora and fauna, conserved catchment area and wetlands). The themes do not follow any specific order in the way they are present
6
CHAPTER 2
ENERGY STATISTICS
2.0 Introduction
Energy statistics refers to data on the use of commodities such as coal, crude oil, natural gas, electricity and renewable energy (biomass, geothermal, wind and solar energy). Energy is the capability of some substances, resulting from their physic-chemical properties, to do work or produce heat. The term energy, when used accurately in energy statistics, refers only to heat and power. Energy has always played an important role in human and economic development and society’s well being as stated in Energy Statistics manual (IEA Publications 2004). Energy sources are divided into two groups which are renewable and non-renewable. The renewable energy source is in a form that can be easily naturally replenished while non-renewable energy source is in a form that is used up and cannot be recreated. Renewable energy sources include solar energy, wind, geothermal energy from heat inside the earth, biomass (crop residue, dung, wood and shrubs), ethanol from plants, biodiesel from vegetable oil, and hydropower. It is energy that is derived from natural processes that are replenished constantly. Non-renewable energy sources include the fossil fuels (oil, coal) and natural gas. The traditional and conventional energy sources are used in the country. The most prevalent traditional energy source is biomass in all its forms while the prevalent conventional energy sources include gas and paraffin for households, diesel and petrol for transport. Electricity is mainly used in the households for cooking, lighting, and heating, while in the industries it is used for space heating and powering heavy machinery. Petroleum products are mainly used in the transport sector and households.
2.1 Results
The results on energy commodities such as electricity, biomass, petroleum, coal, Liquefied Petroleum Gas (LPG) used for cooking, heating, lighting, transportation and other consumption purposes are given in this chapter.
2.1.1 Electricity Production and Consumption
Electricity is produced as primary as well as secondary electricity. Primary electricity is obtained from natural sources such as hydro, wind and solar. On the other hand, secondary electricity is produced from the heat of nuclear fission of nuclear fuels and by burning primary combustible fuels such as coal, natural gas, oil and renewables and wastes (IEA Publications, 2004). Electricity is used in almost every human
7
activity. The final consumption of electricity is all electricity consumed in industry, transport, agriculture, commercial/public services and residential sectors.
2.1.1.1 Electricity Production
Electricity that is produced in the country is hydroelectricity. By allowing flowing water to pass through a specially designed turbine connected to an electricity generator, the potential and kinetic energy of water is converted into electricity in hydroelectric plants (IEA Publications, 2004). The Lesotho Highlands Development Authority (LHDA) is the organization responsible for electricity production in the country.
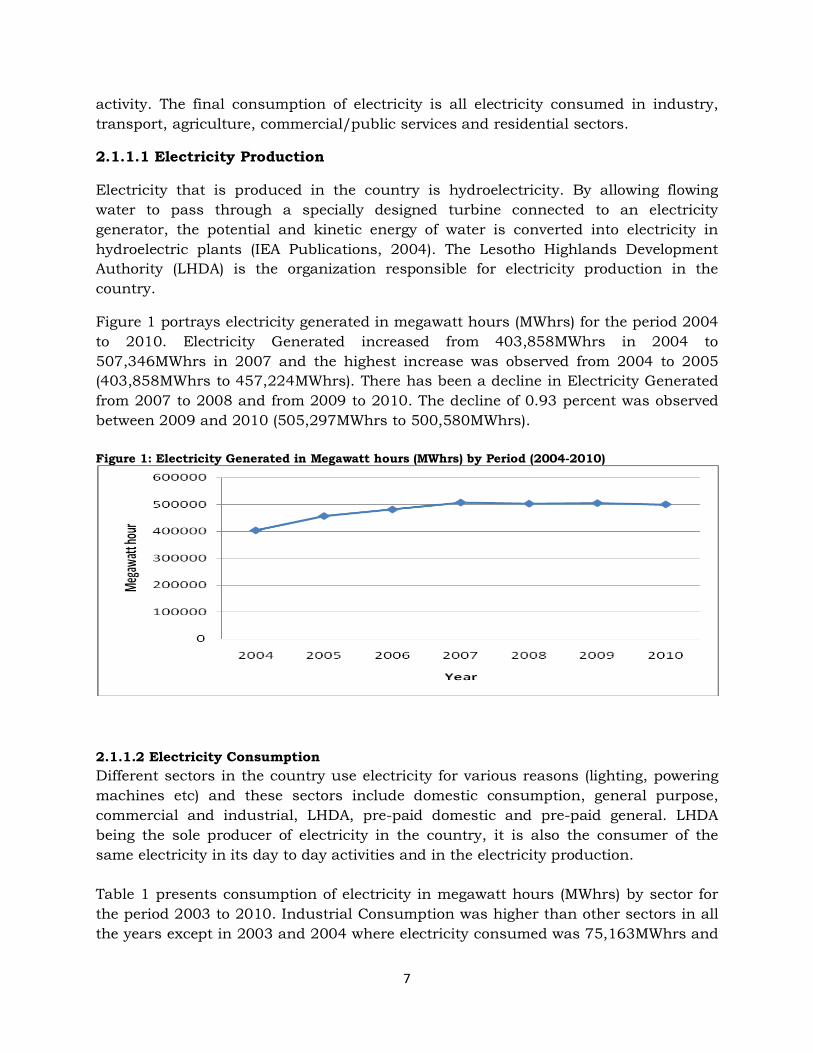
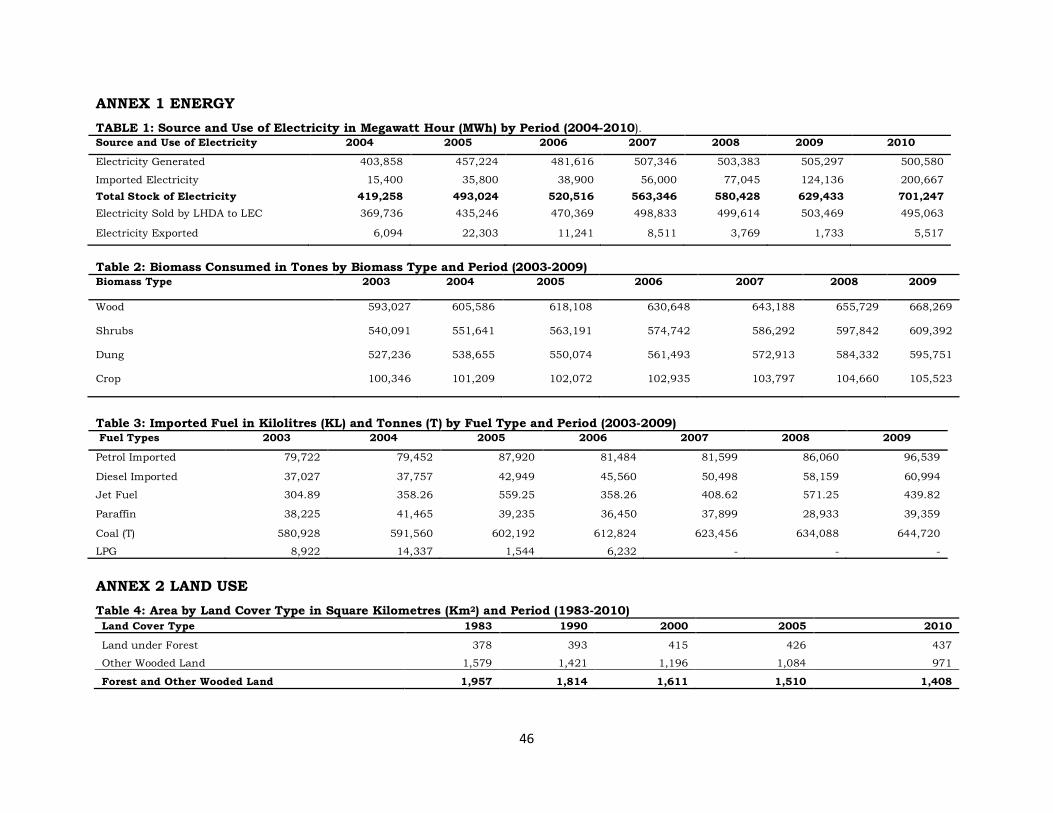
Figure 1 portrays electricity generated in megawatt hours (MWhrs) for the period 2004 to 2010. Electricity Generated increased from 403,858MWhrs in 2004 to 507,346MWhrs in 2007 and the highest increase was observed from 2004 to 2005 (403,858MWhrs to 457,224MWhrs). There has been a decline in Electricity Generated from 2007 to 2008 and from 2009 to 2010. The decline of 0.93 percent was observed between 2009 and 2010 (505,297MWhrs to 500,580MWhrs). Figure 1: Electricity Generated in Megawatt hours (MWhrs) by Period (2004-2010)
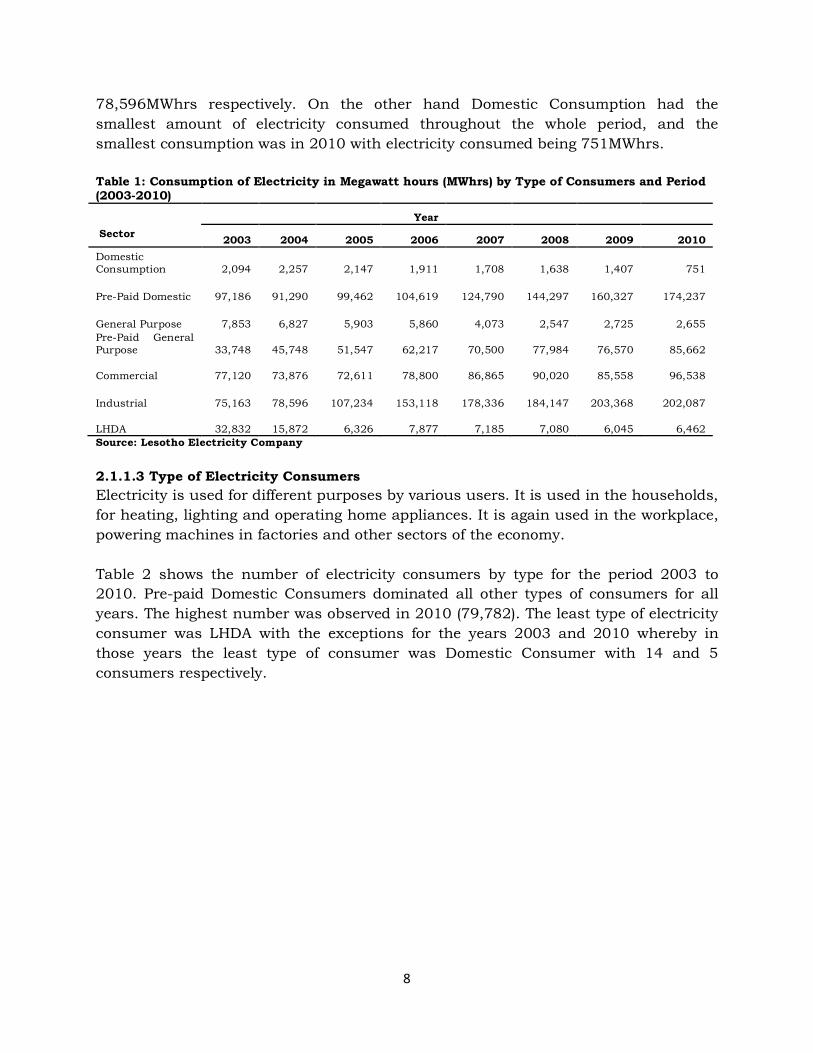
2.1.1.2 Electricity Consumption Different sectors in the country use electricity for various reasons (lighting, powering machines etc) and these sectors include domestic consumption, general purpose, commercial and industrial, LHDA, pre-paid domestic and pre-paid general. LHDA being the sole producer of electricity in the country, it is also the consumer of the same electricity in its day to day activities and in the electricity production. Table 1 presents consumption of electricity in megawatt hours (MWhrs) by sector for the period 2003 to 2010. Industrial Consumption was higher than other sectors in all the years except in 2003 and 2004 where electricity consumed was 75,163MWhrs and
8
78,596MWhrs respectively. On the other hand Domestic Consumption had the smallest amount of electricity consumed throughout the whole period, and the smallest consumption was in 2010 with electricity consumed being 751MWhrs. Table 1: Consumption of Electricity in Megawatt hours (MWhrs) by Type of Consumers and Period (2003-2010)
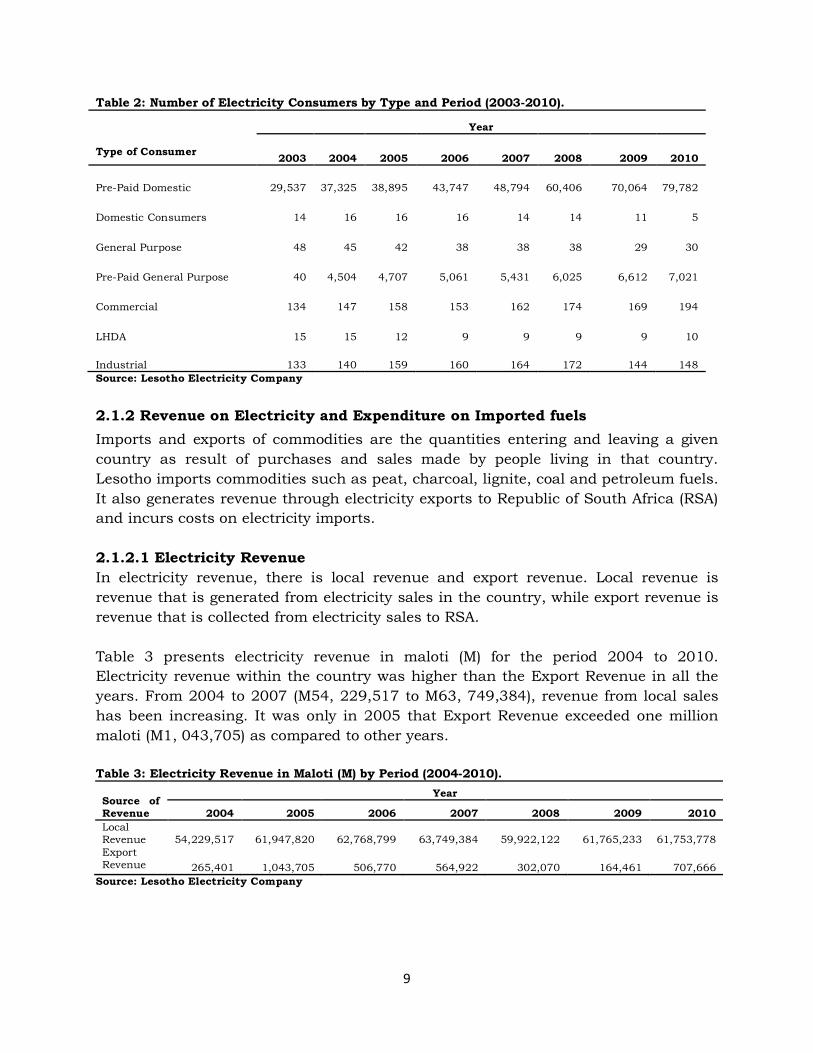
2.1.1.3 Type of Electricity Consumers Electricity is used for different purposes by various users. It is used in the households, for heating, lighting and operating home appliances. It is again used in the workplace, powering machines in factories and other sectors of the economy. Table 2 shows the number of electricity consumers by type for the period 2003 to 2010. Pre-paid Domestic Consumers dominated all other types of consumers for all years. The highest number was observed in 2010 (79,782). The least type of electricity consumer was LHDA with the exceptions for the years 2003 and 2010 whereby in those years the least type of consumer was Domestic Consumer with 14 and 5 consumers respectively.
9
Table 2: Number of Electricity Consumers by Type and Period (2003-2010).
2.1.2 Revenue on Electricity and Expenditure on Imported fuels Imports and exports of commodities are the quantities entering and leaving a given country as result of purchases and sales made by people living in that country. Lesotho imports commodities such as peat, charcoal, lignite, coal and petroleum fuels. It also generates revenue through electricity exports to Republic of South Africa (RSA) and incurs costs on electricity imports. 2.1.2.1 Electricity Revenue In electricity revenue, there is local revenue and export revenue. Local revenue is revenue that is generated from electricity sales in the country, while export revenue is revenue that is collected from electricity sales to RSA.
Table 3 presents electricity revenue in maloti (M) for the period 2004 to 2010. Electricity revenue within the country was higher than the Export Revenue in all the years. From 2004 to 2007 (M54, 229,517 to M63, 749,384), revenue from local sales has been increasing. It was only in 2005 that Export Revenue exceeded one million maloti (M1, 043,705) as compared to other years. Table 3: Electricity Revenue in Maloti (M) by Period (2004-2010).
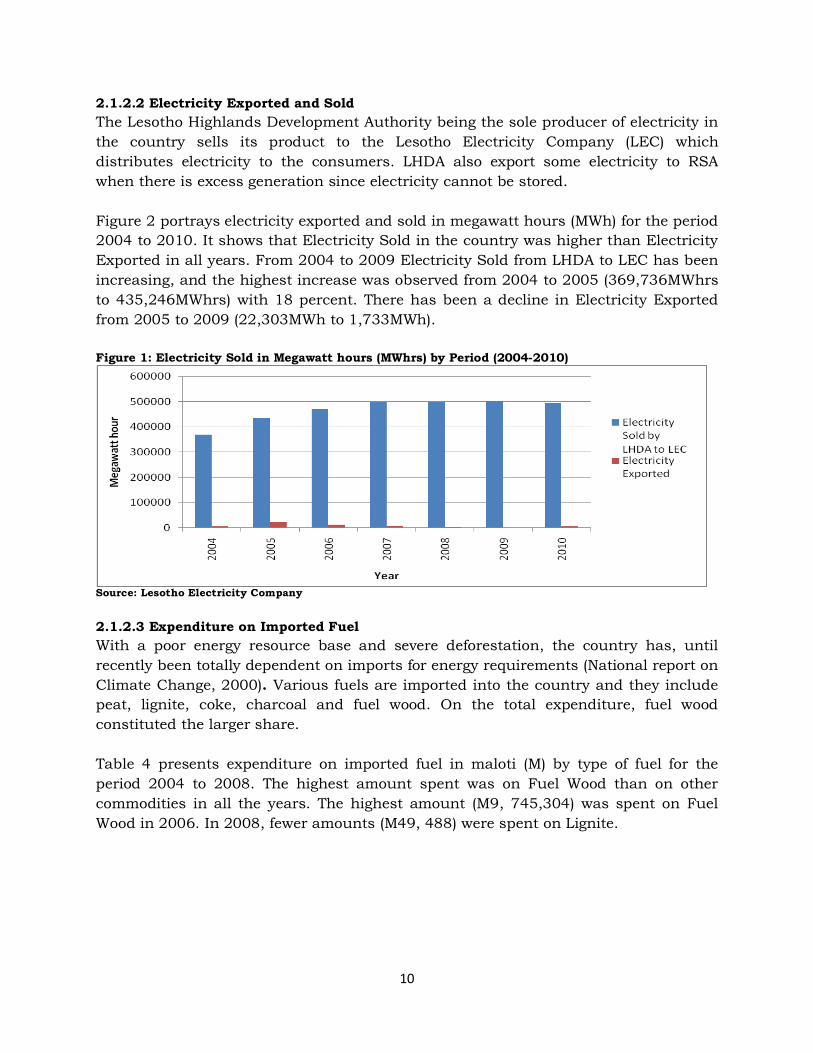
2.1.2.2 Electricity Exported and Sold The Lesotho Highlands Development Authority being the sole producer of electricity in the country sells its product to the Lesotho Electricity Company (LEC) which distributes electricity to the consumers. LHDA also export some electricity to RSA when there is excess generation since electricity cannot be stored. Figure 2 portrays electricity exported and sold in megawatt hours (MWh) for the period 2004 to 2010. It shows that Electricity Sold in the country was higher than Electricity Exported in all years. From 2004 to 2009 Electricity Sold from LHDA to LEC has been increasing, and the highest increase was observed from 2004 to 2005 (369,736MWhrs to 435,246MWhrs) with 18 percent. There has been a decline in Electricity Exported from 2005 to 2009 (22,303MWh to 1,733MWh). Figure 1: Electricity Sold in Megawatt hours (MWhrs) by Period (2004-2010)
Source: Lesotho Electricity Company
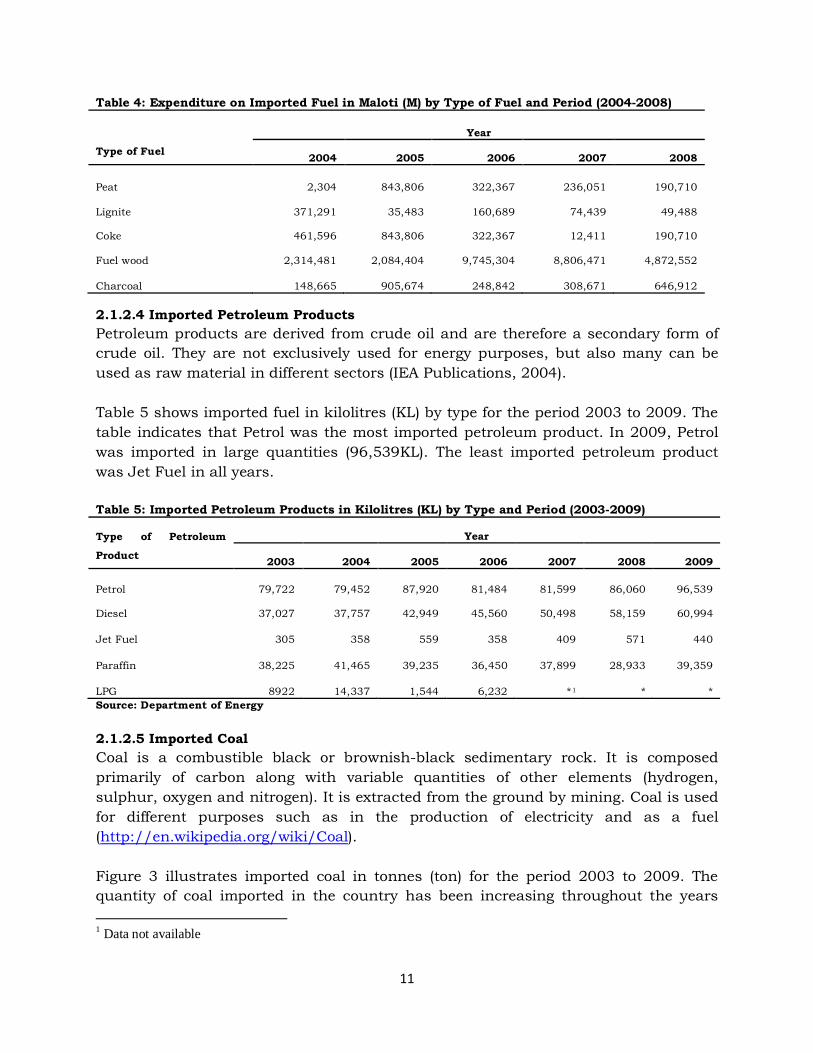
2.1.2.3 Expenditure on Imported Fuel With a poor energy resource base and severe deforestation, the country has, until recently been totally dependent on imports for energy requirements (National report on Climate Change, 2000). Various fuels are imported into the country and they include peat, lignite, coke, charcoal and fuel wood. On the total expenditure, fuel wood constituted the larger share. Table 4 presents expenditure on imported fuel in maloti (M) by type of fuel for the period 2004 to 2008. The highest amount spent was on Fuel Wood than on other commodities in all the years. The highest amount (M9, 745,304) was spent on Fuel Wood in 2006. In 2008, fewer amounts (M49, 488) were spent on Lignite.
11
Table 4: Expenditure on Imported Fuel in Maloti (M) by Type of Fuel and Period (2004-2008)
2.1.2.4 Imported Petroleum Products Petroleum products are derived from crude oil and are therefore a secondary form of crude oil. They are not exclusively used for energy purposes, but also many can be used as raw material in different sectors (IEA Publications, 2004). Table 5 shows imported fuel in kilolitres (KL) by type for the period 2003 to 2009. The table indicates that Petrol was the most imported petroleum product. In 2009, Petrol was imported in large quantities (96,539KL). The least imported petroleum product was Jet Fuel in all years. Table 5: Imported Petroleum Products in Kilolitres (KL) by Type and Period (2003-2009)
Type of Petroleum
Product
Year
2003 2004 2005 2006 2007 2008 2009
Petrol 79,722 79,452 87,920 81,484 81,599 86,060 96,539
LPG 8922 14,337 1,544 6,232 *1 * * Source: Department of Energy
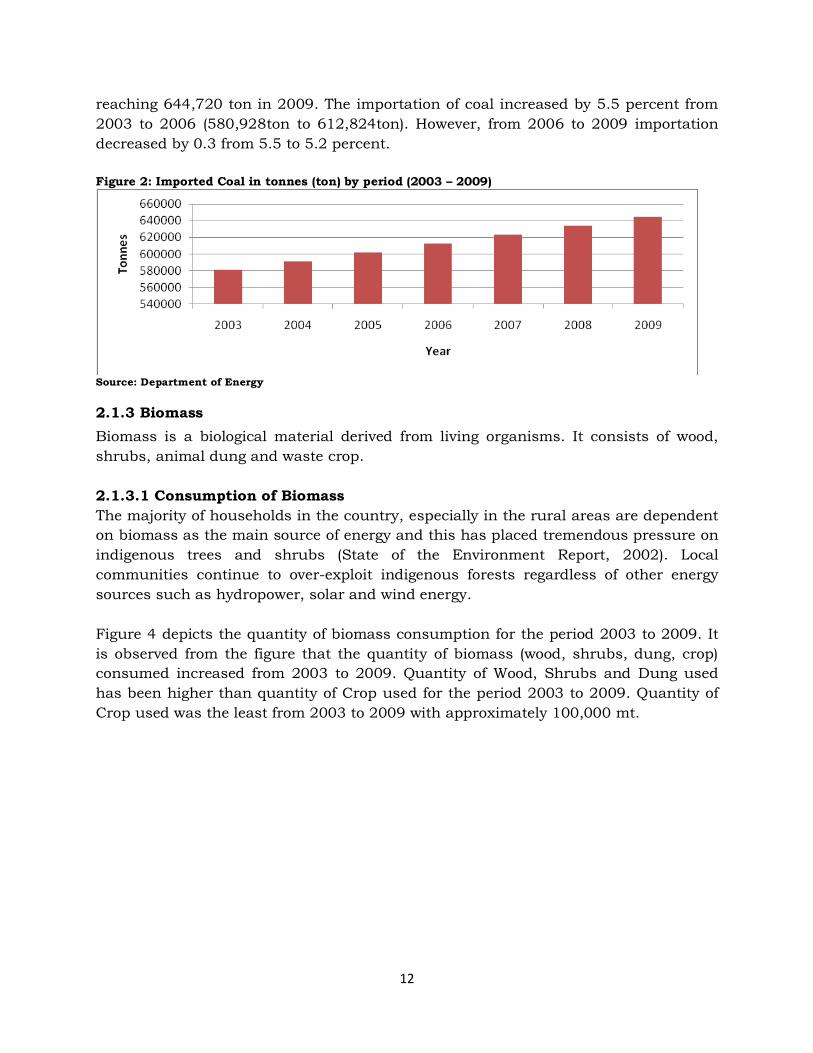
2.1.2.5 Imported Coal Coal is a combustible black or brownish-black sedimentary rock. It is composed primarily of carbon along with variable quantities of other elements (hydrogen, sulphur, oxygen and nitrogen). It is extracted from the ground by mining. Coal is used for different purposes such as in the production of electricity and as a fuel (http://en.wikipedia.org/wiki/Coal). Figure 3 illustrates imported coal in tonnes (ton) for the period 2003 to 2009. The quantity of coal imported in the country has been increasing throughout the years 1 Data not available
reaching 644,720 ton in 2009. The importation of coal increased by 5.5 percent from 2003 to 2006 (580,928ton to 612,824ton). However, from 2006 to 2009 importation decreased by 0.3 from 5.5 to 5.2 percent. Figure 2: Imported Coal in tonnes (ton) by period (2003 – 2009)
Source: Department of Energy
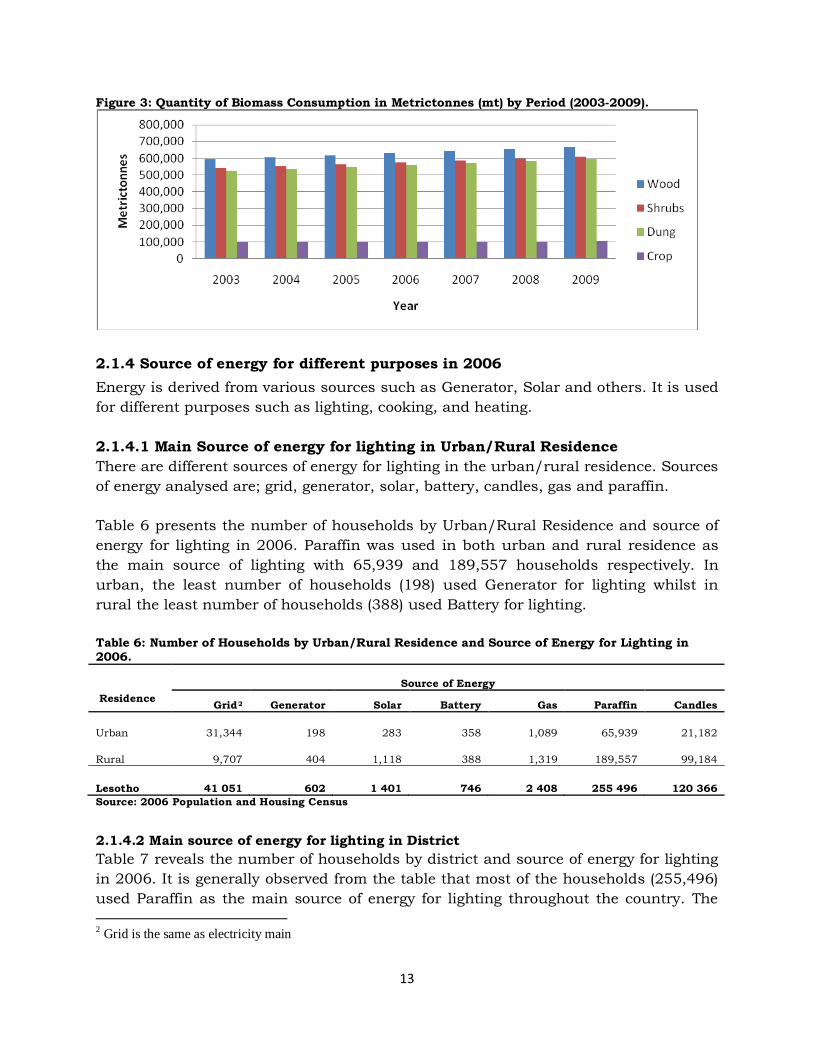
2.1.3 Biomass Biomass is a biological material derived from living organisms. It consists of wood, shrubs, animal dung and waste crop. 2.1.3.1 Consumption of Biomass The majority of households in the country, especially in the rural areas are dependent on biomass as the main source of energy and this has placed tremendous pressure on indigenous trees and shrubs (State of the Environment Report, 2002). Local communities continue to over-exploit indigenous forests regardless of other energy sources such as hydropower, solar and wind energy. Figure 4 depicts the quantity of biomass consumption for the period 2003 to 2009. It is observed from the figure that the quantity of biomass (wood, shrubs, dung, crop) consumed increased from 2003 to 2009. Quantity of Wood, Shrubs and Dung used has been higher than quantity of Crop used for the period 2003 to 2009. Quantity of Crop used was the least from 2003 to 2009 with approximately 100,000 mt.
13
Figure 3: Quantity of Biomass Consumption in Metrictonnes (mt) by Period (2003-2009).
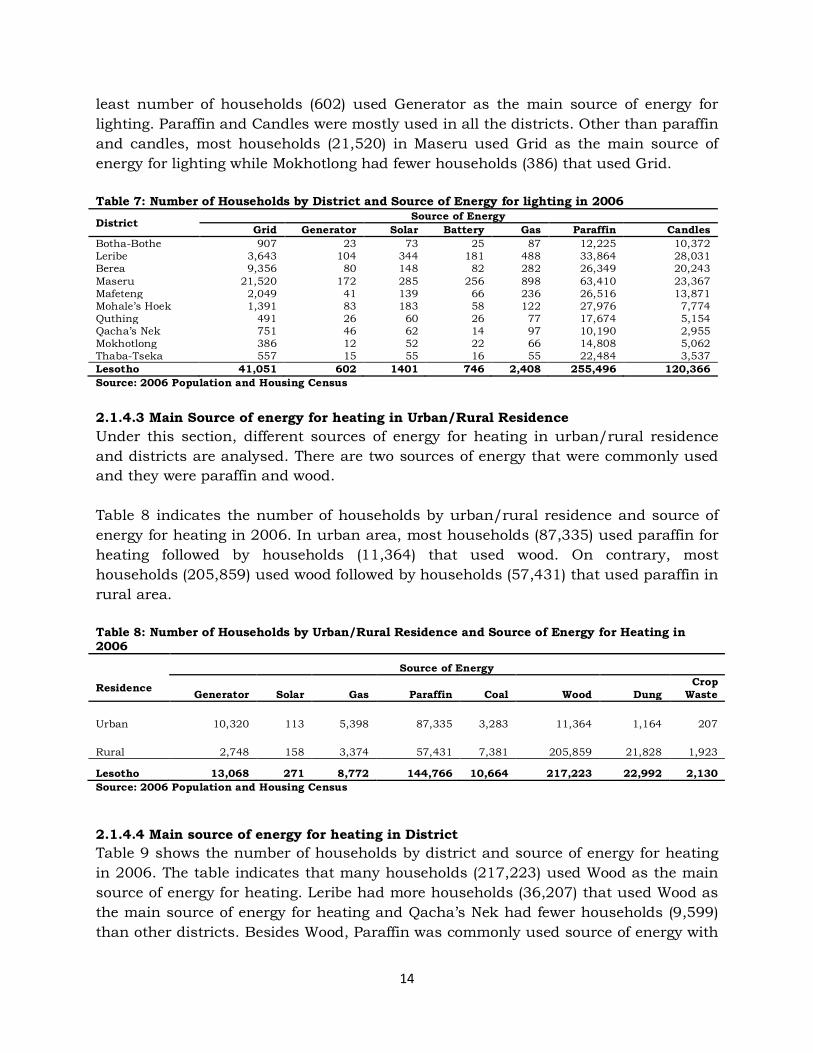
2.1.4 Source of energy for different purposes in 2006 Energy is derived from various sources such as Generator, Solar and others. It is used for different purposes such as lighting, cooking, and heating. 2.1.4.1 Main Source of energy for lighting in Urban/Rural Residence There are different sources of energy for lighting in the urban/rural residence. Sources of energy analysed are; grid, generator, solar, battery, candles, gas and paraffin. Table 6 presents the number of households by Urban/Rural Residence and source of energy for lighting in 2006. Paraffin was used in both urban and rural residence as the main source of lighting with 65,939 and 189,557 households respectively. In urban, the least number of households (198) used Generator for lighting whilst in rural the least number of households (388) used Battery for lighting. Table 6: Number of Households by Urban/Rural Residence and Source of Energy for Lighting in 2006.
Residence Source of Energy
Grid2 Generator Solar Battery Gas Paraffin Candles
Urban 31,344 198 283 358 1,089 65,939 21,182
Rural 9,707 404 1,118 388 1,319 189,557 99,184
Lesotho 41 051 602 1 401 746 2 408 255 496 120 366 Source: 2006 Population and Housing Census
2.1.4.2 Main source of energy for lighting in District Table 7 reveals the number of households by district and source of energy for lighting in 2006. It is generally observed from the table that most of the households (255,496) used Paraffin as the main source of energy for lighting throughout the country. The 2 Grid is the same as electricity main
14
least number of households (602) used Generator as the main source of energy for lighting. Paraffin and Candles were mostly used in all the districts. Other than paraffin and candles, most households (21,520) in Maseru used Grid as the main source of energy for lighting while Mokhotlong had fewer households (386) that used Grid. Table 7: Number of Households by District and Source of Energy for lighting in 2006
District Source of Energy Grid Generator Solar Battery Gas Paraffin Candles
2.1.4.3 Main Source of energy for heating in Urban/Rural Residence Under this section, different sources of energy for heating in urban/rural residence and districts are analysed. There are two sources of energy that were commonly used and they were paraffin and wood. Table 8 indicates the number of households by urban/rural residence and source of energy for heating in 2006. In urban area, most households (87,335) used paraffin for heating followed by households (11,364) that used wood. On contrary, most households (205,859) used wood followed by households (57,431) that used paraffin in rural area. Table 8: Number of Households by Urban/Rural Residence and Source of Energy for Heating in 2006
Lesotho 13,068 271 8,772 144,766 10,664 217,223 22,992 2,130 Source: 2006 Population and Housing Census
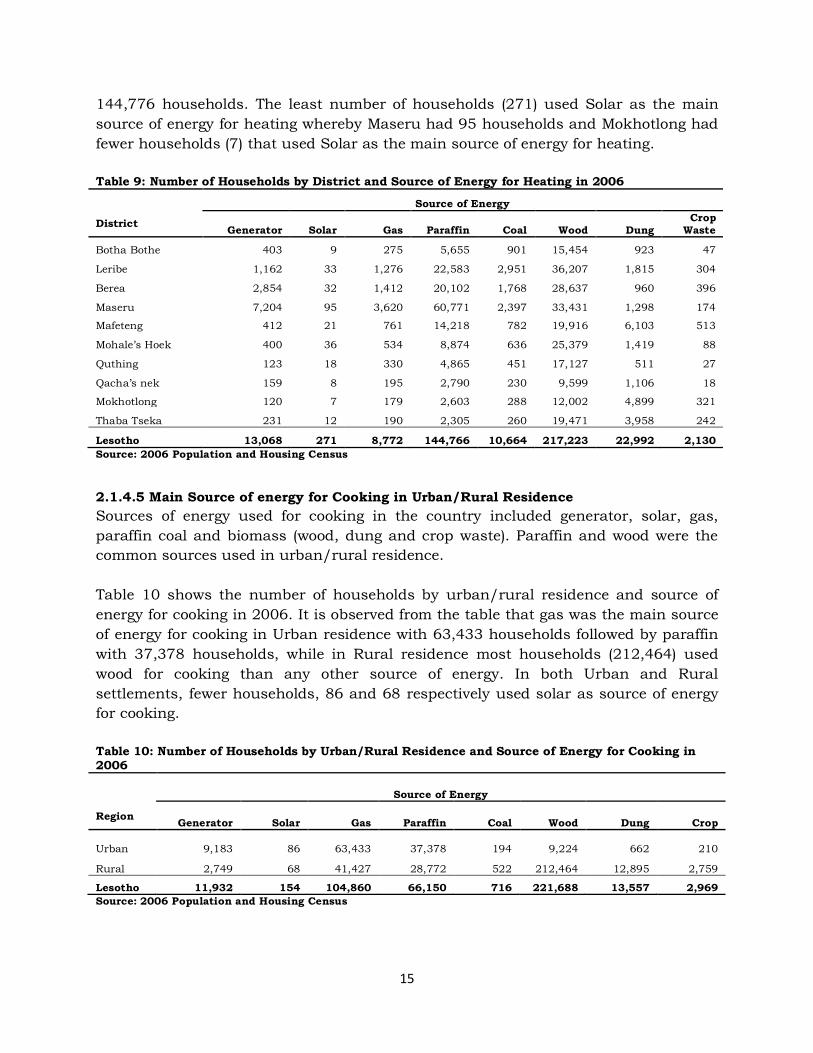
2.1.4.4 Main source of energy for heating in District Table 9 shows the number of households by district and source of energy for heating in 2006. The table indicates that many households (217,223) used Wood as the main source of energy for heating. Leribe had more households (36,207) that used Wood as the main source of energy for heating and Qacha’s Nek had fewer households (9,599) than other districts. Besides Wood, Paraffin was commonly used source of energy with
15
144,776 households. The least number of households (271) used Solar as the main source of energy for heating whereby Maseru had 95 households and Mokhotlong had fewer households (7) that used Solar as the main source of energy for heating. Table 9: Number of Households by District and Source of Energy for Heating in 2006
Lesotho 13,068 271 8,772 144,766 10,664 217,223 22,992 2,130 Source: 2006 Population and Housing Census
2.1.4.5 Main Source of energy for Cooking in Urban/Rural Residence Sources of energy used for cooking in the country included generator, solar, gas, paraffin coal and biomass (wood, dung and crop waste). Paraffin and wood were the common sources used in urban/rural residence. Table 10 shows the number of households by urban/rural residence and source of energy for cooking in 2006. It is observed from the table that gas was the main source of energy for cooking in Urban residence with 63,433 households followed by paraffin with 37,378 households, while in Rural residence most households (212,464) used wood for cooking than any other source of energy. In both Urban and Rural settlements, fewer households, 86 and 68 respectively used solar as source of energy for cooking. Table 10: Number of Households by Urban/Rural Residence and Source of Energy for Cooking in 2006
Lesotho 11,932 154 104,860 66,150 716 221,688 13,557 2,969 Source: 2006 Population and Housing Census
16
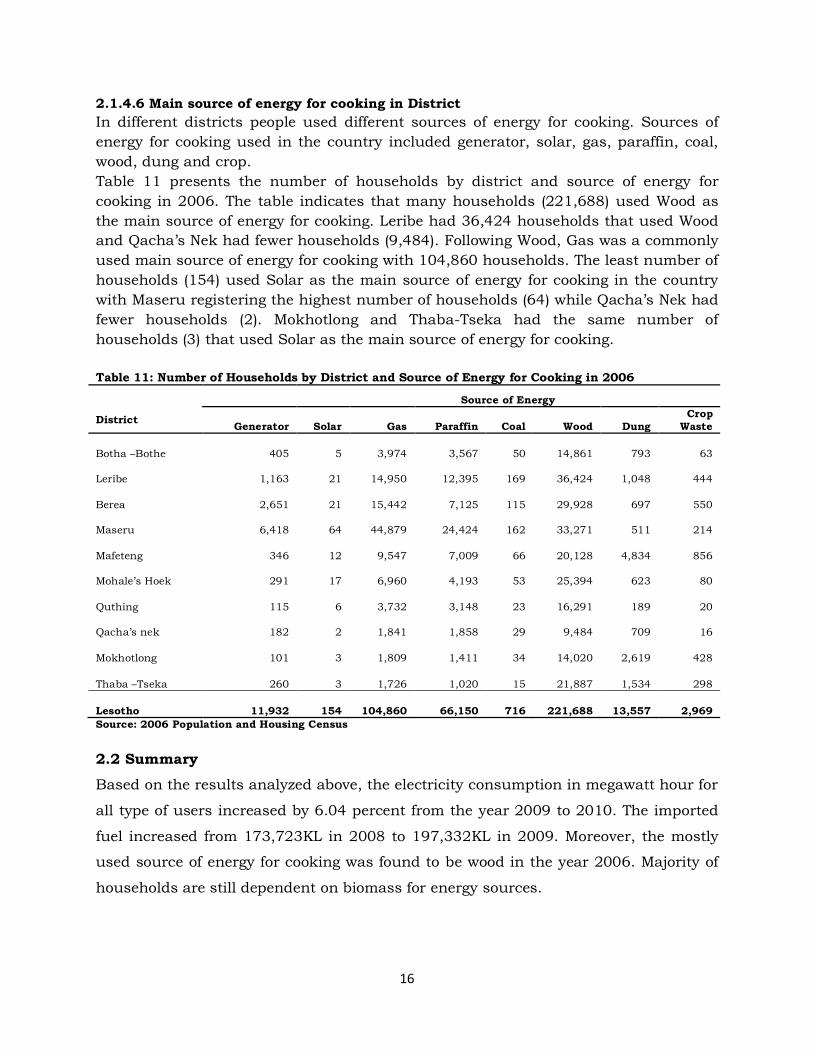
2.1.4.6 Main source of energy for cooking in District In different districts people used different sources of energy for cooking. Sources of energy for cooking used in the country included generator, solar, gas, paraffin, coal, wood, dung and crop. Table 11 presents the number of households by district and source of energy for cooking in 2006. The table indicates that many households (221,688) used Wood as the main source of energy for cooking. Leribe had 36,424 households that used Wood and Qacha’s Nek had fewer households (9,484). Following Wood, Gas was a commonly used main source of energy for cooking with 104,860 households. The least number of households (154) used Solar as the main source of energy for cooking in the country with Maseru registering the highest number of households (64) while Qacha’s Nek had fewer households (2). Mokhotlong and Thaba-Tseka had the same number of households (3) that used Solar as the main source of energy for cooking. Table 11: Number of Households by District and Source of Energy for Cooking in 2006
Lesotho 11,932 154 104,860 66,150 716 221,688 13,557 2,969 Source: 2006 Population and Housing Census
2.2 Summary
Based on the results analyzed above, the electricity consumption in megawatt hour for
all type of users increased by 6.04 percent from the year 2009 to 2010. The imported
fuel increased from 173,723KL in 2008 to 197,332KL in 2009. Moreover, the mostly
used source of energy for cooking was found to be wood in the year 2006. Majority of
households are still dependent on biomass for energy sources.
17
CHAPTER 3
LAND USE STATISTICS
3.0 Introduction Land is defined as “a delineable area of the earth’s terrestrial surface, encompassing all attributes of the biosphere immediately above or below this surface. The natural resources involved in land media includes;
• The near-surface climate, • The soil and terrain forms, • The surface hydrology (including shallow lakes, rivers, marshes and swamps), • The near surface sedimentary layers and associated ground water and geo-
hydrological reserve, • The plant and animal populations, • The human settlements pattern and physical results of past and present
human activities” FAO of United Nation, 1995.
The Land Use (LU) refers to “human activities which are directly related to land, making use of its resources or having an impact on it. The activities comprise the following;
• Socio-economic purpose of the activities (functional definition), • Usually multiple purposes, • Manipulation of natural ecosystems in order to obtain benefits, • Material benefits/ products (e.g. cereals, livestock), • Immaterial benefits/ services (e.g. erosion prevention), • Often some unwanted impacts” FAO of United Nations, 1995.
The land use statistics includes; area under Built-up and related land, Agricultural land (arable land, area fertilized and pesticides coverage), Forests and other wooded land, Area affected by soil erosion, Salinity and Desertification, Waters and agro-ecological zones.
3.1 Results
The results show the land covered by arable land (area planted and fallow), forests and agro-ecological zones. They also indicate the area fertilized, pesticides coverage and area affected by salinity.
18
3.1.1 Arable land
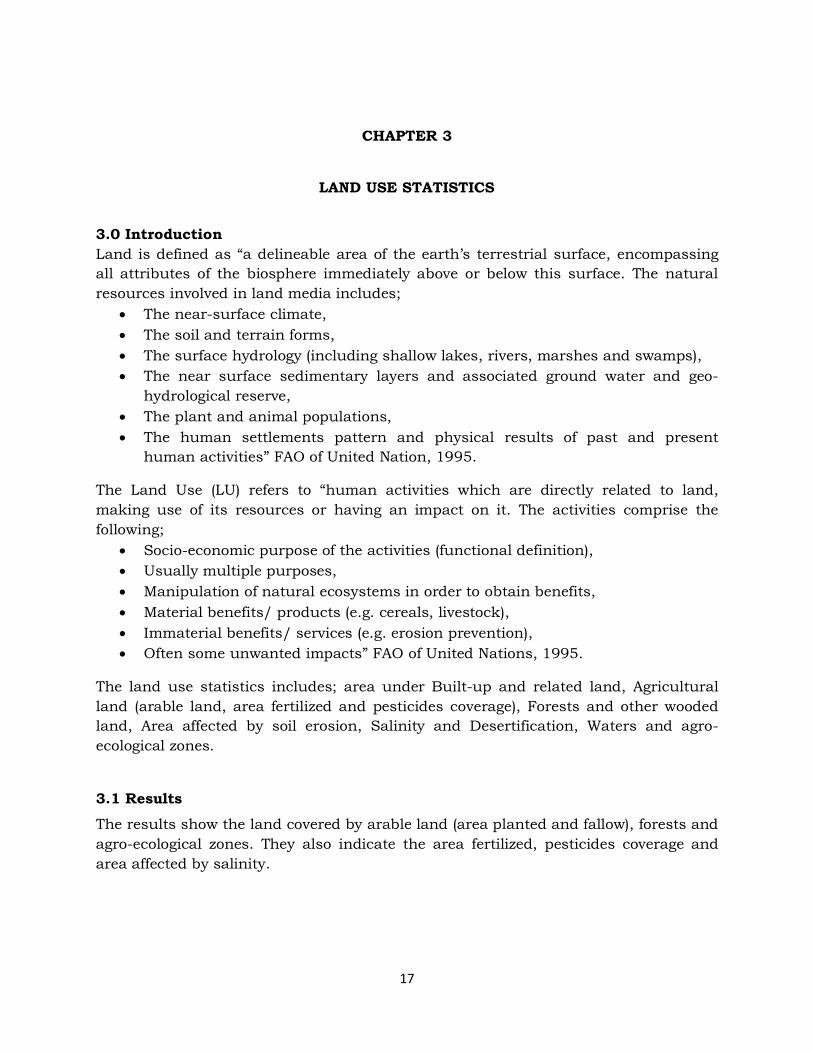
Arable land refers to all land generally under rotation whether for temporary crops or meadows, or left fallow. The land under permanent crops is also included under arable land. Figure 5 illustrates the arable land area in square kilometers for the period 1990 to 2010. It is observed from the figure that in 1990 the arable land was 3,179 square kilometers and it increased to 4,065 square kilometers in 2000. The decrease was observed in 2010 (3,248 square kilometer). Figure 4: The Arable land Area in Square Kilometers by Period (1990-2010).
Source: Agric Census 2009/2010
3.1.2 Area Covered by Forests and Other Wooded Land
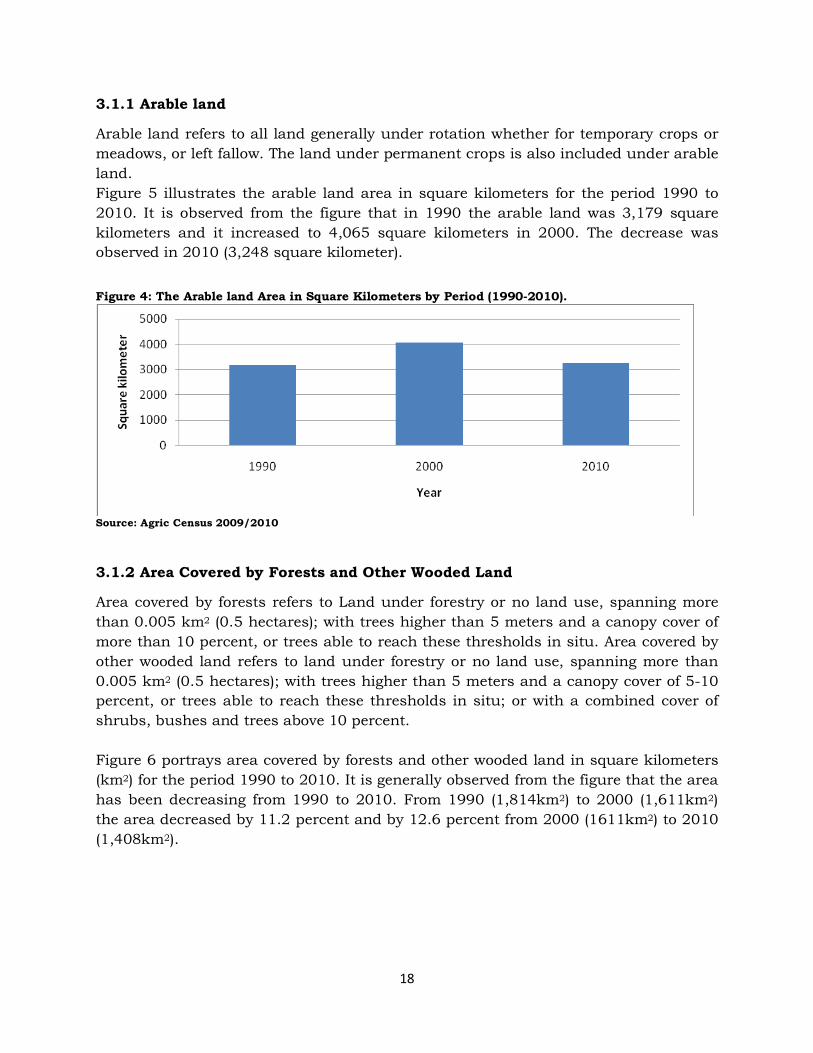
Area covered by forests refers to Land under forestry or no land use, spanning more than 0.005 km2 (0.5 hectares); with trees higher than 5 meters and a canopy cover of more than 10 percent, or trees able to reach these thresholds in situ. Area covered by other wooded land refers to land under forestry or no land use, spanning more than 0.005 km2 (0.5 hectares); with trees higher than 5 meters and a canopy cover of 5-10 percent, or trees able to reach these thresholds in situ; or with a combined cover of shrubs, bushes and trees above 10 percent. Figure 6 portrays area covered by forests and other wooded land in square kilometers (km2) for the period 1990 to 2010. It is generally observed from the figure that the area has been decreasing from 1990 to 2010. From 1990 (1,814km2) to 2000 (1,611km2) the area decreased by 11.2 percent and by 12.6 percent from 2000 (1611km2) to 2010 (1,408km2).
19
Figure 5: Area Covered by Forests and Other Wooded Land in Square Kilometers by Period (1990-2010).
Source: Ministry of Forestry and Land Reclamation
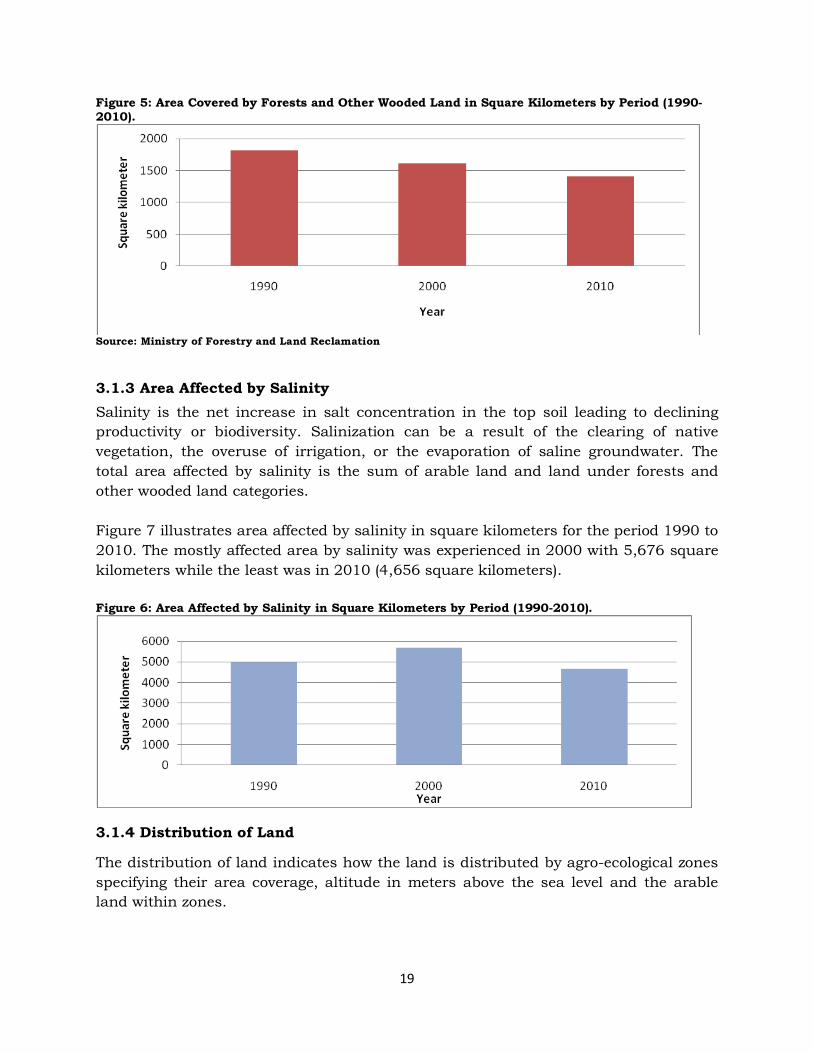
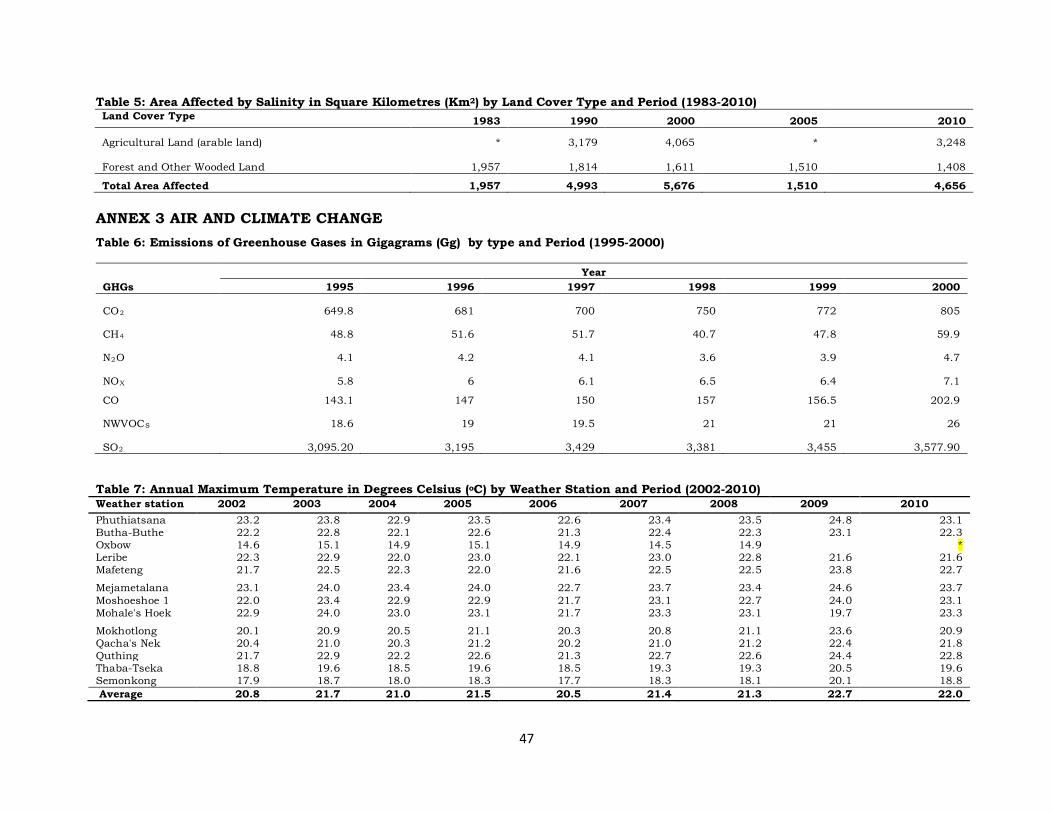
3.1.3 Area Affected by Salinity Salinity is the net increase in salt concentration in the top soil leading to declining productivity or biodiversity. Salinization can be a result of the clearing of native vegetation, the overuse of irrigation, or the evaporation of saline groundwater. The total area affected by salinity is the sum of arable land and land under forests and other wooded land categories. Figure 7 illustrates area affected by salinity in square kilometers for the period 1990 to 2010. The mostly affected area by salinity was experienced in 2000 with 5,676 square kilometers while the least was in 2010 (4,656 square kilometers). Figure 6: Area Affected by Salinity in Square Kilometers by Period (1990-2010).
3.1.4 Distribution of Land
The distribution of land indicates how the land is distributed by agro-ecological zones specifying their area coverage, altitude in meters above the sea level and the arable land within zones.
20
Table 12 shows the distribution of land by agro-ecological zones, altitude (range in meters above sea level), total area (km2) and arable land (km2) for the year 2010. It is observed from the table that, Mountain constituted the largest area (17,910km2) followed by the Lowland with 5,160 km2. However, the arable land in the Mountain (875km2) was smaller than arable land in the Lowland (1,587km2) even though the Mountain constituted the largest area. The Senqu River Valley constituted the least area and arable land with 2,732km2 and 293km2 respectively. The Mountain registered the highest altitude range (Above 2,000 meters) above the sea level as compared to other agro-ecological zones. Table 12: Distribution of Land by Agro-ecological Zones, Altitude (m), Total Area (km2) and Arable Land (km2) - 2010
Agro-ecological zone Altitude Area Arable land Lowland Below 1,800 5,160 1,587
Foothills 1,800 – 2,000 4,553 493
Mountain Above 2,000 17,910 875
Senqu River Valley 1,000 – 2,000 2,732 293
Lesotho 1,388 – 3,482 30,355 3,248 Source: Agric Census 2009/2010
3.1.5 Area Covered and Type of Land Cover
The land cover specifies the different types of land cover as well as the total area they are covering in absolute values and proportions. The land cover types include rangelands, croplands, settlements, rocks, gullies and water. Table 13 shows area covered in square kilometers (km2) and percentage by type of land cover for the year 1988. It is observed from the table that Rangelands cover the largest part of the area with 64.8 percent followed by Cropland with 24.7 percent. Area covered with Water was among the least with 1.1 percent. Table 13: Area Covered in Square kilometers and Percentage by Type of Land Cover - 1988 Land Cover Type Area Percentage
Rangeland 19,819 64.8
Cropland 7,540 24.7
Forest 121 0.4 Settlements3 988 3.2 Roads 121 0.4
Rock 1,038 3.4
Gully 596 1.9 Water 332 1.1
Other 16 0.8
Lesotho 30,571 100.0
Source: Conservation Division, MOA
3 Settlements were regarded as villages
21
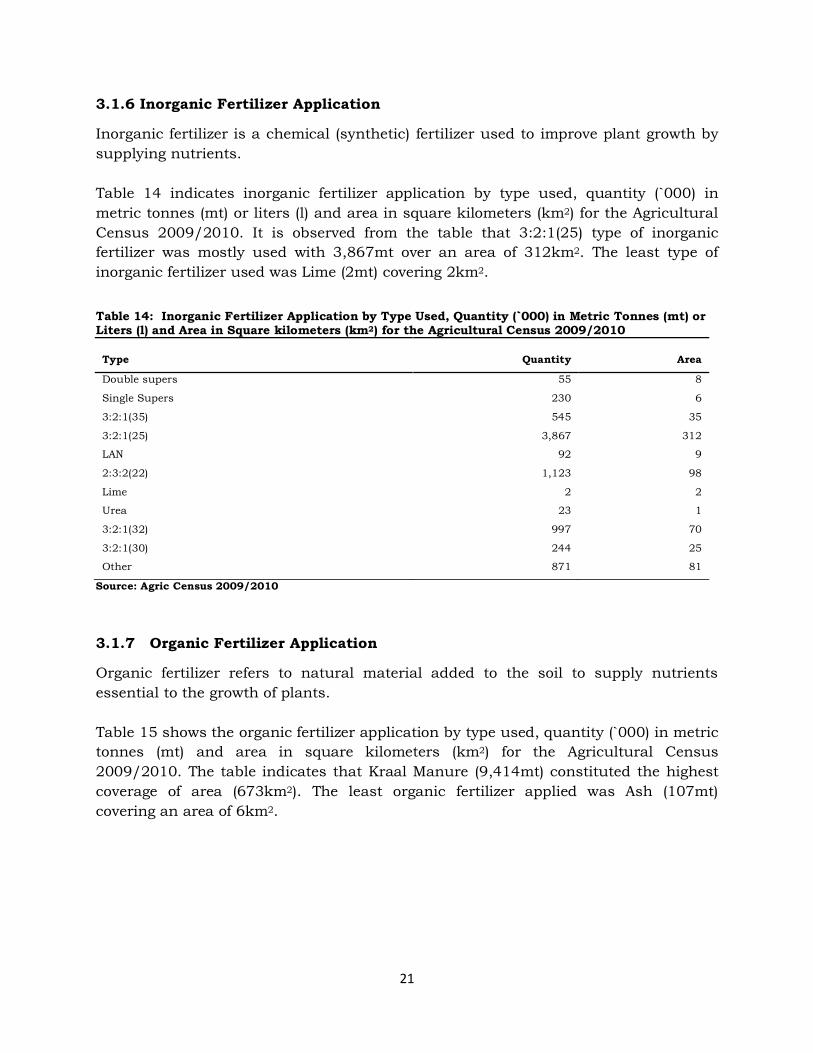
3.1.6 Inorganic Fertilizer Application
Inorganic fertilizer is a chemical (synthetic) fertilizer used to improve plant growth by supplying nutrients. Table 14 indicates inorganic fertilizer application by type used, quantity (`000) in metric tonnes (mt) or liters (l) and area in square kilometers (km2) for the Agricultural Census 2009/2010. It is observed from the table that 3:2:1(25) type of inorganic fertilizer was mostly used with 3,867mt over an area of 312km2. The least type of inorganic fertilizer used was Lime (2mt) covering 2km2. Table 14: Inorganic Fertilizer Application by Type Used, Quantity (`000) in Metric Tonnes (mt) or Liters (l) and Area in Square kilometers (km2) for the Agricultural Census 2009/2010
Type Quantity Area
Double supers 55 8
Single Supers 230 6
3:2:1(35) 545 35
3:2:1(25) 3,867 312
LAN 92 9
2:3:2(22) 1,123 98
Lime 2 2
Urea 23 1
3:2:1(32) 997 70
3:2:1(30) 244 25
Other 871 81
Source: Agric Census 2009/2010
3.1.7 Organic Fertilizer Application
Organic fertilizer refers to natural material added to the soil to supply nutrients essential to the growth of plants. Table 15 shows the organic fertilizer application by type used, quantity (`000) in metric tonnes (mt) and area in square kilometers (km2) for the Agricultural Census 2009/2010. The table indicates that Kraal Manure (9,414mt) constituted the highest coverage of area (673km2). The least organic fertilizer applied was Ash (107mt) covering an area of 6km2.
22
Table 15: Organic Fertilizer Application by Type Used, Quantity (`000) in Metric Tonnes (mt) and Area in Square kilometers (km2) for the Agricultural Census 2009/2010 Type Quantity Area Ash 107 6 Kraal Manure 9,414 673
Poultry Manure 123 10 Other 163 10 Lesotho 9,807 699
Source: Agric Census 2009/2010
3.1.8 Pesticide Application In the process of plant growth, pesticides are used to kill, repel or control certain forms of animals live that are considered to be pests. The ‘Combination’ was considered as a variable of measurement whenever two or more types of pesticides were used together to form combination. Table 16 indicates pesticides application by type used, quantity (`000) in milliliters (ml) or metric tonnes (mt) and area in square kilometers (km2) for the Agricultural Census 2009/2010. The table shows that Thiodan4 (57,430ml) was highly used type of pesticide covering 191km2. The least type of pesticide used was Metasystox (211 l/ton) covering 4km2. Table 16: Pesticides Application by Type Used, Quantity (`000) in Milliliters (ml) or Metric Tonnes (mt) and Area in Square kilometers (km2) for the Agricultural Census 2009/2010
Pesticides Quantity Area
Malathion 432 15
Metasystox 211 4
Ripcort 1,446 3
Karate 2,373 28
Lanacol 436 6
Dithane 129 10
Cutworn bait 1,126 18
Thiodan 57,430 191
Combination 4 0
Other 2,767 30 Source: Agric Census 2009/2010
3.1.9 Soil Erosion
Soil erosion is when soil is naturally removed by the action of water and wind. Wind and water erosion (sheet, rill and gully) of soil can be measured as net loss and applied to one of four categories: light, moderate, strong and extreme.
4 Thiodan is no longer used but most farmers still have a perception that any liquid pesticides they use is thiodan
23
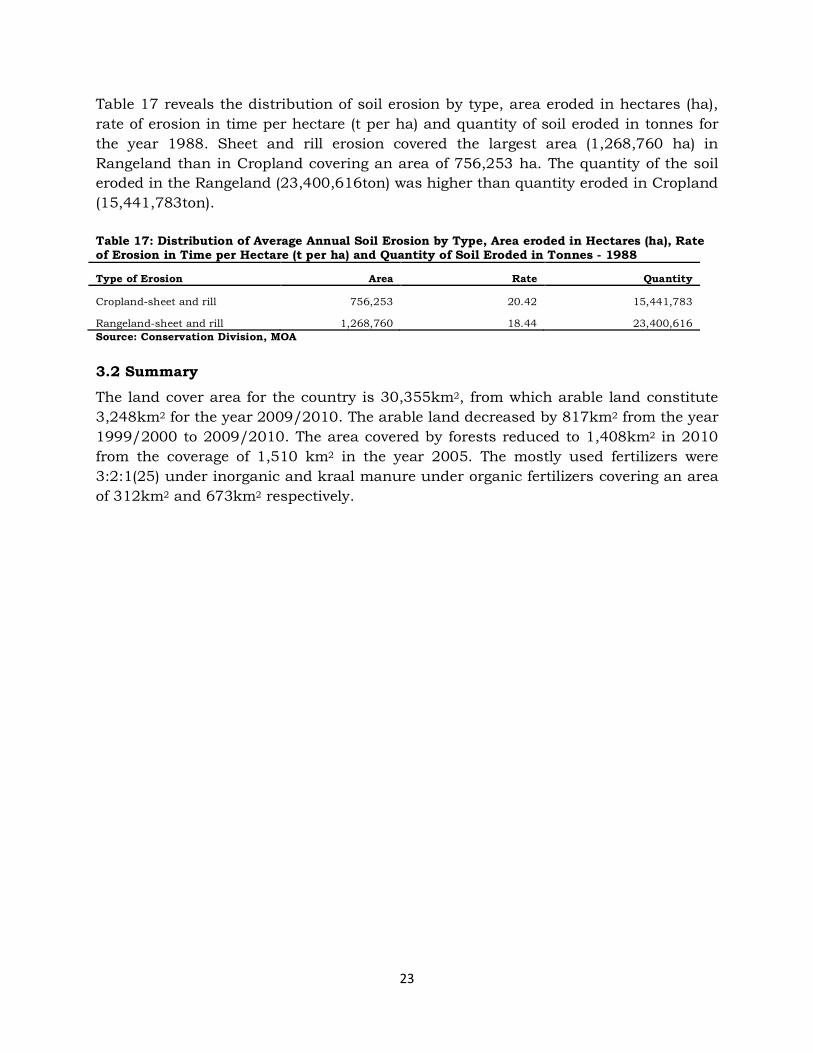
Table 17 reveals the distribution of soil erosion by type, area eroded in hectares (ha), rate of erosion in time per hectare (t per ha) and quantity of soil eroded in tonnes for the year 1988. Sheet and rill erosion covered the largest area (1,268,760 ha) in Rangeland than in Cropland covering an area of 756,253 ha. The quantity of the soil eroded in the Rangeland (23,400,616ton) was higher than quantity eroded in Cropland (15,441,783ton). Table 17: Distribution of Average Annual Soil Erosion by Type, Area eroded in Hectares (ha), Rate of Erosion in Time per Hectare (t per ha) and Quantity of Soil Eroded in Tonnes - 1988
Type of Erosion Area Rate Quantity
Cropland-sheet and rill 756,253 20.42 15,441,783
Rangeland-sheet and rill 1,268,760 18.44 23,400,616 Source: Conservation Division, MOA
3.2 Summary
The land cover area for the country is 30,355km2, from which arable land constitute 3,248km2 for the year 2009/2010. The arable land decreased by 817km2 from the year 1999/2000 to 2009/2010. The area covered by forests reduced to 1,408km2 in 2010 from the coverage of 1,510 km2 in the year 2005. The mostly used fertilizers were 3:2:1(25) under inorganic and kraal manure under organic fertilizers covering an area of 312km2 and 673km2 respectively.
24
CHAPTER 4
AIR AND CLIMATE CHANGE STATISTICS
4.0 Introduction Air is made up of approximately 78.0 percent of Nitrogen (N2), 21.0 percent of Oxygen (O2) and 1.0 percent of other gases. Air Statistics refers to data on factors affecting the quality of air such as emissions of Greenhouse Gases (GHGs) and their sources, population and their effects on the environment. Air emissions predominantly arise from the combustion of fossil fuels mainly in; transport, agricultural, industrial and manufacturing, and other kind of fuel combustion activities. These activities generate a variety of air pollutants and amongst the most significant ones are the following emissions (collectively known as greenhouse gases):
As these GHGs are emitted to the atmosphere, they cause the sun’s heat being trapped more than the earth actually needs, hence this causes climate change. Climate change is characterized by the occurrence of natural disasters (extreme weather conditions, floods and storms).
4.1 Results
The section consists of results on emissions of greenhouse gases and climate change.
4.1.1 Types of Greenhouse Gases Emissions
The following GHGs; sulphur dioxide, nitrogen oxides, non-methane volatile organic compounds, carbon dioxide, methane and nitrous oxide are discussed. These emissions arise from different sources like transport, waste, agriculture, manufacturing industries and construction.
25
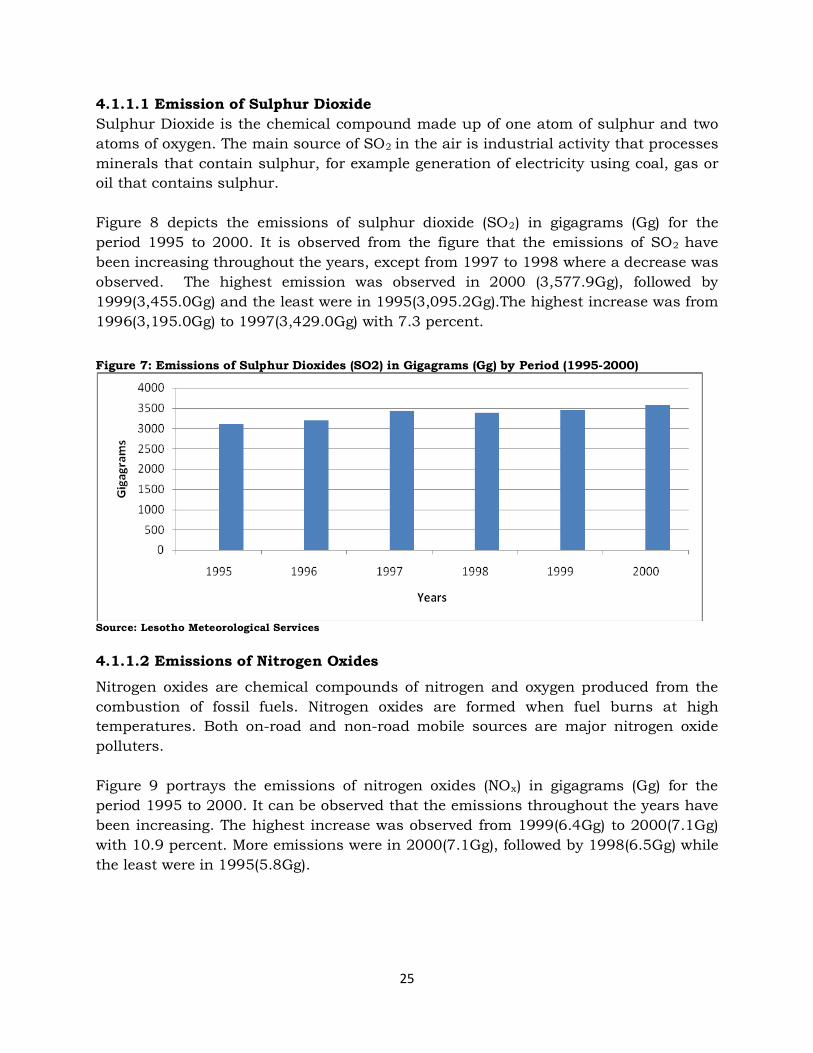
4.1.1.1 Emission of Sulphur Dioxide Sulphur Dioxide is the chemical compound made up of one atom of sulphur and two atoms of oxygen. The main source of SO2 in the air is industrial activity that processes minerals that contain sulphur, for example generation of electricity using coal, gas or oil that contains sulphur. Figure 8 depicts the emissions of sulphur dioxide (SO2) in gigagrams (Gg) for the period 1995 to 2000. It is observed from the figure that the emissions of SO2 have been increasing throughout the years, except from 1997 to 1998 where a decrease was observed. The highest emission was observed in 2000 (3,577.9Gg), followed by 1999(3,455.0Gg) and the least were in 1995(3,095.2Gg).The highest increase was from 1996(3,195.0Gg) to 1997(3,429.0Gg) with 7.3 percent. Figure 7: Emissions of Sulphur Dioxides (SO2) in Gigagrams (Gg) by Period (1995-2000)
Source: Lesotho Meteorological Services
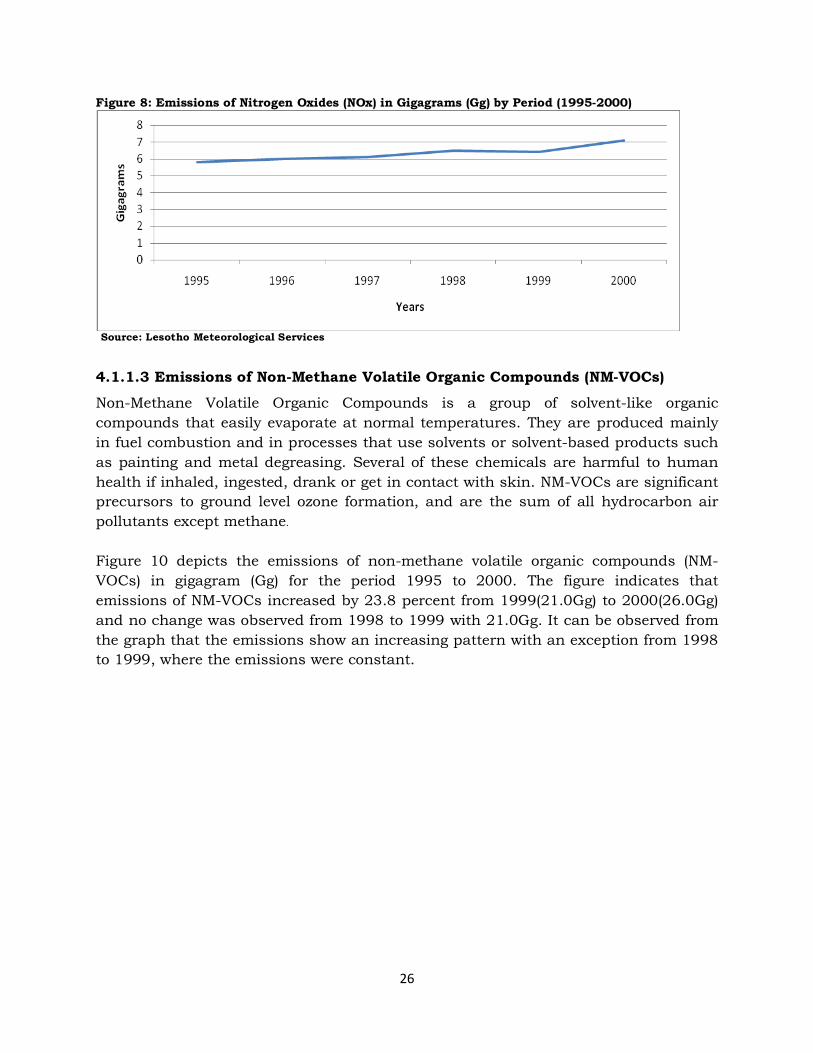
4.1.1.2 Emissions of Nitrogen Oxides
Nitrogen oxides are chemical compounds of nitrogen and oxygen produced from the combustion of fossil fuels. Nitrogen oxides are formed when fuel burns at high temperatures. Both on-road and non-road mobile sources are major nitrogen oxide polluters. Figure 9 portrays the emissions of nitrogen oxides (NOx) in gigagrams (Gg) for the period 1995 to 2000. It can be observed that the emissions throughout the years have been increasing. The highest increase was observed from 1999(6.4Gg) to 2000(7.1Gg) with 10.9 percent. More emissions were in 2000(7.1Gg), followed by 1998(6.5Gg) while the least were in 1995(5.8Gg).
26
Figure 8: Emissions of Nitrogen Oxides (NOx) in Gigagrams (Gg) by Period (1995-2000)
Source: Lesotho Meteorological Services
4.1.1.3 Emissions of Non-Methane Volatile Organic Compounds (NM-VOCs)
Non-Methane Volatile Organic Compounds is a group of solvent-like organic compounds that easily evaporate at normal temperatures. They are produced mainly in fuel combustion and in processes that use solvents or solvent-based products such as painting and metal degreasing. Several of these chemicals are harmful to human health if inhaled, ingested, drank or get in contact with skin. NM-VOCs are significant precursors to ground level ozone formation, and are the sum of all hydrocarbon air pollutants except methane.
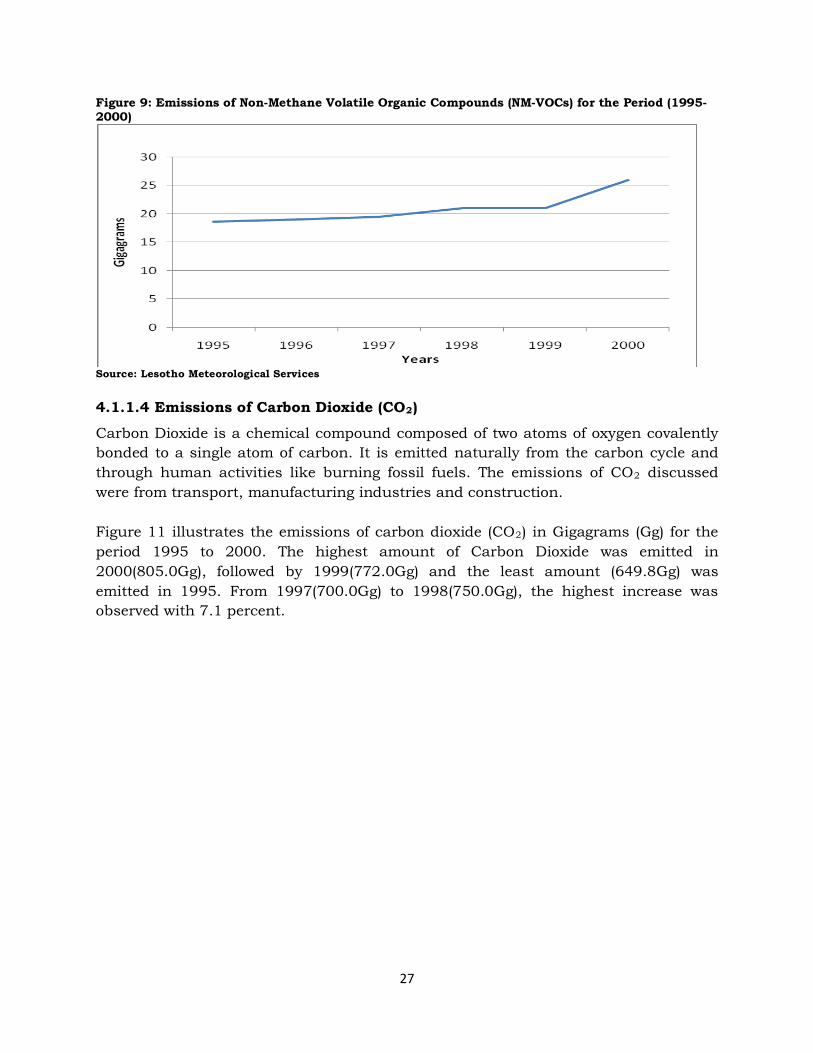
Figure 10 depicts the emissions of non-methane volatile organic compounds (NM-VOCs) in gigagram (Gg) for the period 1995 to 2000. The figure indicates that emissions of NM-VOCs increased by 23.8 percent from 1999(21.0Gg) to 2000(26.0Gg) and no change was observed from 1998 to 1999 with 21.0Gg. It can be observed from the graph that the emissions show an increasing pattern with an exception from 1998 to 1999, where the emissions were constant.
27
Figure 9: Emissions of Non-Methane Volatile Organic Compounds (NM-VOCs) for the Period (1995-2000)
Source: Lesotho Meteorological Services
4.1.1.4 Emissions of Carbon Dioxide (CO2)
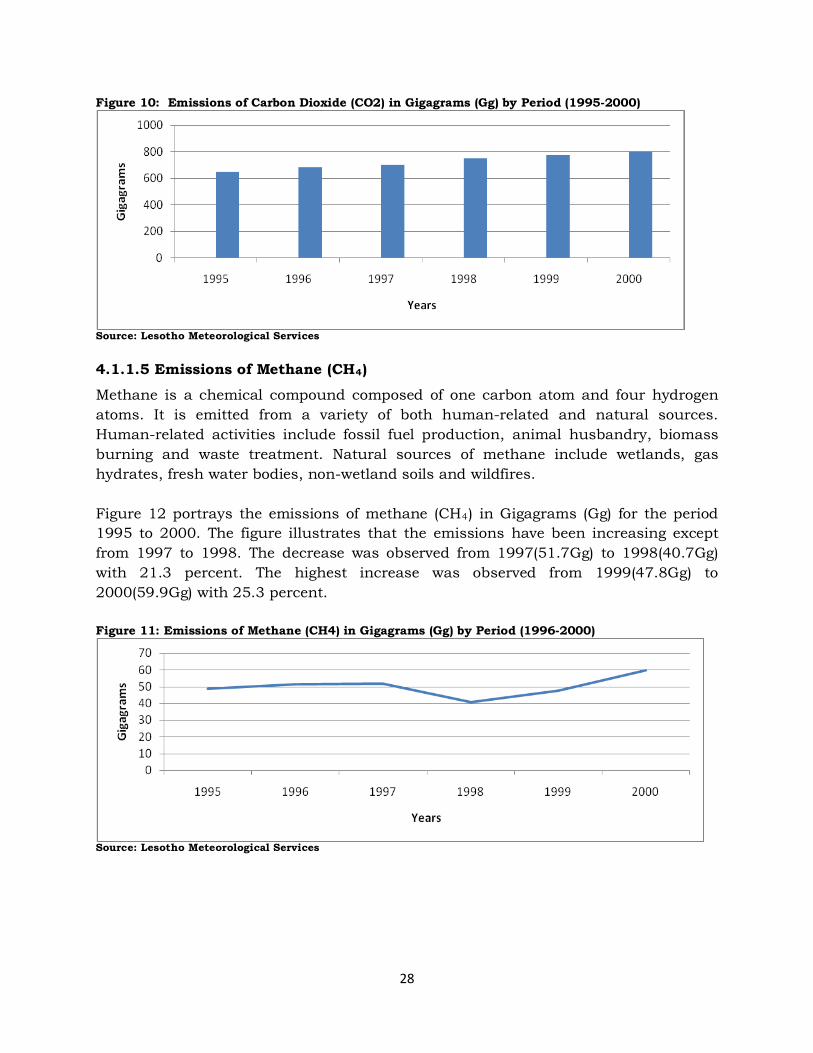
Carbon Dioxide is a chemical compound composed of two atoms of oxygen covalently bonded to a single atom of carbon. It is emitted naturally from the carbon cycle and through human activities like burning fossil fuels. The emissions of CO2 discussed were from transport, manufacturing industries and construction. Figure 11 illustrates the emissions of carbon dioxide (CO2) in Gigagrams (Gg) for the period 1995 to 2000. The highest amount of Carbon Dioxide was emitted in 2000(805.0Gg), followed by 1999(772.0Gg) and the least amount (649.8Gg) was emitted in 1995. From 1997(700.0Gg) to 1998(750.0Gg), the highest increase was observed with 7.1 percent.
28
Figure 10: Emissions of Carbon Dioxide (CO2) in Gigagrams (Gg) by Period (1995-2000)
Source: Lesotho Meteorological Services
4.1.1.5 Emissions of Methane (CH4)
Methane is a chemical compound composed of one carbon atom and four hydrogen atoms. It is emitted from a variety of both human-related and natural sources. Human-related activities include fossil fuel production, animal husbandry, biomass burning and waste treatment. Natural sources of methane include wetlands, gas hydrates, fresh water bodies, non-wetland soils and wildfires. Figure 12 portrays the emissions of methane (CH4) in Gigagrams (Gg) for the period 1995 to 2000. The figure illustrates that the emissions have been increasing except from 1997 to 1998. The decrease was observed from 1997(51.7Gg) to 1998(40.7Gg) with 21.3 percent. The highest increase was observed from 1999(47.8Gg) to 2000(59.9Gg) with 25.3 percent. Figure 11: Emissions of Methane (CH4) in Gigagrams (Gg) by Period (1996-2000)
Source: Lesotho Meteorological Services
29
4.1.1.6 Emissions of Nitrous Oxide (N2O)
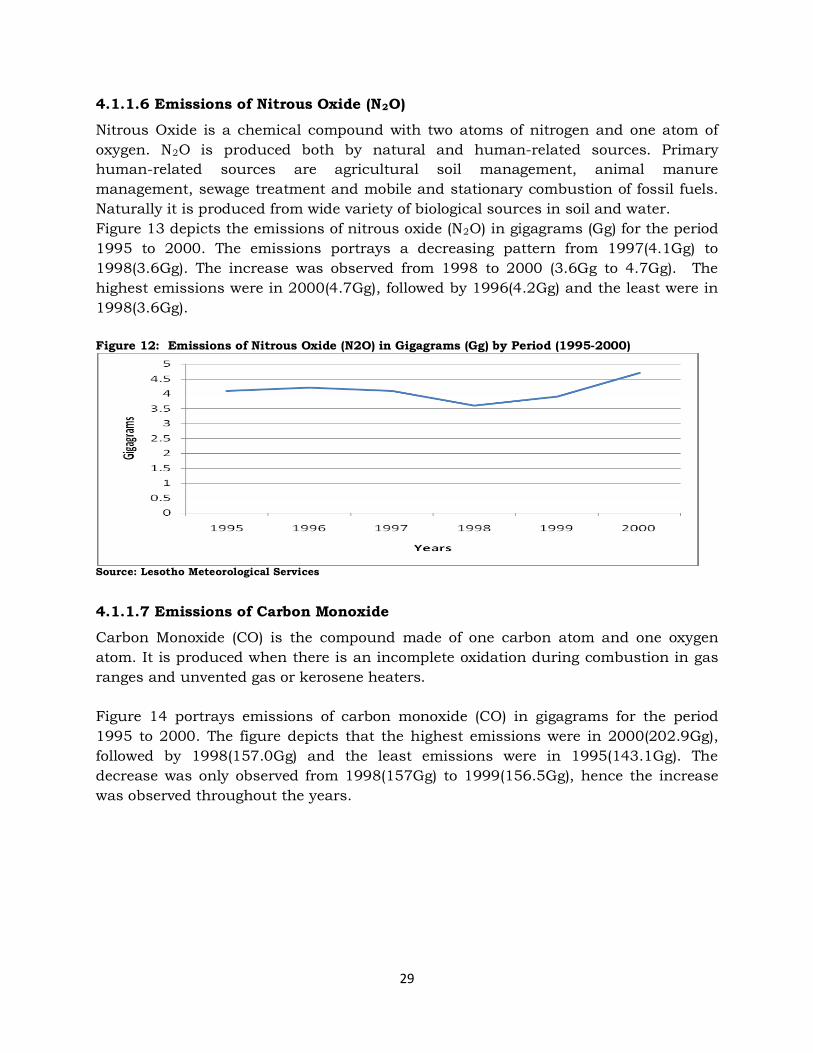
Nitrous Oxide is a chemical compound with two atoms of nitrogen and one atom of oxygen. N2O is produced both by natural and human-related sources. Primary human-related sources are agricultural soil management, animal manure management, sewage treatment and mobile and stationary combustion of fossil fuels. Naturally it is produced from wide variety of biological sources in soil and water. Figure 13 depicts the emissions of nitrous oxide (N2O) in gigagrams (Gg) for the period 1995 to 2000. The emissions portrays a decreasing pattern from 1997(4.1Gg) to 1998(3.6Gg). The increase was observed from 1998 to 2000 (3.6Gg to 4.7Gg). The highest emissions were in 2000(4.7Gg), followed by 1996(4.2Gg) and the least were in 1998(3.6Gg). Figure 12: Emissions of Nitrous Oxide (N2O) in Gigagrams (Gg) by Period (1995-2000)
Source: Lesotho Meteorological Services
4.1.1.7 Emissions of Carbon Monoxide
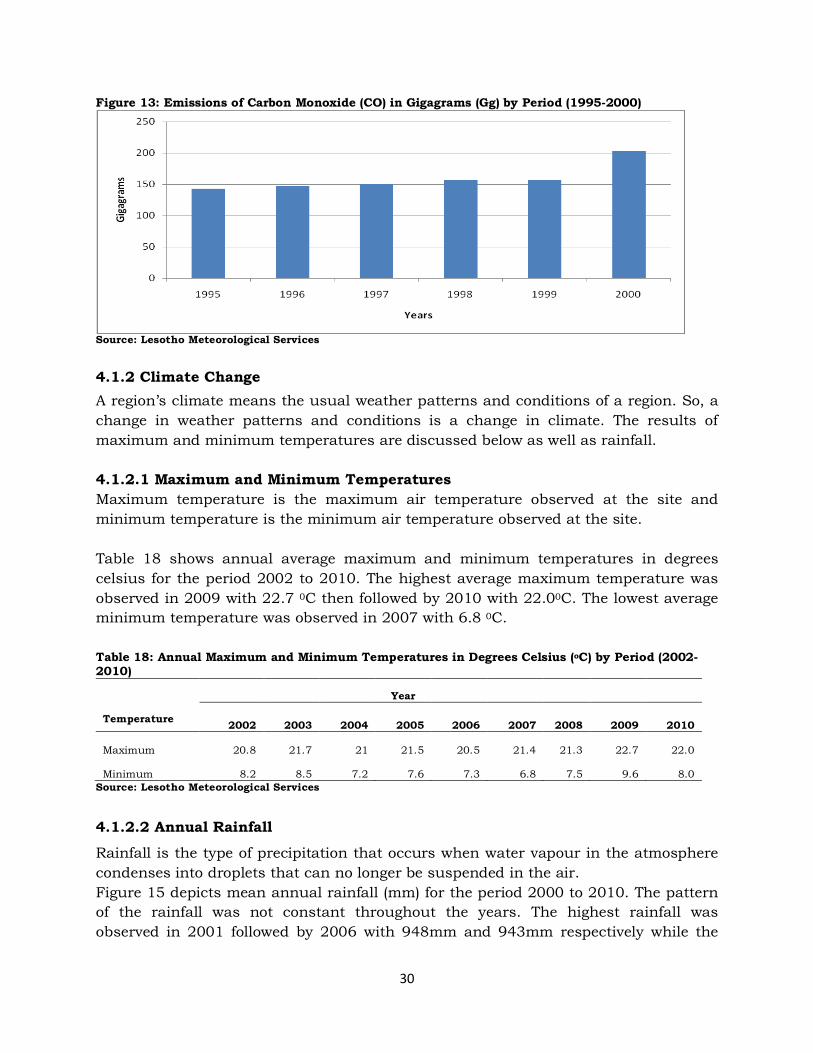
Carbon Monoxide (CO) is the compound made of one carbon atom and one oxygen atom. It is produced when there is an incomplete oxidation during combustion in gas ranges and unvented gas or kerosene heaters. Figure 14 portrays emissions of carbon monoxide (CO) in gigagrams for the period 1995 to 2000. The figure depicts that the highest emissions were in 2000(202.9Gg), followed by 1998(157.0Gg) and the least emissions were in 1995(143.1Gg). The decrease was only observed from 1998(157Gg) to 1999(156.5Gg), hence the increase was observed throughout the years.
30
Figure 13: Emissions of Carbon Monoxide (CO) in Gigagrams (Gg) by Period (1995-2000)
Source: Lesotho Meteorological Services
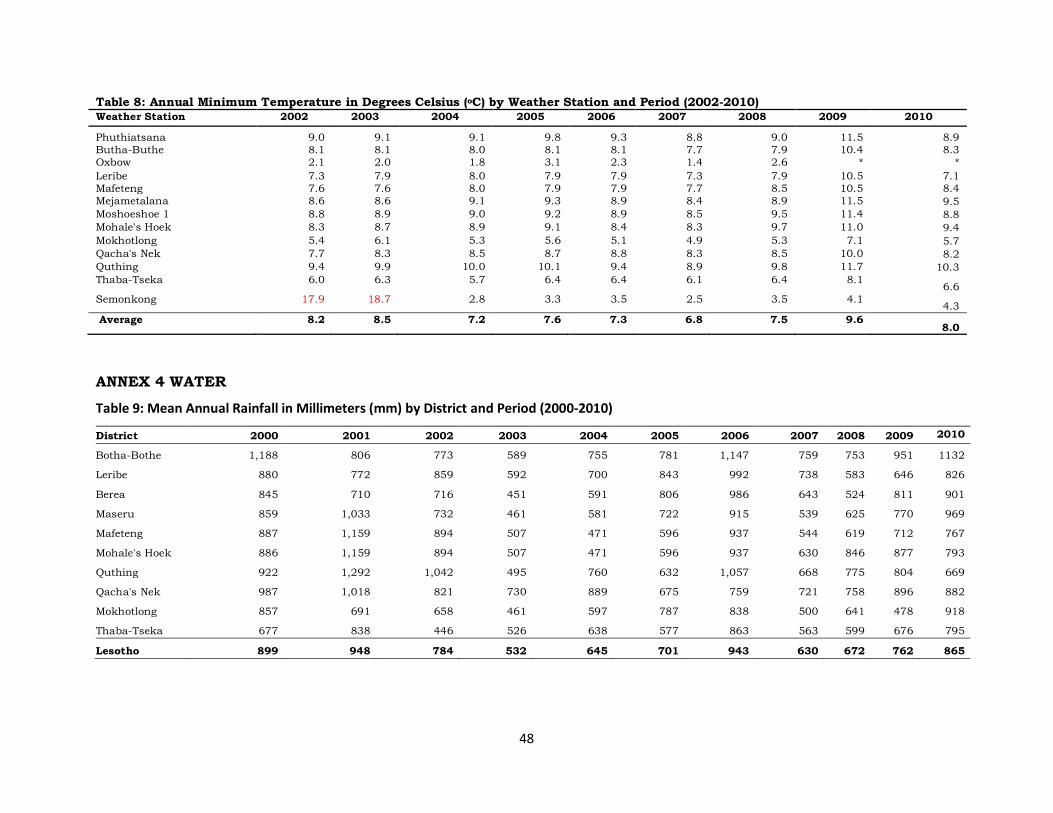
4.1.2 Climate Change A region’s climate means the usual weather patterns and conditions of a region. So, a change in weather patterns and conditions is a change in climate. The results of maximum and minimum temperatures are discussed below as well as rainfall. 4.1.2.1 Maximum and Minimum Temperatures Maximum temperature is the maximum air temperature observed at the site and minimum temperature is the minimum air temperature observed at the site. Table 18 shows annual average maximum and minimum temperatures in degrees celsius for the period 2002 to 2010. The highest average maximum temperature was observed in 2009 with 22.7 0C then followed by 2010 with 22.00C. The lowest average minimum temperature was observed in 2007 with 6.8 0C.
Table 18: Annual Maximum and Minimum Temperatures in Degrees Celsius (oC) by Period (2002-2010)
Temperature
Year
2002 2003 2004 2005 2006 2007 2008 2009 2010
Maximum 20.8 21.7 21 21.5 20.5 21.4 21.3 22.7 22.0
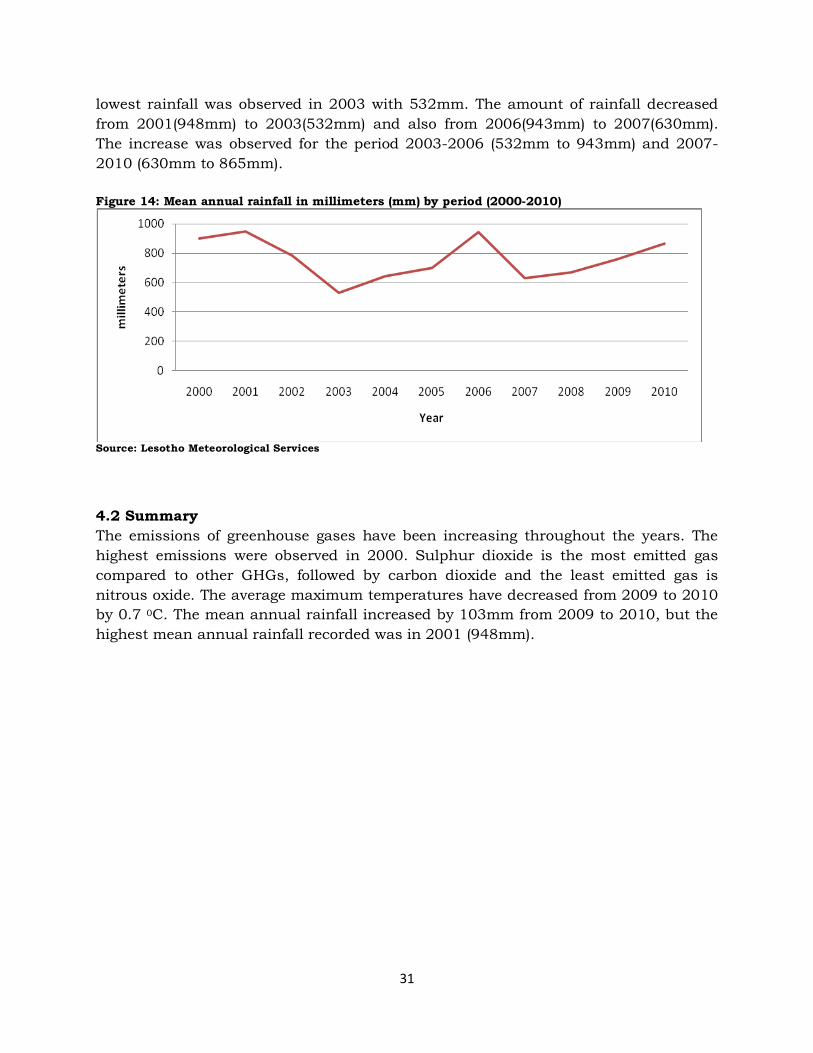
Rainfall is the type of precipitation that occurs when water vapour in the atmosphere condenses into droplets that can no longer be suspended in the air. Figure 15 depicts mean annual rainfall (mm) for the period 2000 to 2010. The pattern of the rainfall was not constant throughout the years. The highest rainfall was observed in 2001 followed by 2006 with 948mm and 943mm respectively while the
31
lowest rainfall was observed in 2003 with 532mm. The amount of rainfall decreased from 2001(948mm) to 2003(532mm) and also from 2006(943mm) to 2007(630mm). The increase was observed for the period 2003-2006 (532mm to 943mm) and 2007-2010 (630mm to 865mm). Figure 14: Mean annual rainfall in millimeters (mm) by period (2000-2010)
Source: Lesotho Meteorological Services
4.2 Summary The emissions of greenhouse gases have been increasing throughout the years. The highest emissions were observed in 2000. Sulphur dioxide is the most emitted gas compared to other GHGs, followed by carbon dioxide and the least emitted gas is nitrous oxide. The average maximum temperatures have decreased from 2009 to 2010 by 0.7 0C. The mean annual rainfall increased by 103mm from 2009 to 2010, but the highest mean annual rainfall recorded was in 2001 (948mm).
32
CHAPTER 5
WATER STATISTICS
5.0 Introduction Water is a colourless, tasteless and odourless chemical substance composed of one oxygen atom and two hydrogen atoms with the chemical formula H2O. It is important for the growth and survival of plants and animals. Water Statistics is aimed at providing data on Renewable Fresh Water Resources, Water Abstraction and Use, Waste Water Generation, Waste Water Treatment and Water Quality of Selected Rivers. Water statistics at all levels is crucial for sustainable development and management which helps in shaping policies and decision-making. The availability of Water Statistics is also valuable information for monitoring the achievement of Millennium Development Goal (MDG) 7, Target 7.C which states “nations should halve, by 2015, the proportion of the population without sustainable access to safe drinking water and basic sanitation”. Some of the UN observations regarding this MDG are listed below:
• The world is on track to meet the drinking water target, though much remains to be done in some regions
• Accelerated and targeted efforts are needed to bring drinking water to all rural households
• Safe water supply remains a challenge in many parts of the world
• With half the population of developing regions without sanitation, the 2015 target appears to be out of reach
• Disparities in urban and rural sanitation coverage remain daunting
• Improvements in sanitation are bypassing the poor.
5.1 Results
The analysis on water statistics by charts and tables is presented. The results show water resource, water export, water treatment and water quality.
5.1.1 Water Resource
Water resources are sources of water that are potentially useful to humans. It is naturally replenished by precipitation in a form of rain, hail, snow, frost and dew.
Table 19 shows mean annual rainfall in millimeters (mm) by district for the period 2000 to 2010. On average, the highest amount of rainfall was experienced in 2001 and 2006 with 948mm and 943mm respectively. The least average amount of rainfall was experienced in 2003 with 532mm. In 2009 and 2010, Botha-Bothe district seemed to have experienced the highest rainfall with 951mm and 1,132mm respectively. In 2009, Mokhotlong experienced the least rainfall (478mm) while Quthing experienced lowest rainfall in 2010 (669mm). Table 19: Mean Annual Rainfall in Millimeters (mm) by District and Period (2000-2010) District 2000 2001 2002 2003 2004 2005 2006 2007 2008 2009 2010 Botha-Bothe 1,188 806 773 589 755 781 1,147 759 753 951 1132
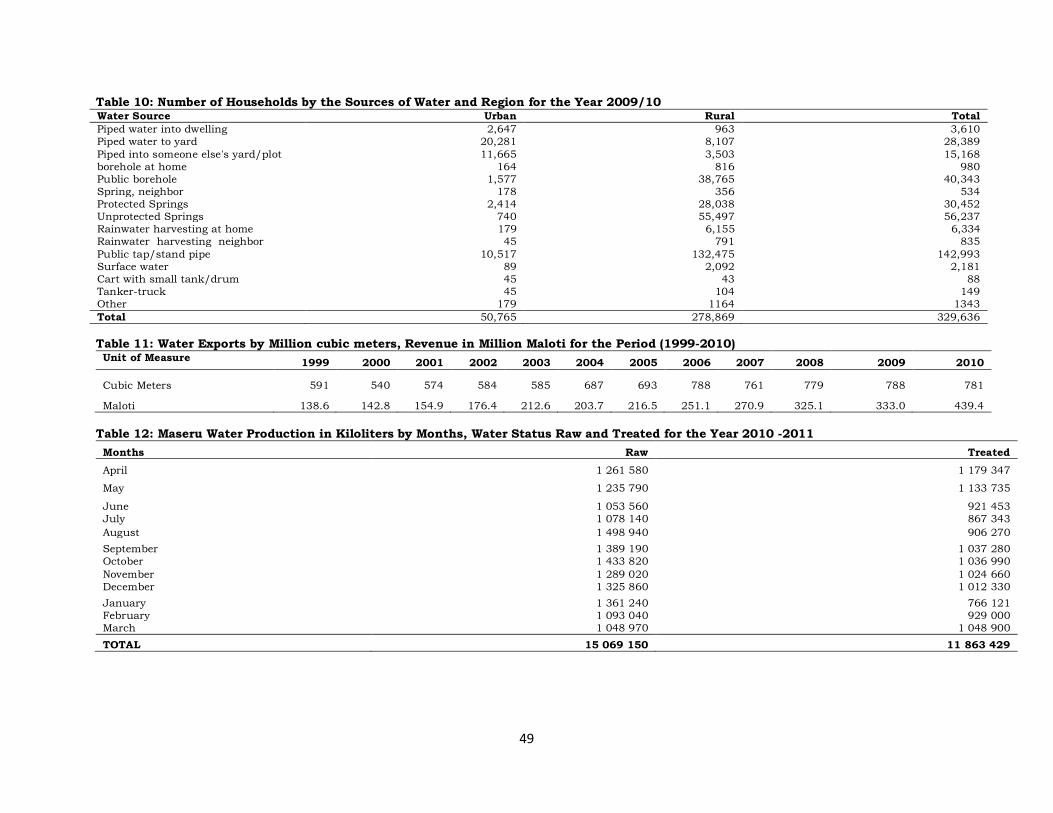
Drinking water comes from surface and ground water. The sources of drinking water include rivers, lakes, streams, ponds, reservoirs and springs. 5.1.2.1 Main Sources of Drinking Water in Urban/Rural Residence Table 20 indicates percentage distribution of households by sources of drinking water and residence for the period 2009/2010. The table reveals that most households in urban residence used Piped Water to yard or plot (40.0 percent) followed by those who used water from Neighbours’ yards or plot (23.0 percent). However, in rural residence majority of households used Public tap/standpipe as source of drinking water (47.5 percent). It can also be observed from the table that most households in rural residence used water from Unprotected spring with 17.7 percent.
34
Table 20: Percentage Distribution of Households by Sources of Water and Urban/Rural Residence- 2009/2010 Water Source Urban Rural Total
Piped Water into dwelling 5.2 0.3 1.1 Piped water to yard or plot 40 2.9 8.6 Piped into someone else's yard/plot 23 1.3 4.6 Borehole at home 0.3 0.3 0.3 Public borehole 3.1 13.9 12.2 Well neighbour 0.4 0.1 0.2 Protected spring 4.8 8.8 8.2 Unprotected spring 1.5 17.7 15.2 Rainwater harvesting, neighbour 0.1 0.3 0.3 Public tap/standpipe 20.7 47.5 43.4 Surface water 0.2 0.8 0.7 Cart with small tank 0.1 0 0 Tanker Truck 0.1 0 0 Other 0.4 0.4 0.4
Total 100 100 100
Source: Continuous Multi-purpose Survey 2009/2010
5.1.2.2 Main Sources of Drinking Water Figure 16 displays number of households by main source of drinking water for the year 2006. It can be observed from the figure that most households (168,551) used Piped Water Community Supply as the main source of drinking water, followed by Piped Water on Premises with 71,655 households. The least number of households (4,361) used Rivers as the main source of drinking water. Figure 15: Number of Households by Main Source of Drinking Water for the year 2006
Source: 2006 Population and Housing Census
35
5.1.3 Water Exports Water export is water that is transferred from one country to the other as a commodity through pipelines. Lesotho exports water to the Republic of South Africa (RSA). Figure17 illustrates water exports in million cubic meters (mm3) for the period 1999 to 2010. It is observed from the figure that from 1999 to 2000 there was a decline of 8.6 percent (591mm3 to 540mm3) in water exported to RSA. Since 2000, water exports have been increasing except from 2006 to 2007 (788mm3 to 781mm3) whereby it decreased by 3.4 percent. The highest amount of water exported was in 2006 and 2009 with 788 mm3. Figure 16: Water Exports in Million cubic meters for the Period (1999-2010)
Source: Lesotho Highlands Development Authority
5.1.4 Water Treatment Wastewater includes substances such as human waste, food scraps, oils, soaps and chemicals. Although some people assume that rain water is fairly clean, harmful substances that wash off roads, parking lots, and rooftops can harm our rivers and lakes. The major aim of wastewater treatment is to remove as much of the suspended solids (effluent) as possible, before the remaining water is discharged back to the environment.
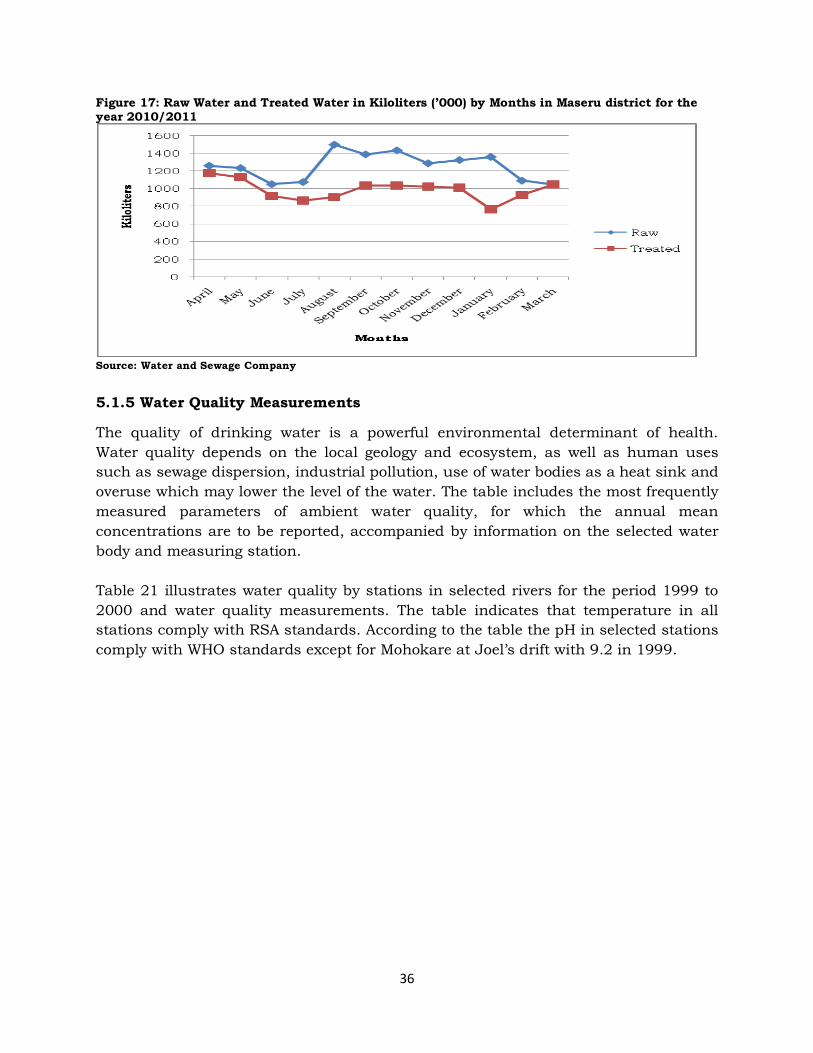
Figure 18 illustrates raw water and treated in kiloliters (’000) by months in Maseru district for the year 2010/2011. The figure reveals that water level decreased after being treated. The highest amount of water abstracted was in August followed by October with 1,498,940kl and 1,433,820kl respectively. The least water abstraction was made in March with 1,048,970kl. In April, May and June, treated water showed a decreasing pattern. From September to December, treated water showed a constant pattern.
36
Figure 17: Raw Water and Treated Water in Kiloliters (’000) by Months in Maseru district for the year 2010/2011
Source: Water and Sewage Company
5.1.5 Water Quality Measurements
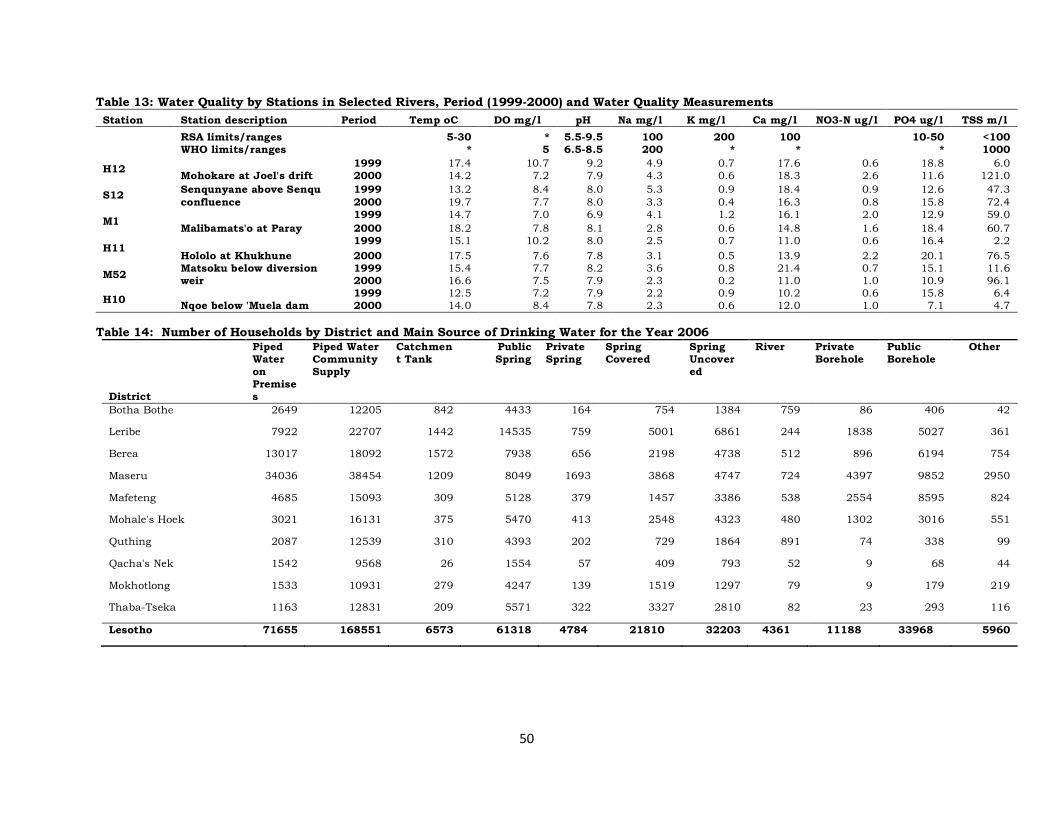
The quality of drinking water is a powerful environmental determinant of health. Water quality depends on the local geology and ecosystem, as well as human uses such as sewage dispersion, industrial pollution, use of water bodies as a heat sink and overuse which may lower the level of the water. The table includes the most frequently measured parameters of ambient water quality, for which the annual mean concentrations are to be reported, accompanied by information on the selected water body and measuring station. Table 21 illustrates water quality by stations in selected rivers for the period 1999 to 2000 and water quality measurements. The table indicates that temperature in all stations comply with RSA standards. According to the table the pH in selected stations comply with WHO standards except for Mohokare at Joel’s drift with 9.2 in 1999.
Table 21: Water Quality by Stations in Selected Rivers, Period (1999-2000) and Water Quality Measurements
Station Station description
Period
Temp oC
DO mg/
l pH Na
mg/l
K mg/
l Ca
mg/l
NO3-N
ug/l PO4 ug/l
TSS m/l
RSA limits/ranges 5-30 *
5.5-9.5 >100
>200 <100 * 10-50 <100
WHO limits/ranges * ≥5
6.5-8.5 >200 * * * * >1000
H12 Mohokare at Joel's drift
1999 17.4 10.7 9.2 4.9 0.7 17.6 0.6 18.8 6.0
2000 14.2 7.2 7.9 4.3 0.6 18.3 2.6 11.6 121.0
S12 Senqunyane above Senqu confluence
1999 13.2 8.4 8.0 5.3 0.9 18.4 0.9 12.6 47.3
2000 19.7 7.7 8.0 3.3 0.4 16.3 0.8 15.8 72.4
M1 Malibamats'o at Paray
1999 14.7 7.0 6.9 4.1 1.2 16.1 2.0 12.9 59.0
2000 18.2 7.8 8.1 2.8 0.6 14.8 1.6 18.4 60.7
H11 Hololo at Khukhune
1999 15.1 10.2 8.0 2.5 0.7 11.0 0.6 16.4 2.2
2000 17.5 7.6 7.8 3.1 0.5 13.9 2.2 20.1 76.5
M52
Matsoku below diversion weir
1999 15.4 7.7 8.2 3.6 0.8 21.4 0.7 15.1 11.6
2000 16.6 7.5 7.9 2.3 0.2 11.0 1.0 10.9 96.1
H10 Nqoe below 'Muela dam
1999 12.5 7.2 7.9 2.2 0.9 10.2 0.6 15.8 6.4
2000 14.0 8.4 7.8 2.3 0.6 12.0 1.0 7.1 4.7 Source: Lesotho Highlands Development Authority (LHDA); Water quality report, May 1999-April 2000
5.2 Summary
It is observed from the tables and figures that most people use water from community tap followed by water piped into the yard. Water quality also complies with WHO and RSA standards except for Mohokare at Joel’s drift with the pH 9.2 in 1999. The water exported decreased by 0.9 percent from 2009 to 2010. The mean annual rainfall increased by 13.5 percent from 2009 to 2010.
38
CHAPTER 6
WASTE STATISTICS
6.0 Introduction Waste refers to materials that are not prime products for which the producer has no further use for his own purpose of production, transformation or consumption. It includes all items that people no longer have any use for, which they either intend to get rid of or are required by law to discard due to their hazardous properties. Many items can be considered as waste, for example; household rubbish, sewage sludge, waste from manufacturing activities, packaging items, discarded cars, old televisions, garden waste, old paint containers and many others. Thus all daily activities can give rise to a large variety of different wastes arising from different sources. Main centers of production, consumption and urban areas naturally generate large quantities of waste, as result; major cities are facing a solid waste crisis as accessible landfills are filling up with the rapid growth of waste. It excludes residuals directly recycled or reused at the place of generation and waste materials that are directly discharged into water or air. There are two types of waste, called municipal waste and hazardous waste. Municipal waste are collected by or on behalf of municipalities and their composition include paper, paperboard, textiles, plastics, glass metals, inorganic material, organic material consisting of food and garden waste. Hazardous waste is waste that poses substantial or potential threats to public health or to the environment such as acids, flammables, pesticides and many others. However, due to data limitations hazardous waste is not covered in this report.
6.1 Results
The results indicate the population served by municipality in municipal waste collection services and total waste collected. Moreover, number of households by type of toilet facility used and by type of solid waste disposal is discussed.
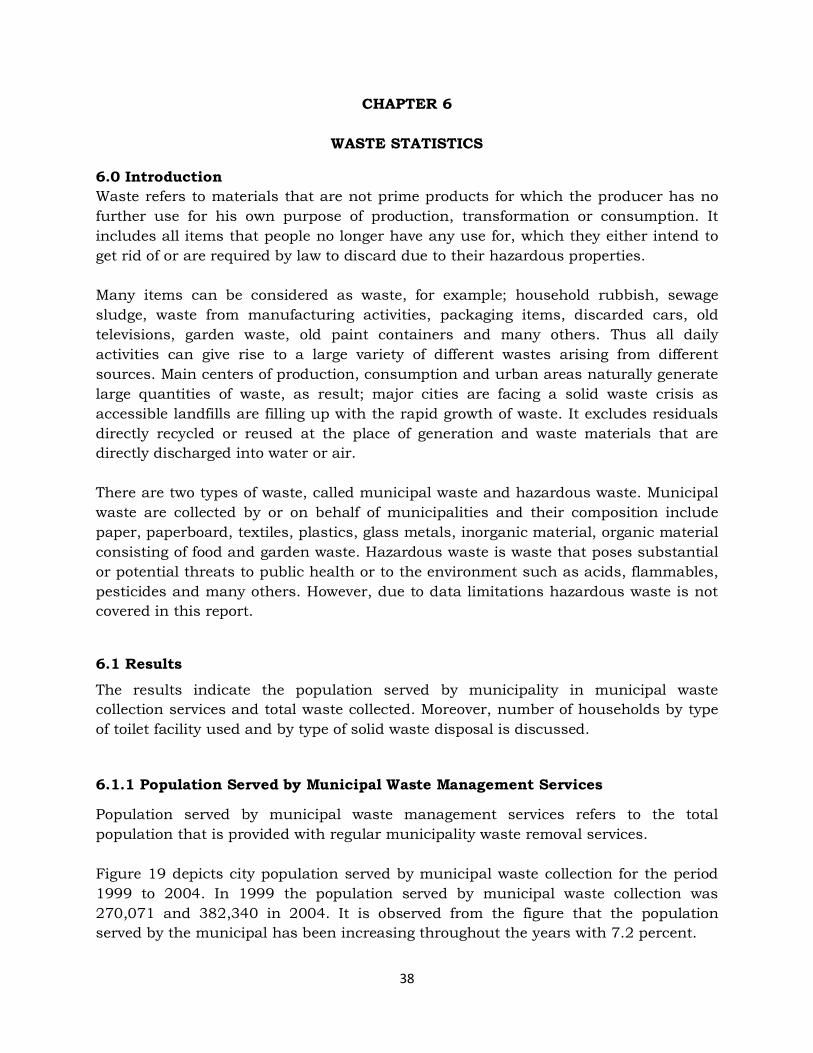
6.1.1 Population Served by Municipal Waste Management Services
Population served by municipal waste management services refers to the total population that is provided with regular municipality waste removal services. Figure 19 depicts city population served by municipal waste collection for the period 1999 to 2004. In 1999 the population served by municipal waste collection was 270,071 and 382,340 in 2004. It is observed from the figure that the population served by the municipal has been increasing throughout the years with 7.2 percent.
39
Figure 18: City Population served by Municipal Waste Collection by Period (1999-2004)
Source: Draft Hazardous waste management report and legislation (Bill and Regulations)
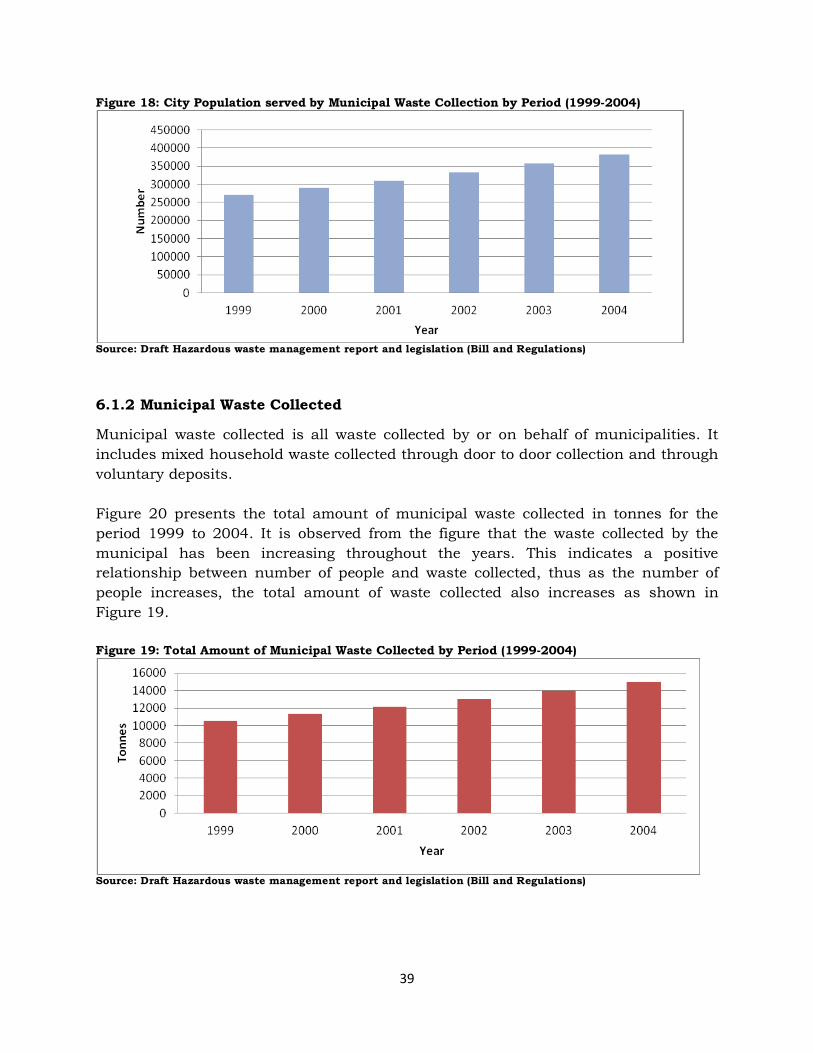
6.1.2 Municipal Waste Collected
Municipal waste collected is all waste collected by or on behalf of municipalities. It includes mixed household waste collected through door to door collection and through voluntary deposits. Figure 20 presents the total amount of municipal waste collected in tonnes for the period 1999 to 2004. It is observed from the figure that the waste collected by the municipal has been increasing throughout the years. This indicates a positive relationship between number of people and waste collected, thus as the number of people increases, the total amount of waste collected also increases as shown in Figure 19. Figure 19: Total Amount of Municipal Waste Collected by Period (1999-2004)
Source: Draft Hazardous waste management report and legislation (Bill and Regulations)
40
6.1.3 Waste Disposal
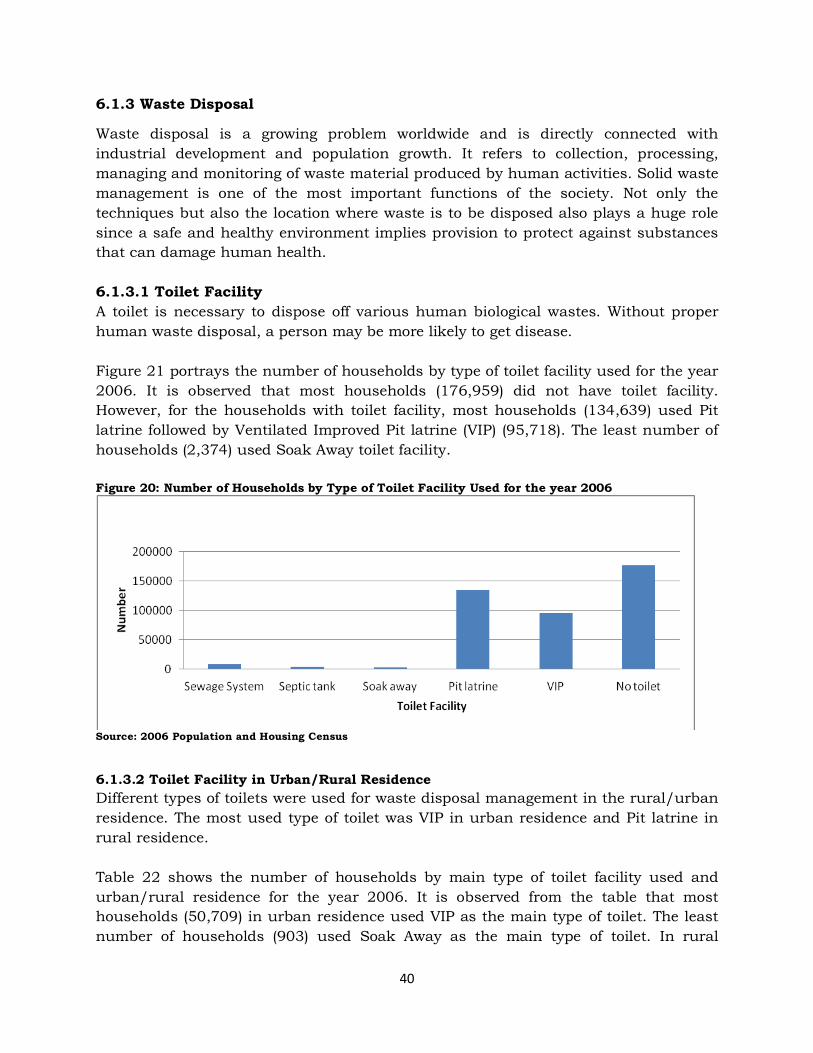
Waste disposal is a growing problem worldwide and is directly connected with industrial development and population growth. It refers to collection, processing, managing and monitoring of waste material produced by human activities. Solid waste management is one of the most important functions of the society. Not only the techniques but also the location where waste is to be disposed also plays a huge role since a safe and healthy environment implies provision to protect against substances that can damage human health. 6.1.3.1 Toilet Facility A toilet is necessary to dispose off various human biological wastes. Without proper human waste disposal, a person may be more likely to get disease. Figure 21 portrays the number of households by type of toilet facility used for the year 2006. It is observed that most households (176,959) did not have toilet facility. However, for the households with toilet facility, most households (134,639) used Pit latrine followed by Ventilated Improved Pit latrine (VIP) (95,718). The least number of households (2,374) used Soak Away toilet facility. Figure 20: Number of Households by Type of Toilet Facility Used for the year 2006
Source: 2006 Population and Housing Census
6.1.3.2 Toilet Facility in Urban/Rural Residence Different types of toilets were used for waste disposal management in the rural/urban residence. The most used type of toilet was VIP in urban residence and Pit latrine in rural residence. Table 22 shows the number of households by main type of toilet facility used and urban/rural residence for the year 2006. It is observed from the table that most households (50,709) in urban residence used VIP as the main type of toilet. The least number of households (903) used Soak Away as the main type of toilet. In rural
41
residence most of the households (164,485) did not have toilet facility and fewer households (840) used Septic tank as the main type of toilet facility. Table 22: Number of Households by Type of Toilet Facility Used and Urban/Rural Residence - 2006
Type of toilet Urban Rural
Sewage system 6,996 1,682
Septic tank 3,163 840 Soak away 903 1,471 Pit latrine 46,215 88,424 VIP 50,709 45,009 No toilet 12,474 164,485
Total 120,460 301,911 Source: 2006 Population and Housing Census
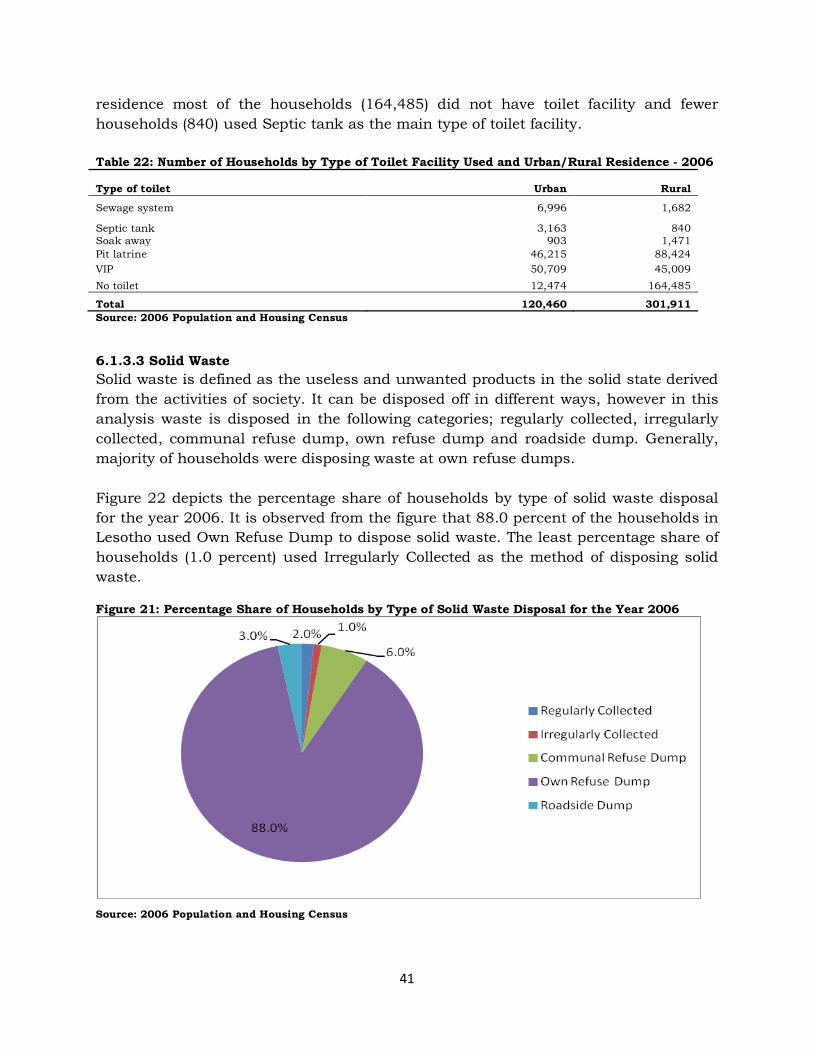
6.1.3.3 Solid Waste Solid waste is defined as the useless and unwanted products in the solid state derived from the activities of society. It can be disposed off in different ways, however in this analysis waste is disposed in the following categories; regularly collected, irregularly collected, communal refuse dump, own refuse dump and roadside dump. Generally, majority of households were disposing waste at own refuse dumps. Figure 22 depicts the percentage share of households by type of solid waste disposal for the year 2006. It is observed from the figure that 88.0 percent of the households in Lesotho used Own Refuse Dump to dispose solid waste. The least percentage share of households (1.0 percent) used Irregularly Collected as the method of disposing solid waste. Figure 21: Percentage Share of Households by Type of Solid Waste Disposal for the Year 2006
Source: 2006 Population and Housing Census
42
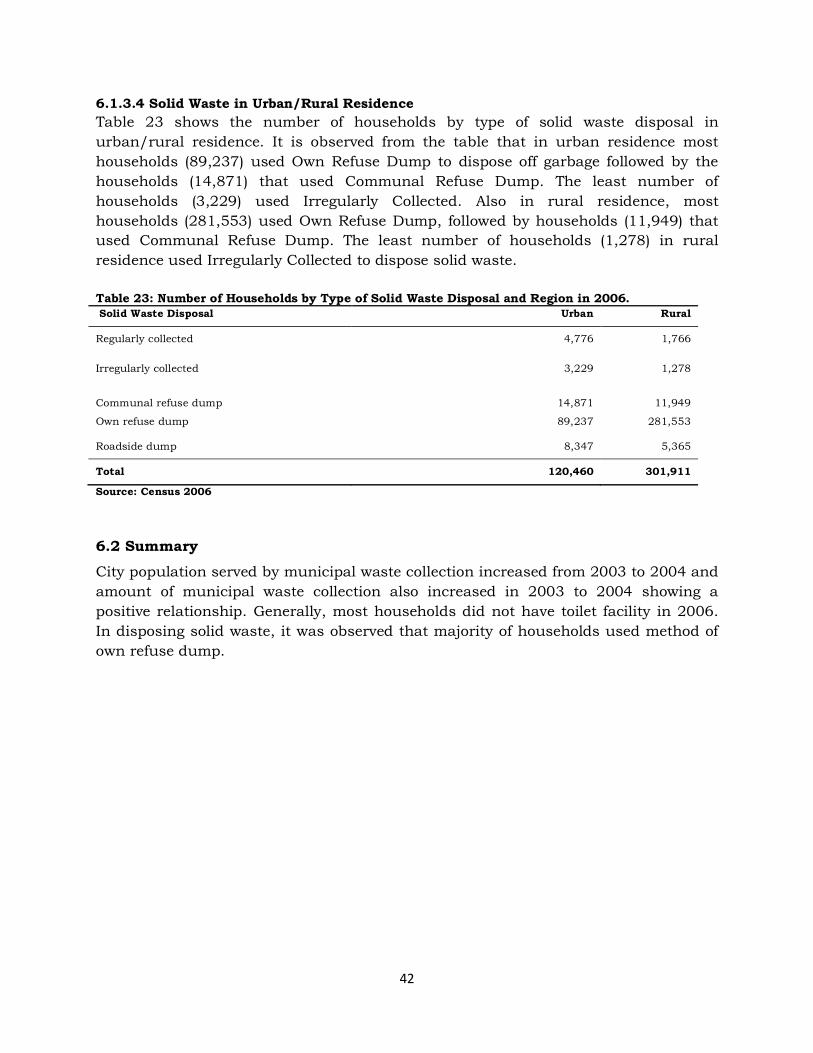
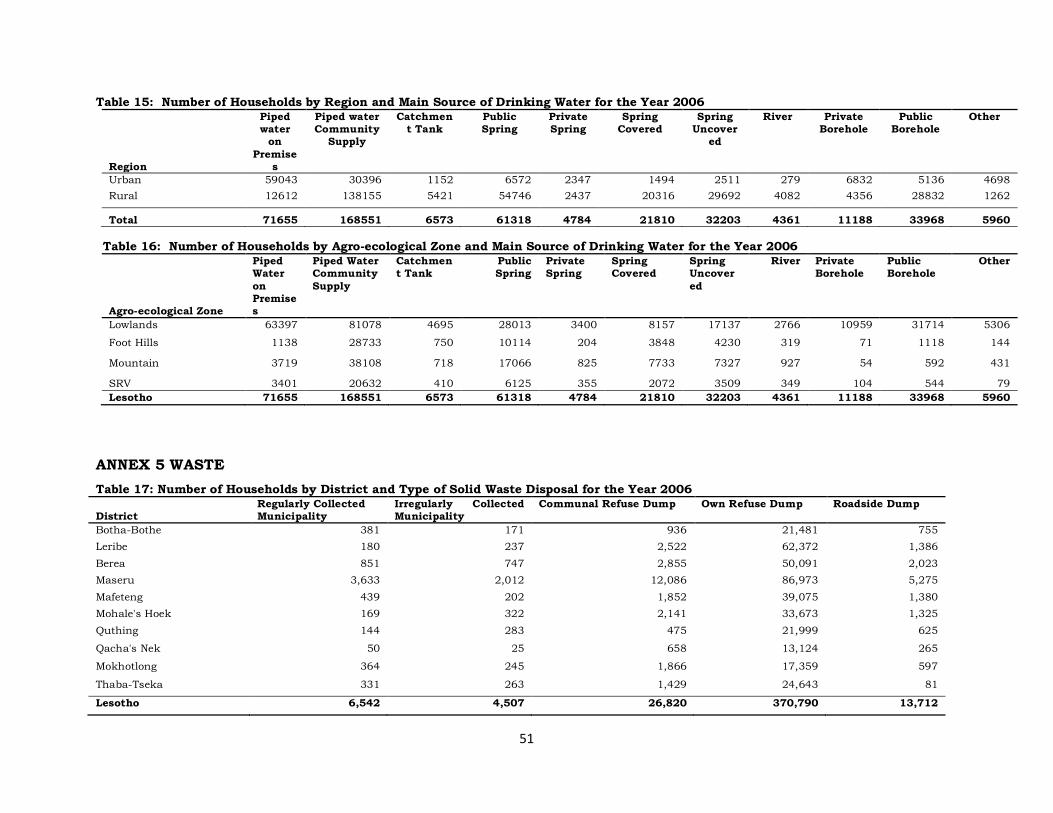
6.1.3.4 Solid Waste in Urban/Rural Residence Table 23 shows the number of households by type of solid waste disposal in urban/rural residence. It is observed from the table that in urban residence most households (89,237) used Own Refuse Dump to dispose off garbage followed by the households (14,871) that used Communal Refuse Dump. The least number of households (3,229) used Irregularly Collected. Also in rural residence, most households (281,553) used Own Refuse Dump, followed by households (11,949) that used Communal Refuse Dump. The least number of households (1,278) in rural residence used Irregularly Collected to dispose solid waste. Table 23: Number of Households by Type of Solid Waste Disposal and Region in 2006. Solid Waste Disposal Urban Rural
Regularly collected 4,776 1,766
Irregularly collected 3,229 1,278
Communal refuse dump 14,871 11,949
Own refuse dump 89,237 281,553
Roadside dump 8,347 5,365
Total 120,460 301,911
Source: Census 2006
6.2 Summary
City population served by municipal waste collection increased from 2003 to 2004 and amount of municipal waste collection also increased in 2003 to 2004 showing a positive relationship. Generally, most households did not have toilet facility in 2006. In disposing solid waste, it was observed that majority of households used method of own refuse dump.
43
CHAPTER 7
BIODIVERSITY STATISTICS
7.0 Introduction
Biodiversity is defined as the huge variety of animals, plants and other living organisms on Earth, together with the places where found. The general term ‘biodiversity indicators’ covers more than direct measures of biodiversity itself, such as species populations and extent of ecosystems. It also covers actions to ensure biodiversity conservation and sustainable use, such as the creation of protected areas and regulation of the harvesting of species, and pressures or threats to biodiversity such as habitat loss. The 1992 Convention on Biological Diversity (CBD) carries an internationally accepted definition of biodiversity as “… the variability among living organisms from all sources, inter alia, terrestrial, marine and other aquatic ecosystems and ecological complexes of which they are part, this includes diversity within species, between species and of ecosystems” (Glowka et,al., 1994).
7.1 Results
The results indicate the number of different animal species, plant species, conserved catchment area and wetlands.
7.1.1 Animal Species
There are many different types of animals in the world. Many animals are quite similar to each other while others are quite different. Animals can be divided into two categories, being vertebrates and invertebrates. Vertebrates are animals with backbone and spinal columns. The five classes of vertebrates are mammals, birds, reptiles, amphibians and fish and they were treated separately in this section. An invertebrate is an animal without a backbone such as insects, annelids (earthworms), arachnids (spiders and scorpions). Table 24 indicates animal species by type and number for the year 2000. It is observed from the table that birds had the highest number of species (318) and Fish had the least number of species (14). Birds also registered the highest number of historical species with 22 species. In overall, the current invertebrate species outnumbered current vertebrates species with 825 species.
44
Table 24: Animal Species by Type and Number - 2000
Type of Animal Species Number of current species Number of historical species
Mammals 63 19
Birds 318 22
Reptiles 40 3
Amphibians 19 *
Fish 14 *
Invertebrates 1,279 *
Total 1,733 44
Source: National Environment Secretariat
7.1.2 Vertebrates Status
Vertebrates status refers to the availability of vertebrates in every living day. For the discussion of the present status of vertebrates, the convenient and simple coding was used as follows; Abundant (species likely to be encountered in significant or even large numbers through Lesotho or in certain areas of Lesotho), Common (species frequently encountered), Uncommon (species infrequently encountered, or species common only in a restricted location), Rare (species for which there have been less than 10 reliable records since 1950), Single Record (species for which there has been only a single record since 1950), and Historical (all records for species in Lesotho that are earlier than 1950). Table 25 presents vertebrates status by type for the year 2000. It is observed from the table that the most common vertebrates were Birds with 86 species and the least common were Amphibians with 2 species. The table further shows that there were 41 single records of Birds and only 2 species of Amphibians. Table 25: Vertebrates Status by Type - 2000
Status
Vertebrates Type Abundant Common Uncommon Rare Single Record Historical Total Mammals 3 10 15 27 8 19 82
Birds 30 86 81 80 41 22 340
Reptiles 3 11 1 16 9 3 43
Amphibians 6 2 4 5 2 * 19
Fish 1 8 5 * * * 14 Source: National Environment Secretariat
45
7.1.3 Plant Species
Plants are a group of living organisms that are typically characterized by their green colour. They include common groups such as trees, herbs flowers and ferns and algae. Different types of plants are discussed as the following; Thallophytes (referred to as lower plants and these are organisms that includes micro-organisms such as yeasts, as well as more familiar mushrooms), Bryothytes (refer to all land plants that do not have true vascular tissue), Pteridophytes (plants with tissues which conduct water and nutrients), Gymnosperms (seed bearing but non-flowering plants) and Angiosperms (flowering plants). Table 26 shows the plant species by type and number for the year 2000. The table depicts that Angiosperms has the highest number of species (2,535) followed by Bryothytes with 279 species. The least number of species was Gymnosperms (62). There were 172 numbers of subspecies for Angiosperms and only 1 subspecies for both Pteridophytes and Gymnosperms.
Table 26: Plant Species by Type and Number - 2000
Type of Plant Species
Number of
species
Number of
subspecies
THALLOPHYTES (Algae and Fungi) 132 *
BRYOTHYTES- (Mosses, Liverworts and Hornworts) 279 3
PTERIDOPHYTES (ferns and fern allies) 85 1
GYMNOSPERMS 62 1
ANGIOSPERMS- (Monocotyledons and Dicotyledons) 2,535 172
TOTAL 3,093 177
Source: National Environment Secretariat
7.1.4 Ecosystem Status of Vegetation
Vegetation status refers to the situation in which the particular vegetation is at. The status were described as; Critically Endangered (vegetation type for which there is less habitat left than that required to ensure representation of 75.0 percent of species diversity), Endangered (types with less remaining area than the area represented by the target plus an additional 15.0 percent of the historic distribution), Vulnerable (types with less than 60.0 percent of the historic extent remaining) and Least Threatened (types with more than 60.0 percent of the historic extent remaining). Table 27 shows ecosystem status of vegetation type for the year 2007. It shows that there were 44 vegetation types in the entire Maluti-Drakensberg Transfrontier Project (MDTP) area of which 34 percent of them were Critically Endangered and Least Threatened. It further indicates that Least Threatened vegetation had the smallest
percentage in both historic and current distribution with 10 percent and 7 percent respectively. Table 27: Ecosystem Status of Vegetation Types - 2007
Status Entire MDTP area (Lesotho & RSA)
Types with >50% historic distribution in Lesotho portion
Types with >50% current distribution in Lesotho portion
Critically Endangered 15 (34%) 15 (50%) 15 (54%)
Endangered 8 (18%) 7 (23%) 7 (25%)
Vulnerable 6 (14%) 5 (17%) 4 (14%)
Least Threatened 15 (34%) 3 (10%) 2 (7%)
Total 44 (100%) 30(100%) 28(100%) Source: National Environment Secretariat
7.1.5 Area of Trees Planted and Survived
Area of trees planted is an area that was planted with trees. Area of trees survived is an area of survived trees out of total area of trees planted. Figure 23 presents the area of trees planted and survived by district for the period 1995/1996. It can be seen from the figure that most trees were planted in Leribe followed by Maseru, covering an area of 3,065ha and 2,478ha respectively. The least area of trees planted was observed in Mokhotlong covering an area of 44ha. Mohale’s Hoek registered the highest percentage (91.1) area of trees survived while Qacha’s Nek registered the least percentage (16.3). Figure 22: Area of Trees Planted and Survived by District - 1995/1996
Source: Ministry of Forestry and Land Reclamation
47
7.1.6 Area of Tree Species Survived
Area of tree species survived refers to the total area of planted trees minus total area of trees failed classified in different tree species (eucalyptus, pine and other trees). Figure 24 depicts the area of trees survived by type of species for the period 1995/1996. It is generally observed from the figure that area stocked with Eucalyptus dominated all species in Botha Bothe (351ha), Leribe (1,241ha) and Berea (509ha). On contrary, areas stocked with Pine in Maseru (927ha), Mafeteng (289ha), Mohale’s Hoek (263ha), Quthing (350ha) and Qacha’s Nek (29ha) dominated area stocked with other species. However, in Mokhotlong and Thaba-Tseka, area stocked with ‘Other’ species dominated area stocked with Pine and Eucalyptus with 16ha and 33ha respectively. Figure 23: Area of Trees Survived by District and Type of Species - 1995/1996
Source: Ministry of Forestry and Land Reclamation
7.1.7 Conserved Catchment Area
These were the identified eroded areas and different conservation structures were used to normalize the originality of such areas and to prevent further soil erosion. Conservation method structures included silt traps, gabions, diversion, grass sodding and stone line. Figure 25 presents the catchment area in hectares (ha) conserved for the period 2007/2008 to 2009/2010. During 2007/2008 period the total conserved catchment area was 64,499ha and it increased by 21 percent in 2008/2009. An aggregate area of 81,055ha was conserved at the end of 2009/2010.
48
Figure 24: Catchment Areas in Hectares (ha) Conserved by Period (2007/08 - 2009/10)
Source: Ministry of Forestry and Land Reclamation
7.1.8 Areal Distribution of Wetland Types across the MDTP Planning Domain
There are five wetland systems found in Southern Africa (marine, estuarine, riverine, lacustrine and palustrine), only three systems are found in Lesotho – palustrine, lacustrine and riverine. However, the variables used to predict the distributions of wetlands types in this section included mean annual precipitation, heat units, maximum temperature in June and mean temperature in June. Table 28 indicates areal distribution across the MDTP planning domain in hectares (ha) by Wetland Types in 2007. The table shows that C4 grasses/sedge wetlands occupied the largest area in MDTP with 44,363.12ha and Lesotho’s area within this area constituted 21,768.55ha. On the other hand, C3 grasses/short sedge wetlands occupied the smallest area (238.21ha) in MDTP. Table 28: Areal Distribution across the MDTP Planning Domain in Hectares (ha) by Wetland Types - 2007
Total 135,888.82 47,645.45 Source: National Environment Secretariat
49
7.2 Summary
From the results discussed above, it can be concluded that plants species constitute the highest percentage as compared to animal species. Also out of the total area (10,362ha) of trees planted only 6,130ha survived in the year 1995/1996.
50
REFERENCES
Chaba Mokuku, Tsepo Lepono, Second State of the Environment Report, 2002
Economic Commission for Africa, State of the Environment in Africa, Addis Ababa Ethiopia 2001
IEA Publications, Energy Statistics Manual, France 2004
Lesotho Government, 1988: National conservation Plan for Lesotho. Land Conservation
and Range Development Project, Conservation Division MOA. Maseru. Ministry of Natural Resources, National Report on Climate Change, April 2000
Reena Shar, Workshop on Environment Statistics, UNSD, Addis Ababa 16-20 July 2007 Ulrich Wieland, Environment Statistics Section Division Presentation, 2011
United Nations, Concept and Methods of Environment Statistics, Statistics of the Natural
Environment, New York 1991
Towards environmental pressure indicators for the EU 1999, First Edition http://epp.eurostat.ec.europa.eu/statistics_explained/index.php/Water_statistics
ANNEX 1 ENERGY TABLE 1: Source and Use of Electricity in Megawatt Hour (MWh) by Period (2004-2010). Source and Use of Electricity 2004 2005 2006 2007 2008 2009 2010
ANNEX 2 LAND USE Table 4: Area by Land Cover Type in Square Kilometres (Km2) and Period (1983-2010) Land Cover Type 1983 1990 2000 2005 2010
Land under Forest 378 393 415 426 437
Other Wooded Land 1,579 1,421 1,196 1,084 971
Forest and Other Wooded Land 1,957 1,814 1,611 1,510 1,408
47
Table 5: Area Affected by Salinity in Square Kilometres (Km2) by Land Cover Type and Period (1983-2010) Land Cover Type 1983 1990 2000 2005 2010
Agricultural Land (arable land) * 3,179 4,065 * 3,248
Forest and Other Wooded Land 1,957 1,814 1,611 1,510 1,408
Total Area Affected 1,957 4,993 5,676 1,510 4,656 ANNEX 3 AIR AND CLIMATE CHANGE Table 6: Emissions of Greenhouse Gases in Gigagrams (Gg) by type and Period (1995-2000)
GHGs Year
1995 1996 1997 1998 1999 2000
CO2 649.8 681 700 750 772 805
CH4 48.8 51.6 51.7 40.7 47.8 59.9
N2O 4.1 4.2 4.1 3.6 3.9 4.7
NOX 5.8 6 6.1 6.5 6.4 7.1
CO 143.1 147 150 157 156.5 202.9
NWVOCS 18.6 19 19.5 21 21 26
SO2 3,095.20 3,195 3,429 3,381 3,455 3,577.90 Table 7: Annual Maximum Temperature in Degrees Celsius (oC) by Weather Station and Period (2002-2010) Weather station 2002 2003 2004 2005 2006 2007 2008 2009 2010 Phuthiatsana 23.2 23.8 22.9 23.5 22.6 23.4 23.5 24.8 23.1 Butha-Buthe 22.2 22.8 22.1 22.6 21.3 22.4 22.3 23.1 22.3 Oxbow 14.6 15.1 14.9 15.1 14.9 14.5 14.9
Table 8: Annual Minimum Temperature in Degrees Celsius (oC) by Weather Station and Period (2002-2010) Weather Station 2002 2003 2004 2005 2006 2007 2008 2009 2010
Table 10: Number of Households by the Sources of Water and Region for the Year 2009/10 Water Source Urban Rural Total Piped water into dwelling 2,647 963 3,610 Piped water to yard 20,281 8,107 28,389 Piped into someone else's yard/plot 11,665 3,503 15,168 borehole at home 164 816 980 Public borehole 1,577 38,765 40,343 Spring, neighbor 178 356 534 Protected Springs 2,414 28,038 30,452 Unprotected Springs 740 55,497 56,237 Rainwater harvesting at home 179 6,155 6,334 Rainwater harvesting neighbor 45 791 835 Public tap/stand pipe 10,517 132,475 142,993 Surface water 89 2,092 2,181 Cart with small tank/drum 45 43 88 Tanker-truck 45 104 149 Other 179 1164 1343 Total 50,765 278,869 329,636 Table 11: Water Exports by Million cubic meters, Revenue in Million Maloti for the Period (1999-2010) Unit of Measure 1999 2000 2001 2002 2003 2004 2005 2006 2007 2008 2009 2010
Maloti 138.6 142.8 154.9 176.4 212.6 203.7 216.5 251.1 270.9 325.1 333.0 439.4 Table 12: Maseru Water Production in Kiloliters by Months, Water Status Raw and Treated for the Year 2010 -2011 Months Raw Treated April 1 261 580 1 179 347
May 1 235 790 1 133 735
June 1 053 560 921 453 July 1 078 140 867 343 August 1 498 940 906 270 September 1 389 190 1 037 280 October 1 433 820 1 036 990 November 1 289 020 1 024 660 December 1 325 860 1 012 330 January 1 361 240 766 121 February 1 093 040 929 000 March 1 048 970 1 048 900 TOTAL 15 069 150 11 863 429
50
Table 13: Water Quality by Stations in Selected Rivers, Period (1999-2000) and Water Quality Measurements Station Station description Period Temp oC DO mg/l pH Na mg/l K mg/l Ca mg/l NO3-N ug/l PO4 ug/l TSS m/l
Total 71655 168551 6573 61318 4784 21810 32203 4361 11188 33968 5960 Table 16: Number of Households by Agro-ecological Zone and Main Source of Drinking Water for the Year 2006
Table 19: City Population Served by Municipal Solid Waste Collection and Solid Waste Collected by Period (1999-2004) City Population and Waste Collected 1999 2000 2001 2002 2003 2004
Population Served by Municipal Waste Collection 270071 289516 310361 332707 356662 382340
Table 21: Plant Species by Type and Number in the Year 2000 Type of Plant Species Number of Species Number of Subspecies THALLOPHYTES (Algae and Fungi) 132 * BRYOTHYTES -(Liverworts and Hornworts) 60 1 - (Mosses) 219 2 PTERIDOPHYTES (ferns and fern allies) 85 1 GYMNOSPERMS 62 1 ANGIOSPERMS -(Monocotyledons) 776 43 -(Dicotyledons) 1759 129 TOTAL 3093 177
Table 22: Area Plantable, Planted, Survived, Stocked with; Eucalyptus, Pine and Other in Hectares (ha) and Number of Woodlots by District for the Year 1995/96 District Plantable Planted 1993/94 Survived Eucalyptus Pine Other Woodlots
Botha Bothe 1087 946 508 351 128 29 20
Leribe 3186 3065 1802 1241 495 66 77
Berea 1188 1112 808 509 289 10 68
Maseru 3953 2478 1590 534 927 129 114
Mafeteng 1078 921 455 127 289 39 37
Mohale's Hoek 689 484 441 160 263 18 51
Quthing 956 925 426 48 350 28 67
Qacha's Nek 461 211 35 2 29 4 23
Mokhotlong 143 44 21 0 5 16 13
Thaba-Tseka 254 176 49 7 9 33 15
LESOTHO 12995 10362 6135 2979 2784 372 485
54
Table 23: Distribution of the Entire Maluti-Drakensberg Transfrontier Project (MDTP) Area in Hectares (ha) by Vegetation Type Showing Historic and Current Area in the Year 2007
Vegetation Type
MDTP Historic
Area
Lesotho Historic
Area
Lesotho Historic %
Distribution
Lesotho Current
Area
MDTP Current
Area
Lesotho Current %
Distribution
Ecosystem Status in the Whole MDTP Planning Area
% Target Area
Conserved
Protection Status in the Whole MDTP Planning Area
Barkley Overgrazed Grassland 84124 1996 2.37 476 74011 0.64 Least threatened 0 Not protected