1 Draft version (Not to be quoted) Environment and Poverty: Exploring relationship between trade in natural products, cash income and livelihood in Sub tropical forest regions of Eastern India Ajay Kumar Mahapatra 1* & Charlie, M. Shackleton 2 1 Regional Plant Resources Centre, Forest & Environment Department, Nayapalli, Bhubaneswar 751 015, Orissa, India 2 Dept of Environmental Science, Rhodes University Grahamstown 6140, South Africa * Author for correspondence: Ajay Kumar Mahapatra e-mail: [email protected]fax no: (+091)6742557024 Tel: 0091674 2557925, 2552002 Key words: Natural product, Tropical forest, Eastern India, Forest Income, Livelihood.
Transcript
1
Draft version (Not to be quoted)
Environment and Poverty: Exploring relationship between trade in natural products, cash income and livelihood in Sub tropical forest regions of
Eastern India
Ajay Kumar Mahapatra1* & Charlie, M. Shackleton2
1 Regional Plant Resources Centre, Forest & Environment Department, Nayapalli,
Bhubaneswar 751 015, Orissa, India
2 Dept of Environmental Science, Rhodes University
Key words: Natural product, Tropical forest, Eastern India, Forest Income,
Livelihood.
2
1. INTRODUCTION The relationship between biodiversity and livelihood is explored across many setting and has an established fact that environmental goods and services contributes substantially to national and rural income as well as in terms of their contribution to health, food and other aspects of rural welfare (Arnold,2002, Cavendish, 2000, World Bank 2002). While development agenda in many underdeveloped regions primarily aimed at providing capital assets as farm lands, access to capital, and technology, effort to generate economic opportunity out of processing and value addition from environmental products particularly for forest dependent rural poor has been largely ignored. That poverty in forest communities is both caused by and effect of degradation of the forest resources remains a major challenge to be addressed by resource planner (Clark, 2004). Concern over the fate of tropical forests and the people who depend on it has prompted debates on the potential of tropical forest extraction by traditional communities for rural development (Dovie, 2003, Shackleton etal., 2001). While poverty alleviation through on farm production was a major thrust in developing and poor nations world over, numerous studies demonstrated that biodiversity and wild products to be playing a significant and often a critical role for millions of poor households which can act as an window of opportunities to address rural poverty (Belcher etal., 2005; Belcher and Schreckenberg 2007; Fisher, 2004; Mcsweeny 2004). The added advantage would be if poverty can be alleviated through harvesting forest products that are less destructive, then there will be greater incentive to conserve those forests (Neumann and Hirsch, 2000). Recent rural development approaches therefore look upon biodiversity management and poverty alleviation to be intrinsically connected (Kamnga etal., 2009) which are initiated and operationalised in a sustainable livelihood and resource use approaches (Leach et al., 1997; Ellis 2000).
World over, logging and timber extraction was the major thrust of natural resource exploitation until 1980s, but interest in non timber products and services grew in 1990s with increasing awareness of tropical forest deforestation and rising acknowledgment of the need to add social value to non timber forest resources (Martinez, 2004). Further the imperative to look biodiversity conservation from rural development perspective gained strength from the realities of spatial relationship between regions rich in biodiversity and settlement of rural poor (WRI, 2000). Emerging theories on environment-development interface has prompted development planners to find solutions for rural poverty that include natural resource based activities (Adams etal., 2004: WRI, 2005, FAO 2003). Forest managers, in recent years have also begun to consider the role of natural products in rural economy, and have initiated management strategies that reflects non timber benefits of forests to community than state revenue earning objective (Scherr etal., 2004). Marketing of natural products commonly called non-wood or non-timber forest products is a thriving enterprise in many humid tropical and temperate regions which though functions on
informal, small scale and dispersed in local economies (Falconer,1997), helps income diversification. Because of low entry barriers to trade, access to common property natural resources and low capital requirements, trade in non wood products presents multiple options for livelihood improvement and poverty alleviation in under developed regions having forest vegetation. (Anglesen and Wunder 2003, Belcher etal., 2005, Sunderlin etal., 2005). The livelihood significance of biodiversity notwithstanding, human-ecology paradigm advocate the importance of cultural values (Posey 1999, Cocks and Wiersum 2003). Although the useful role of wild products for local communities has been demonstrated, the skepticism remains as to the ecological sustainability of natural product extraction and whether
3
local trade can reconcile forest conservation and poverty alleviation effectively as claimed by many (Arnold and Ruiz Perez, 1998; Ros-Tonen, 2000). But the doubt is overshadowed by the benefit derived from such products because even when it becomes a smaller portion of total household income it not only complements other livelihood activities and can provide food and nutritional security. It allows the scarce cash resources to be used for other household needs for purchase of seeds, hiring labour for cultivation, or to generate working capital for business and trading activities (Shackleton and Shackleton, 2004; Warner et al., 2008). Such resource can assist rural households to cope in times of adversity manifested as sudden changes in the economic, social or bio-physical environments in which households exist and function. It provides the poor quick cash or consumption goods especially in the event of unpredicted shortfalls, such as failure of agricultural crop or disasters (Angelsen and Wunder, 2003). Poor diversifying to making income from wild could be on account of its ‘safety net’ (Vedeld etal., 2007), or a steeping out/up strategy to increase household income to deal with poverty (Dorawrd et al., 2001). The risk-management role of forest products is particularly important in the rural regions of developing countries, given that agricultural crops face many types of risk, such as price shocks, seasonal flooding, unpredictable soil quality, pests, crop diseases or illnesses. NTFP can be used directly for consumption or sold to fill cash gaps (World Bank, 2001). Moreover, low capital and skill requirements of NTFP extraction as well as open or semi-open access to the resource, enables poor households to extract and trade in the resource (Delacote, 2008).
Deforestation and land degradation remains global challenges. While India harbors 350 million world’s poor, it has a deforestation rate of 1.29 million ha. per annum. Situation in the eastern Indian states as Orissa, Jharkhand and Chattisgarh states is alarming which has India’s maximum poor, but having substantial geographical area (25%) under sub-tropical forest cover. The three eastern Indian states have good forest cover (137,000sq. km), and ironically with largest poor concentration. In Orissa state alone of 40 million, some 45% live below official poverty line. Though the states have rich mineral deposits paradoxically is a contributing factor for conversion of forest land and can be a driver of poverty. Subsistence low input farming and heavy biomass dependence create pressure on forests, which at the same time is easily accessible natural resource for the rural poor to support their livelihood. The conservation and development dilemma is most intense in Orissa and Jharkhand state, as development planner see conversion of forest land to mining, hydropower could be way out of poverty for many, for which loss of some biodiversity is inevitable. While many green activist views industrial growth can be sacrificed to retain forests and tribal land even at the cost of economic growth. The situation therefore provides a good setting to examine how people deal with their poverty in relationship to their dependence on natural products and household resource.
A growing wealth of information on contribution of forest and other natural products to rural households’ livelihoods and local economy in India has come up (Rao and Singh, 1996, Hedge 1997; Narendran etal., 2001). In most of the studies the entire array of products is considered as one group without disaggregating it in term of its nature or market. Further most research so far were in either western dry lands, principally gum-resins belt, or in south western coast’s moist forest areas. All in all, there are still a lot of studies needed from 14 agro-ecological regions to have a reliable national statistics on the contributions of non wood forest products to regional and national economy in India. One of the geographic regions understudied is the dry subtropical forest zone of eastern India where live country’s maximum number of poor. Orissa and Jharkhand region has more than 40 million people living below national poverty line (Planning commission,…) Owing to its diverse ecosystem and relatively rich biodiversity, the region has a good repository of natural products but role of wild resources in the rural livelihoods is little documented. A non appreciation and non accounting of natural goods into GDP is one of the reason of low investment (2% of state budget) in natural resource management system in the
4
region. Recently, several development efforts have been undertaken to reconcile economic development with livelihood but with meager attention on biodiversity conservation and its sustainable use. A better grasp of how and why local people use resources around them including forests is deemed critical to the long term realization of both objectives. Therefore, the objective of this study is to provide information on the role of local trade in natural products collected from forest, farm land, upland and to examine the underlying causes and household dynamics to deal product uses in the context of their livelihoods and income. Arguments and counterarguments over the link between poverty and environment has intensified but many regional studies fails to capture intra community variation those who are uniformly poor on a given landscape (Mamo etal., 2007). The attempt is therefore to investigate income from products that poor community have free access but use differently and how it addresses poverty and livelihood issues in a poorest region of India.
2. STUDY AREA AND CONTEXT
Subtropical regions of eastern India comprising states of Orissa, Jharkhand and Chattisgarh are forest rich but are amongst the poorest states in India. The study areas are spread over 24 villages in 4 districts located in Orissa (17 o degrees 31‘ E to 22o degrees 29‘ N) and Jharkhand (23o 45 ‘ N to 85 o 30‘) states of the eastern India. The areas have a predominantly monsoon climate. Mean annual rainfall varying from 850 mm in north to 1,350 mm in the east, distributed across 35-45 days per year. Inter seasonal and intra seasonal drought is frequent, occurring every 3-4 years. On average the region has 40 % land under cultivation, 30 % under forest and the remaining 24 % under grazing, and other minor land uses. 26% crop area are uplands are un irrigated whereas only 40% of plain croplands are irrigated. It has a relatively low population density by Indian standards (236 people km-2) but having with a high tribal population (21%). The degree of economic deprivation is most acute for socio-economically backwards communities such as tribals. The per capita annual income for Orissa and Jharkhand state averages to Rs 14,000 (US$ 311) with high poverty ratio (45%) averaging for both states (Planning commission) . The level of literacy is about 49 % as per the 2001 census. The region is characterized by low urbanization and industrialization, and agriculture has been the main source of livelihood providing employment to 75 % of the working population. The poverty trap in which rural eastern India live is mainly on account of low agricultural productivity resulting from fragmented holdings (0.9 acre per capita) and low input single crop rain-fed farming, Paddy occupying bulk of the crop land (Misra, 2009). Crop failure on account of drought and pest is common and the upland farmers are hard hit as non farm income opportunities for them is very limited (Planning Commission, 2002). The chronic poverty of the region puts it at par with sub-Saharan Africa (WFP, 2003).
Due to limited employment opportunities, intensity of forest use for subsistence and income is very high compared to other regions, more on account of the fact that 29,000 villages are on the fringes of forests (1-5km) (OFD, 2001). So forest plays a vital life supporting system for forest dwellers and poor tribal. With a high tribal population, forests play a significant role in the socio-economic life of the region's populace many of whom depend on wild products as NTFPs to supplement their food and augment income. Three sub tropical forest vegetation types (dry decid-uous, moist deciduous and peninsular Sal) contribute about 80 % of the total forest cover which is of (ICFRE, 2003). The remaining 20% consists of other constituents forest types such as semi-evergreen, littoral and tidal swamp forests. The states earn annual forest revenue of INR 1
5
billion constituting substantial non tax revenue for the region of which 80% comes from non wood products. Investment in forestry development is about 1.5% of the state budget. The downward trend of timber production in Orissa and Jharkhand state reflects overall poor forest productivity of dry forests of the region. During 1990-2000, the timber production slumped rapidly as commercial forest logging was discontinued in view of insufficient mature trees; resulting from overexploitation of matured trees by state and illegal logging by locals. The reliance on self employment by way of sale of natural products provides important economic opportunities for many. In a study conducted by Mitchell et al., (2003) estimated 65% households trading in at least one non wood products in the forest close villages. Earlier studies reported from India assessed forest income received by community or a specific group of collectors within a defined landscape as forest reserve, protected areas etc (Appasamy, 1992; Kant 1997; Rao and Singh, 1996, Hedge 1997; Narendran etal., 2001). Results of such works failed to provide broader generalisation as to the poverty impact on environmental income as many factors are localized and may not hold good in larger setting with varied socioeconomic groups operating with diversified livelihood strategy. Further such studies are constrained by seasonal, or mostly one time data collection, or from a cluster of villages.
3. METHODLOGY AND APPROACH
In order to overcome such limitation, a set of robust data collected from different socio-economic strata over a sample of 486 households across 24 villages in four districts of Orissa and Jhrakhand states was made during 2002. For each case study product data was collected on the individual household on monthly basis for one year. Collector who sells the product regularly in weekly hat or to the agents of manufacturers and reported doing it every year during last five years was taken into consideration. The seller household who regularly trade products and earns at least INR 100 (US$ 3) a year for the given case study product was included under the group for analysis. For examining the household characteristics and diversification of wealth, all sample households who earned income by selling forest products were included. All reported incomes are sums of annual cash obtained from sale of products. Cost of inputs or value of products consumed was not included in the income calculations. Non farm income included earning from permanent employment and from self generated income activities. Crop income was the sale value of all agricultural and horticulture crop. Income from off-farm employment was the value of earnings (cash and subsistence) through hiring out labour. Product or forest income was the local market value of forest products. In order to compare household characteristics of seller households with that of overall population of the region, data collected for a separate study by Mahapatra (2002) over 250 households in two sample districts (Angul and Keonjhar) was taken as random population reference. Both quantitative (eg., repeated semi structured interview) and qualitative (participatory exercises, key informant discussions) methods were engaged to collect data on individual choice and household profiles. Monthly collection of data was effective in dealing recall problem and provided fairly accurate estimate of production and income. Cash income obtained from sale of agriculture, livestock, and forest products were computed taking the retail rate prevalent at local market of the district. Products consumed in household were not valued for income estimation. Net income from product sales were calculated differently for each product, but were determined on local price and direct costs incurred during harvesting, processing and sale. Revenue obtained from product sales, livestock income, wage income other non farm income (sale of other ntfps, household trade, permanent job) was taken into account for determining total income of the trader household. Respondents were also asked the number of days and distance he or she migrates to
6
earn wage income. Income of members living away from home was excluded from household annual total income. Detailed case studies of 6 most commonly traded natural products of two states, namely mahua flower, lac, bidi, oil seeds, sal leaf, tendu leaf, lac from were undertaken (Table 1). It included two value added products namely lac, and bidi. The products are mostly sold in rural weekly market (hat) and nearby town except sal leaf which are stored in villages centers close to the collection areas for direct transport to leaf-plate manufacturing units located at cities such as Calcutta, Raipur, Ranchi etc. Sal and siali leaf plucked from the climber Bauhinia valli, are hand processed to ‘leaf plates’ and ‘leaf cup’ and transported all over India from Orissa, Bengal and Jharkhand for use in small restaurants. Bidi leaf rolling has become a specialized enterprise in the region that require skills and ability to purchase raw material as tobacco, thread etc. Lac rearing is confined to villages scattered in Keonjhar and West Singbhum. Table 1. Key features of six commercially traded case study forest products
Product Botanical name Characteristics
Mahua Flower (n=177 )
Madhuca latifolia (Flower used for making local wine)
Sesaonal harvesting from forest, communal and farm land, dried and stored flower Sold for 3-4 months, in lieu of cash, salt, to repay advanced loan. Used for brewing local wine, sold to agents of brewery, require permits to store and trade. Transported to 5 adjoining states for wine making.
Oil seed (n=115 )
Pongamia piñata, Buchnania lanzan Shorea robusta (edible oil extracted for sale to soap and cosmetic industries)
Harvested for 20-25 days. Stored and sold round the year. Seasonal fluctuation in price. Medium barrier to entry. Trees are either owned or collection rights obtained in exchange of supply of family labour to tree owners during planting, harvesting season. Home grading, drying and processed prior to sale. Except sal seed, other oilseed have good market demand. Low scale value addition, better price margin
Tendu leaf (n= 206)
Dyrospyros melanoxylon (used for making local cigarette bidi)
Plucked from tendu bush in degraded forest and waste lands, sold within a weeks with little or no value addition. Low barrier to entry, require household labour. Resource abundant, sale is assured, price fixed, low valued product, collection and marketing state controlled. Low returns for household labour.
Bidi (n=32 )
Dried tobacco leaf wrapped in tendu leaf
Require skill, capital. Medium barrier to entry. Traditional relation with tobacco supplier, long term business relation with bidi manufacturing units. Long marketing chain. Sold to agents of factories. Round the year trading.
Sal leaf trader (n= 79)
Shorea robusta (leaf plate and cups used in rural home and in
Low barrier to entry. Secured resource, collected from plains and degraded sal forests. Exploitation has high ecological impact. Low return to labour, low priced products, sold to agents of sal plate manufacturing units either un processed or after preliminary processing
7
restaurants
Round the year trading.
Lac (n= 69 )
Lac insect grown on Schleicheria oleorosa, Butea monosperma tree
Family tradition, lac rearing is on decline and unsustainable, tribal of few district produce and trade. Seasonal fluctuation in price sold to intermediaries who determines price after negotiating with end users
We followed the approach used by Shackleton etal., (2008) in examining issues identified within environment-poverty discourse and addressed following concern in this paper; (a) what trend is prevalent in natural product trade which thrives in two states with a population of 50 million having a rural population of 20 million, (b) who trades in natural products and what motivates them to take up these microenterprise, (c) significance of contribution of environmental product income to household cash income, (d) what way the natural trade impacts livelihood and poverty of rural poor. 4. RESULTS AND DISCUSSION 4.1 What trend is evident in natural product trade The natural product trade in eastern Indian states is deeply entrenched into rural marketing scenario as a micro-enterprise for long. Both the number of buyers and sellers have proliferated. Overall the number of traders have substantially increased in last two decades primarily due to rapid population expansion and corresponding inability to absorb growing labour force in primary and secondary sectors in rural India (GOO, 2004). For examining tenure of trade, we excluded tendu leaf traders as most collector-seller household responded that tendu leaf collection and sale is their ancestral activities and they have been selling it to local traders or bidi merchants in different year, since ages, hence it is difficult for them to identify a starting period.
Table 2 Period of participation in the natural product trade (no. of hh)
Sal leaf Bidi Oilseed M. flower Lac Period (n= 79 ) (n=32 ) (n=119 ) (n=177) (n=69 ) 1-5 yrs 39 - - 8 - 6-10 yrs 32 - 25 32 - 11-20 yrs - 6 23 46 36 20-30 yrs - 26 58 21 30 >30 yrs - - 8 - - (the figures indicate number of households involved in trade )
Unlike South African study (Shackleton etal., 2008) the number of participants in commercial trade of case study products have expanded noticeably for selected products, in recent years as evident in sal leaf followed by oilseed (Table 2). Oilseed though was collected mainly for home consumption, after increase of price after price hike of edible oil during 1990s more people started selling oilseed to augment cash income. A 30% in crease in edible oil price was experienced during 1990-2000 (Paharia and Mukherjee, 2007) which had impacted on demand for tree based minor oilseeds.
8
The practice of lease of forest areas to contractors for specified products stimulated trade in 1970s in respect of items like oilseeds, resins, gums, medicinal fruits. With states controlling marketing of selected high valued items like tendu leaf, sal seed and bamboo more people joined in the collection and sale being assured of market during 1970-90s. Bidi rolling which depended on skill and traditional relationship with tobacco supplier and intermediaries of bidi merchants was confined to villages closer to factories in Sambalpur, Angul, Ranchi, Raipur districts. Sal leaf once collected for household consumption in small quantity witnessed tremendous spurt in its trade after 1990s when leaf plates and cups started replacing steel and ceramic cutlery in many semi-urban restaurants in eastern Indian states and adjoining areas of West Bengal and Andhra Pradesh. Though natural product trade as mahua flower, lac continues to be unorganized and smaller in scale compared to agricultural products, it has a strong presence in rural market all across the sub tropical forest zones in eastern India. Producers and traders mostly ascribed increase in participation to lack of employment opportunities and due to ease in state control on non wood forest products during last decade. Further high cost of agricultural labour in recent years pushed production cost of many winter crops (groundnut, sugarcane etc.). Consequently farmers preferred to put their low productive land to fallow than cultivate, and the unengaged labour take up income earning activities as trade in mahua flower and oilseeds instead. Table 3 The sellers reason for taking up the trade (n=30) from each group was asked the reason)
Reason Bidi seller
Lac seller
M. flower seller
S. leaf seller
Oilseed seller
Tenduleaf seller
1. Easy to trade, (no hassle of storage, or buyer)
12 5 5 21 18 15
2. Family tradition
42 47 10 8 12 65
3. To meet exigencies (Reapay home laon/marriage/school admission)
34 18 45 35 35
4. To get cash income
12 - 30 15 35 15
5. No job, education or other income source
- 30 10 21 - 5
(figure are in % of 30 respondents surveyed from each group) Demand push for sal leaf and mahua flower was caused by increase in number of breweries and price spurt during low flowering season also motivated many to join the trade. In study area antipoverty programme were launched by government during 1990s resulting in increase wage earning opportunity, so number of émigré during summer gradually decreased. The process enhanced availability of household labour that subsequently was shifted to trade in natural products and other small scale enterprise after 1990s. Socioeconomic hardship was instrumental in pushing into low return trade for many, but it serves an important safety net function as seen in the number of households joining tendu leaf (n=206 ) or mahau flower (n=177) sale. Barring lac which is grown by tribal of Jharkahnd in West Singhbhum and Keonjhar who are traditional lac grower both ‘upper caste’ and ‘lower caste including tribal had taken up to natural product trade in last many years. Of sal leaf trading households about 70% started during 1990-2001, whereas
9
maximum increase in the proportion of oilseed trading noticed during 1980-2001. More than half of lac traders strated trading as back as 1970s. Opinion is divided on the potential causes that pushed household into trading natural products. Although it was difficult to inform precisely, we observed many participants citing multiple reasons for doing forest product trade (Table 3). The respondent general remark was that they have been doing it as a matter of traditional practice. After testing questionnaire therefore few major responses were short listed and respondents were asked to specify one of the listed response as one of the motivating factor. Although clear trends are difficult to establish a quarter of participants in bidi, oilseed and mahua flower categories have benefited from the cash income which acted as the motivating factor. About 15% of participants identified availability, accessibility and ease of trade forest goods are the reason for joining the micro-enterprise. Although a smaller proportion views that product income was important for contingencies expenditure as marriage, crop failure or to repay the loan taken from merchant, it constituted an important ‘fall back’ option which protect poor from getting into poverty trap, in a subsistence chronic-poverty region. Taking loan from moneylender and merchant with monthly interest rate of 2-3% is a common practice in the study area which is repaid by way of income from sale of product or exchanging the product on a predetermined price. A quarter of lac, tendu leaf sellers cites their poor socio-economic condition on account of small farm land, and illiteracy as the driving factor to be in the product trade. 4.2 What socioeconomic trait does natural product sellers have A comparison of sellers key household characteristics with that of random households of the area suggested that producer and seller household are relatively worse off and vulnerable (Table 4). For example, annual cash income for random households was significantly higher at INR 11, 564 than forest priduct traders. Although no significant difference is observed in respect of farm land ownership between random household and seller household, sal leaf collectors had significantly lower farmland compared to group average. Livestock is a major asset for households in the region and the seller households on average have 4 animal head per family which is not dissimilar to region average. Bidi producing families is better off amongst trading household who had higher proportion of cattle. They are better off financially, as well endowment wise with more cultivated land at their disposal. It could be due to the fact that they have successfully come out of poverty and could accumulate capital as land. Interestingly poorest group; lac traders also had bigger parcel, but they are mostly un irrigated upland, many uplands are also occupied illegally and are kept fallow, or used for growing minor millets. Household supply of labour is the other valuable asset for generating income for rural poor which is dependent on number of adult members in family and members migrating from village for livelihood elsewhere. Interestingly lower proportion of bidi, oilseed, and sal leaf traders migrate. Value addition requires processing of product as bidi and lac are having bigger family size, more female hands per household. Larger family size is reported to have a positive association with forest use (Godoy etal., 1997) No distinct difference in literacy level amongst traders household is seen, as poor households and forest dependent population of the region are mostly illiterate. Low level of literacy amongst NTFP producers is also observed in other region (Adhikari etal., 2004). Poor levels of education could put peasants into serious disadvantage in securing job and limit off farm income (Fisher 2004). The low illiteracy level is typical of the region where education to tribal and lower caste is a major development challenge for government.
10
Poverty indicators such as minimal cultivable land, physical asset, and capital etc strongly correlate with environmental income in many studies (Vedeld etal., 2007, Angelsen and Kaimowitz, 1999). In the absence of production base and off farm employment avenues, rural poor in many forested zone eke out living by selling low valued products even though return from labour tends to be uneconomical. The situation in high poverty region of India was no different. Our result showed that resource wise the inter community distinction between forest dependent and non dependent groups would not be remarkable, as many characters echoed the value for random households (Table 4). But both in term of assets and income, significant difference is noticeable between producers and sellers household dealing in different products. Sal leaf, tendu leaf, and mahua flower sellers have relatively less land compared to random households, and higher proportion of these groups are landless, possibly a factor that has driven them into the trade and contributing to their reliance on non-farm activities as forest income. Higher percentage of these groups joined trade in last 10 years (Table 2). The exception was among bidi and lac sellers who presented a contrasting picture. Bidi traders are better off on account of value addition and have larger income, having higher percentage of participants with formal jobs (12%) and more cattle (mean=3.1). Table 4. Comparison of ‘producer and traders’ profiles and household (hh) characteristics across products
and with a random household sample
Bidi Salleaf Tenduleaf Mahua flower
Lac Oilseed Random
households (n=250)
Land Size (acre)
Mean 4.6 3.8 3.2 3.1 8.1 4.5 4.88
SE 1 0.8 0.2 0.2 0.4 0.4 0.8
Total income (INR)
Mean 8,775 c 6,167 b 5,728a 6,098 b 4,741 a 6,464 b 11,564
SE 1,075.6 510 277.18 413.73 295 526.65 1,011.6
Family size
Mean 6.9 bc 5.5 a 5.9 a 5.6 a 8.1 c 6.8 b 7.46
SE 0.5 0.2 0.1 0.2 0.4 0.6 0.5
Female members
Mean 2.2 1.8 1.92 2.1 2.8 2.6 2
SE 0.1 0.1 0 0 0.1 0.1 0.1
No. of year in Education
Mean 4.2 c 3.2 a 3.3 a 3.7 a 3.8 a 3 a 3
SE 0.3 0.5 0.2 0.3 0.56 0.3 0.4 No. of livestock
Mean 5.2 4.5 4.4 4.3 5.8 4.31 SE 1.1 0.5 0.3 0.3 0.52 0.4
% HH Migrating 2 4 12 8 0 3 5
% Having Formal job
12 5 4 4 0 5 11
% having no farm land 12 5.3 19.4 11 6.2 9 8
(Pair wise comparison were performed using Mann-Whitney tests. Unlike superscripts indicate significant differences between groups at p<0.01)
11
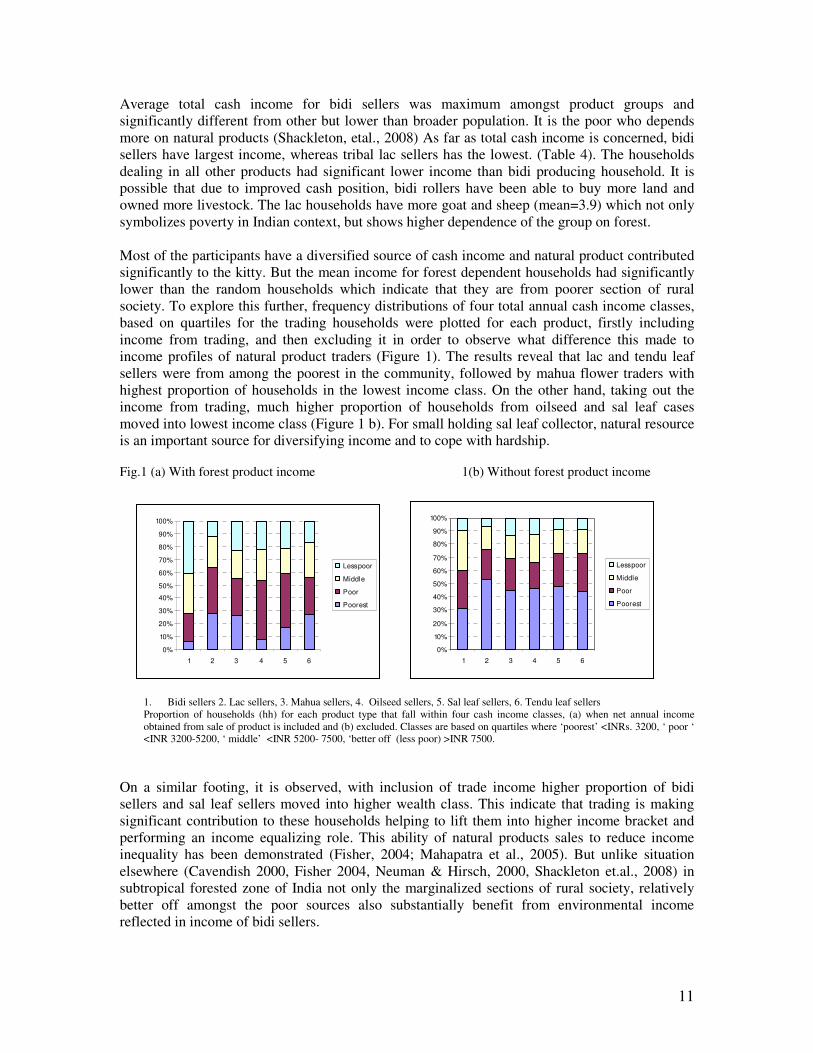
Average total cash income for bidi sellers was maximum amongst product groups and significantly different from other but lower than broader population. It is the poor who depends more on natural products (Shackleton, etal., 2008) As far as total cash income is concerned, bidi sellers have largest income, whereas tribal lac sellers has the lowest. (Table 4). The households dealing in all other products had significant lower income than bidi producing household. It is possible that due to improved cash position, bidi rollers have been able to buy more land and owned more livestock. The lac households have more goat and sheep (mean=3.9) which not only symbolizes poverty in Indian context, but shows higher dependence of the group on forest. Most of the participants have a diversified source of cash income and natural product contributed significantly to the kitty. But the mean income for forest dependent households had significantly lower than the random households which indicate that they are from poorer section of rural society. To explore this further, frequency distributions of four total annual cash income classes, based on quartiles for the trading households were plotted for each product, firstly including income from trading, and then excluding it in order to observe what difference this made to income profiles of natural product traders (Figure 1). The results reveal that lac and tendu leaf sellers were from among the poorest in the community, followed by mahua flower traders with highest proportion of households in the lowest income class. On the other hand, taking out the income from trading, much higher proportion of households from oilseed and sal leaf cases moved into lowest income class (Figure 1 b). For small holding sal leaf collector, natural resource is an important source for diversifying income and to cope with hardship. Fig.1 (a) With forest product income 1(b) Without forest product income
0%
10%
20%
30%
40%
50%
60%
70%
80%
90%
100%
1 2 3 4 5 6
Less poor
Middle
Poor
Poorest
0%
10%
20%
30%
40%
50%
60%
70%
80%
90%
100%
1 2 3 4 5 6
Less poor
Middle
Poor
Poorest
1. Bidi sellers 2. Lac sellers, 3. Mahua sellers, 4. Oilseed sellers, 5. Sal leaf sellers, 6. Tendu leaf sellers Proportion of households (hh) for each product type that fall within four cash income classes, (a) when net annual income obtained from sale of product is included and (b) excluded. Classes are based on quartiles where ‘poorest’ <INRs. 3200, ‘ poor ‘ <INR 3200-5200, ‘ middle’ <INR 5200- 7500, ‘better off (less poor) >INR 7500.
On a similar footing, it is observed, with inclusion of trade income higher proportion of bidi sellers and sal leaf sellers moved into higher wealth class. This indicate that trading is making significant contribution to these households helping to lift them into higher income bracket and performing an income equalizing role. This ability of natural products sales to reduce income inequality has been demonstrated (Fisher, 2004; Mahapatra et al., 2005). But unlike situation elsewhere (Cavendish 2000, Fisher 2004, Neuman & Hirsch, 2000, Shackleton et.al., 2008) in subtropical forested zone of India not only the marginalized sections of rural society, relatively better off amongst the poor sources also substantially benefit from environmental income reflected in income of bidi sellers.
12
4.3 What are the livelihood benefits from the natural product trade ? 4.3.1 Income form product sales, variation and comparison
The result of the study matches the findings of Shackleton et al., (2008) relating to contribution of environmental product to general welfare of the poor in semi arid region of South Africa. Dry forest regions generally have lower forest density and diversity than humid areas, resulting in lesser quantity and varieties of product per hectare. In wet zone of south India as many as 24 natural products are traded commercially contributing 25-50% of household income (Narendran et.al, 2000). The number of commercially traded products in comparison are much less in drier forest zone of east India. As a result, overall mean income from trading in natural products were relatively modest both in South African and current study, although outliers demonstrate significant returns for cases (Table 5 and Figure 2). Pair wise comparisons showed that average net product incomes from bidi is significantly higher than other groups, at INR 3614 (US$ 90) and INR 1400 (US$ 35) respectively. Returns from mahua flower is lowest at INR 1357 (US$ 33 ), although it is in the level of tendu leaf and sal leaf trade averaging about INR 1400. The other two products lac and oilseed provided net return in the range of INR 1600-INR 1800. Overall, these incomes fell below the stipulated minimum wage and other poverty line measures for the region. The minimum wage rate was INR 60 per day, and under the un employment guarantee scheme government make efforts to provide at least 200 days of work to rural poor. Assuming that a person receive 200 days wage the annual cash income would be INR 12,000 which is closer to the income reported for random household of rural areas. So economically speaking natural product trade is not a better option than even wage earning. Compared to forest income received from natural products in other parts of India (Rao and Singh, 1996, Hedge 1997; Narendran etal., 2001) mean income earned seems to be in middle range. A modest mean annual cash income from wild product trade is also evident in several studies worldwide (Shackleton etal., 2008, Sckrenberg, Velded, 2007). Table 5. Hosuehold annual cash income from product sale
Discussing only mean values obscures the heterogeneity in incomes within households, especially when sample size is big and distribution is over large areas (Shackleton et al.,2008). It is observed that considerable intra group variation on income earned from product is prevalent within the community (Fig. 2). Bidi traders for instance earn as little as 490 to as high as INR 13,321 and for tendu leaf traders the range is between INR 131 to 7411. Based on gross annual income from product sales, 22% of bidi households earned more than INR 11,000 which is comparable to the mean farmer income in the region. Considering bidi alone, which is a full time activity, 60% household are able to make more than INR 6,500 from product trade, which is higher than mean total annual household cash income for all trading household. For oilseed producer, some 20% realized more than INR 3000 per annum whereas 18% of mahua flower sellers had similar benefit. Even 12% of the poorest group; lac producers received more than 3000 Indian Rupees per year. Some people within a community earn higher level of income from same products for the simple reason that they are able to extract higher volume to meet household need of cash as they lack adequate land or job to engage available human resource. Though large majority depend on diversified source as agriculture, wage, small scale trading etc., households involved in value addition tend to make more benefit from trade. Amongst respondents, socio-economic variables such as land ownership, household size, or family labour does not seem to have significantly influenced income. Instead, individual interest, skill and intensity with which trade was taken up impacts household income. The claim that extraction and processing of natural product while serving important role of safety net for poor can provide a pathway out of poverty for the more entrepreneurial class can be supported from our results. Income out of product has surpassed earning from other sources for selected few. Between product type, quantity available for extraction, seasonality, market price and demand, degree of value addition are the main determinants accounting for difference in income from natural products. Fig. 2. Box plot of net annual income from product sales per household for each product type
(median, interquartile range containing 50% of values, highest and lowest values, outliers, extremes)
323232323232N =
TENDLEAFSALLEAFOILSEEDMAHUAFLOLACBIDI
12000
10000
8000
6000
4000
2000
0
-2000
32
1
20
14
4.3.2 Contribution to total household income and dependence on the trade For households selling the case study products their agriculture surplus after meeting household food consumption provide 12% of cash (Table 6). Non farm income that included small scale trading, jobs sell of livestock products accounted 38% of total income, whereas 21% income is received through renting labour. It was expected that bidi traders would have higher level of agricultural income as they had more land, but their income from agriculture was minimum compared to all other producers household. Better off household sale less agricultural output and eat better, unlike many tribal and poor household who sale paddy and pulses they grow on farm to meet consumption expenditure at production time, and depends on low valued millets, and starchy crop. Sal leaf, tendu leaf and mahua flower producers although have smaller land parcel earns more from agriculture compared to bidi sellers. Table 6 Sources of Income for household trading in different product groups (% contribution to total cash income in parenthesis )
Tendu Lac Mahua flower Sal leaf Oilseed Bidi
288d 629 a 307 d 54 b Agriculture income (5)
1,324 c (27) (10) (5)
1,254 c (19) (1)
3,270 a
3111 a
3,277 b
5518 b
Non farm income (55)
868 c
(18) (51) (17)
2,565 a
(39) (63)
1,456 acd
1,315 a
1,306 ac
2,960 b
Income from forest product
sale (25)
1,595 acd
(33) (21) (21)
1,755 d
(27) (34)
912 a
1,044 a
1,298 a
244 b Off farm
income (15)
1,090 a
(22) (18) (57)
1,001 a
(15) (3)
Total income
5,926 a
4,877 b
6,099 a
6,187 a
6,575 a
8,775 c
(Pair wise comparison were performed using Mann-Whitney tests. Unlike superscripts indicate significant differences between groups at p<0.01)
It was observed that environmental goods in dry forested region helps peasants to generate one quarter of their cash income apart from fulfilling other subsistence need of food, fodder fuelwood. Environmental income can contribute to food security by providing cash to buy food or enabling to retain home grown food crop is also established (Mcsweeny, 2003).
15
Table 7 Income contribution of product sales to household cash income
Contribution to Total annual cash income
Mahua flower sellers
Lac sellers Oilseed Sal leaf Bidi Tenduleaf
0.25% 65 60 61 66 28 56
26-50% 13 15 24 25 50 32
51-75% 8 9 11 9 18 9
76-100% 14 16 4 0 4 3
Mean 25±1 30±3 26±1 23±1 36±3 27±1
A closer scrutiny of contribution of natural product income to cash income is shown in Table 7. Within product types, income shares from product varied widely between households from less than 25 to greater than 75%. The average income by Bidi traders though was highest amongst trading groups studied, income earned from natural products contributed to 75% of household income for more than 14% of mahua flower households and 16% lac producers. Overall, income from environmental goods contributed to 25% of income for majority respondents irrespective of the product type. Half of bidi traders get 50% of their annual earning from selling value added tendu leaf which signifies rural poor dependence on the trade. For quarter of oilseed and sal leaf producers, sale of natural products generates more than 25% of annual cash income. Greater dependence on forest and environmental income by the poorest segments of population has been emphasized in studies of Shackleton et al., (2008); Kamnga etal., (2009). Interestingly our result differed from commonly held assumption on forest income contribution from natural trade and revealed that it is the middle income group which depended most for cash income compared to destitute and better off (less poor) section of the society (Figure 2). Higher income group have diversified source of income, better land endowment or formal source of job, which generate higher share of cash income for them. The poorest in the eastern Indian rural community is mostly landless, or with more un arable land, depend heavily on wage labor provided under various government scheme (food for employment) or minimum employment guarantee program and consume more natural product than they sale. Our result therefore coincided with findings of Ambrose ji, 2003; Schreckenberg,, 2006). Figure 2. Mean plot of % contribution of the sales of product to total household income for households for different income class from poorest to wealthiest (Class 1= less than INR 3200, Class 2= INR 3200-5200, Class 3= INR 5200-7500, Class 4= > INR 7500)
0
10
20
30
40
50
60
70
80
90
100
0 1 2 3 4 5
Income class
% c
on
trib
uti
on
of
lac
sa
les
0
10
20
30
40
50
60
70
80
90
100
0 1 2 3 4 5
Income class
% c
on
trib
uti
on
of
ma
hu
a s
ale
0
10
20
30
40
50
60
70
80
90
100
0 1 2 3 4 5
Income class
% c
on
trib
uti
on
of
oil
se
ed
sa
les
16
4.4 Relationship between household resource and income We further explored whether environmental income in general, irrespective of the product type was influenced by rural poor household resources such as physical asset (Vedeld et al., 2007; Fisher, 2004) number of bread earner and level of education (Adhikari etal., 2004) which determine ability of poor to invest and diversify for sustaining livelihood. Considering that social and economic heterogeneity is a rule amongst rural community and between income regimes across products, we examined the underlying facets of household characteristic that could have contributed to difference in capital accumulation and livelihood diversification. Instead of only trading households as in Table 4, the entire sample of 486 household who collect forest product for home use and sale therefore was split into three wealth class, ‘poor’, ‘medium’ and ‘less poor’. Note that even the less poor on average make less than 179 US$ annum per capita in the study area. A multiple regression was ran with total household income against asset and resource variables of the household, which yielded a statistically significant model with household factors of education level of head of household, number of female adults and livestock ownership to significantly influence wealth generation for rural poor Households with higher education levels often have more reliable sources of off-farm income opportunities. Livestock ownership is common diversification strategy in agrarian region of subtropical dry zone, which demand investment in term of labour and other input. Table8- Regression of product income against socio-economic variables
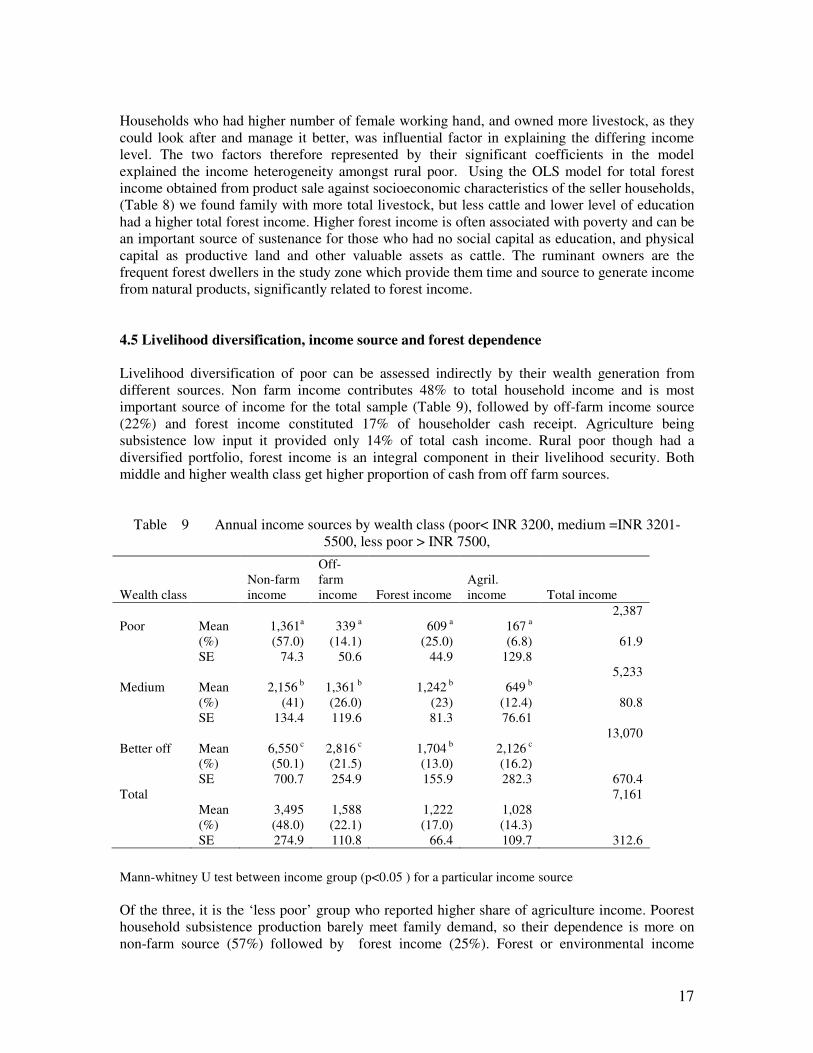
Households who had higher number of female working hand, and owned more livestock, as they could look after and manage it better, was influential factor in explaining the differing income level. The two factors therefore represented by their significant coefficients in the model explained the income heterogeneity amongst rural poor. Using the OLS model for total forest income obtained from product sale against socioeconomic characteristics of the seller households, (Table 8) we found family with more total livestock, but less cattle and lower level of education had a higher total forest income. Higher forest income is often associated with poverty and can be an important source of sustenance for those who had no social capital as education, and physical capital as productive land and other valuable assets as cattle. The ruminant owners are the frequent forest dwellers in the study zone which provide them time and source to generate income from natural products, significantly related to forest income. 4.5 Livelihood diversification, income source and forest dependence Livelihood diversification of poor can be assessed indirectly by their wealth generation from different sources. Non farm income contributes 48% to total household income and is most important source of income for the total sample (Table 9), followed by off-farm income source (22%) and forest income constituted 17% of householder cash receipt. Agriculture being subsistence low input it provided only 14% of total cash income. Rural poor though had a diversified portfolio, forest income is an integral component in their livelihood security. Both middle and higher wealth class get higher proportion of cash from off farm sources.
Table 9 Annual income sources by wealth class (poor< INR 3200, medium =INR 3201-5500, less poor > INR 7500,
Mann-whitney U test between income group (p<0.05 ) for a particular income source
Of the three, it is the ‘less poor’ group who reported higher share of agriculture income. Poorest household subsistence production barely meet family demand, so their dependence is more on non-farm source (57%) followed by forest income (25%). Forest or environmental income
Wealth class Non-farm income
Off-farm income Forest income
Agril. income Total income
Poor Mean 1,361a 339 a 609 a 167 a 2,387
(%) SE
(57.0) 74.3
(14.1) 50.6
(25.0) 44.9
(6.8) 129.8
61.9
Medium Mean 2,156 b 1,361 b 1,242 b 649 b
5,233
(%) SE
(41) 134.4
(26.0) 119.6
(23) 81.3
(12.4) 76.61
80.8
Better off Mean 6,550 c 2,816 c 1,704 b 2,126 c
13,070
(%) SE
(50.1) 700.7
(21.5) 254.9
(13.0) 155.9
(16.2) 282.3 670.4
Total Mean 3,495 1,588 1,222 1,028
7,161
(%) SE
(48.0) 274.9
(22.1) 110.8
(17.0) 66.4
(14.3) 109.7 312.6
18
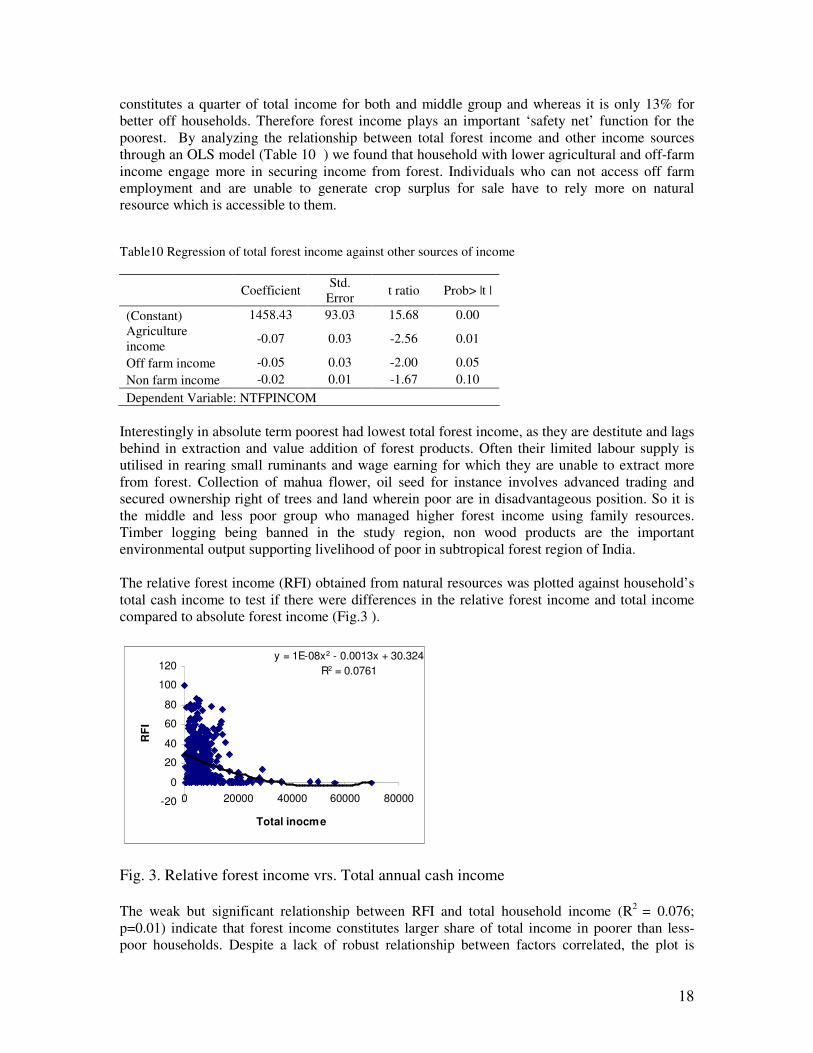
constitutes a quarter of total income for both and middle group and whereas it is only 13% for better off households. Therefore forest income plays an important ‘safety net’ function for the poorest. By analyzing the relationship between total forest income and other income sources through an OLS model (Table 10 ) we found that household with lower agricultural and off-farm income engage more in securing income from forest. Individuals who can not access off farm employment and are unable to generate crop surplus for sale have to rely more on natural resource which is accessible to them. Table10 Regression of total forest income against other sources of income
Coefficient Std.
Error t ratio Prob> |t |
(Constant) 1458.43 93.03 15.68 0.00
Agriculture income
-0.07 0.03 -2.56 0.01
Off farm income -0.05 0.03 -2.00 0.05
Non farm income -0.02 0.01 -1.67 0.10
Dependent Variable: NTFPINCOM
Interestingly in absolute term poorest had lowest total forest income, as they are destitute and lags behind in extraction and value addition of forest products. Often their limited labour supply is utilised in rearing small ruminants and wage earning for which they are unable to extract more from forest. Collection of mahua flower, oil seed for instance involves advanced trading and secured ownership right of trees and land wherein poor are in disadvantageous position. So it is the middle and less poor group who managed higher forest income using family resources. Timber logging being banned in the study region, non wood products are the important environmental output supporting livelihood of poor in subtropical forest region of India. The relative forest income (RFI) obtained from natural resources was plotted against household’s total cash income to test if there were differences in the relative forest income and total income compared to absolute forest income (Fig.3 ).
y = 1E-08x2 - 0.0013x + 30.324
R2 = 0.0761
-20
0
20
40
60
80
100
120
0 20000 40000 60000 80000
Total inocme
RF
I
Fig. 3. Relative forest income vrs. Total annual cash income The weak but significant relationship between RFI and total household income (R2 = 0.076; p=0.01) indicate that forest income constitutes larger share of total income in poorer than less-poor households. Despite a lack of robust relationship between factors correlated, the plot is
19
indicative of the highly diverse strategies on which the livelihood portfolio of poor people is based. As total income increases the relative dependence on forest decline. There is however little evidence to suggest that income from forest product sale alone could be a pathway out of poverty for larger group of forest dependent population. As only 10 % earn more than 1US$ per day. Only 12 % reported earning more than 50% of income from forest. This subset of sample had mean total income of INR 5559 which confirm to results of other poverty stricken region of the world (Kamanga etal., 2009; Fisher, 2004). The mean score for off farm income and land, cattle ownership of these groups corresponds to sal leaf, tendu leaf and mahua flower indicating that they are worse off compared to other product groups. As such we can say the natural product sale functions mostly as a safety net for asset poor farmers.
5. Conclusions
Vulnerable rural poor eke out living by using various environmental resources. Large body of literature is now available (Vedeld etal., 2004) which examine different settings and contribution of natural products variously labeled as forest product, NTFP, NWFP, environmental goods. Views and counterviews proliferate on significance of forest income and its ability to helping poor in their coping strategy, safety net, or a pathway out of poverty. This study examined the forest dependence over large areas of dry tropical forest zone in both in a disaggregated way and consolidating whole sample. The finding affirms result observed in other areas to the extent that trade in natural product is an important component of the livelihood strategy of the rural masses in forested zone. Although it may not be able to substantially boost income, it supports poor in coping with hardship. Our finding posits the poor of dry forests area between two contrasting school of thoughts, one group undermining role of forest products in alleviating poverty and wealth accumulation (Neuman and Hirsch 2000; Wunder 2001) other arguing its role as a crucial safety mechanism to protect poorer from descending to deeper poverty. Micro enterprise such as forest product collection, processing and sale is an important rural activity in eastern India where dry land paddy fails to provide agricultural surplus leading farmers to rely on various on farm and off farm sources for cash income. Natural resource commercialization runs in an informal and mostly unorganized economic set up but able to provide economic opportunity for rural community. Despite the safety net offered by biodiversity, poverty alleviation and conservation support measures initiated by state agriculture, and forest department so far, largely ignored natural resource producers who make both ends meet by extracting low return products under harsh living condition. As seen from our result the trade assists households in diversifying their income portfolio. An important dimension of forest product trade revealed from our study was that value addition to non wood product can be a successful pathway out of poverty, provided the processed product has a ready demand as seen in the case of bidi sellers. Else, producing goods which has lost out to synthetic substitute may not become a suitable economic enterprise as observed with lac sellers of eastern India. By selling high valued product as bidi instead of tendu leaf from which bidi is manufactured, producer household could raise their income substantially. Although poorest depend the most, the forest product business helps the better off household to realize higher cash income. It demonstrates the significance of biodiversity in deciduous forests of subtropical eastern India. The production and sale of natural product is to be seen in the wider livelihood and socio-cultural context irrespective of their economic outturn as for large majority of households mahua flower (mahua wine) and forest seeds is not only a commodity for sale but an important
20
food component. Ownership of mahua tree often signifies household asset and social standing in many tribal community. A pattern of differential diversification emerges from the study where the poorest households depend more on non farm sources and forest. At the other spectrum the less poor group receive higher income from most of the activities. Diversification involves more than only the type or volume of natural products a household deal, its cash and subsistence need require particular strategies within a resource regime individual operate. In this study cash share of forest income is about 17% and can not be concluded as an important livelihood strategy for cash acquisition for any group of households. As economic opportunity is limited and illiteracy is high peasants of the region rely on both non farm and off farm source for cash income. But livelihood strategy varies amongst differing wealth class, an important distinction being less poor group’s ability to generate non farm in addition to off farm and forest income. While crop farming found to be important for meeting household food need, cash is obtained through renting labour, small trading and selling milk products. Although distinct difference between trade income from unprocessed product was not evident value added product can bring higher income for participant households and can be a pathway out of poverty. Overall, forest income contributes 17% to household cash accumulation where dependence of poor is much higher than less poor. The gross value of forest income would be higher with accounting products used for household consumption. However, from the current household level extraction and market price of different product it can be surmised that in the given situation scope for improving forest income of poor is limited, since the dependent population size is huge, and few products are value added. But surely the poor would benefit if marketing and other support is put in place and proper linkage of producers and end user is established through state support and by developing product based business plan. Eastern India’s rural population is the poorest in India and the area is placed as one of the chronically hunger zone in India’s food security atlas. Although it is also one of the better forested zone, but has experienced high rate of deforestation (FSI, 2005). So any attempts to conserve biodiversity also need to address poverty to make conservation sustainable for which forest use by locals, the intensity of use and nature and type of exploitation require systematic study. This study conducted over a large sample across 4 districts covering two east Indian states is an attempt to measure contribution of forest product sale to rural poverty. We expect findings of the result may help development planning and state food and employment support programme specially those focusing people below poverty line and tribals. Our argument is to make pro poor forest policy and marketing support to enable forest fringe population to get higher return from trade, as dry land paddy of small holdings can not provide adequate income for rural households.
***********************
Reference
Adhikari, B., Falco, S.D., Lovett, J.C., 2004. Household characteristics and forest dependence: evidence from common property forest management in Nepal. Ecological Economics 48, 245-257. Ambrose-Oji, B. (2003). The contribution of NTFPs to the livelihoods of the ‘forest poor’: Evidence from the tropical forest zone of south-west Cameroon. International Forestry Review, 5(2), 106-117.
21
Angelsen, A., Kaimowitz, D., 1999. Rethinking the causes of deforestation: lessons from economic models. The World Bank Research Observer 14, 73-98. Angelsen, A., and S. Wunder. 2003. Exploring the forest–poverty link: key concepts, issues and research implications. CIFOR Occasional Paper Number 40. Center for International Forestry Research, Bogor, Indonesia. Available online at: http://www.cifor.cgiar.org/Publications/Papers/. APPASWAMY, Paula P. (1992). Role of non-timber forest products in an interface forest project. Paper presented at the workshop on methods for social science research on NTFPs, May 18-20, Bangkok, Thailand. In: Hegde, R.(ed.) 1994, MSc (Agri) thesis. Arnold, J.E. M. (2002a). Clarifying the links between forests and poverty reduction. International Forestry Review, 4(3), 231-234. Belcher, B., Ruiz-Pe´rez, M., & Achdiawan, R. (2005). Global patterns and trends in the use and management of commercial NTFPs: Implications for livelihoods and conservation. World Development, 33(9), 1435–1452. Belicher,B,M Ruiz-Perez and R. Achdiawan,2005. Global patterns and trends in the use and management of commercial NTFPs: implications for livelihoods and conservation, World Development 33 (2005), pp. 1435–1452 Cavendish, w. 2000. empirical regularities in the poverty-environment relationship of rural households: evidence from zimbabwe. world development 28(11):1979-2003. Dovie, D.B.K., 2003. Rural economy and livelihoods from the non-timber forest products trade. Compromising sustainability in sustainability in southern Africa? International Journal of Sustainable Development and World Ecology 10, 247-262. Ellis, F. 2000. Rural livelihoods and diversity in developing countries. Oxford University Press, Oxford, UK. Falconer,J.1997.Developing research frames for non timber forest products :experience from Ghana .pages 143-160 in M.ruiz perez and J,E.M Arnold (eds),current issue in non timber forest products research .center for international forestry research, bogor Indonesia. FAO (2003). State of the world’s forests 2003. Part II. Selected current issues in the forest sector. Rome: Food and Agricultural Organization (FAO). Fisher, M. (2004). Household welfare and forest dependence in Southern Malawi. Environment and Development Economics, 9, 135-154. Godoy, R., O’Neill, K., Groff, S., Kostishack, P., Cubas, A., Demmer, J., McSweeney, K., Overman, J., Wilkie, D., Brokaw, N. Martinez, M., 1997. Household determinants of deforestation by Amerindians in Honduras. World Development 25, 977-987. Hegde, R and T. Enters ,2000. Forest Products and Household Economy: a Case Study from Mudumalai Wildlife Sanctuary, South India .Environmental Conservation 27(3), 250 –259.
22
KANT, S. (1997). Integration of biodiversity conservation in tropical forest and economic development of local communities. Journal of Sustainable forestry, 4(1/2):33-61. Leach, M. Mearns, R., Scones, I., 1997. Environmental entitlements: dynamics and institutions in community-based natural resource management. World Development 27 (2), 225-247. McSweeney, K. 2004. Forest product sale as natural insurance: the effects of household characteristics and the nature of shock in eastern Honduras. Society and Natural Resources 17(1):39-56. Narendran, K., Murthy, I. K., Suresh, H. S., Dattaraja, H. S., Ravindranath, N. H., & Sukumar, R. (2001). Nontimber forest product extraction, utilization and valuation: A case study from the Nilgiri Biosphere Reserve, Southern India. Economic Botany, 55(4), 528–538. Neumann, R. P., & Hirsch, E. (2000). Commercialization of non-timber forest products: Review and analysis of research. Bogor, Indonesia: Centre for International Forestry Research (CIFOR). RAO, A. RATNA & SINGH, B. P. (1996). Non-wood Forest products contribution in tribal economy. Indian Forester: 122 (4):337-342. Ros Toneen and K.F.Wiersum.2005.The scope for improving rural livelihoods through non timber forest products .an evolving research agenda. Forests,Trees and Livelihood 15,(2):129-148 Ruiz Pérez,M . 2005.Poverty Alleviation and Forest Conservation: The Role of Non- Timber Forest Products :in NTFPs between poverty allevation and market forces. Switzerland. Ruiz-Pérez and Arnold, 1995. Scherr, S.J., White, A. and Kaimowitz, D. 2004. A new agenda for forest conservation and
poverty reduction. Making markets work for low income producers. Forest Trends and Centre for International Forestry Research (CIFOR). Forest Trends, Washington, D.C. Shackleton, C.M., Shackleton, S.E., 2004. The importance of non-timber forest products in rural livelihood security and as safety-nets: a review of evidence from South Africa. South African Journal of Science 100, 658-664. Sunderlin, W. D., A. Angelsen, B. Belcher, P. Burgers, R. Nasi, L. Santoso, and S. Wunder. 2005. Livelihoods, forests, and conservation in developing countries: an overview. World Development 33(9):1383-1402. Sunderlin, W. D., Angelsen, A., Belcher, B., Burgers, P., Nasi, R., Santosa, L., et al. (2005). Livelihoods, forests and conservation in developing countries: An overview. World Development, 33(9), 1383–1402. Vedled, P., Angelsen, A., Bojo, J., Sjaastad, E., Kobugabe, G.K., 2007. Forest Environmental Incomes and the Rural Poor, vol.9. Elsevier, pp. 869-879 (2007), Vedled, P., Angelsen, A., Sjaastad, E. & Kobugabe Berg, G. (2004). Counting on the environment. Forest incomes and the rural poor. Environment Department Papers, Paper No. 98, Environmental Economics Series. Washington DC: The World Bank Group.
23
World Bank (2002). A revised forest strategy for the World Bank Group. Washington, DC: World Bank Group. WRI (2005). World Resources 2005. The wealth of the poor. Managing ecosystems to fight poverty. World Resources Institute, UNDP, UNEP and World Bank. Washington, DC: World Resources Institute (WRI).
Mishra, S., (2009). Poverty and Agrarian Distress in Orissa, Indira Gandhi Institute of Development Research, Mumbai. WP-2009-006. http://www.igidr.ac.in/pdf/publication/WP-2009-006.pdf Pahariya, N.C., Mukherjee, C. (2007), Commodity Revenue Management: India’s rapeseed/mustard oil sector, International Institute for Sustainable Development (IISD)