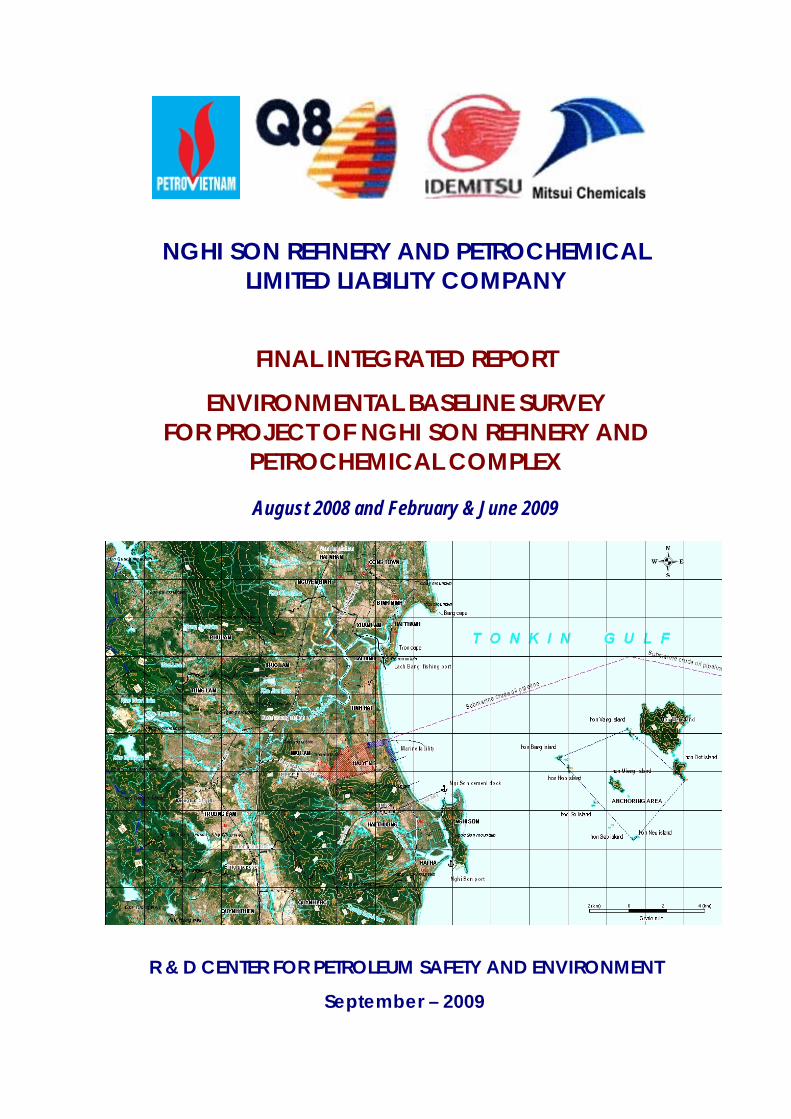
This is a report for Nghi Son Refinery Petrochemical Complex project in Vietnam (Revision 2009).According to Vietnamese Standards applied to EIA reporting, which is approved by MONRE and in regards to international standards applied to projects which are financed by the IFC (International Finance Corporation), or World Bank, two baseline environmental surveys for the Nghi Son Refinery and Petrochemical Plant project were carried out in the dry and rainy seasons to determine the status of the ambient environment in the project area. The principle environmental parameters outlines in this survey are bottom sediment quality, soil quality, ambient air quality, surface water quality and ground water quality.
NGHI SON REFINERY AND PETROCHEMICAL LIMITED LIABILITY COMPANY FINAL INTEGRATED REPORT ENVIRONMENTAL BASELINE SURVEY FOR PROJECT OF NGHI SON REFINERY AND PETROCHEMICAL COMPLEX August 2008 and February & June 2009 R & D CENTER FOR PETROLEUM SAFETY AND ENVIRONMENT September – 2009
Transcript
NGHI SON REFINERY AND PETROCHEMICAL LIMITED LIABILITY COMPANY
FINAL INTEGRATED REPORT
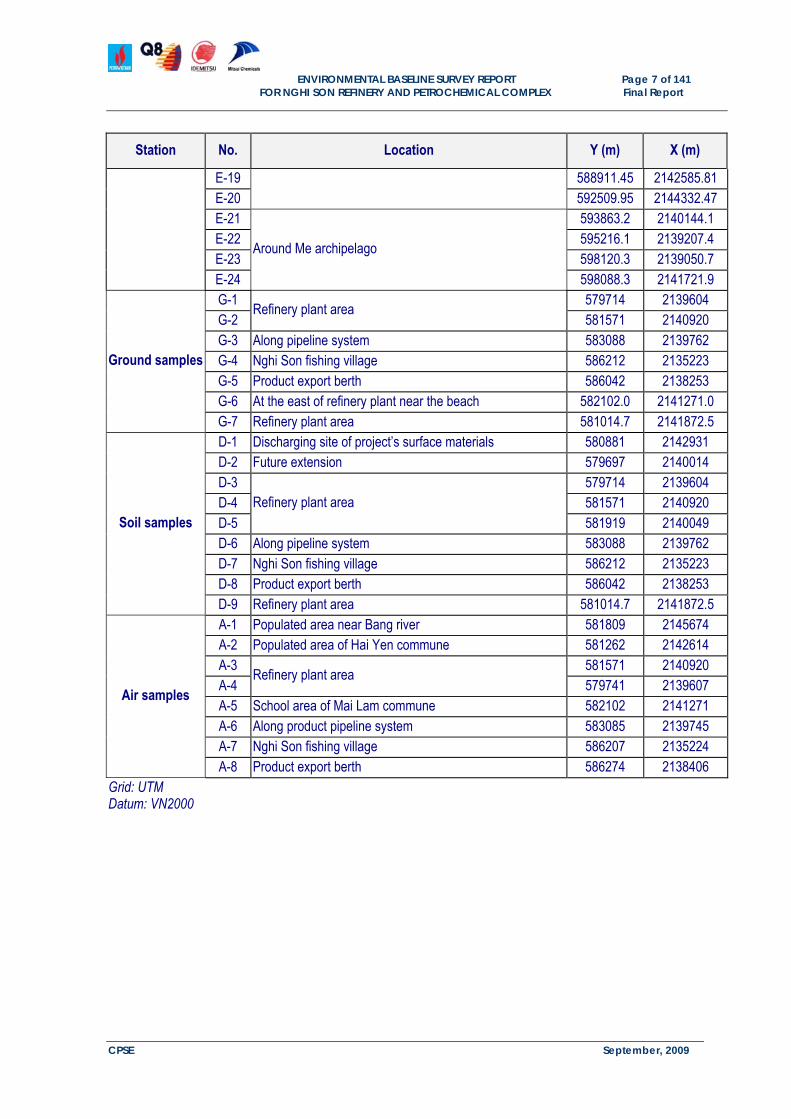
ENVIRONMENTAL BASELINE SURVEY FOR PROJECT OF NGHI SON REFINERY AND
PETROCHEMICAL COMPLEX
August 2008 and February & June 2009
R & D CENTER FOR PETROLEUM SAFETY AND ENVIRONMENT
September – 2009
NGHI SON REFINERY AND PETROCHEMICAL LIMITED LIABILITY COMPANY
FINAL INTEGRATED REPORT
ENVIRONMENTAL BASELINE SURVEY FOR PROJECT OF NGHI SON REFINERY AND
PETROCHEMICAL COMPLEX
August 2008 and February & June 2009
Project Owner Consultant of Preparing Report
NGHI SON REFINERY AND PETROCHEMICAL LIMITED LIABILITY COMPANY
RESEARCH AND DEVELOPMENT CENTER FOR PETROLEUM SAFETY & ENVIRONMENT
R & D CENTER FOR PETROLEUM SAFETY AND ENVIRONMENT
September – 2009
VIETNAM PETROLEUM INSTITUTE (VPI) R&D CENTRE FOR PETROLEUM SAFETY AND ENVIRONMENT (CPSE)
Report on
ENVIRONMENTAL BASELINE SURVEY FOR PROJECT OF NGHI SON REFINERY AND
PETROCHEMICAL COMPLEX
August 2008 and February & June 2009
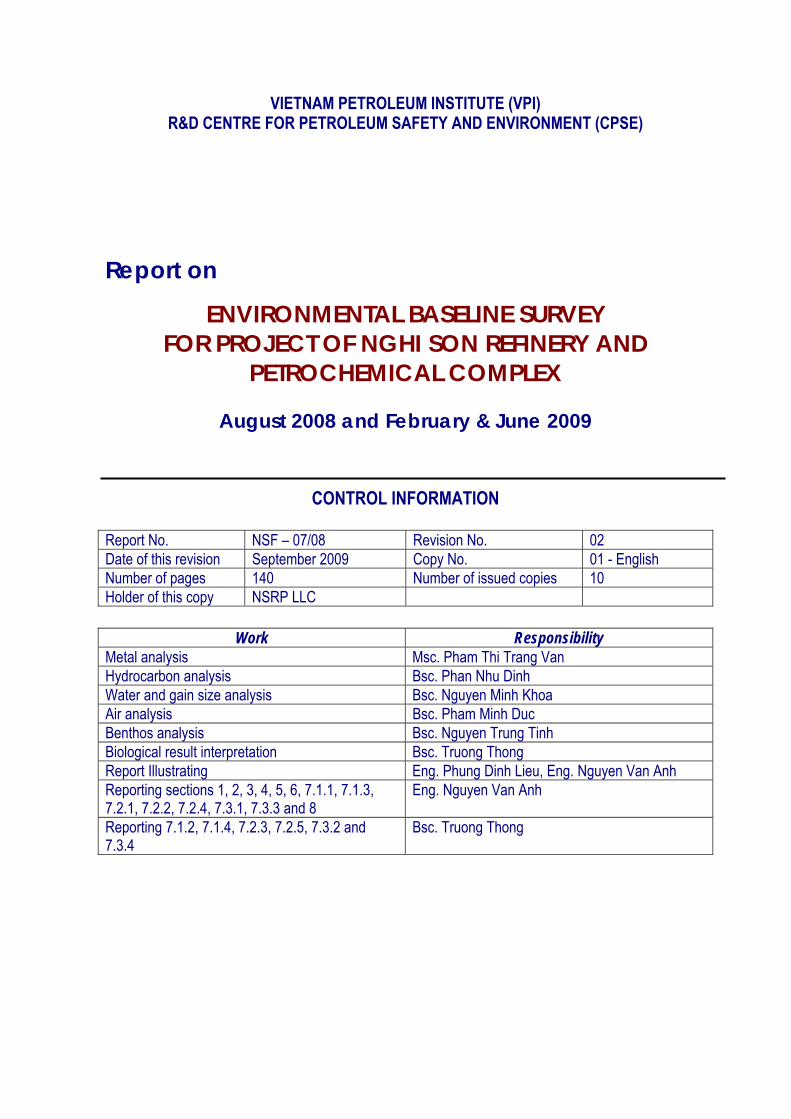
CONTROL INFORMATION Report No. NSF – 07/08 Revision No. 02 Date of this revision September 2009 Copy No. 01 - English Number of pages 140 Number of issued copies 10 Holder of this copy NSRP LLC
Work Responsibility Metal analysis Msc. Pham Thi Trang Van Hydrocarbon analysis Bsc. Phan Nhu Dinh Water and gain size analysis Bsc. Nguyen Minh Khoa Air analysis Bsc. Pham Minh Duc Benthos analysis Bsc. Nguyen Trung Tinh Biological result interpretation Bsc. Truong Thong Report Illustrating Eng. Phung Dinh Lieu, Eng. Nguyen Van Anh Reporting sections 1, 2, 3, 4, 5, 6, 7.1.1, 7.1.3, 7.2.1, 7.2.2, 7.2.4, 7.3.1, 7.3.3 and 8
Eng. Nguyen Van Anh
Reporting 7.1.2, 7.1.4, 7.2.3, 7.2.5, 7.3.2 and 7.3.4
AAS Atomic Absorption Spectrometry Ba Barium BOD Biochemical Oxygen Demand C Simpson’s dominance index Cd Cadmium Cr Chromium Cu Copper CPI Carbon preference index COD Chemical oxygen demand CR Crustacea CPSE Research Development Center for Petroleum Safety and Environment DO Dissolved oxygen EC Echinodermata ES100 Expected number of species in a rarefied sample GC Gas Chromatography H(s) Shannon-Wiener information function HMN Heptamethylnonane Hg Mercury Ind. Individual J Pielou’s evenness index MO Mollusca N/D Naphthalenes/Dibenzothlophenes NI Number of Individuals NPD Naphthalenes - Phenanthrenes - Dibenzothiophenes NS Number of Species (NSRP-LLC) Nghi Son Refinery & Petrochemical Limited Liability Company PAH Polycyclic Aromatic Hydrocarbon Pb Lead P/D Phenanthrenes/Dibenzothiophenes Ph. Phytane Pr. Pristane PC Polychaeata Sq. Squalane T Temperature THC Total hydrocarbon content TOM Total organic matters TSS Total suspended solids TOC Total Organic Carbon TSP Total Suspended Particle UCM Unresolved Complex Mixtures Zn Zinc
ACKNOWLEDGEMENTS
The report was carried out under the direction of Dr. Vu Cong Thang Director of CPSE
Analytical Results Interpretation and Report Design by Bui Hong Diem Deputy Manager of Environmental Chemistry Dept Nguyen Van Anh Environmental Engineer
Metal Analysis by Pham Thi Trang Van Master of Environmental Engineering Ha Dinh Quyet Chemist Dang Thi My Technician Vu Manh Cuong Technician
Hydrocarbon Analysis by Nguyen Van Mai Deputy Manager of Environmental Chemistry Dept Phan Nhu Dinh Deputy Manager of Environmental Chemistry Dept Ngo Mai Anh Environmental Engineer Nguyen Quoc Trung Chemist Nguyen Nhu Truong Chemical Engineer Pham Thach Anh Technician Pham Vu Viet Duong Technician Sediment Grain Size and Water Characteristic Analyses by Nguyen Minh Khoa Chemist Pham Thanh Thuy Chemist
Air Analysis by Pham Minh Duc Chemist Tran Quoc Thuan Chemist Hoang Minh Hung Chemist
Benthic Identification by Nguyen Trung Tinh Biologist
Data Handling and Computation by Nguyen Van Anh Environmental Engineer Phung Dinh Lieu Chemical Engineer
ENVIRONMENTAL BASELINE SURVEY REPORT Page 1 of 141
FOR NGHI SON REFINERY AND PETROCHEMICAL COMPLEX Final Report
CPSE September, 2009
1. INTRODUCTION According to the contract for provision of “Environmental impact assessment (EIA) and Environmental Social Impact Assessment (ESIA) for Nghi Son Refinery and Petrochemical Complex Project” signed on 16 July 2008 between Nghi Son Refinery & Petrochemical Limited Liability Company (NSRP-LLC) and Research Development Center for Petroleum Safety and Environment (CPSE), two baseline environmental surveys for Project of Nghi Son Refinery and Petrochemical Plant were carried out in the rainy and dry seasons in order to assess the environment and social baseline conditions in the vicinity of the project area at the time of undertaking the EIA report. 2. BRIEF INFORMATION OF THE PROJECT The NSRP project is located in the Nghi Son Economic Zone, Tinh Gia District, Thanh Hoa Province. It is 200km south of Ha Noi and about 80km north of Vinh city (Nghe An Province). The total project area is approximately 394ha, while the plant itself will occupy proximately 328ha. Marine facilities include an SPM, Crude import pipeline, product loading jetties, seawater outfall pipeline and breakwater. The refinery will process 200,000 BPSD of imported Kuwait Export Crude (KEC) oil. The fuels section of the refinery includes Residue Hydrodesulphurisation and Residue Catalytic Cracking as the main upgrading units. The refinery is integrated with petrochemical production. The Aromatics Complex produces Paraxylene and Benzene. A key product from the Residue Catalytic Cracker Unit is Propylene which is used to produce Polypropylene product. The products produced include the following:
LPG Gasoline – 92/ 95 RON Kerosene / Jet A-1 Diesel – Premium and Regular Paraxylene / Benzene Polypropylene Sulphur
The refinery includes all process units and associated utilities, offsite and infrastructure facilities to support the refinery operations.
Complete utility facilities designed to meet the refinery’s demands for cooling water, fuels, power, steam, water, instrument and plant air, inert gas, etc.
Offsite facilities including storage for feedstocks plus intermediate and final products as well as systems for import and export of feed and products.
Other offsite facilities including flare, effluent treatment, firewater, interconnecting piping and pipelines, etc.
Marine facilities include an SPM/ Crude import line and product loading jetties.
The Environmental Design Basis document defines the environmental performance criteria required to achieve compliance with Vietnamese laws and regulations, protocols and conventions which signed by Vietnam, Petrovietnam guidelines and World Bank/International Finance Corporation and applicable international guidelines and regulations. The plant and associated facilities is designed to high environmental standards, and aims to minimize emissions to air, water and land.
ENVIRONMENTAL BASELINE SURVEY REPORT Page 2 of 141
FOR NGHI SON REFINERY AND PETROCHEMICAL COMPLEX Final Report
CPSE September, 2009
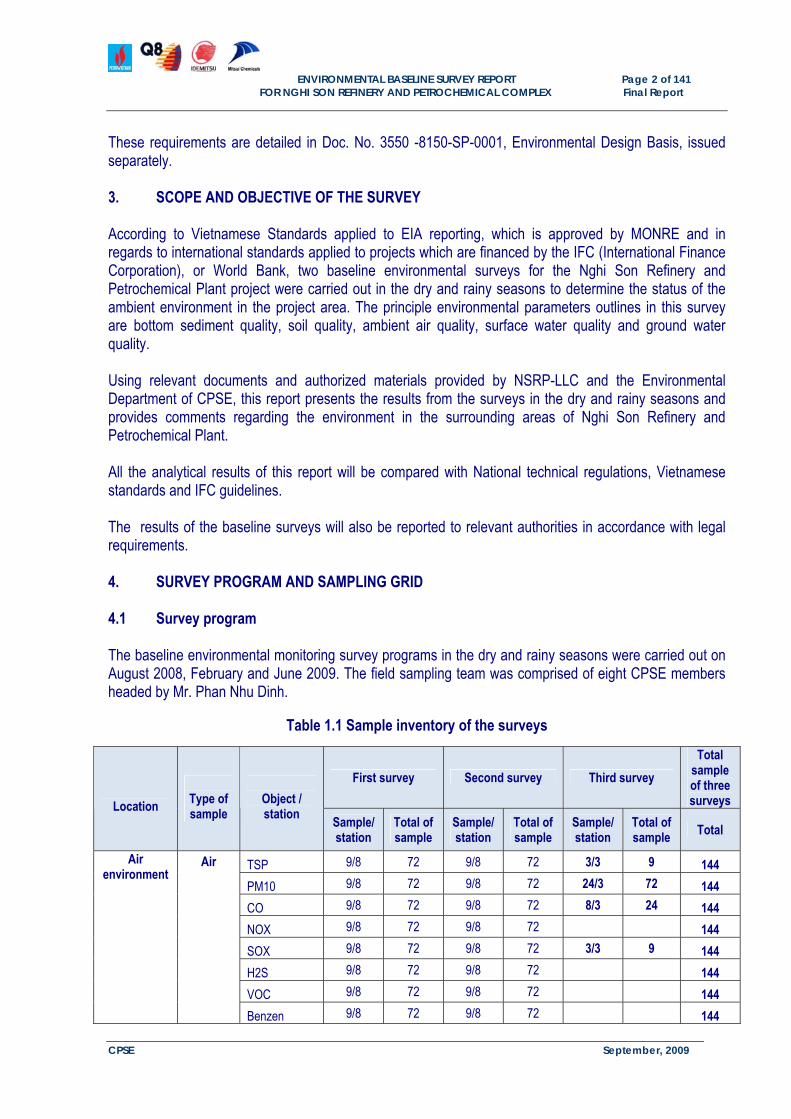
These requirements are detailed in Doc. No. 3550 -8150-SP-0001, Environmental Design Basis, issued separately. 3. SCOPE AND OBJECTIVE OF THE SURVEY According to Vietnamese Standards applied to EIA reporting, which is approved by MONRE and in regards to international standards applied to projects which are financed by the IFC (International Finance Corporation), or World Bank, two baseline environmental surveys for the Nghi Son Refinery and Petrochemical Plant project were carried out in the dry and rainy seasons to determine the status of the ambient environment in the project area. The principle environmental parameters outlines in this survey are bottom sediment quality, soil quality, ambient air quality, surface water quality and ground water quality. Using relevant documents and authorized materials provided by NSRP-LLC and the Environmental Department of CPSE, this report presents the results from the surveys in the dry and rainy seasons and provides comments regarding the environment in the surrounding areas of Nghi Son Refinery and Petrochemical Plant. All the analytical results of this report will be compared with National technical regulations, Vietnamese standards and IFC guidelines. The results of the baseline surveys will also be reported to relevant authorities in accordance with legal requirements. 4. SURVEY PROGRAM AND SAMPLING GRID 4.1 Survey program The baseline environmental monitoring survey programs in the dry and rainy seasons were carried out on August 2008, February and June 2009. The field sampling team was comprised of eight CPSE members headed by Mr. Phan Nhu Dinh.
Table 1.1 Sample inventory of the surveys
First survey Second survey Third survey
Total sample of three surveys
Location
Type of sample
Object / station
Sample/station
Total of sample
Sample/station
Total of sample
Sample/station
Total of sample Total
TSP 9/8 72 9/8 72 3/3 9 144
PM10 9/8 72 9/8 72 24/3 72 144
CO 9/8 72 9/8 72 8/3 24 144
NOX 9/8 72 9/8 72 144
SOX 9/8 72 9/8 72 3/3 9 144
H2S 9/8 72 9/8 72 144
VOC 9/8 72 9/8 72 144
Air environment
Air
Benzen 9/8 72 9/8 72 144
ENVIRONMENTAL BASELINE SURVEY REPORT Page 3 of 141
FOR NGHI SON REFINERY AND PETROCHEMICAL COMPLEX Final Report
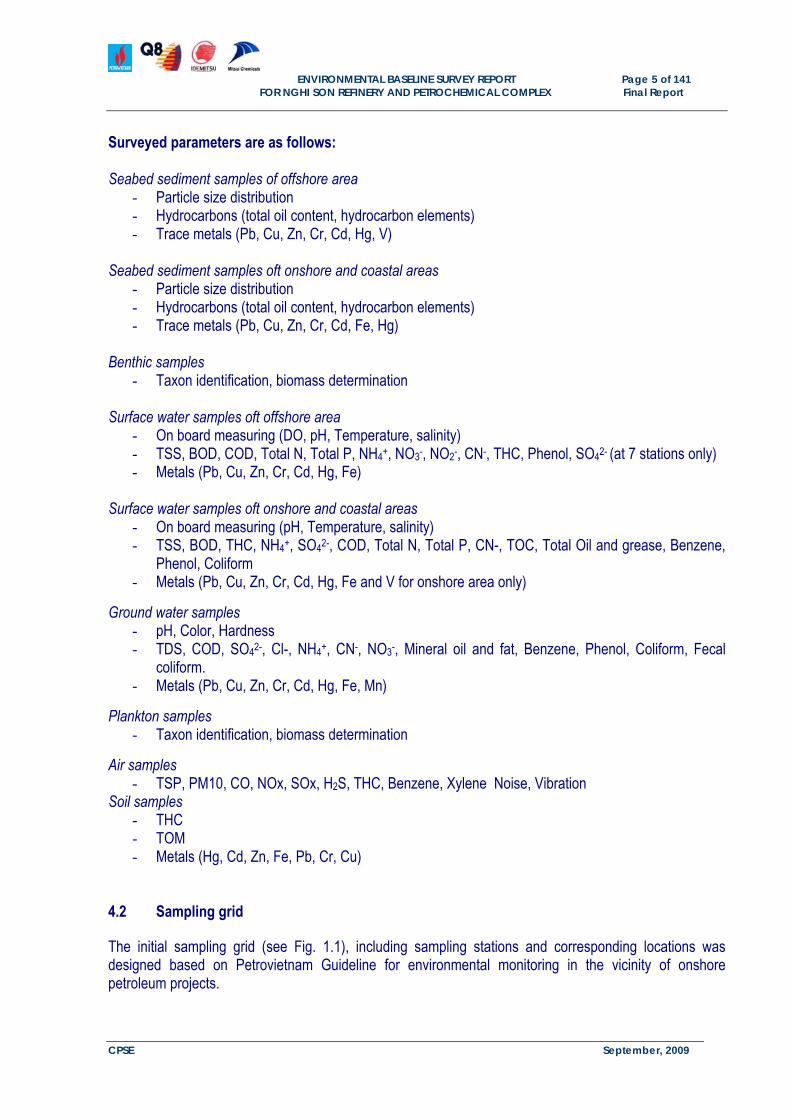
4.2 Sampling grid The initial sampling grid (see Fig. 1.1), including sampling stations and corresponding locations was designed based on Petrovietnam Guideline for environmental monitoring in the vicinity of onshore petroleum projects.
ENVIRONMENTAL BASELINE SURVEY REPORT Page 6 of 141
FOR NGHI SON REFINERY AND PETROCHEMICAL COMPLEX Final Report
CPSE September, 2009
Table 1.2 Co-ordinates of sampling stations
Station No. Location Y (m) X (m)
B-1 Bang river mouth 582403 2145255 B-2 Bang river 580628 2145943 B-3 Discharging site of project’s surface materials 580881 2142931 B-4 Treated wastewater discharging site of refinery plan 583207 2141610 B-5 Intake cooling water site for refinery plant 583467 2140543 B-6 Cooling water discharging site for refinery plant 583630 2139896 B-7 585726 2136850 B-8 585882 2135532 B-9
Around treated wastewater discharging site of product export berth
586049 2134913 B-10 In the middle area between B1 and B4 582736.2 2143735.6
Surface water, bottom
Sediment and biological
community at received
environment of discharged
effluents
B-11 Close to Nghi Son fishing village 586893.4 2138191.2 K-1 595662 2143171 K-2
Close to crude shipping channel (Me islet) 594440 2139681
K-3 Single point mooring (SPM) 596385 2143282 K-4 Mieng island 595199 2142263
K-7 Sea gate connecting Nghi Son cement jetty to export product berth
586110 2139096
K-8 Close to Nghi Son fishing village (floating fish cage) 585387 2138651 K-9 Turning basin of export product berth 585714 2135279
K-10 586340 2134219 K-11 587569 2132741 K-12
Shipping channel to export product berth 588187 2132357
G-3 Along pipeline system 583088 2139762 G-4 Nghi Son fishing village 586212 2135223 G-5 Product export berth 586042 2138253 G-6 At the east of refinery plant near the beach 582102.0 2141271.0
Ground samples
G-7 Refinery plant area 581014.7 2141872.5 D-1 Discharging site of project’s surface materials 580881 2142931 D-2 Future extension 579697 2140014 D-3 579714 2139604 D-4 581571 2140920 D-5
Refinery plant area 581919 2140049
D-6 Along pipeline system 583088 2139762 D-7 Nghi Son fishing village 586212 2135223 D-8 Product export berth 586042 2138253
Soil samples
D-9 Refinery plant area 581014.7 2141872.5 A-1 Populated area near Bang river 581809 2145674 A-2 Populated area of Hai Yen commune 581262 2142614 A-3 581571 2140920 A-4
Refinery plant area 579741 2139607
A-5 School area of Mai Lam commune 582102 2141271 A-6 Along product pipeline system 583085 2139745 A-7 Nghi Son fishing village 586207 2135224
Figure 1.2 Original Stations for Noise and Vibration at the Project Area
ENVIRONMENTAL BASELINE SURVEY REPORT Page 10 of 141
FOR NGHI SON REFINERY AND PETROCHEMICAL COMPLEX Final Report
CPSE September, 2009
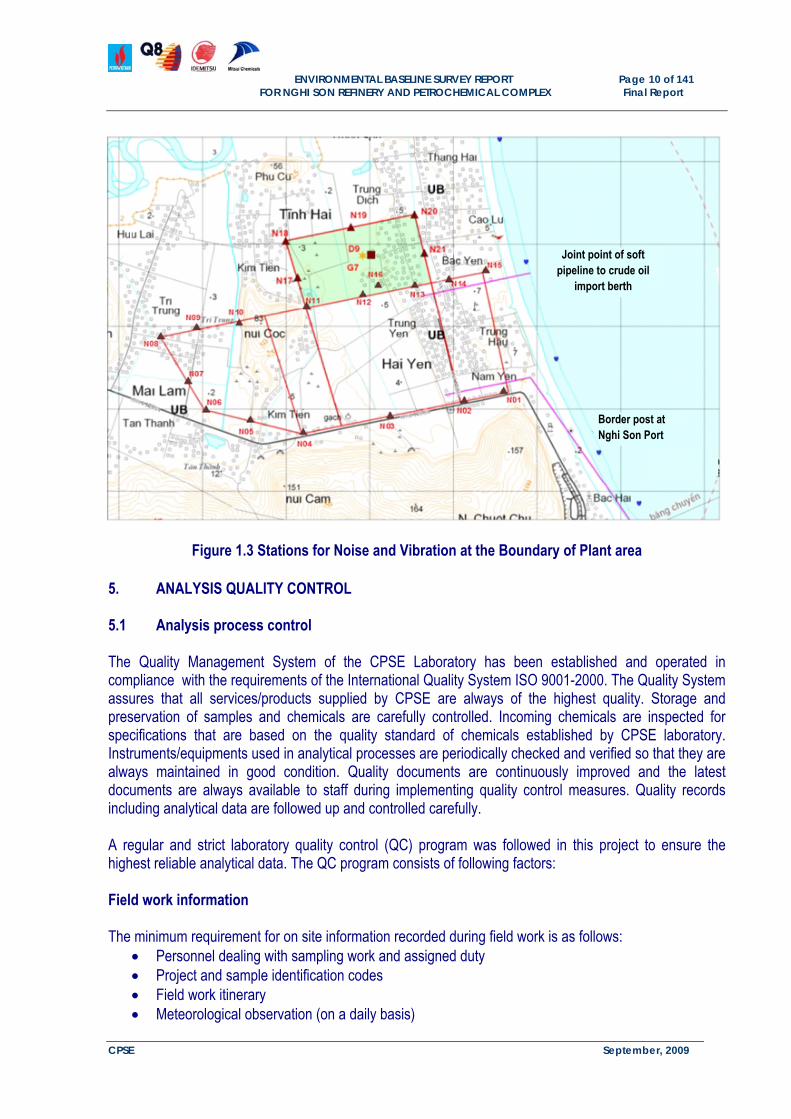
Figure 1.3 Stations for Noise and Vibration at the Boundary of Plant area
5. ANALYSIS QUALITY CONTROL 5.1 Analysis process control The Quality Management System of the CPSE Laboratory has been established and operated in compliance with the requirements of the International Quality System ISO 9001-2000. The Quality System assures that all services/products supplied by CPSE are always of the highest quality. Storage and preservation of samples and chemicals are carefully controlled. Incoming chemicals are inspected for specifications that are based on the quality standard of chemicals established by CPSE laboratory. Instruments/equipments used in analytical processes are periodically checked and verified so that they are always maintained in good condition. Quality documents are continuously improved and the latest documents are always available to staff during implementing quality control measures. Quality records including analytical data are followed up and controlled carefully. A regular and strict laboratory quality control (QC) program was followed in this project to ensure the highest reliable analytical data. The QC program consists of following factors: Field work information The minimum requirement for on site information recorded during field work is as follows:
Personnel dealing with sampling work and assigned duty Project and sample identification codes Field work itinerary Meteorological observation (on a daily basis)
Joint point of soft pipeline to crude oil
import berth
Border post at Nghi Son Port
ENVIRONMENTAL BASELINE SURVEY REPORT Page 11 of 141
FOR NGHI SON REFINERY AND PETROCHEMICAL COMPLEX Final Report
CPSE September, 2009
Sampling station geographical co-ordinates Sampling date and time Obtained samples description Sampling depth Parameters to be analysed in-situ
Sample storage
Samples are contained in tight containers made of available materials to prevent outside contamination.
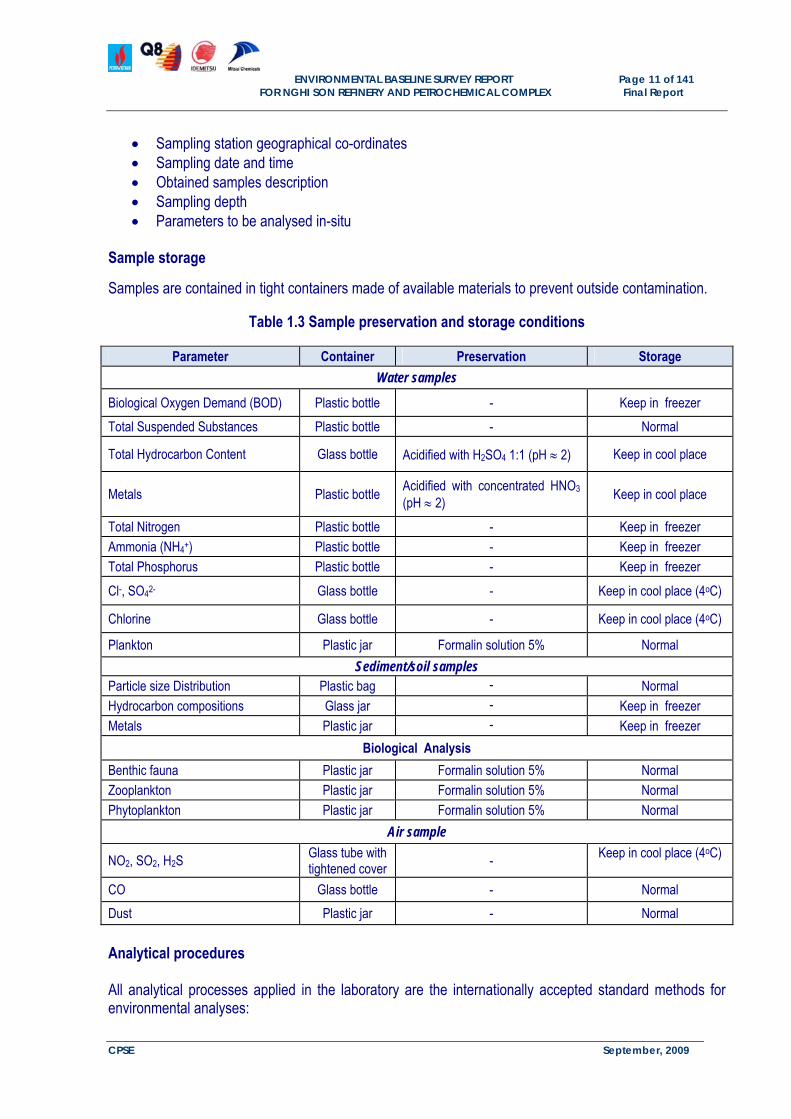
Table 1.3 Sample preservation and storage conditions
Parameter Container Preservation Storage
Water samples
Biological Oxygen Demand (BOD) Plastic bottle - Keep in freezer
Total Suspended Substances Plastic bottle - Normal
Total Hydrocarbon Content Glass bottle Acidified with H2SO4 1:1 (pH 2) Keep in cool place
Metals Plastic bottle Acidified with concentrated HNO3 (pH 2)
Keep in cool place
Total Nitrogen Plastic bottle - Keep in freezer Ammonia (NH4+) Plastic bottle - Keep in freezer Total Phosphorus Plastic bottle - Keep in freezer
Cl-, SO42- Glass bottle - Keep in cool place (4oC)
Chlorine Glass bottle - Keep in cool place (4oC)
Plankton Plastic jar Formalin solution 5% Normal
Sediment/soil samples Particle size Distribution Plastic bag - Normal Hydrocarbon compositions Glass jar - Keep in freezer Metals Plastic jar - Keep in freezer
Biological Analysis
Benthic fauna Plastic jar Formalin solution 5% Normal Zooplankton Plastic jar Formalin solution 5% Normal Phytoplankton Plastic jar Formalin solution 5% Normal
Air sample
NO2, SO2, H2S Glass tube with tightened cover
- Keep in cool place (4oC)
CO Glass bottle - Normal
Dust Plastic jar - Normal
Analytical procedures All analytical processes applied in the laboratory are the internationally accepted standard methods for environmental analyses:
ENVIRONMENTAL BASELINE SURVEY REPORT Page 12 of 141
FOR NGHI SON REFINERY AND PETROCHEMICAL COMPLEX Final Report
CPSE September, 2009
American Public Health Association, “ Standard methods for the examination of water and wastewater”, 19thEd.1995
The analytical processes are adopted and documented as directing working instructions of the laboratory Certification of Operator Competence
All analysts must be trained and qualified prior to implementation analyses or operation of analytical equipment. Analysis of Reagent Blanks
Analyzing reagent blanks whenever new reagents are used and as often as required in specific methods. These monitor the purity of the reagent and the overall procedural blank. Analysis of Duplicates
Analyzing duplicate is performed in order to assess the precision of analysis. The analytical data will be accepted if the divergence of analytical results is within acceptable limits. The precision is assessed by the value of the relative percent difference (R) �of duplicates. If the R-value of duplicates in a sample batch exceeds the acceptable value, the effected samples in this batch must be reanalyzed. Maintenance of control charts
Control charts are essential tools for quality control. Two types of control charts are used in the RDCPSE laboratory: Range and Means charts. A control sample is the sample collected and homogenized from seabed sediment samples. It has been used to control the analytical procedures. Analytical elements, which are quantitatively controlled in this report, are as follows:
Heavy metals
Heavy metals QC samples include duplicate analyses (equal to 10% of the sample batch) and control sample analyses (once a month). The relative percent difference (R-value) associated with the duplication experiments must be less than 30%. The R-values of control sample are used to construct R charts.
Grain size
QC procedure for the grain size analysis involves in analysis of 10% of the sediment samples in duplicate and assessment of variability in the measurements. The relative percent difference for the duplicate analyses is considered to be acceptable if it does not exceed 30%. Mean and R charts are constructed from the R-values of duplicates of control sample.
Hydrocarbon and PAH Analyses
Batches of 10 sediment samples are processed in the laboratory. Each batch is accompanied by procedural blank and duplicate samples. The relative percent difference for the duplicate analyses is acceptable if it meet the requirements of the QC procedure for hydrocarbon and PAH analysis. The R-values of the control sample were used to set up mean and R charts. Experimental instruments are periodically verified for GC/FID and autotuned for GC/MS. The obtained verification values are required to meet the criteria of HP manufacturer. If these criteria are not satisfied, the instruments
ENVIRONMENTAL BASELINE SURVEY REPORT Page 13 of 141
FOR NGHI SON REFINERY AND PETROCHEMICAL COMPLEX Final Report
CPSE September, 2009
shall be corrected. Samples which do not meet these criteria are reviewed by the analyst and the Laboratory Manager prior to acceptance of data.
Total Oil Content (UVF)
Similar to hydrocarbon and PAH analyses, 10% of duplicate and 10% of procedural blanks are analyzed. The relative percent difference for the duplicate analysis is considered to be acceptable if it does not exceed 30%. The RF-1501 instrument used for determination of total oil content is also verified every six months.
Water analysis
Ten percent of duplicates are analyzed for all water physico-chemical analyses. The relative percent differences for the duplicate measurements are considered to be acceptable if they do not exceed 30%.
5.2 Rules of figure representation in summary result table
Analytical results for each station is calculated from those of the corresponding replicates. The result consists of the average value accompanies with its standard deviation. The rule for rounding number of the decimals for each station result is based on significant digits stipulated by its variation coefficient calculated from reproduction of the result.
(*) Relative percent difference
6. SAMPLING AND ANALYTICAL METHODS 6.1 Sampling methods All sampling methods were based on “Guidelines for environmental monitoring in the vicinity of onshore petroleum projects in Vietnam” promulgated by Petrovietnam in July 2006. Sediment sample Seabed sediment was collected using a Day Grab with a sampling area of 0.1 m2. Sediment samples were then sub-sampled into suitable containers for analyses of particle size distribution, metals, hydrocarbons and other analyses. The sediment samples were kept in a freezer at approximately -20oC until analyzed. Grab samples for benthic macro faunal analysis, to be acceptable, must be filled at least two third of the grab volume. Benthic macro faunal samples were screened with a 1.0-mm mesh sieve. The materials retained by the sieve were fixed with 5% stained formalin. Water sample Water samples were collected at 5m depth using a bathometer. Sub samples for metal analysis were fixed by nitric acid and sub samples for oil content analysis were fixed by sulfuric acid.
%100.
2
)( 21
21
XX
XXR
ENVIRONMENTAL BASELINE SURVEY REPORT Page 14 of 141
FOR NGHI SON REFINERY AND PETROCHEMICAL COMPLEX Final Report
CPSE September, 2009
Parameters of DO, pH and Salinity are measured directly in sampling field by Water Quality Checker WQC-A22, TOA, Japan and Oxygen Meter WTW -OXI-196 - Germany. Phytoplankton Fifty liters of water were taken at a depth of 0.5 m and filtered through a net of 25µm mesh. Organisms remaining on the net and bucket were carefully washed and transferred into 250 ml plastic bottles with 5% stained formaline. Zooplankton Zooplankton samples are taken by 80 µm Juday net with flow meter attached for water volume determination. The samples were then carefully washed and transferred into 250 ml plastic bottles with 5% stained formaline. Air samples For NO2, SO2, H2S Absorption of the specified gas present in the air sample by passage through a solution within a specified period resulting in the formation of a mixture of complexes, the solution was then transferred to the laboratory to be analyzed. Desaga gas samplers were used with pre-installed air temperature, volume and pressure control unit. For CO, Suspended particulate matter and Total hydrocarbon A volume of five-hundred milliliters air sample was taken and contained in a glass bottle, 1 ml of PdCl2 1‰ was added then; this mixture of air-chemical was preserved by tightened cover. Suspended particulate matter and lead present in ambient air wereobtained by filter paper. In addition, a volume of at least 250ml was also taken by appropriate gas syringe for total hydrocarbon content determination. All of these samples were then moved to the laboratory for corresponding analyses. Parameters of noise and vibration were measured on-site by Noise and Vibration Integrator-Quest Technologies USA. 6.2 Analytical method 6.2.1 Hydrocarbon Analysis Extraction and fractionation of hydrocarbons The samples were stored in glass bottles at –20oC until extraction and analysis. When being analyzed, the sample was defrosted, homogenized, and sub-sampled for analysis. The exact amount of heptamethylnonane (HMN.), chlorooctadecane (COD.), squalane (Sq.), d8-naphthalene, d10-anthracene, d12-chrysene and d12-pyrene were added to the sediment as internal standards prior to extraction. The sediment sample was extracted with a mixture of petroleum ether and iso-propanol (1:4 v/v) using Soxhlet apparatus. The extract was rinsed by distilled water to reject iso-propanol and determined Total Hydrocarbon Content (THC) by GC method. The extract was cleaned by a silica gel column and then
ENVIRONMENTAL BASELINE SURVEY REPORT Page 15 of 141
FOR NGHI SON REFINERY AND PETROCHEMICAL COMPLEX Final Report
CPSE September, 2009
fractionated by an alumina column. The aliphatic fraction was then analyzed by GC method and the aromatic fraction was analyzed by GC-MS method.
Gas Chromatography
The aliphatic fraction was examined by gas chromatography (GC) under the following conditions:
Instrument : Hewlett Packard 6890 Injector : Grob Split/splitless at 310oC Column : HP1 Part No. 19091Z – 413
Capillary 60m x 250µm x 0.25mm nominal 325oC Max Temperature : 50-280oC at 4oC/min, 280oC for 60 min Detector : Flame ionization Carrier gas : Nitrogen Data handling : HP Chemstation Version 4.2 Gas Chromatography/Mass Spectrometry (GC-MS)
The aromatic fraction was analyzed by GC-MS using a GC-HP 6890 and MS-HP 5972A under the following conditions:
Column : HP5MS part No.19091S-433 Capillary 60m x 0.25mm x 0.25µm film thickness Injector : Split/splitless at 300oC Temperature : 50oC for 3 min. then 50oC –100oC at 20oC/min. 100o-280oC at 4oC/min 280oC for 50 min. Carrier gas : Helium Ion source : 280oC Electron energy : 70eV MS mode : SIM (Selected Ion Monitoring) 6.2.2 Metal Analysis Sample preparation
For almost metals (except mercury)
Field moist sample were stored in a freezer, then defrosted and homogenized. Approximately 25g of field moist sample was taken and oven-dried at temperature below 100oC until dry. The sample was then finely ground to at least 99% passing through 125µm sieve. After thoroughly mixing, a sub sample of approximately 0.3 g (to the nearest 0.001 g) of ground sample was taken for digestion. The sub sample was dissolved with a mixture of concentrated nitric acid and hydrofluoric acid. The dissolved sample solution was heated at approx. 200oC to remove the overused acids. Finally, it was filtered and made up to 25 ml with distilled water for AAS analysis.
For mercury
A sub sample of approximately 1.5 g (to the nearest 0.001 g) was taken after thoroughly ground and mixed as described above. The sub sample was digested by a mixture of concentrated nitric acid and perchloric acid at temperature below 80oC until the reactions completed. Then the dissolved sample solution was filtered and made up to 25 ml with distilled water.
ENVIRONMENTAL BASELINE SURVEY REPORT Page 16 of 141
FOR NGHI SON REFINERY AND PETROCHEMICAL COMPLEX Final Report
CPSE September, 2009
AAS analysis The normal metal (except for mercury) analysis was performed by Atomic Absorption Spectrometry (AAS) using an automated Shimadzu AA-6501S Spectrophotometer in the flame mode by calibration standard method with appropriate wavelengths. The mercury analysis was determined by Atomic Absorption Spectrophotometry with cold vapor technique. Polarography Analysis
Some trace metals in seawater (Cu, Pb, Cd, Zn) were analyzed by differential pulse polarography using Polarographic Analyzer CPA-HH1. 6.2.3 Sediment Grain Size Distribution Grain size has been expressed using the phi (Φ) scale where Φ = -log2d (d means diameter of the particle in mm). Grain size distribution of the sediments was analyzed by a combination of wet and dry sieving (Buchanan, 1984) for particles larger than 4Φ (63 µm) in diameter and by particle size laser instrument for material smaller than 4Φ. Sample pre-treatment
Approximately 100 g sediment sample was treated by hydrogen peroxide for removing the organic matter. After that, the sample was wet-sieved on a 63µm (4Φ) mesh sieve to separate sample into two fractions, coarse fraction and fine fraction.
Particles larger than 4 Φ
The fraction coarser than 4Φ was dried to constant weight at 105oC. After drying the sample was sieved, with mesh size of sieves ranging from -1Φ to 4Φ at 1 Φ intervals. The sieves were automatically shaken by a “Fritsch Analysette 3” shaker (Germany) for ten minutes, and then the fractions retained at each size-class were collected and weighed to the nearest 0.0001g.
Particles smaller than 4 Φ
This fraction was graduated to 1000ml with distilled water, pipetted 25 ml then dried at 105oC and weighed for determining the weight of this fraction. The distribution of 6 size-classes (from 5Φ to 10Φ) in this fraction was determined using a Fritsch Analysette 22 Laser Particle Sizer (Germany).
Data analysis
The data from the sieving and laser method were combined and analyzed by a computerized ‘Moment’ method. The ‘Moment’ measures the grain size distribution in terms of phi mean, phi standard deviation, phi skewness and phi kurtosis. This method has the advantage over graphical techniques in that all of distribution data are used in computation and not just a few points on the cumulative curve.
ENVIRONMENTAL BASELINE SURVEY REPORT Page 17 of 141
FOR NGHI SON REFINERY AND PETROCHEMICAL COMPLEX Final Report
CPSE September, 2009
6.2.4 Benthic Macro fauna Analysis
Analysis for each sample in the whole sample batch was separately performed. The results were presented in the report as detailed figures for each sample as well as combined results from 5 grabs of samples at each station. Each sample was washed on a 1mm-mesh sieve in order to remove preservative and any remaining fine sediment. All animals in the retained material were picked out under bright light. The organisms were identified to the lowest practicable taxon and counted where appropriate. Colonial organisms (e.g. hydroids and bryozoans), attached epifaunal taxa (e.g. barnacles) and foraminiferans were recorded for qualitative purpose only. The pooled data for each station were subjected to the following analyses: Calculation of diversity and dominance indices These combine and summarize, in a single value, two important aspects of community structure; firstly species or taxon richness and secondly the comparative abundance of each taxon (evenness or equability). For each station, three indices commonly used in macro benthic studies were calculated: Shannon-Wiener information function, H(s)
Where C = 3.321928 (constant used in converting log10 to log2) N = the total number of individual ni = the number of individuals in the ‘ith’ species s = the total number of species
Pielou’s evenness index, J
Where H(s) = the Shannon-Wiener information function H(max) = the theoretical maximum value for H(s) if all species in the sample are equally abundant.
Expected number of species in a rarefied sample ESI
Where: ESI Expected number of species in a sample of I individuals
S Total number of species in original sample I Total number of individuals in hypothetical sample Ic Total number of individuals in original sample Ij Number of individuals in species j of original sample
H(s) = Nlog10N - nilog10ni s
i = 1
C
N
H(max.) J =
H(s)
ESI = S - (Ic) -1
I
(Ic-Ij)
I
s
. i=1
ENVIRONMENTAL BASELINE SURVEY REPORT Page 18 of 141
FOR NGHI SON REFINERY AND PETROCHEMICAL COMPLEX Final Report
CPSE September, 2009
6.2.5 Water parameters Total suspended solids
A quantity of 500 ml of sample is filtered through a 0.45 µm filter paper. The residue retained on the filter paper is dried to constant weight at 103 – 105oC. The increase of weight of the filter paper represents total suspended solids in water. Total hydrocarbon content
A water sample is extracted by dichloromethane and the total hydrocarbon content is determined by UVF technique using Bach Ho standard oil. Metals
Certain trace metals in water (Cu, Pb, Zn and Cd) are identified by differential pulse polarography using Polarographic Analyzer CPA-HH1. Other metals are identified by the AAS method. Total Nitrogen Analysis
A 20 ml test water sample is taken into a 50 ml digestion flask. The sample is then added 10 ml of the K2S2O8 solution and digested in an autoclave at 110oC for 20 minutes to convert total nitrogen composition to anion NO3-. The solution is then transferred to a 100 ml volumetric flask. The digestion flask is then washed with distilled water and the flask is filled with this water. After dilution the solution is used for determination of nitrate using cadmium reductor column, nitrate is reduced to nitrite. In the determination of nitrite 2ml reagent mixture is used which consists of N-(1-naphthyl)-ethylenediamine dihydrochloride. After 20 minutes of reaction, the solution is measured its absorbance at wave length of 543 nm using spectrophotometer Shimazdu UV-1201. Total Phosphorus Analysis
Pour 25 ml of sample into a 100 ml digestion flask. 5 ml of the K2S2O8 solution is then added to the sample and digested in an autoclave at 120oC for 30 minutes to convert phosphorus to PO43-. Transfer the solution to a 50 ml volumetric flask. In the determination of phosphate 8ml reagent mixture is used which consists of H2SO4, (NH4)2MoO4, ascorbic acid and Antimonyl potassium tartrate. After 30 minutes of reaction the solution is measured its absorbance at 882 nm by Spectrophotometer Shimazdu UV-1201. Ammonium analysis
The sample is pretreated with ZnSO4 prior to direct Nesslerization. Pour 20 ml of pretreated sample into 50ml flask. The N-NH4+ is determined by reacting with Nessler reagent which consists of HgCl2, KI, NaOH to form a yellow complex. Add 2ml of Nessler reagent and fill this into the volumetric flask. After 20 minutes of reaction the solution is measured its absorbance at wave length of 425 nm using spectrophotometer Shimazu UV-1201. Biochemical oxygen demand analysis The biochemical oxygen demand is determined by measuring of initial dissolved oxygen (DO) of the sample and the final DO after a 5 days period of incubation.
ENVIRONMENTAL BASELINE SURVEY REPORT Page 19 of 141
FOR NGHI SON REFINERY AND PETROCHEMICAL COMPLEX Final Report
CPSE September, 2009
Phenol Analysis
Phenols were distilled from non-volatile impurities. Because the volatilisation of phenols was gradual, the distillate volume must be ultimately equal that of the original sample. Steam- distillable phenols react with 4-amino antipyrine at pH 7.9 0.1 in the presence of potassium ferricyanide to form a colored antipyrine. This dye was then extracted from the aqueous solution with CHCl3 and the absorbance was measured at 460nm. Chemical Oxygen Demand (COD)
COD was analysed following the Reflux method. A pre-determined amount of sample was oxidized by a boiling mixture of an excess amount of Potassium dichromate (K2Cr2O7) and sulfuric acid (H2SO4). After 2 hours digestion, the remaining K2Cr2O7 was titrated by ferrous ammonium sulfate (Fe(NH4)2(SO4)2) with O. Phenanthrolene as indicator. The amount of oxidizable organic matter was calculated in terms of oxygen equivalent. Dissolved solids
The sample is then filtered through a 0.45 µm filter paper to reject total suspended solid. Pipette an exact amount of sample in to beaker, the sample is evaporated to dryness in a weighed beaker and dried to constant weight at 105oC. The increase of weight of the beaker represents the total dissolved solids in water.
Coliform
Coliform was determined according to MPN (Most Probable Number) method, using Lactose broth medium in guessing phase and Brilliant Green Lactose Bile Broth in defining phase. Both of guessing and defining phase used the same regime of incubation at 35oC in 48 hours. Chlorides
Chloride was determined in a neutral or slightly alkaline solution by titration with silver nitrate. The end point of titration was indicated by potassium chromate, which form a red silver chromate precipitation after all chloride was precipitated as silver chloride. Cyanide Analysis
Cyanide content was analyzed by the Centre of Analytical Services and Experimentation according to TCVN 6181-96 method. Total mineral oil and grease
The samples were extracted by Dichloromethane before being measured by UVF technique with the instrument Spectrofluorometer RF-1501 (Shimadzu – Japan). The DO crude oil was used to establish the calibration curve. Zooplankton analysis
A water sample used to identify zooplankton is poured on counting disk, The organisms are then counted and identified to the lowest taxa by spectroscope.
ENVIRONMENTAL BASELINE SURVEY REPORT Page 20 of 141
FOR NGHI SON REFINERY AND PETROCHEMICAL COMPLEX Final Report
CPSE September, 2009
Phytoplankton analysis
A water sample used to identify phytoplankton is condensed by decantation; organisms are then counted in count cell and identified to the lowest taxa by spectroscope. Water Quality Measurement
Temperature, pH, Salinity, Dissolved Oxygen (DO) were measured in-situ by TOA water quality checker WQC A-22. 6.2.6 Air quality parameters For the parameters of NO2, SO2, H2S
The absorbent solutions are treated by specified chemical reagents to form coloured solutions. The content of such gases in ambient air are determined by colorimetry method. For CO parameter
The sample in the glass bottle is treated with a specified reagent to form a coloured solution, CO content is also determined by colorimetry method.
Dust content (or Suspended Particles Mater- SPM) in ambient air is determined by gravimetric method, divergence between the weight of filter paper after sampling and that of before sampling is the weight of the dust sample.
Gas chromatography (GC) is used to analyze Total hydrocarbon content in ambient air. 7. RESULTS AND DISCUSSION 7.1 Offshore area 7.1.1 Characteristics of seabed sediment Grain size distribution in seabed sediment
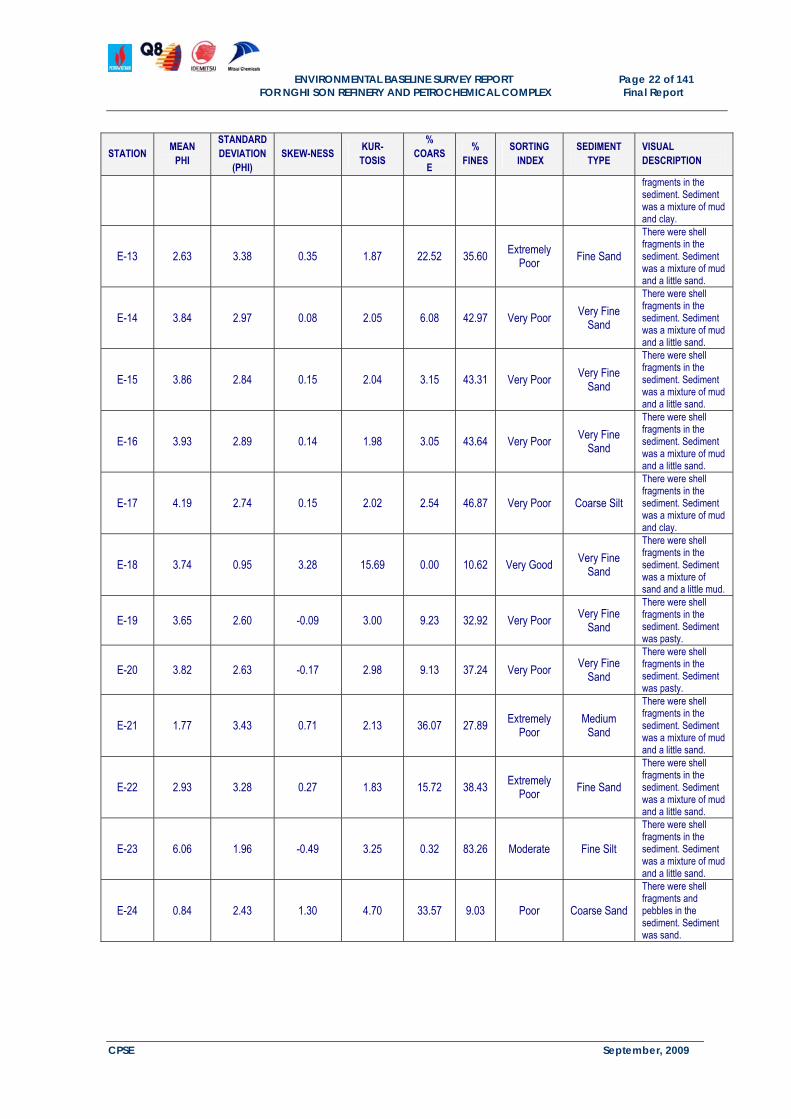
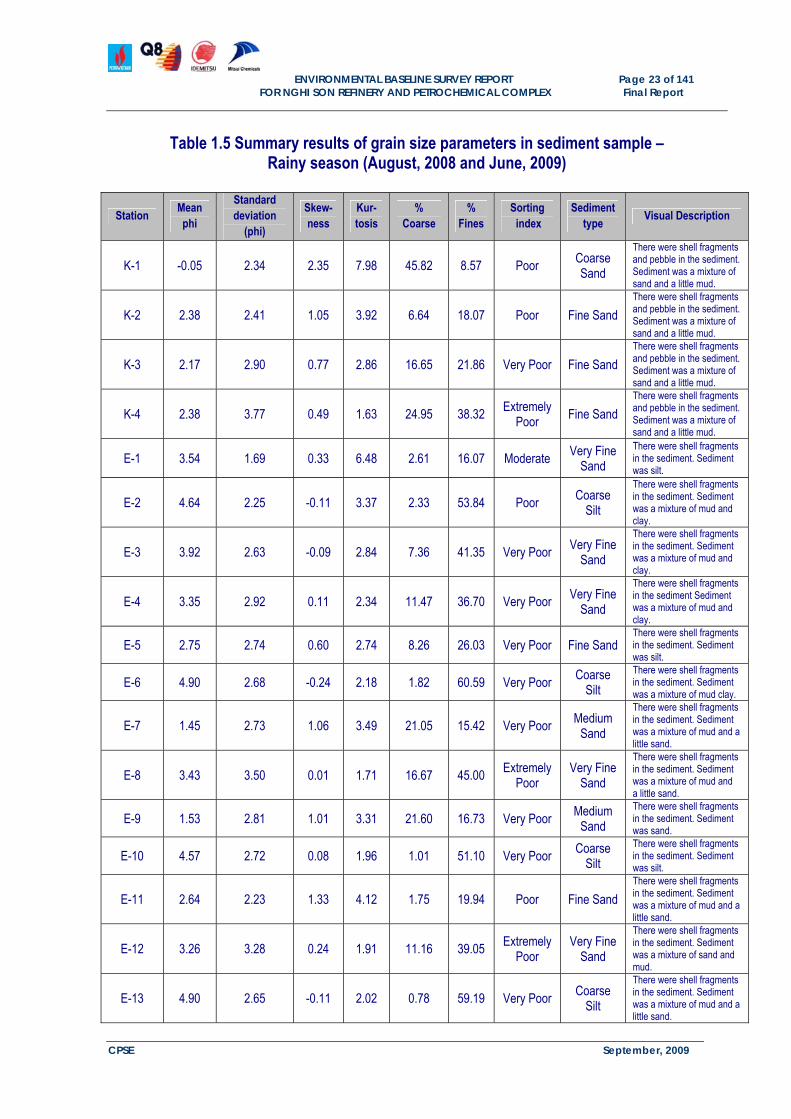
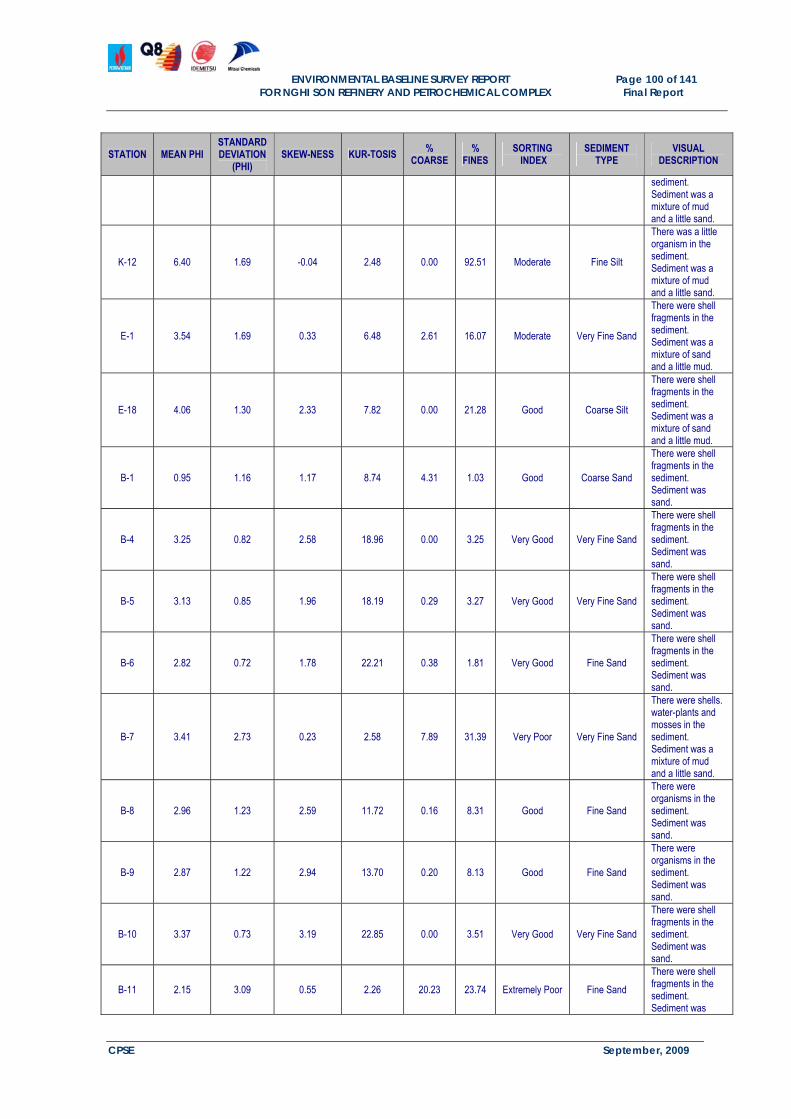
The grain size distribution in the seabed sediment is summarized in Tables 1.4 and 1.5. A visual description of surface sediment and sampling time are detailed in Appendix A – Survey log.
Table 1.4 Summary results of grain size parameters in sediment sample – Dry season (Feb. 2009)
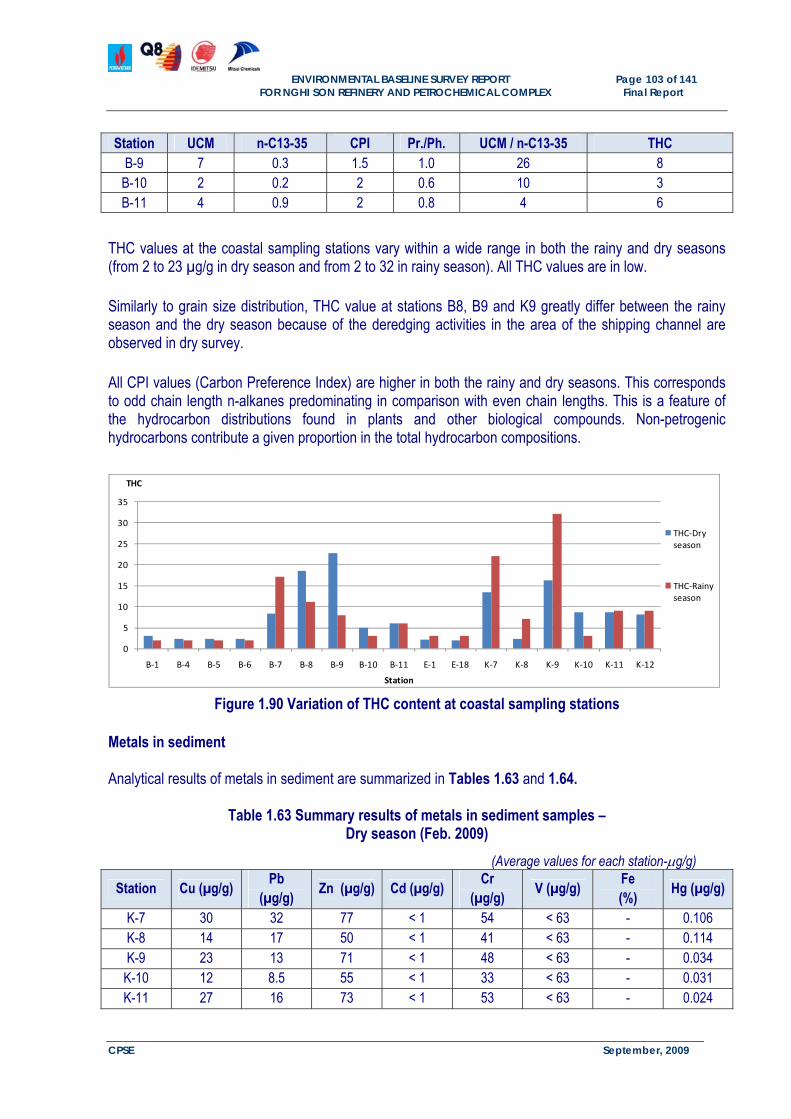
There were shell fragments in the sediment. Sediment was a mixture of mud and a little sand.
E-24 1.24 2.87 1.18 3.52 24.67 15.69 Very Poor Medium Sand
There were shell fragments and pebbles in the sediment. Sediment was sand.
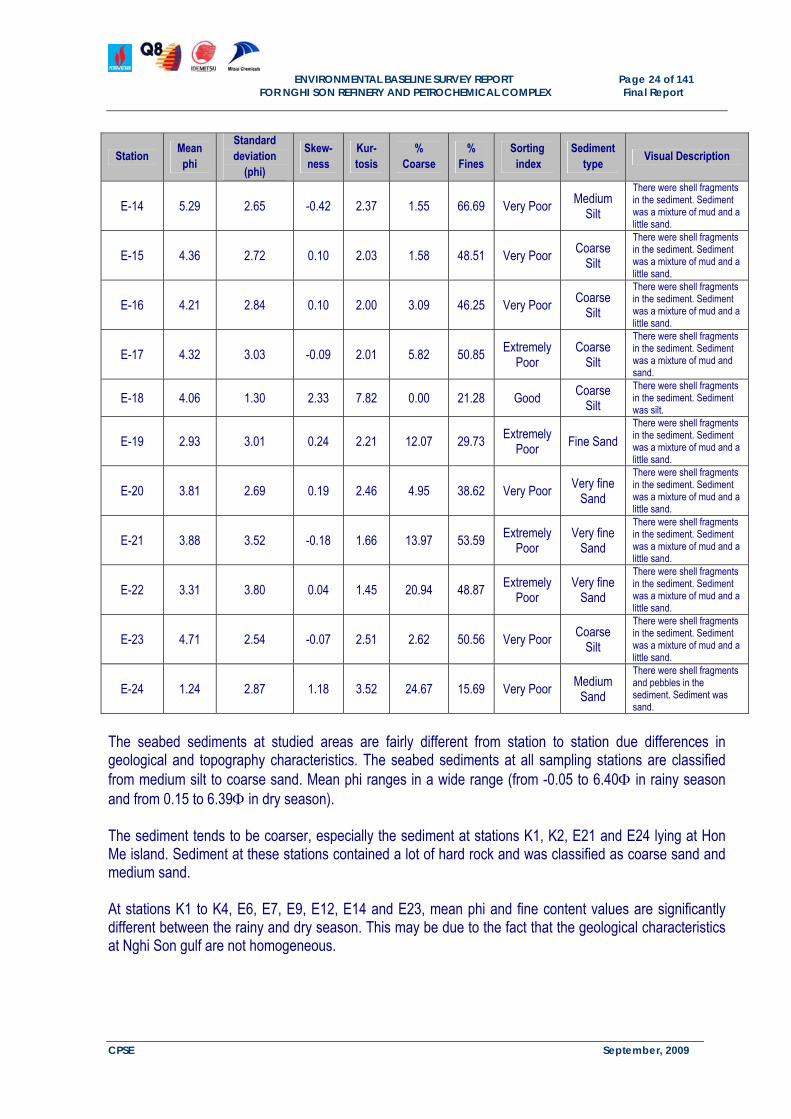
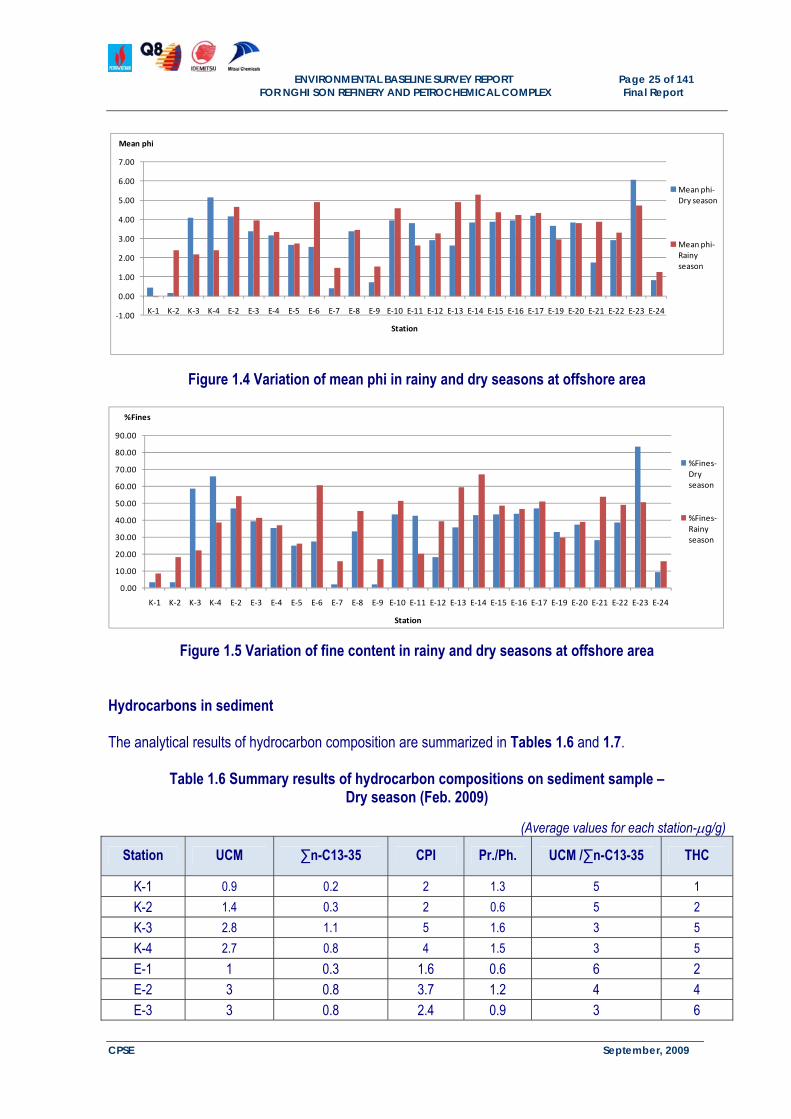
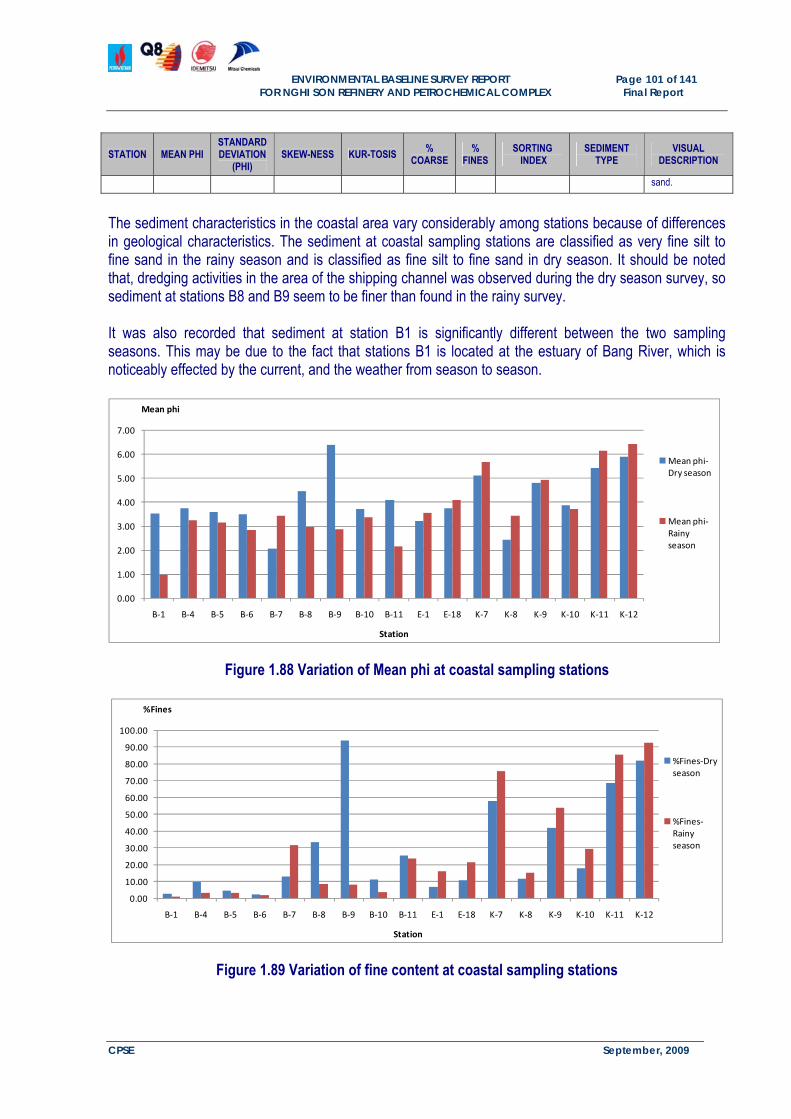
The seabed sediments at studied areas are fairly different from station to station due differences in geological and topography characteristics. The seabed sediments at all sampling stations are classified from medium silt to coarse sand. Mean phi ranges in a wide range (from -0.05 to 6.40 in rainy season and from 0.15 to 6.39 in dry season). The sediment tends to be coarser, especially the sediment at stations K1, K2, E21 and E24 lying at Hon Me island. Sediment at these stations contained a lot of hard rock and was classified as coarse sand and medium sand.
At stations K1 to K4, E6, E7, E9, E12, E14 and E23, mean phi and fine content values are significantly different between the rainy and dry season. This may be due to the fact that the geological characteristics at Nghi Son gulf are not homogeneous.
ENVIRONMENTAL BASELINE SURVEY REPORT Page 25 of 141
FOR NGHI SON REFINERY AND PETROCHEMICAL COMPLEX Final Report
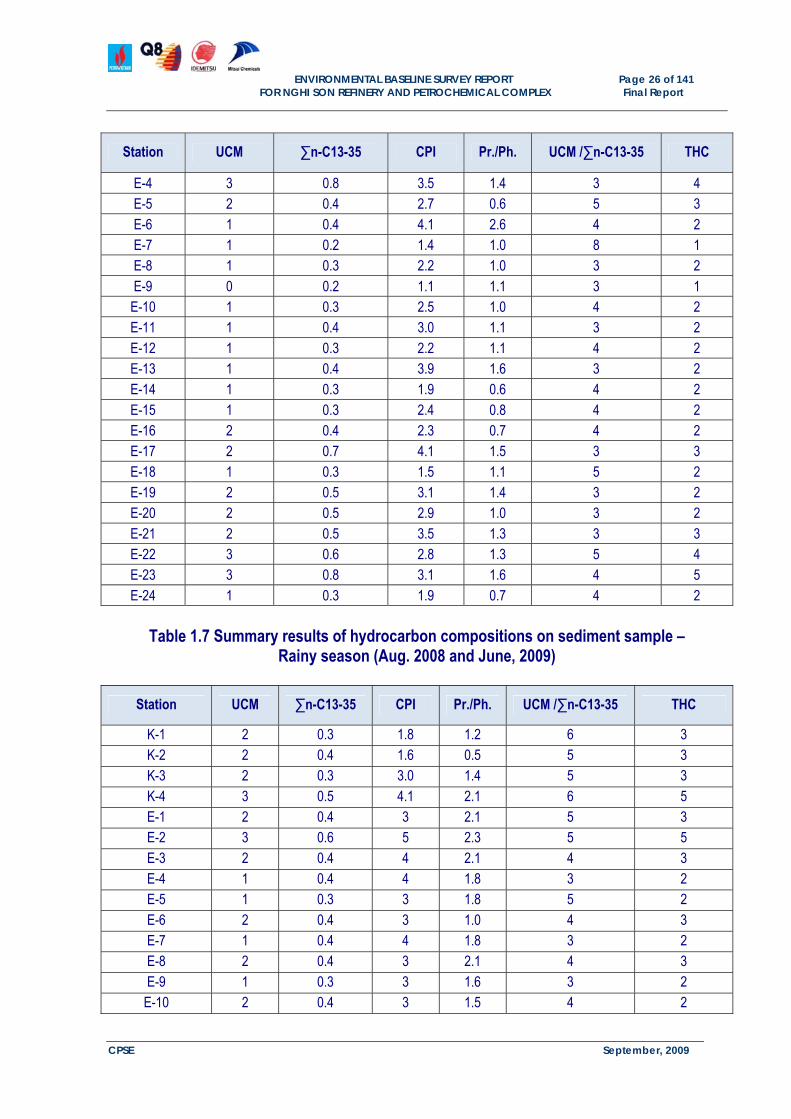
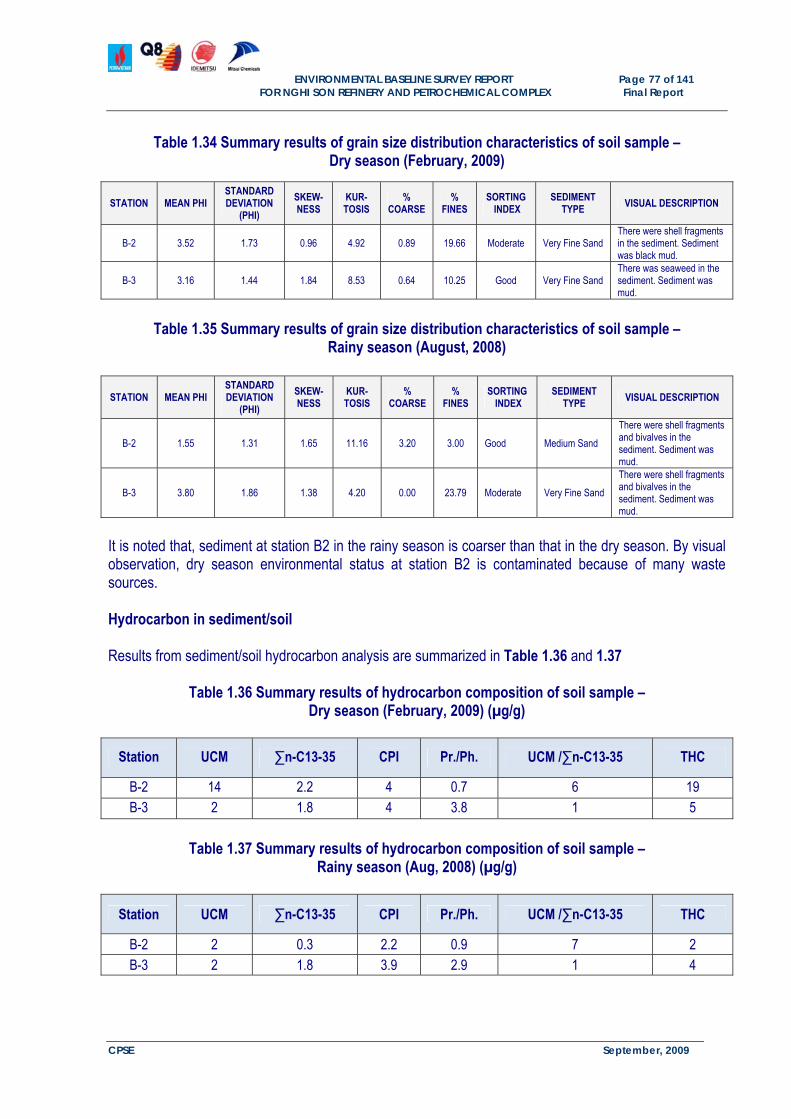
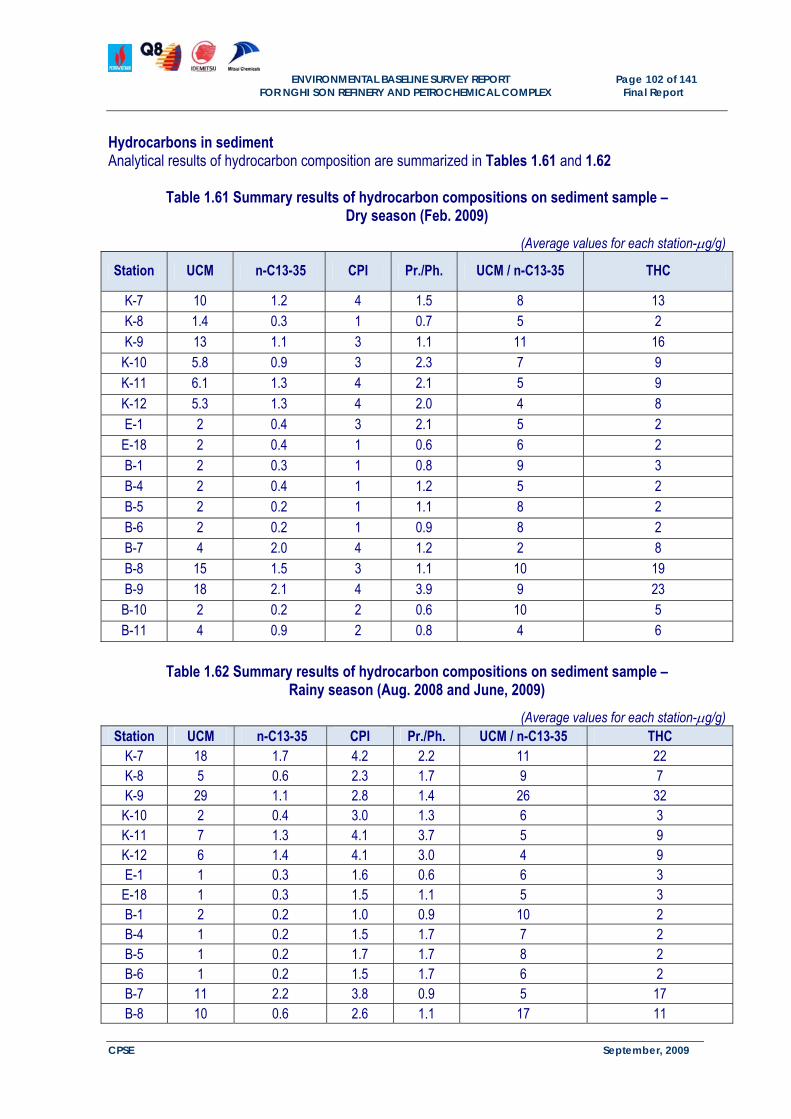
Figure 1.5 Variation of fine content in rainy and dry seasons at offshore area Hydrocarbons in sediment The analytical results of hydrocarbon composition are summarized in Tables 1.6 and 1.7.
Table 1.6 Summary results of hydrocarbon compositions on sediment sample – Dry season (Feb. 2009)
(Average values for each station-g/g)
Station UCM ∑n-C13-35 CPI Pr./Ph. UCM /∑n-C13-35 THC
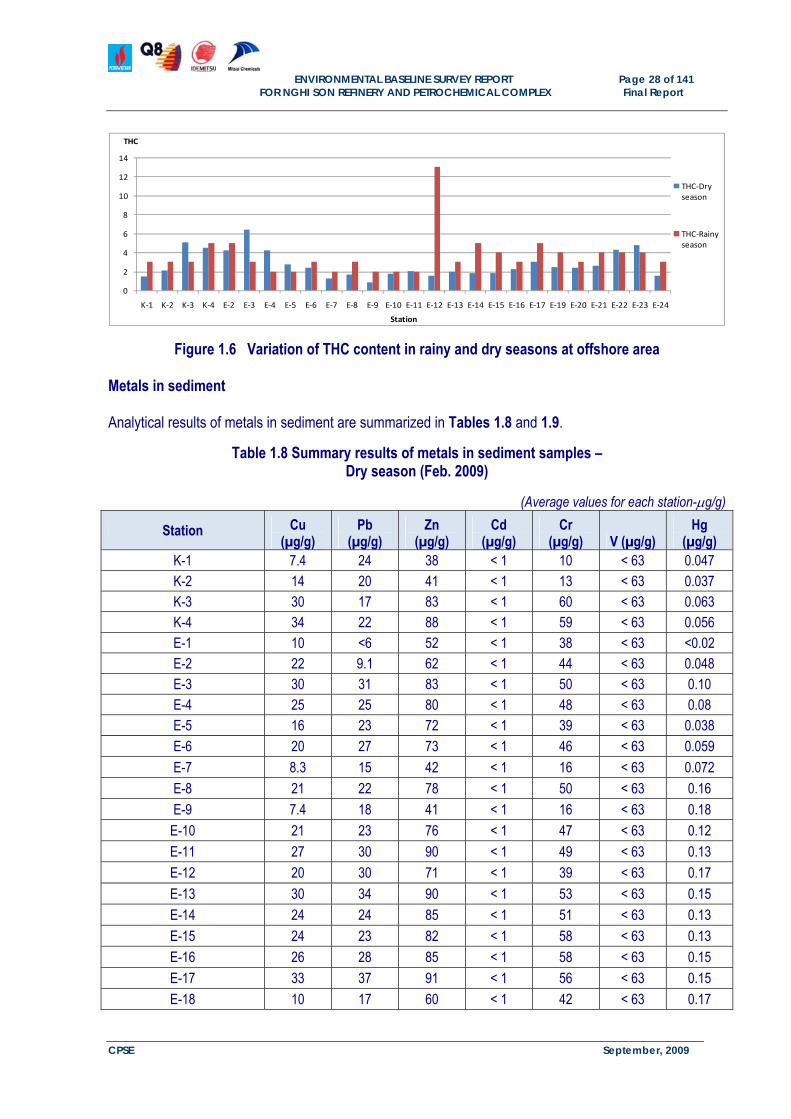
Hydrocarbon constituents and other organic matters in sediment exist in dynamic equilibrium including two discrepant physic-chemical processes: (i) accumulation of settled hydrocarbon into sediment from the water and/or hydrocarbon from the earth’s womb; (ii) biodegradation and/or diffusion of hydrocarbon from the sediment into water. These active processes are impacted by a variety of environmental condition (temperature, current, sediment characteristics etc.) as well as human activities (drilling activities, waste discharge, etc). As a consequence, content of hydrocarbon constituents in sediment can vary over the time. THC values at offshore sampling stations vary in a narrow range in both of rainy and dry seasons (from 1 to 6 µg/g in dry season and from 2 to 13 in rainy season). Similar to grain size distribution, THC values at stations K3, E3, E4, E8, E9, E12, E14, E15 and E24 greatly differ from season to season. It is evident that, THC and metals values seem to be higher where the sediment is finer. All CPI values (Carbon Preference Index) are higher than 1 in both the rainy and dry seasons. This corresponds to odd chain length n-alkanes predominating in comparison with even chain lengths. This is a feature of the hydrocarbon distributions found in plants and other biologic compounds. Non-petrogenic hydrocarbons contribute a given proportion in the total hydrocarbon compositions.
ENVIRONMENTAL BASELINE SURVEY REPORT Page 28 of 141
FOR NGHI SON REFINERY AND PETROCHEMICAL COMPLEX Final Report
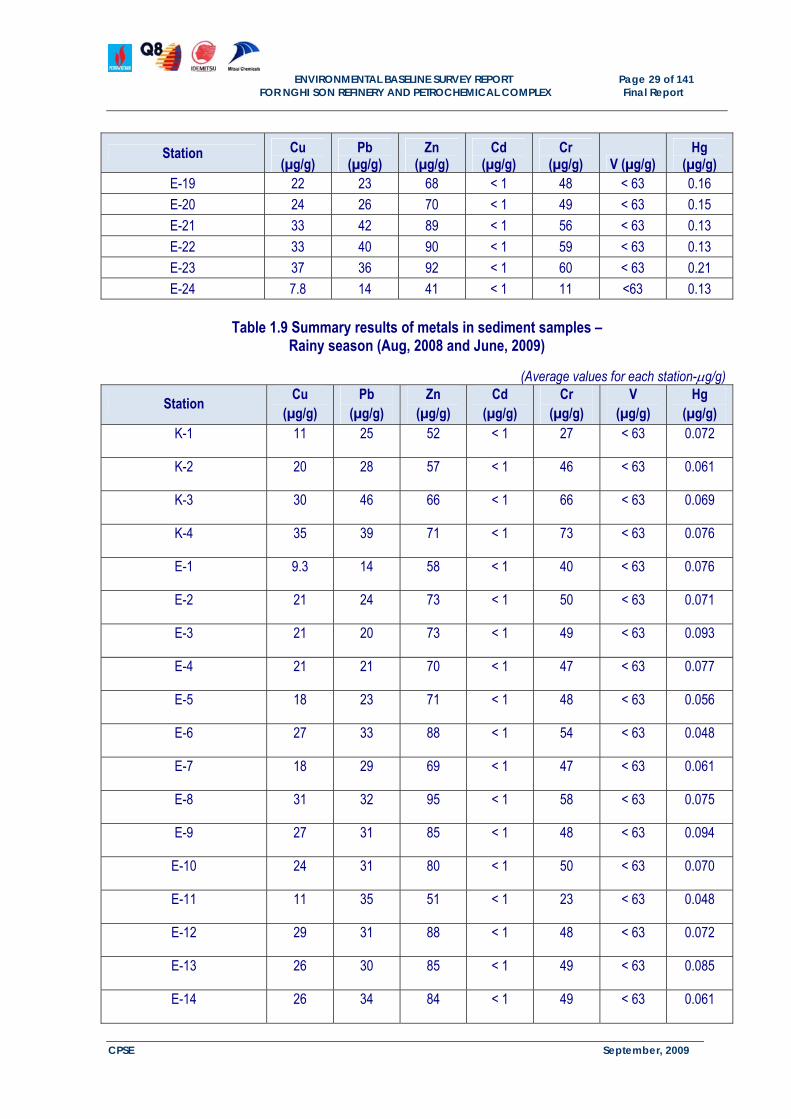
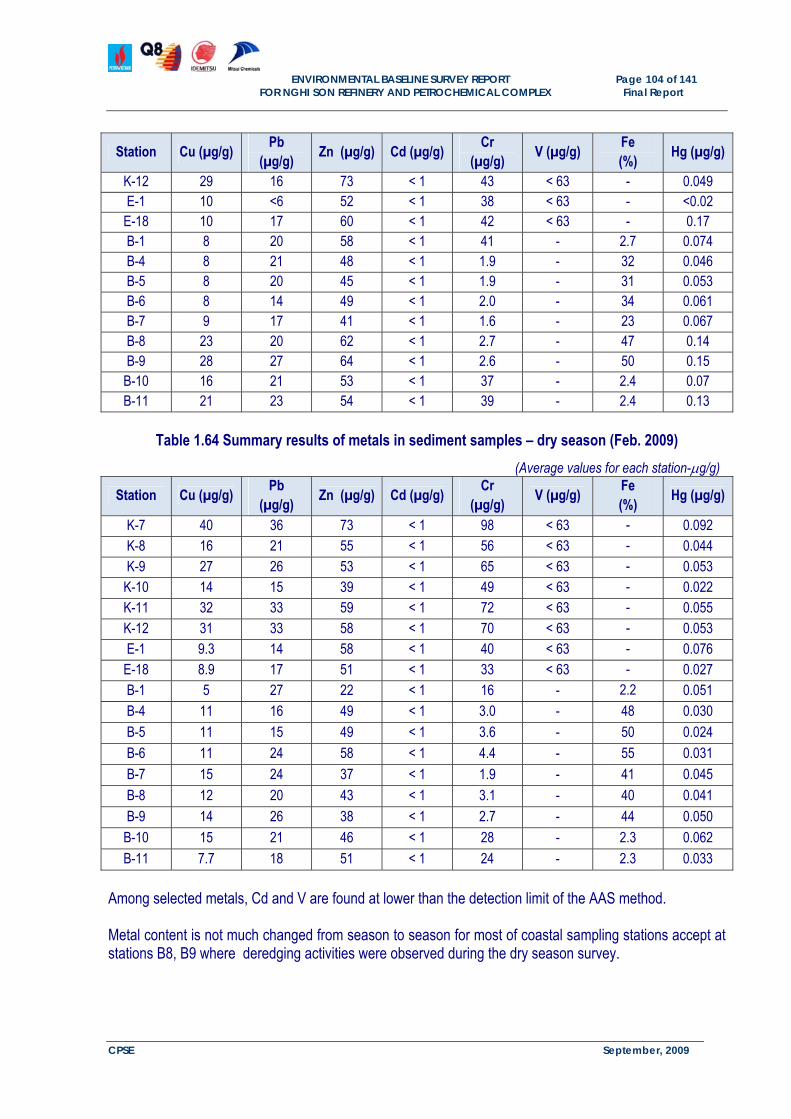
Figure 1.6 Variation of THC content in rainy and dry seasons at offshore area Metals in sediment Analytical results of metals in sediment are summarized in Tables 1.8 and 1.9.
Table 1.8 Summary results of metals in sediment samples – Dry season (Feb. 2009)
ENVIRONMENTAL BASELINE SURVEY REPORT Page 29 of 141
FOR NGHI SON REFINERY AND PETROCHEMICAL COMPLEX Final Report
CPSE September, 2009
Station Cu (µg/g)
Pb (µg/g)
Zn (µg/g)
Cd (µg/g)
Cr (µg/g) V (µg/g)
Hg (µg/g)
E-19 22 23 68 < 1 48 < 63 0.16
E-20 24 26 70 < 1 49 < 63 0.15
E-21 33 42 89 < 1 56 < 63 0.13
E-22 33 40 90 < 1 59 < 63 0.13
E-23 37 36 92 < 1 60 < 63 0.21
E-24 7.8 14 41 < 1 11 <63 0.13
Table 1.9 Summary results of metals in sediment samples – Rainy season (Aug, 2008 and June, 2009)
(Average values for each station-g/g)
Station Cu
(µg/g) Pb
(µg/g) Zn
(µg/g) Cd
(µg/g) Cr
(µg/g) V
(µg/g) Hg
(µg/g) K-1 11 25 52 < 1 27 < 63 0.072
K-2 20 28 57 < 1 46 < 63 0.061
K-3 30 46 66 < 1 66 < 63 0.069
K-4 35 39 71 < 1 73 < 63 0.076
E-1 9.3 14 58 < 1 40 < 63 0.076
E-2 21 24 73 < 1 50 < 63 0.071
E-3 21 20 73 < 1 49 < 63 0.093
E-4 21 21 70 < 1 47 < 63 0.077
E-5 18 23 71 < 1 48 < 63 0.056
E-6 27 33 88 < 1 54 < 63 0.048
E-7 18 29 69 < 1 47 < 63 0.061
E-8 31 32 95 < 1 58 < 63 0.075
E-9 27 31 85 < 1 48 < 63 0.094
E-10 24 31 80 < 1 50 < 63 0.070
E-11 11 35 51 < 1 23 < 63 0.048
E-12 29 31 88 < 1 48 < 63 0.072
E-13 26 30 85 < 1 49 < 63 0.085
E-14 26 34 84 < 1 49 < 63 0.061
ENVIRONMENTAL BASELINE SURVEY REPORT Page 30 of 141
FOR NGHI SON REFINERY AND PETROCHEMICAL COMPLEX Final Report
CPSE September, 2009
Station Cu
(µg/g) Pb
(µg/g) Zn
(µg/g) Cd
(µg/g) Cr
(µg/g) V
(µg/g) Hg
(µg/g) E-15 24 35 92 < 1 60 < 63 0.066
E-16 22 32 82 < 1 56 < 63 0.077
E-17 30 35 99 < 1 63 < 63 0.116
E-18 8.9 17 51 < 1 33 < 63 0.027
E-19 19 26 71 < 1 46 < 63 0.067
E-20 30 36 89 < 1 48 < 63 0.063
E-21 33 40 101 < 1 54 < 63 0.087
E-22 26 33 77 < 1 43 < 63 0.080
E-23 25 35 78 < 1 44 < 63 0.093
E-24 27 35 79 < 1 45 < 63 0.086
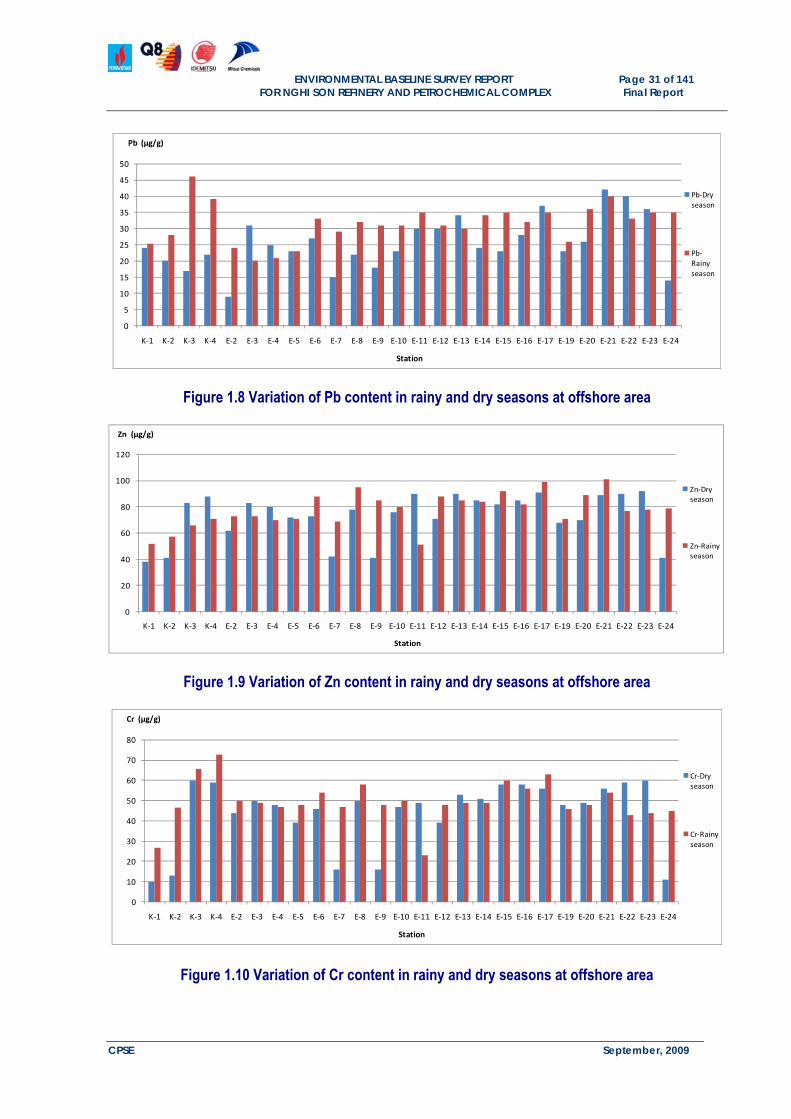
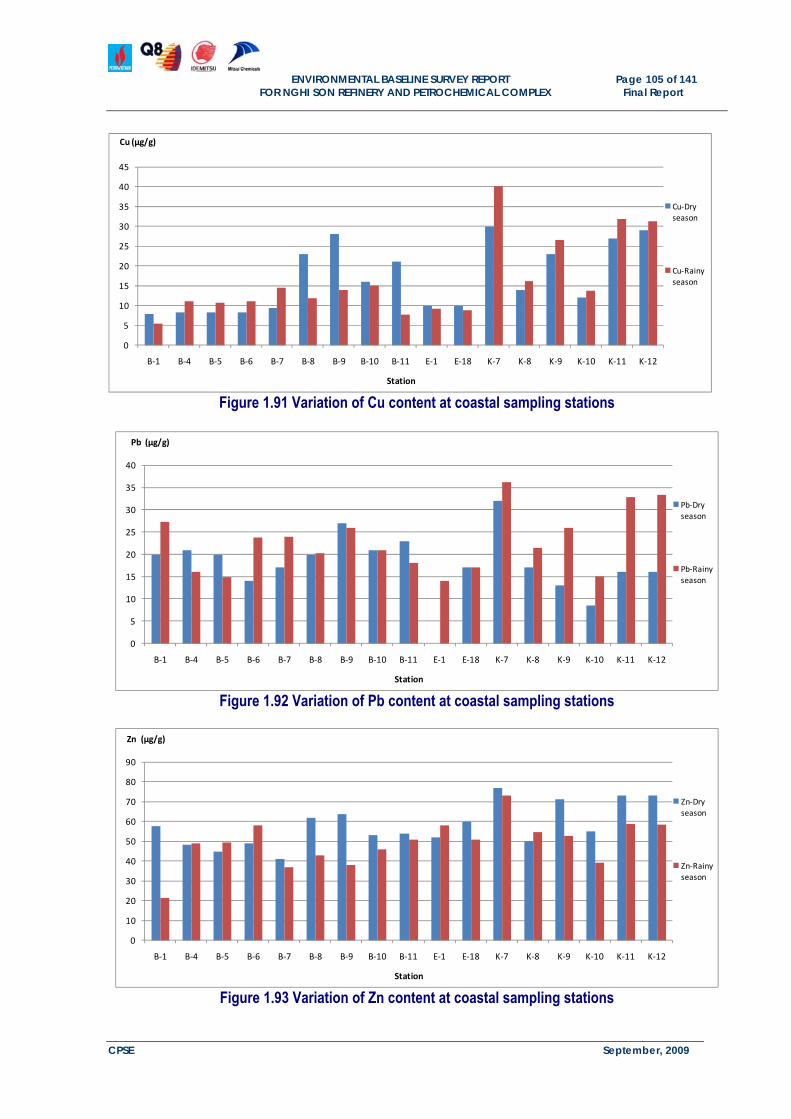
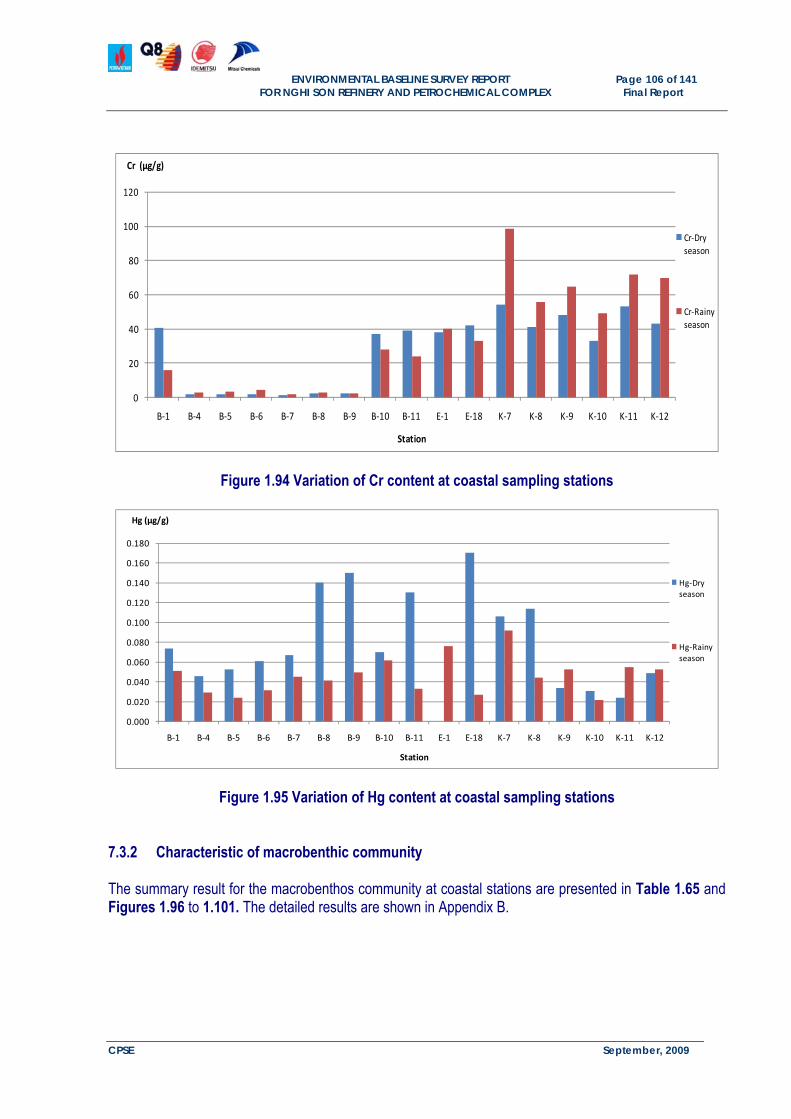
Metals select to be analyzed in both the dry and rainy season surveys are Cu, Pb, Zn, Cd, Cr, V and Hg. Among those metals, Cd and V are found at lower levels than the detection limit of the AAS method. In the dry season, there are tight favorable correlations between some metals and THC, fines content, mean phi. At stations E7, E9 and E24 there is noticeable variation in content of the rest metals (Cu, Pb, Zn, Cr and Hg) between the rainy and dry season. At other stations, these values change in a narrow range between stations as well as between seasons.
Figure 1.11 Variation of Hg content in rainy and dry seasons at offshore area 7.1.2 Characteristic of macrobenthic community
The summary results of the macrobenthos community at offshore stations are presented in Table 1.10 and Figures 1.12 to 1.17. The detailed results are shown in Appendix B.
Table 1.10 The parameters of macrobenthos community at offshore stations in rainy season and dry season
Station Taxon quantity
(taxa/0.3m2) Density (ind./m2) Biomass (g/m2) H(s) J C
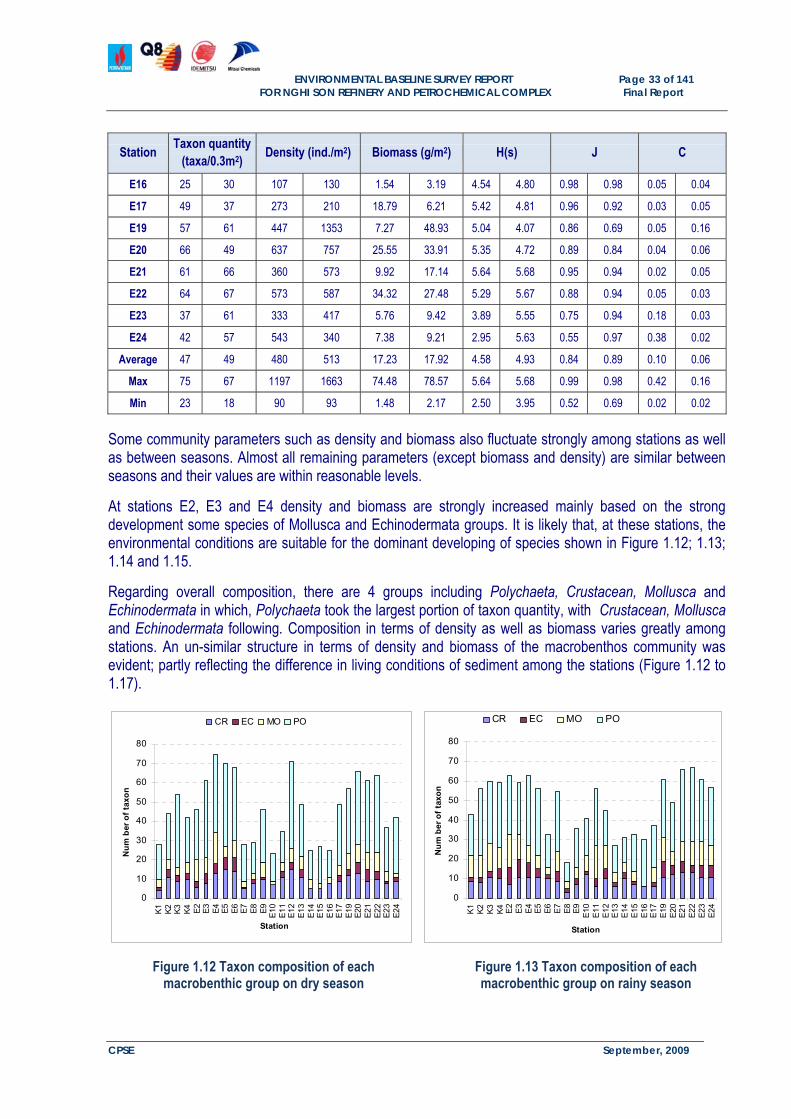
Some community parameters such as density and biomass also fluctuate strongly among stations as well as between seasons. Almost all remaining parameters (except biomass and density) are similar between seasons and their values are within reasonable levels.
At stations E2, E3 and E4 density and biomass are strongly increased mainly based on the strong development some species of Mollusca and Echinodermata groups. It is likely that, at these stations, the environmental conditions are suitable for the dominant developing of species shown in Figure 1.12; 1.13; 1.14 and 1.15.
Regarding overall composition, there are 4 groups including Polychaeta, Crustacean, Mollusca and Echinodermata in which, Polychaeta took the largest portion of taxon quantity, with Crustacean, Mollusca and Echinodermata following. Composition in terms of density as well as biomass varies greatly among stations. An un-similar structure in terms of density and biomass of the macrobenthos community was evident; partly reflecting the difference in living conditions of sediment among the stations (Figure 1.12 to 1.17).
0
10
20
30
40
50
60
70
80
K1
K2
K3
K4 E2
E3
E4
E5
E6
E7
E8
E9
E10
E11
E12
E13
E14
E15
E16
E17
E19
E20
E21
E22
E23
E24
Station
Num
ber
of t
axon
CR EC MO PO
0
10
20
30
40
50
60
70
80
K1
K2
K3
K4 E2
E3
E4
E5
E6
E7
E8
E9
E10
E11
E12
E13
E14
E15
E16
E17
E19
E20
E21
E22
E23
E24
Station
Num
ber
of t
axon
CR EC MO PO
Figure 1.12 Taxon composition of each macrobenthic group on dry season
Figure 1.13 Taxon composition of each macrobenthic group on rainy season
ENVIRONMENTAL BASELINE SURVEY REPORT Page 34 of 141
FOR NGHI SON REFINERY AND PETROCHEMICAL COMPLEX Final Report
CPSE September, 2009
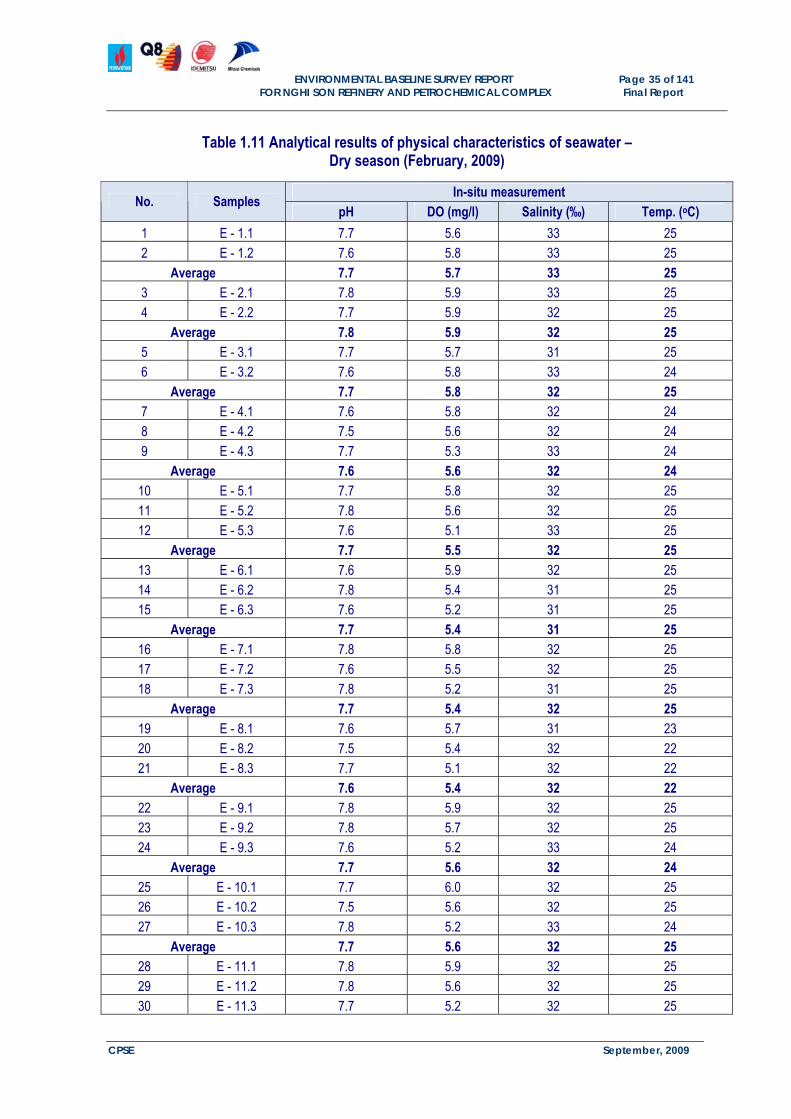
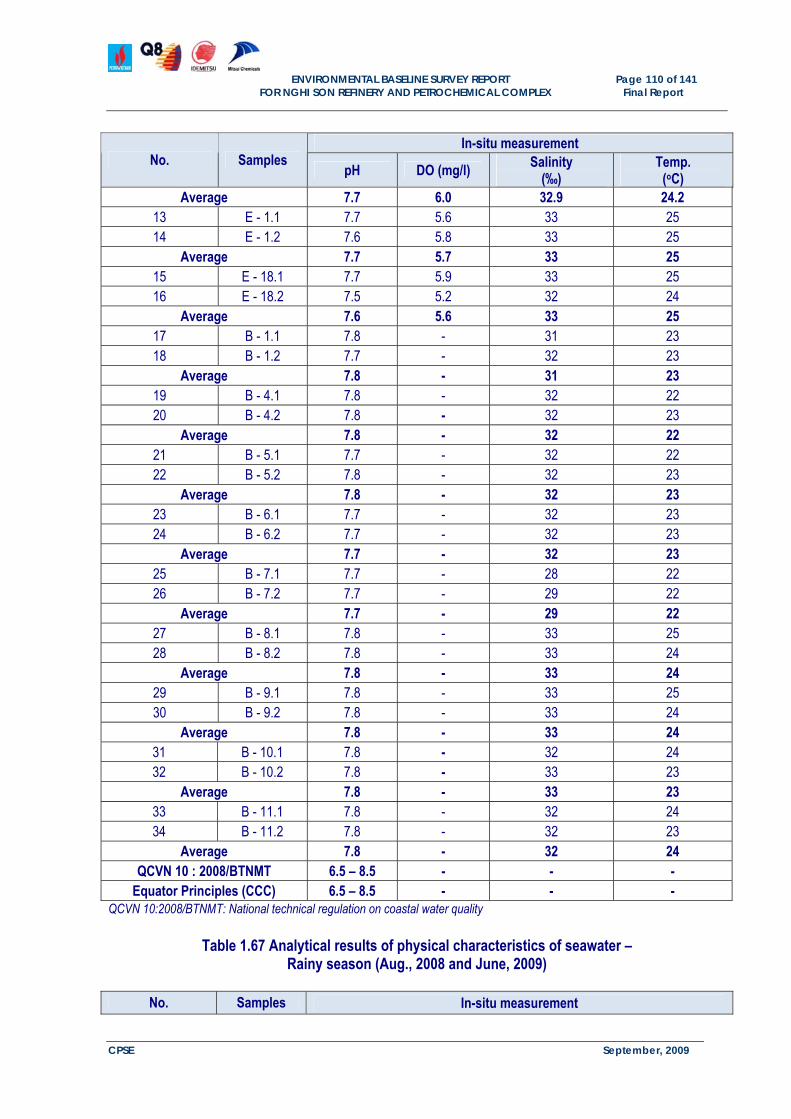
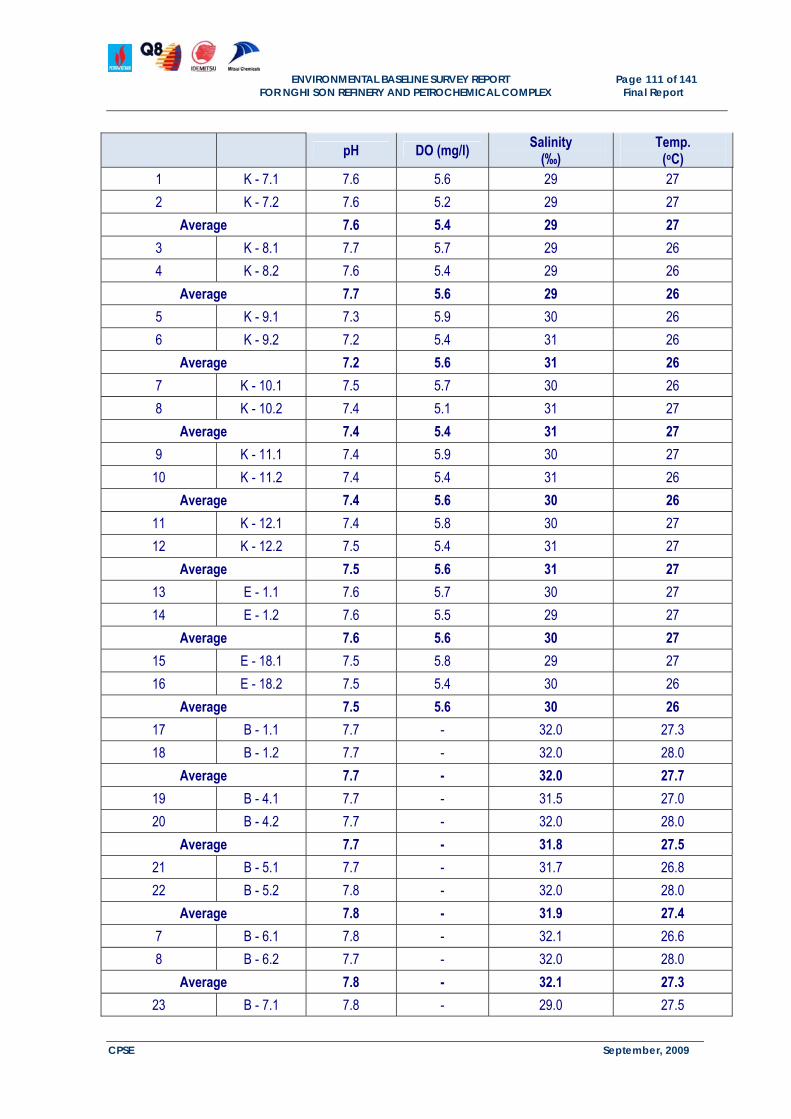
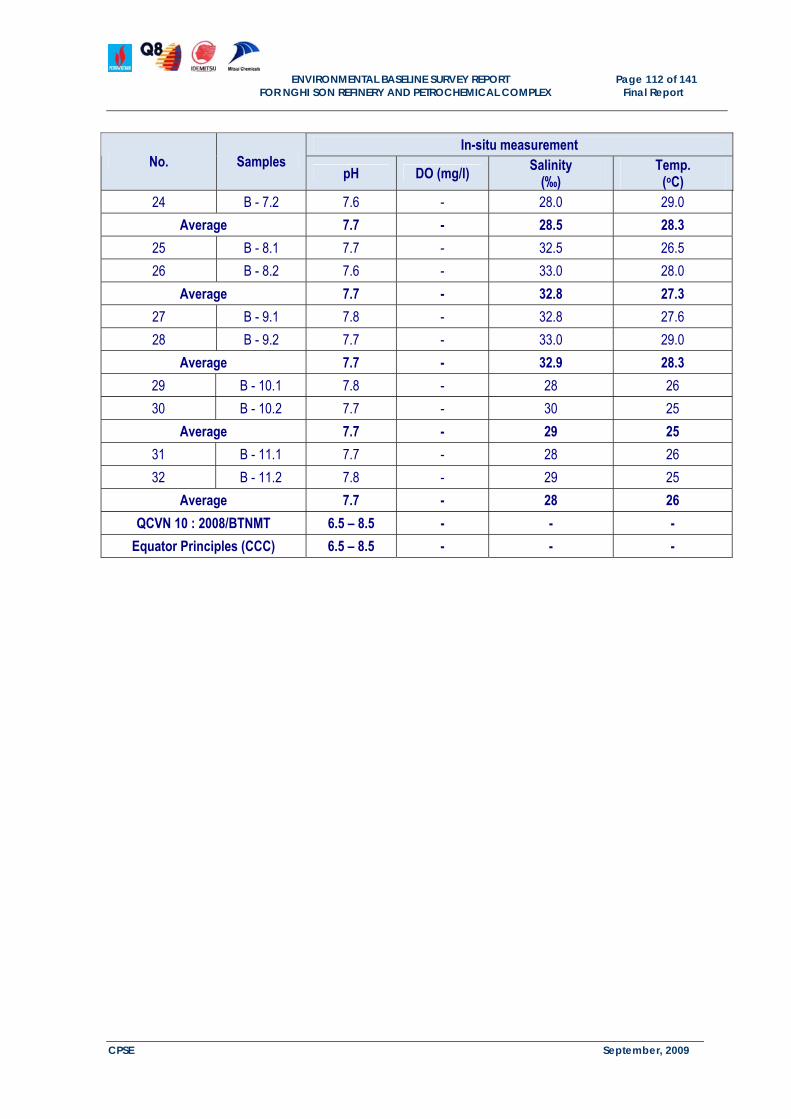
7.1.3 Physical - chemical characteristics of Surface water The sea water analytical results are presented in Tables 1.11 to 1.13.
0
10
20
30
40
50
60
70
80
K1
K2
K3
K4 E2
E3
E4
E5
E6
E7
E8
E9
E10
E11
E12
E13
E14
E15
E16
E17
E19
E20
E21
E22
E23
E24
Station
Sinh
khố
i (g/
m2 )
CR EC MO PO
0
10
20
30
40
50
60
70
80
K1
K2
K3
K4 E2
E3
E4
E5
E6
E7
E8
E9
E10
E11
E12
E13
E14
E15
E16
E17
E19
E20
E21
E22
E23
E24
Station
Sinh
khố
i (g/
m2 )
CR EC MO PO
0
200
400
600
800
1000
1200
K1
K2
K3
K4 E2
E3
E4
E5
E6
E7
E8
E9
E10
E11
E12
E13
E14
E15
E16
E17
E19
E20
E21
E22
E23
E24
Station
Den
sity
(Ind
./m2 )
CR EC MO PO
0
200
400
600
800
1000
1200
K1
K2
K3
K4 E2
E3
E4
E5
E6
E7
E8
E9
E10
E11
E12
E13
E14
E15
E16
E17
E19
E20
E21
E22
E23
E24
StationD
ensi
ty (I
nd./m
2 )
CR EC MO PO
Figure 1.14 Density composition of each macrobenthic group on dry season
Figure 1.15 Density composition of each macrobenthic group on rainy season
Figure 1.16 Biomass composition of each macrobenthic group on dry season
Figure 1.17 Biomass composition of each macrobenthic group on rainy season
ENVIRONMENTAL BASELINE SURVEY REPORT Page 35 of 141
FOR NGHI SON REFINERY AND PETROCHEMICAL COMPLEX Final Report
CPSE September, 2009
Table 1.11 Analytical results of physical characteristics of seawater – Dry season (February, 2009)
In-situ measurement No. Samples
pH DO (mg/l) Salinity (‰) Temp. (oC)
1 E - 1.1 7.7 5.6 33 25 2 E - 1.2 7.6 5.8 33 25
Average 7.7 5.7 33 25 3 E - 2.1 7.8 5.9 33 25 4 E - 2.2 7.7 5.9 32 25
Average 7.8 5.9 32 25 5 E - 3.1 7.7 5.7 31 25 6 E - 3.2 7.6 5.8 33 24
Average 7.7 5.8 32 25 7 E - 4.1 7.6 5.8 32 24 8 E - 4.2 7.5 5.6 32 24 9 E - 4.3 7.7 5.3 33 24
Average 7.6 5.6 32 24 10 E - 5.1 7.7 5.8 32 25 11 E - 5.2 7.8 5.6 32 25 12 E - 5.3 7.6 5.1 33 25
Average 7.7 5.5 32 25 13 E - 6.1 7.6 5.9 32 25 14 E - 6.2 7.8 5.4 31 25 15 E - 6.3 7.6 5.2 31 25
Average 7.7 5.4 31 25 16 E - 7.1 7.8 5.8 32 25 17 E - 7.2 7.6 5.5 32 25 18 E - 7.3 7.8 5.2 31 25
Average 7.7 5.4 32 25 19 E - 8.1 7.6 5.7 31 23 20 E - 8.2 7.5 5.4 32 22 21 E - 8.3 7.7 5.1 32 22
Average 7.6 5.4 32 22 22 E - 9.1 7.8 5.9 32 25 23 E - 9.2 7.8 5.7 32 25 24 E - 9.3 7.6 5.2 33 24
Average 7.7 5.6 32 24 25 E - 10.1 7.7 6.0 32 25 26 E - 10.2 7.5 5.6 32 25 27 E - 10.3 7.8 5.2 33 24
Average 7.7 5.6 32 25 28 E - 11.1 7.8 5.9 32 25 29 E - 11.2 7.8 5.6 32 25 30 E - 11.3 7.7 5.2 32 25
ENVIRONMENTAL BASELINE SURVEY REPORT Page 36 of 141
FOR NGHI SON REFINERY AND PETROCHEMICAL COMPLEX Final Report
CPSE September, 2009
In-situ measurement No. Samples
pH DO (mg/l) Salinity (‰) Temp. (oC)
Average 7.8 5.4 32 25 31 E - 12.1 7.6 5.8 31 25 32 E - 12.2 7.5 5.6 32 24 33 E - 12.3 7.6 5.0 33 24
Average 7.6 5.5 32 24 34 E - 13.1 7.5 5.8 33 25 35 E - 13.2 7.5 5.7 32 25 36 E - 13.3 7.6 5.3 33 25
Average 7.5 5.6 33 25 37 E - 14.1 7.7 5.8 32 23 38 E - 14.2 7.5 5.6 33 23 39 E - 14.3 7.8 5.3 33 23
Average 7.7 5.6 33 23 40 E - 15.1 7.7 5.9 33 23 41 E - 15.2 7.6 5.7 31 23 42 E - 15.3 7.7 5.3 32 23
Average 7.7 5.6 32 23 43 E - 16.1 7.8 5.8 33 24 44 E - 16.2 7.8 5.7 32 24 45 E - 16.3 7.6 5.2 33 24
Average 7.7 5.6 33 24 46 E - 17.1 7.7 5.9 32 24 47 E - 17.2 7.8 5.6 32 24 48 E - 17.3 7.5 5.2 31 24
Average 7.7 5.6 32 24 49 E - 18.1 7.7 5.9 33 25 50 E - 18.2 7.5 5.2 32 24
Average 7.6 5.6 33 25 51 E - 19.1 7.5 5.8 32 23 52 E - 19.2 7.5 5.1 33 23
Average 7.5 5.5 33 23 53 E - 20.1 7.8 5.7 32 23 54 E - 20.2 7.6 5.1 32 23
Average 7.7 5.4 32 23 55 E - 21.1 7.5 5.8 32 25 56 E - 21.2 7.8 5.3 32 24
Average 7.7 5.6 32 24 57 E - 22.1 7.7 5.8 32 24 58 E - 22.2 7.6 5.4 32 24
Average 7.6 5.6 32 24 59 E - 23.1 7.6 5.8 32 23 60 E - 23.2 7.5 5.2 32 23
Average 7.6 5.5 32 23
ENVIRONMENTAL BASELINE SURVEY REPORT Page 37 of 141
FOR NGHI SON REFINERY AND PETROCHEMICAL COMPLEX Final Report
CPSE September, 2009
In-situ measurement No. Samples
pH DO (mg/l) Salinity (‰) Temp. (oC)
61 E - 24.1 7.5 5.8 33 23 62 E - 24.2 7.6 5.6 33 23 63 E - 24.3 7.6 5.2 33 23
Average 7.6 5.5 33 23 64 K - 1.1 7.7 5.8 33 24 65 K - 1.2 7.7 6.0 33 23
Average 7.7 5.9 33 24 66 K - 2.1 7.5 5.6 33 24 67 K - 2.2 7.6 5.3 33 24
Average 7.6 5.5 33 24 68 K - 3.1 7.7 5.5 33 24 69 K - 3.2 7.8 5.3 33 24
Average 7.8 5.4 33 24 70 K - 4.1 7.8 5.6 33 24 71 K - 4.2 7.9 5.4 33 23
QCVN 10: 2008- National technical regulation on coastal water quality, column 3-applies to other place.
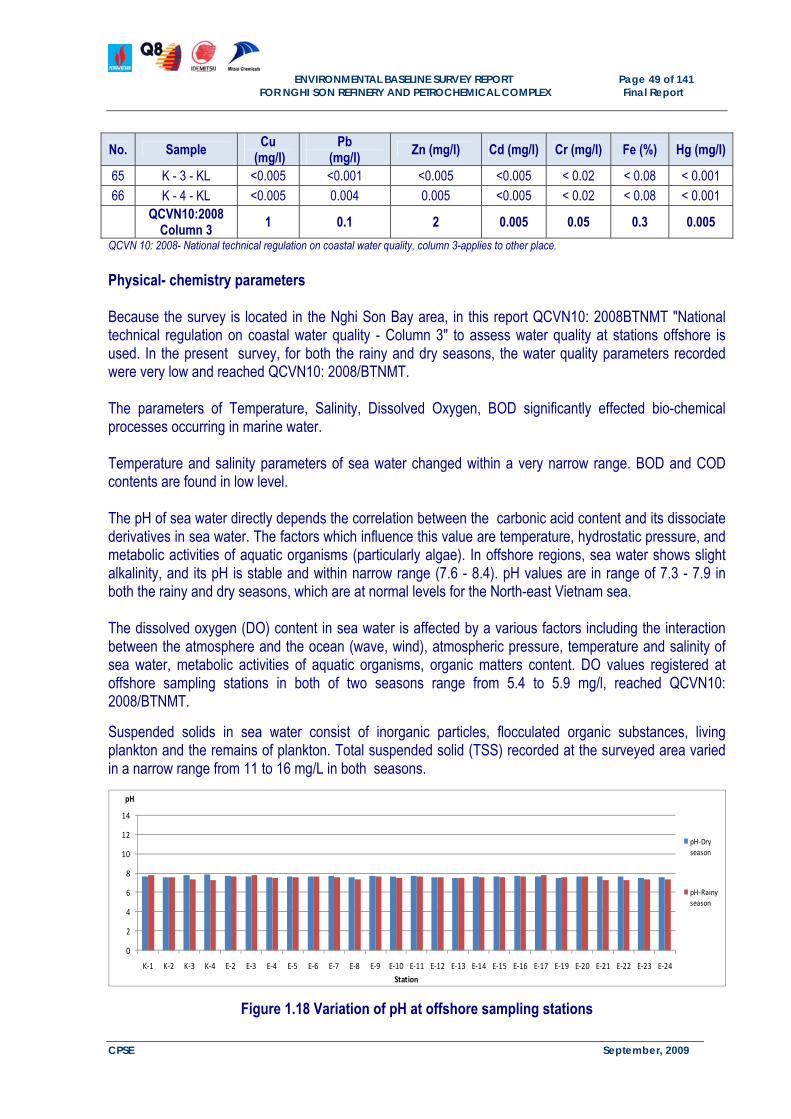
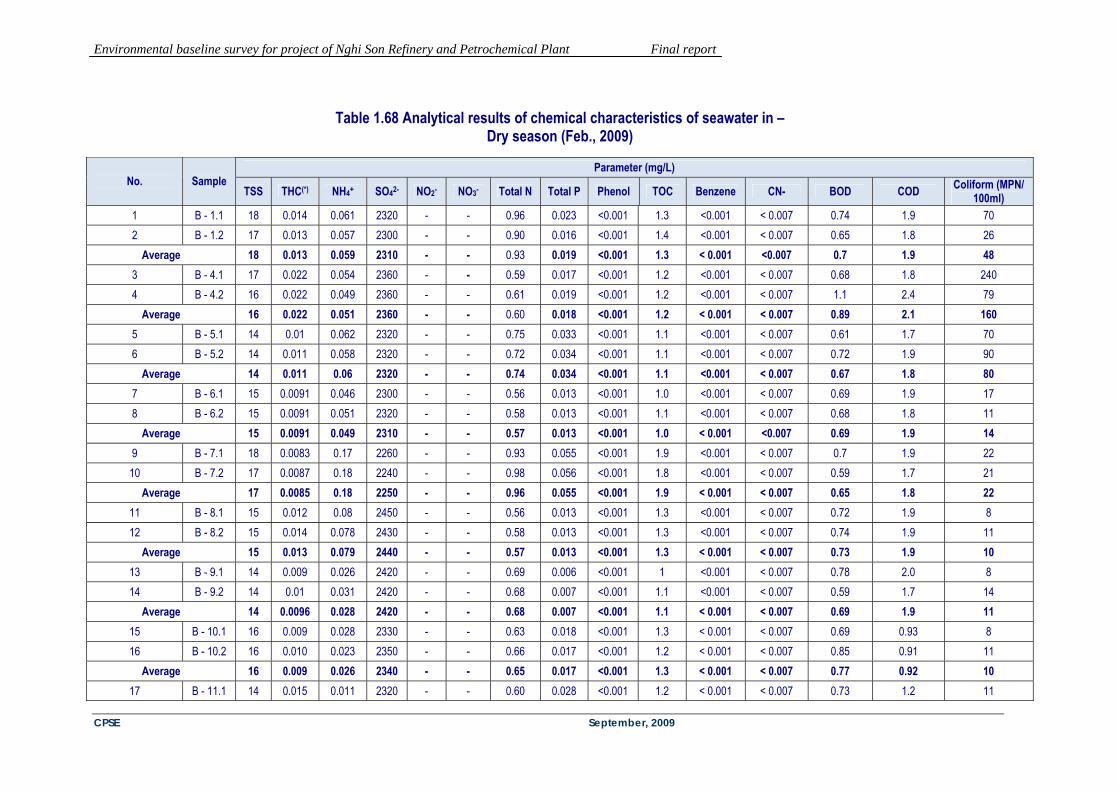
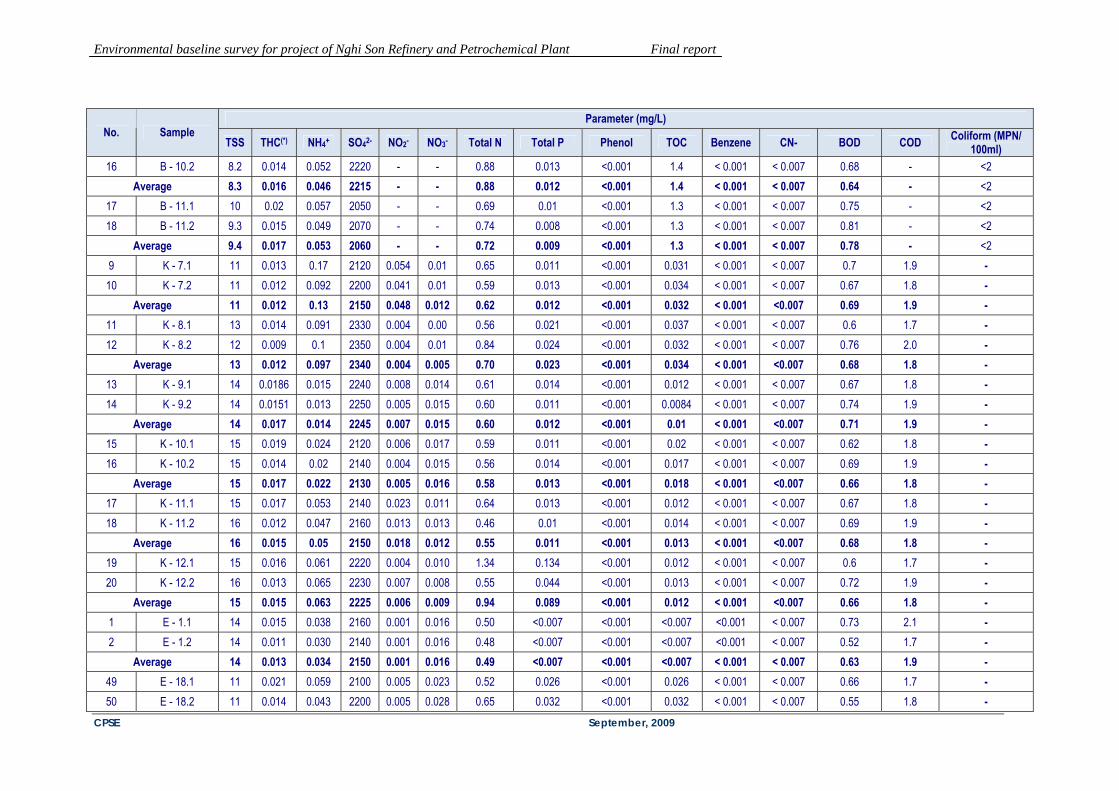
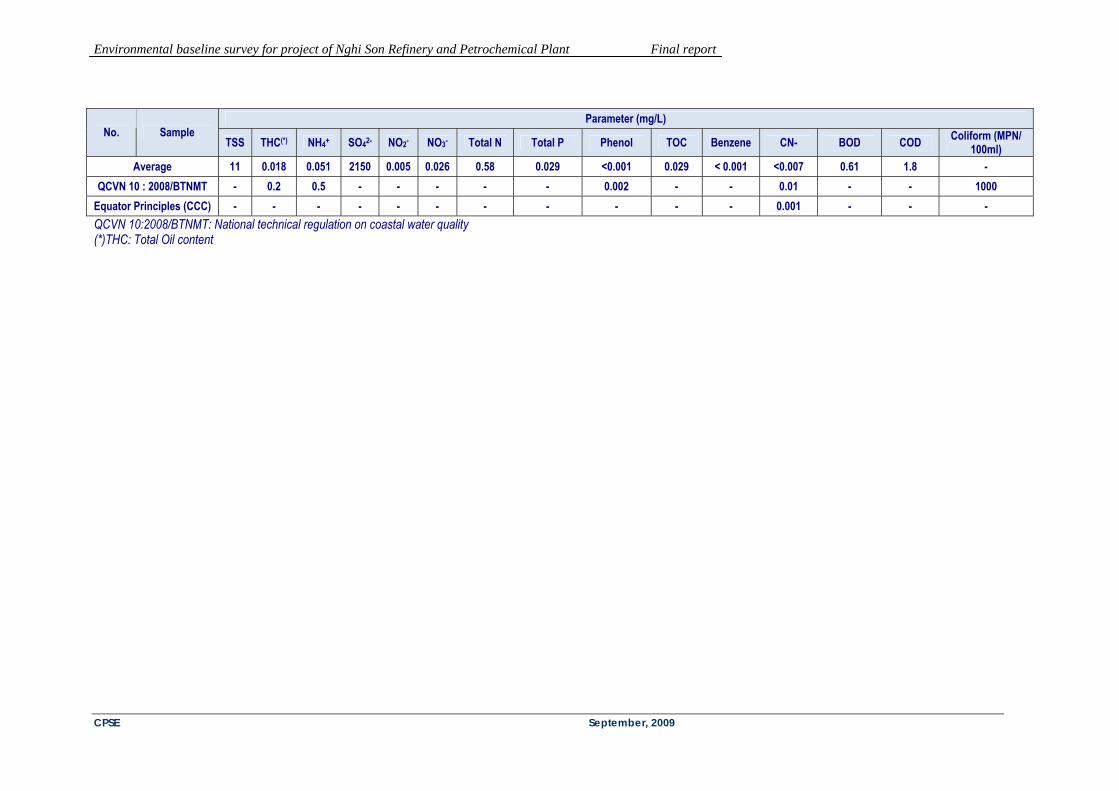
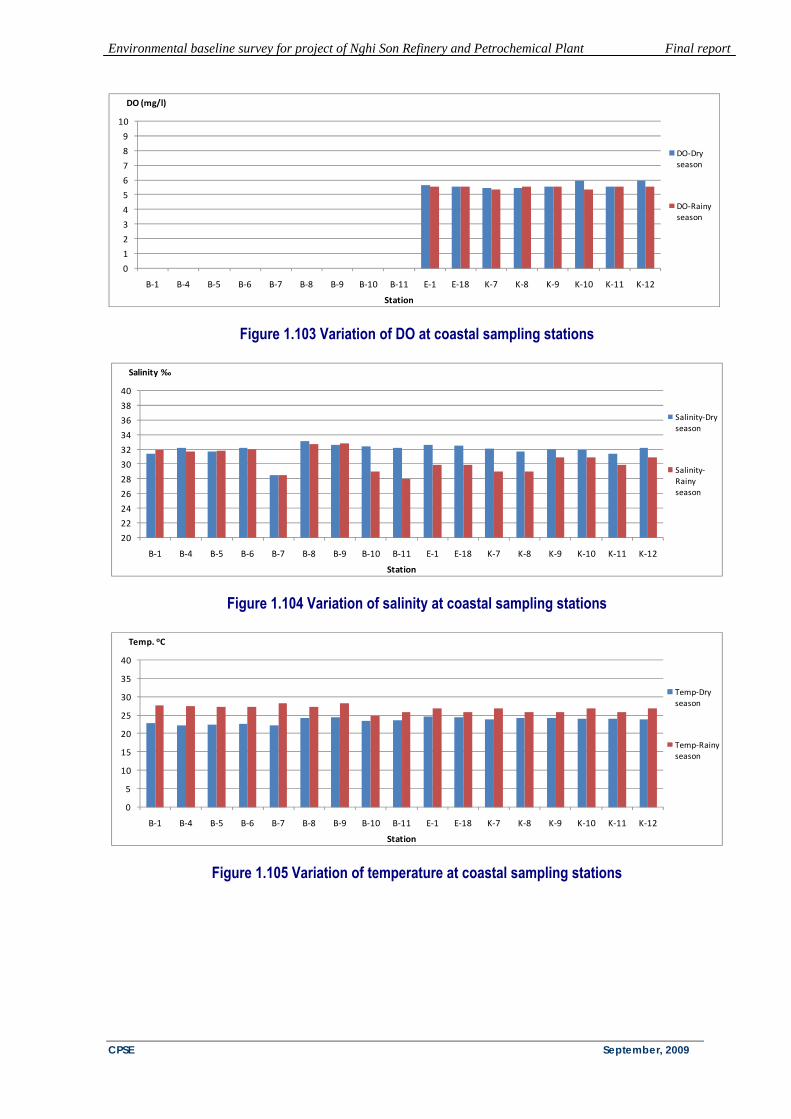
Physical- chemistry parameters Because the survey is located in the Nghi Son Bay area, in this report QCVN10: 2008BTNMT "National technical regulation on coastal water quality - Column 3" to assess water quality at stations offshore is used. In the present survey, for both the rainy and dry seasons, the water quality parameters recorded were very low and reached QCVN10: 2008/BTNMT. The parameters of Temperature, Salinity, Dissolved Oxygen, BOD significantly effected bio-chemical processes occurring in marine water. Temperature and salinity parameters of sea water changed within a very narrow range. BOD and COD contents are found in low level. The pH of sea water directly depends the correlation between the carbonic acid content and its dissociate derivatives in sea water. The factors which influence this value are temperature, hydrostatic pressure, and metabolic activities of aquatic organisms (particularly algae). In offshore regions, sea water shows slight alkalinity, and its pH is stable and within narrow range (7.6 - 8.4). pH values are in range of 7.3 - 7.9 in both the rainy and dry seasons, which are at normal levels for the North-east Vietnam sea. The dissolved oxygen (DO) content in sea water is affected by a various factors including the interaction between the atmosphere and the ocean (wave, wind), atmospheric pressure, temperature and salinity of sea water, metabolic activities of aquatic organisms, organic matters content. DO values registered at offshore sampling stations in both of two seasons range from 5.4 to 5.9 mg/l, reached QCVN10: 2008/BTNMT.
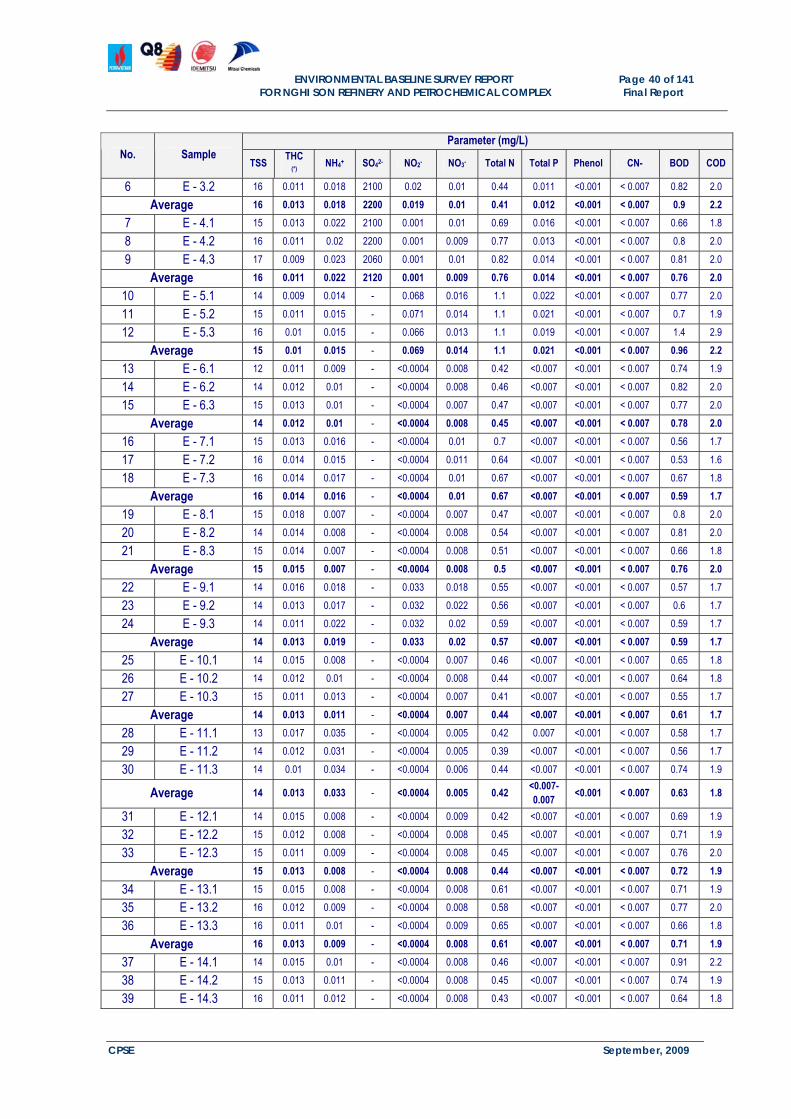
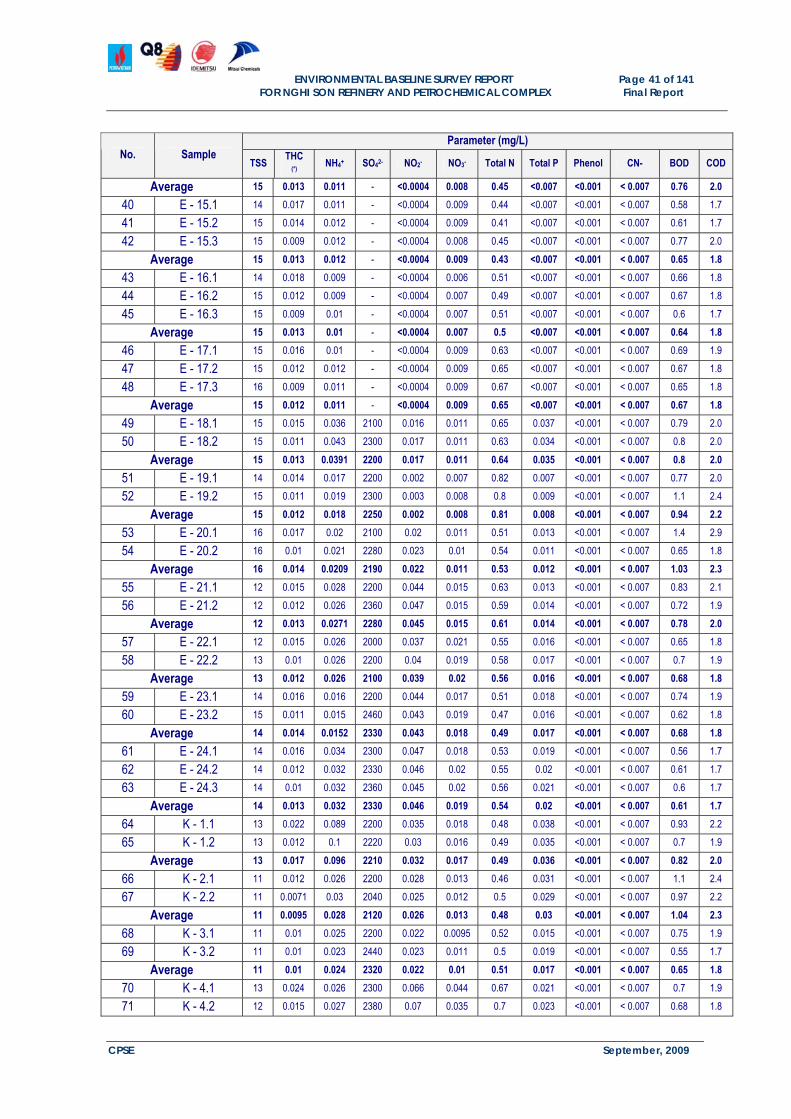
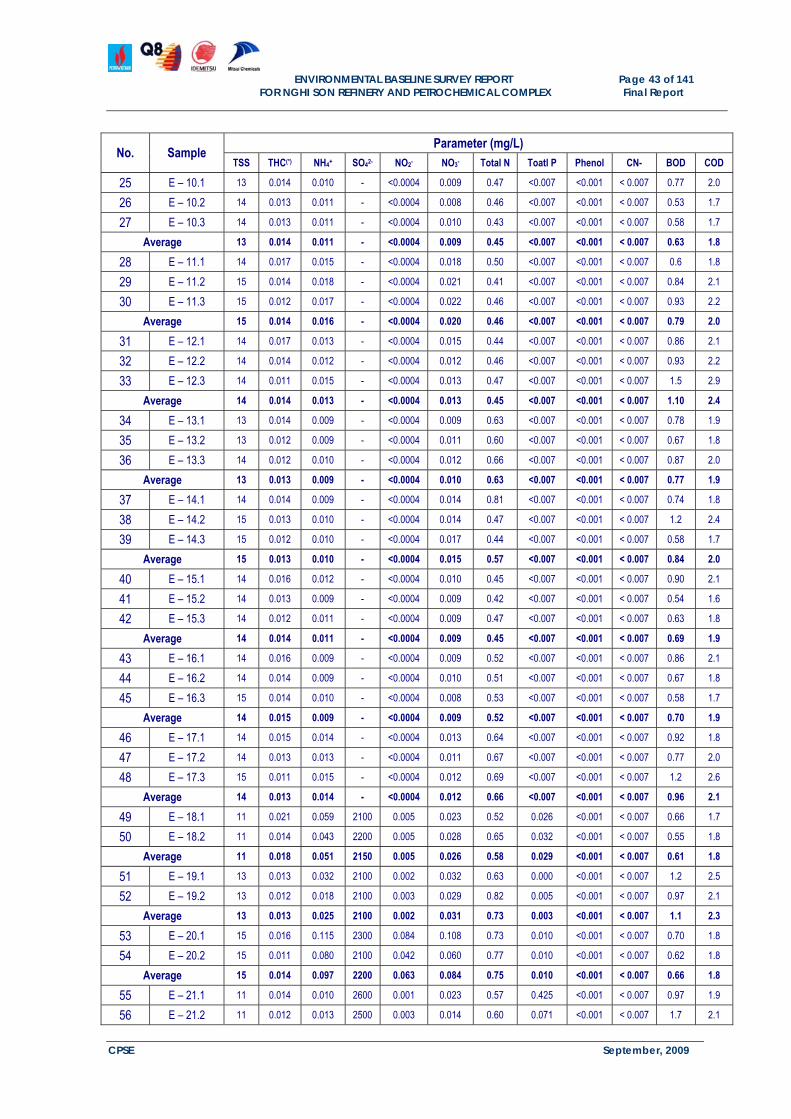
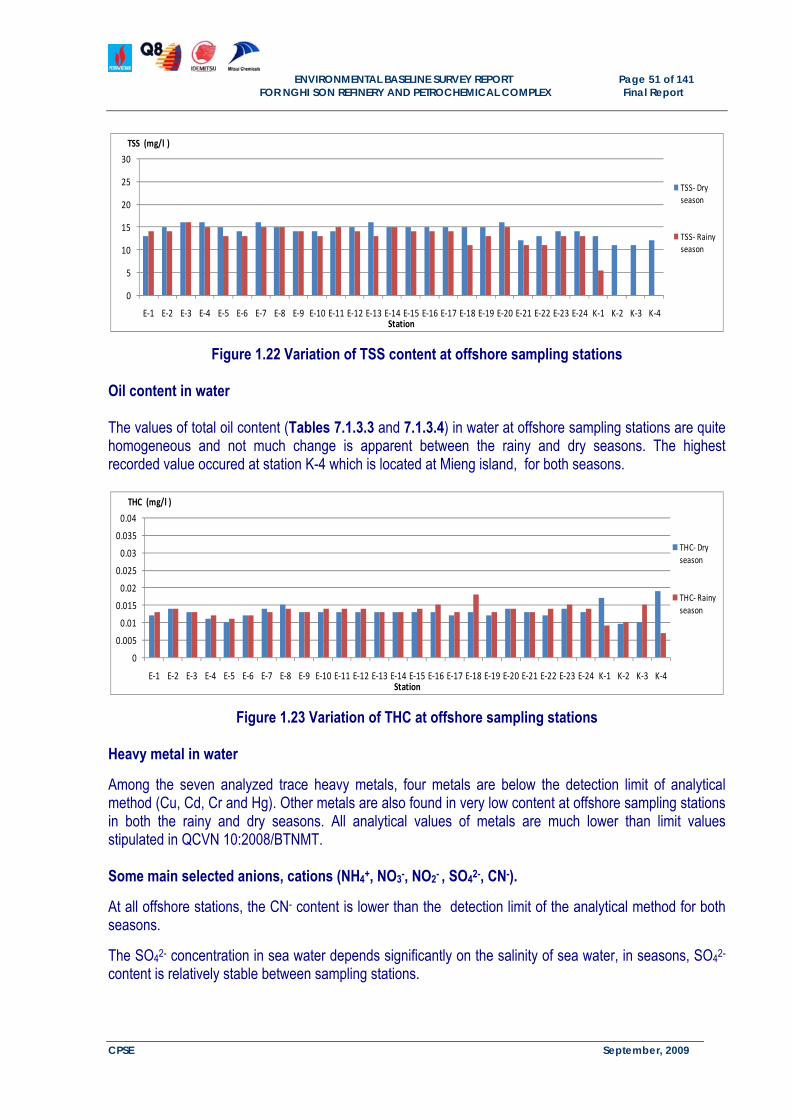
Suspended solids in sea water consist of inorganic particles, flocculated organic substances, living plankton and the remains of plankton. Total suspended solid (TSS) recorded at the surveyed area varied in a narrow range from 11 to 16 mg/L in both seasons.
Figure 1.22 Variation of TSS content at offshore sampling stations Oil content in water The values of total oil content (Tables 7.1.3.3 and 7.1.3.4) in water at offshore sampling stations are quite homogeneous and not much change is apparent between the rainy and dry seasons. The highest recorded value occured at station K-4 which is located at Mieng island, for both seasons.
Figure 1.23 Variation of THC at offshore sampling stations Heavy metal in water
Among the seven analyzed trace heavy metals, four metals are below the detection limit of analytical method (Cu, Cd, Cr and Hg). Other metals are also found in very low content at offshore sampling stations in both the rainy and dry seasons. All analytical values of metals are much lower than limit values stipulated in QCVN 10:2008/BTNMT. Some main selected anions, cations (NH4+, NO3-, NO2- , SO42-, CN-).
At all offshore stations, the CN- content is lower than the detection limit of the analytical method for both seasons.
The SO42- concentration in sea water depends significantly on the salinity of sea water, in seasons, SO42- content is relatively stable between sampling stations.
ENVIRONMENTAL BASELINE SURVEY REPORT Page 52 of 141
FOR NGHI SON REFINERY AND PETROCHEMICAL COMPLEX Final Report
CPSE September, 2009
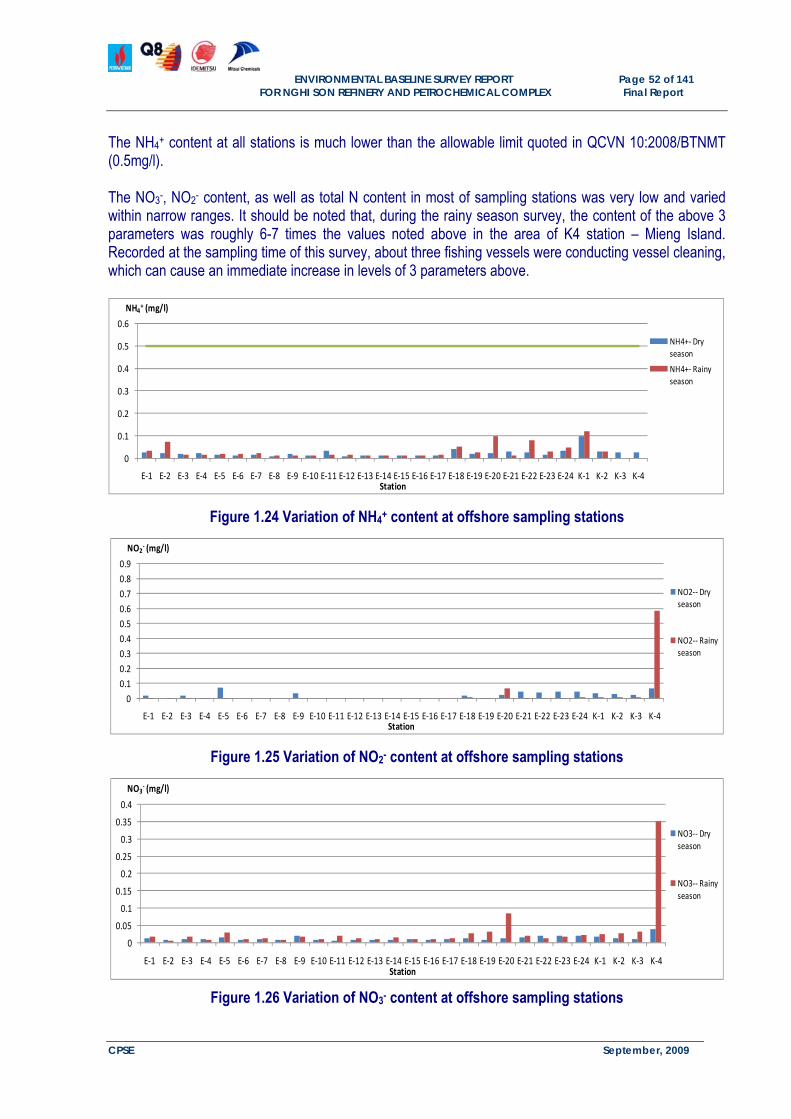
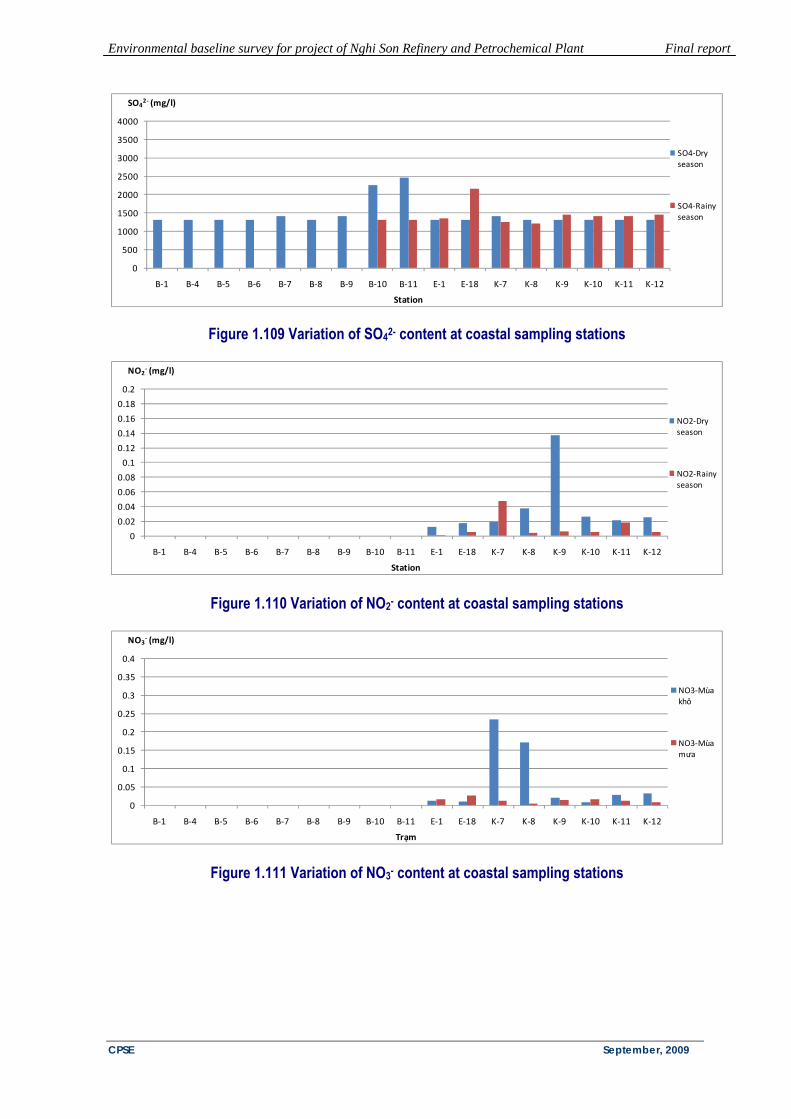
The NH4+ content at all stations is much lower than the allowable limit quoted in QCVN 10:2008/BTNMT (0.5mg/l). The NO3-, NO2- content, as well as total N content in most of sampling stations was very low and varied within narrow ranges. It should be noted that, during the rainy season survey, the content of the above 3 parameters was roughly 6-7 times the values noted above in the area of K4 station – Mieng Island. Recorded at the sampling time of this survey, about three fishing vessels were conducting vessel cleaning, which can cause an immediate increase in levels of 3 parameters above.
Figure 1.27 Variation of SO42- content at offshore sampling stations Total phosphorus, Total nitrogen
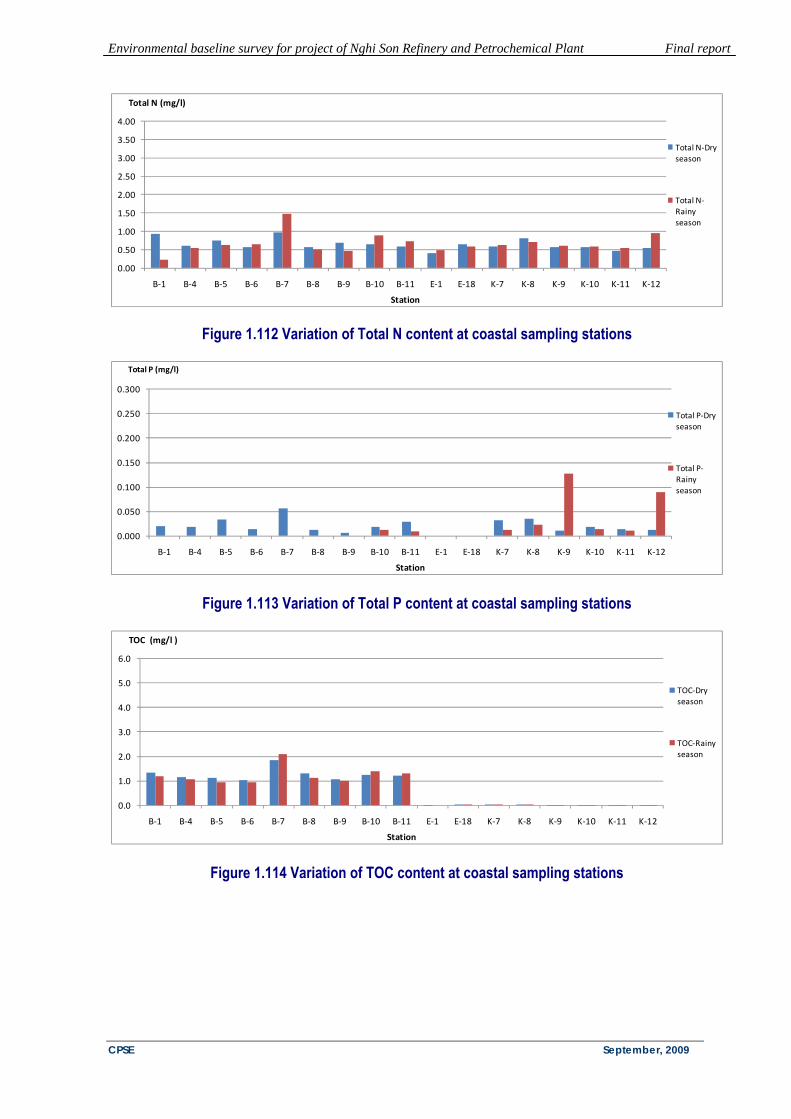
Total phosphorus and total nitrogen are considered nutrients in water. Phosphorus and nitrogen are important components in the process of photosynthesis of phytoplankton in the marine environment. There are no regulations on the permitted levels of total nitrogen and phosphorus in QCVN10 Total: 2008. Total phosphorus in most offshore stations is lower than the detection limits of the analytical methods used. At two stations E21 and E22, recorded total phosphorus concentration increased significantly during the wet season survey. This should be monitored closely in the next survey.
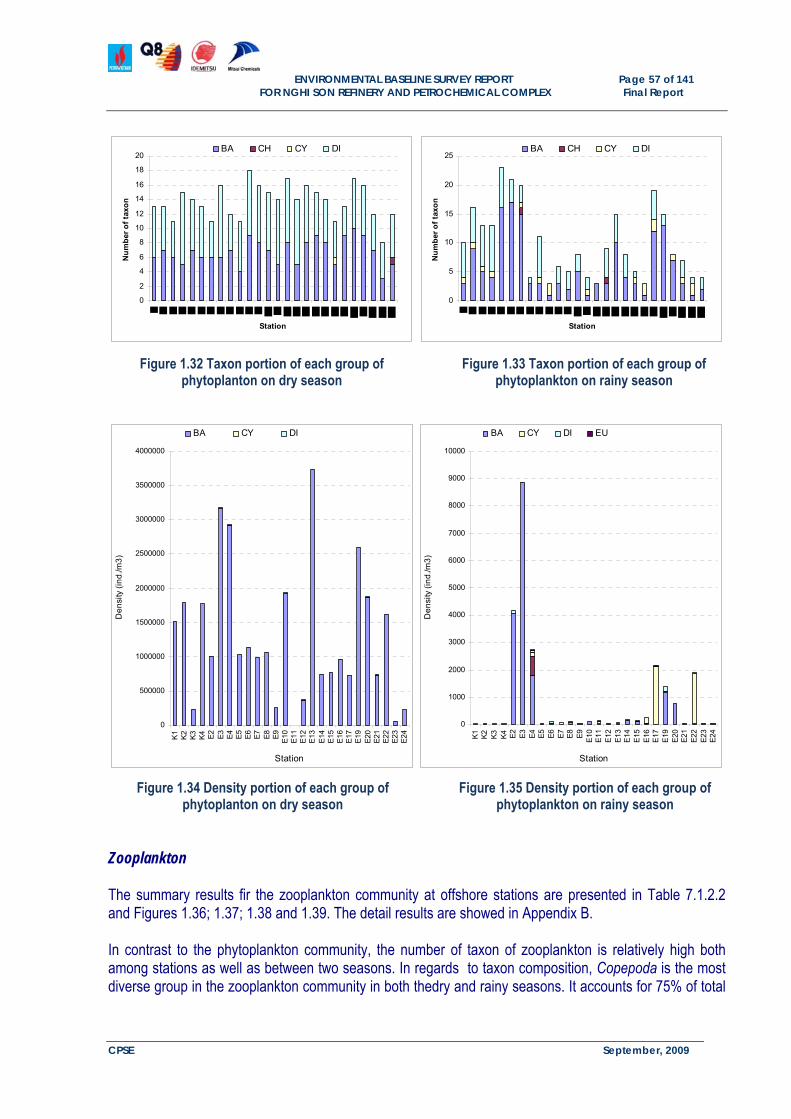
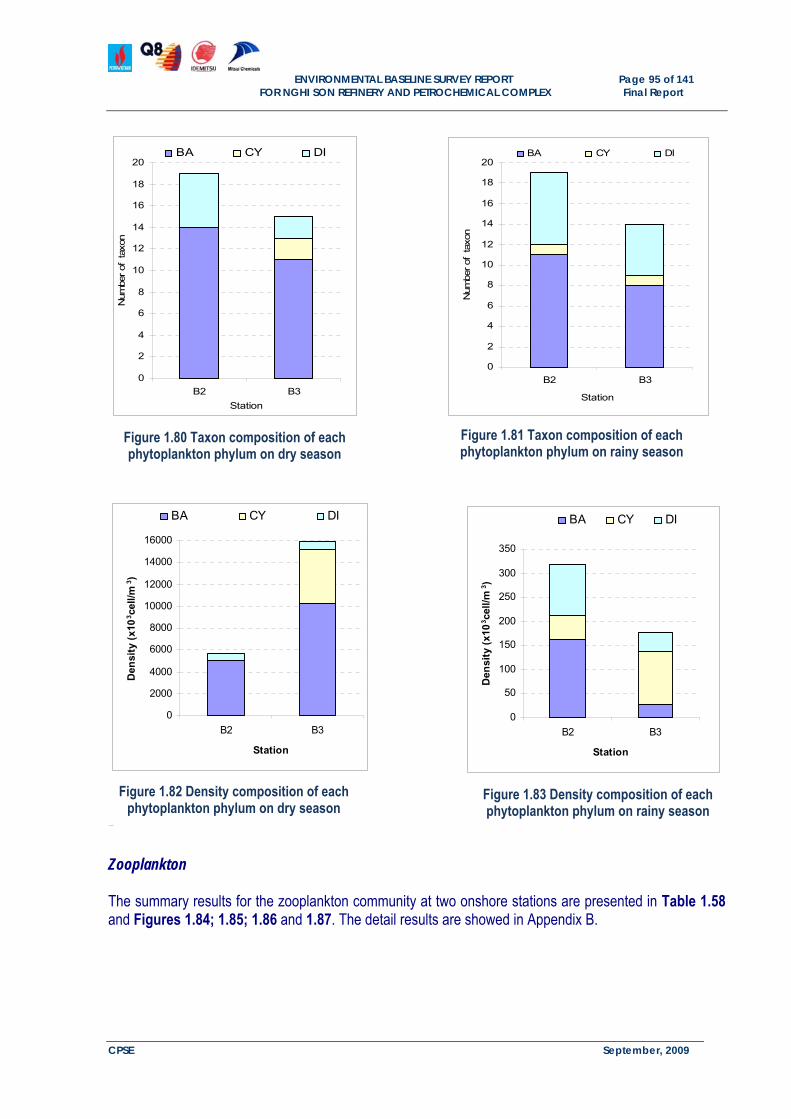
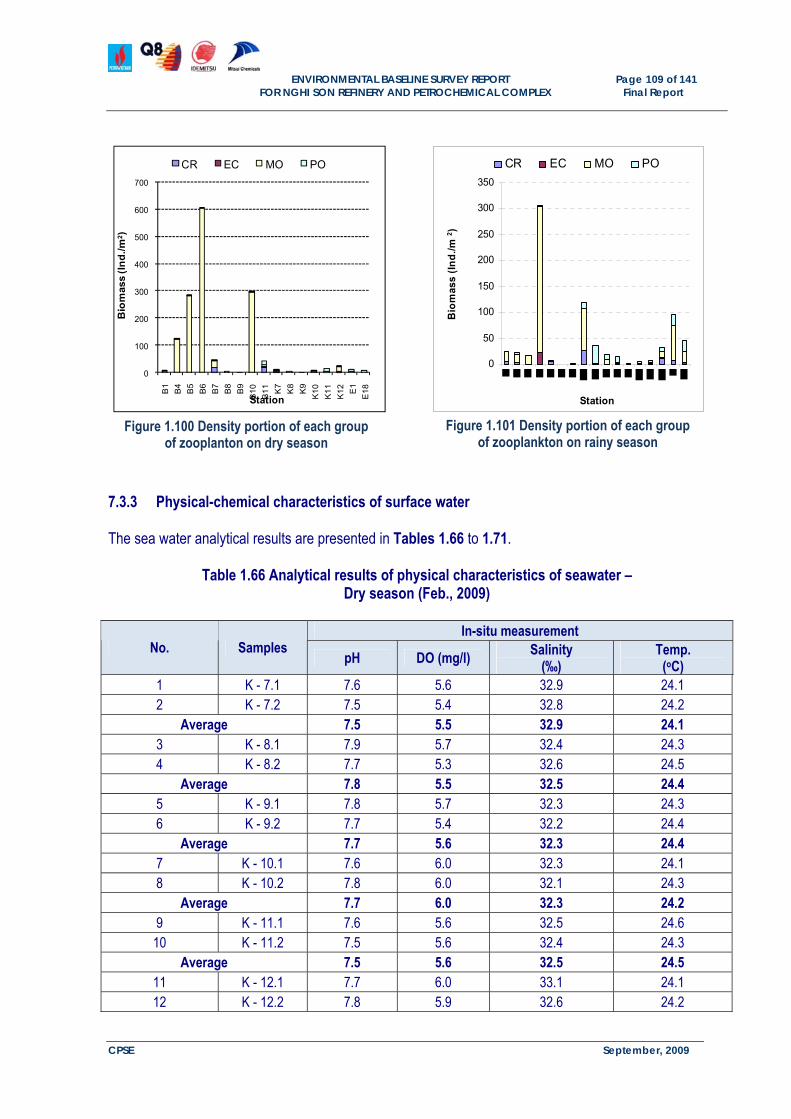
Figure 1.31 Variation of COD content at offshore sampling stations 7.1.4 Characteristics of the plankton community Phytoplankton The summary results of phytoplankton community at offshore stations are presented in Table 1.17 and Figures 1.32; 1.33; 1.34 and 1.35. The detail results are showed in Appendix B.
ENVIRONMENTAL BASELINE SURVEY REPORT Page 55 of 141
FOR NGHI SON REFINERY AND PETROCHEMICAL COMPLEX Final Report
CPSE September, 2009
Table 1.17 The parameters of phytoplankton community at coastal stations in rainy season and dry season
The phytoplanton community at surveyed areas does not show diversity nor evenness particularly in the dry season, although the number of taxon recorded in the dry season is higher than in the rainy season. In the offshore area, the unexpected results for the Phytoplankton community is caused by the overdevelopment of one algae species (known as blooming).
ENVIRONMENTAL BASELINE SURVEY REPORT Page 56 of 141
FOR NGHI SON REFINERY AND PETROCHEMICAL COMPLEX Final Report
CPSE September, 2009
Taxon composition and distribution Distribution of the taxon quantity according to the rainy and dry seasons is illustrated at Figures 1.32 and 1.33. It is easy to recognize that in the dry season, the number of taxon among studied stations is rather even while taxon distribution varies strongly among stations. Taxon quantity is very low at some stations such as E5, E7, E11, E12, E17, E23, E24 and rather high E2, E3, E4, E19.
Taxon composition In the dry season, there are four phyla identified in which each phylum of Dianophyta and Bacillariophyta account for about 50% of number of taxon. The relative proportions of the others are very small. In the rainy season, there are 5 phyla identified of which Bacillariophyta is the most diverse; followed by Dianophyta, Cyanophyta, Chlorophyta and Euglenophyta in descending order.
Density composition and distribution The distribution of phytoplankton’s density is shown in Figures 1.34 and 1.35. It is remarkabe to note that the density in the dry season is a thousands times higher than that in the rainy season. This phenomenon may be related to the high concentration of Nitrate in the dry season. The increase of Nitrate may provide an adequate nutritional source for the development of algae, known as blooming. Based on the increasing of density at some stations such as E2, E3, E4, the variation in density among studied stations in the rainy season is also much higher than that in the dry season. In the the rainy season, the density structure at stations E17, E22 and E16 was clearly atypical with the dominance of the Cyanophyta group evidence of the difference in the water conditions there. Although there are 4 phyla of phytoplankton presented, the Bacillariophyta accounts for nearly 100% of density; proportions of the others are not notable. In the rainy season, Bacillariophyta also accounts for the largest proportion, however, portions of Cyanophyta, Dianophyata and Chlorophyta are also remarkable.
Community indices In the dry season, like a consequence of the blooming of one species algae, all community indices are at poor levels. The diversity index -H(s) and Evenness index –J are low, while the predominant index is high at almost stations. At station E14, this phenomenon is not recoded. On the contrary, all other community indices are at normal levels.
ENVIRONMENTAL BASELINE SURVEY REPORT Page 57 of 141
FOR NGHI SON REFINERY AND PETROCHEMICAL COMPLEX Final Report
CPSE September, 2009
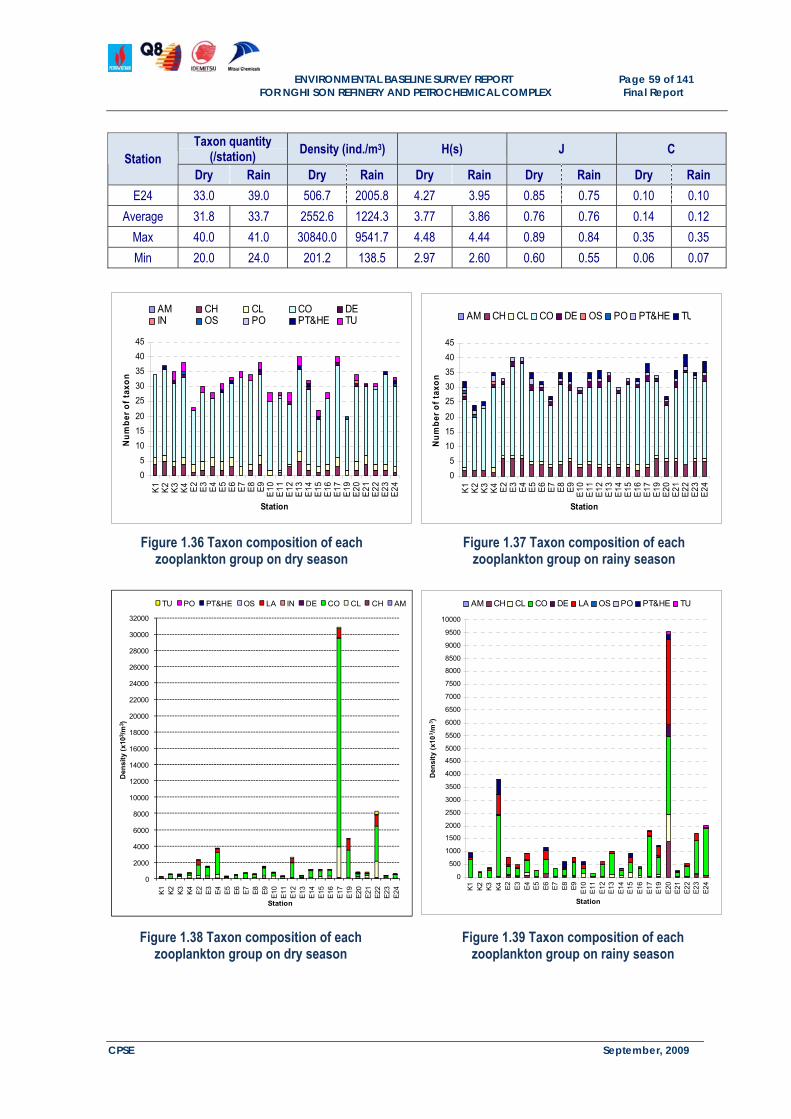
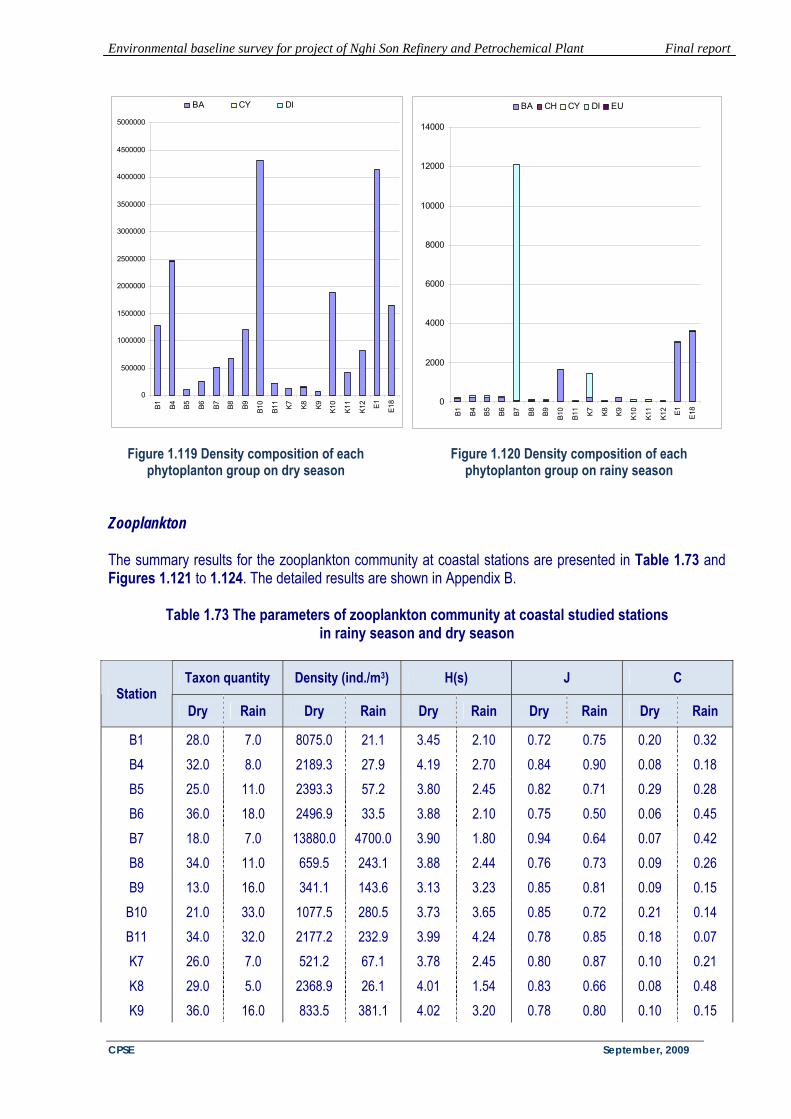
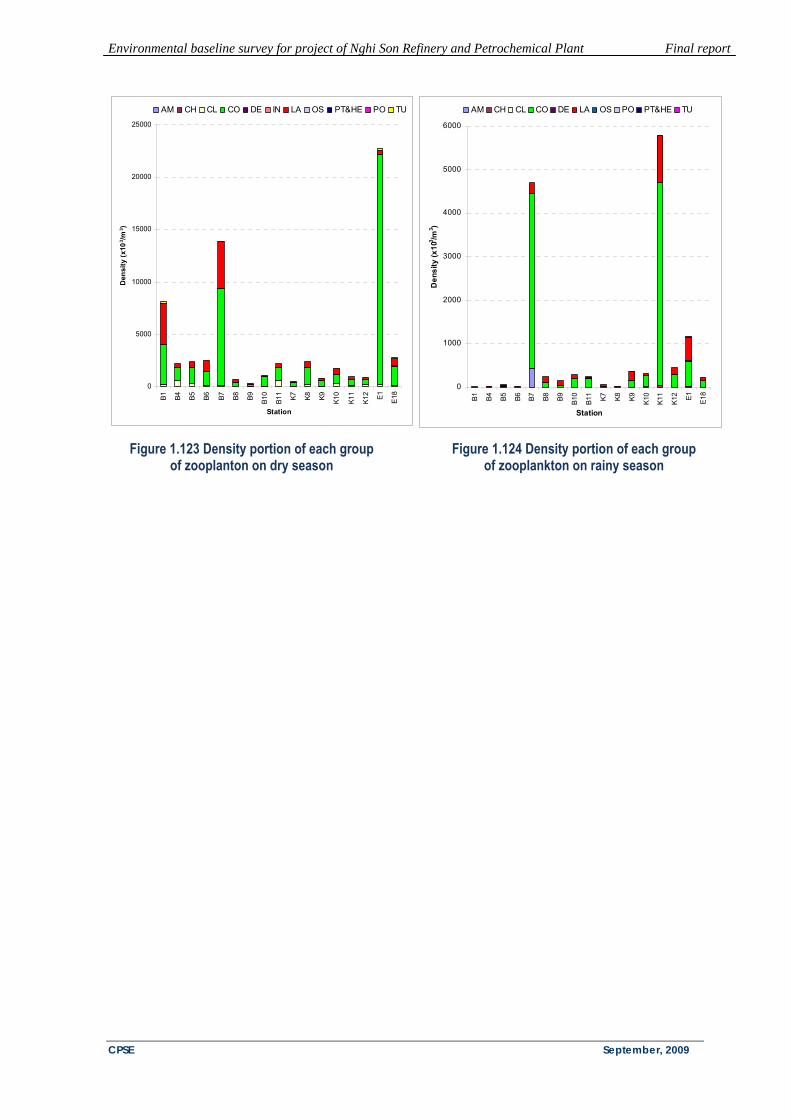
Zooplankton The summary results fir the zooplankton community at offshore stations are presented in Table 7.1.2.2 and Figures 1.36; 1.37; 1.38 and 1.39. The detail results are showed in Appendix B. In contrast to the phytoplankton community, the number of taxon of zooplankton is relatively high both among stations as well as between two seasons. In regards to taxon composition, Copepoda is the most diverse group in the zooplankton community in both thedry and rainy seasons. It accounts for 75% of total
0
500000
1000000
1500000
2000000
2500000
3000000
3500000
4000000
K1
K2
K3
K4 E2
E3
E4
E5
E6
E7
E8
E9
E10
E11
E12
E13
E14
E15
E16
E17
E19
E20
E21
E22
E23
E24
Station
De
nsi
ty (
ind
./m3
)
BA CY DI
0
1000
2000
3000
4000
5000
6000
7000
8000
9000
10000
K1
K2
K3
K4 E2
E3
E4
E5
E6
E7
E8
E9
E10
E11
E12
E13
E14
E15
E16
E17
E19
E20
E21
E22
E23
E24
Station
De
nsi
ty (
ind
./m3
)BA CY DI EU
0
2
4
6
8
10
12
14
16
18
20
Station
Num
ber o
f tax
on
BA CH CY DI
0
5
10
15
20
25
Station
Num
ber o
f tax
on
BA CH CY DI
Figure 1.32 Taxon portion of each group of phytoplanton on dry season
Figure 1.33 Taxon portion of each group of phytoplankton on rainy season
Figure 1.34 Density portion of each group of phytoplanton on dry season
Figure 1.35 Density portion of each group of phytoplankton on rainy season
ENVIRONMENTAL BASELINE SURVEY REPORT Page 58 of 141
FOR NGHI SON REFINERY AND PETROCHEMICAL COMPLEX Final Report
CPSE September, 2009
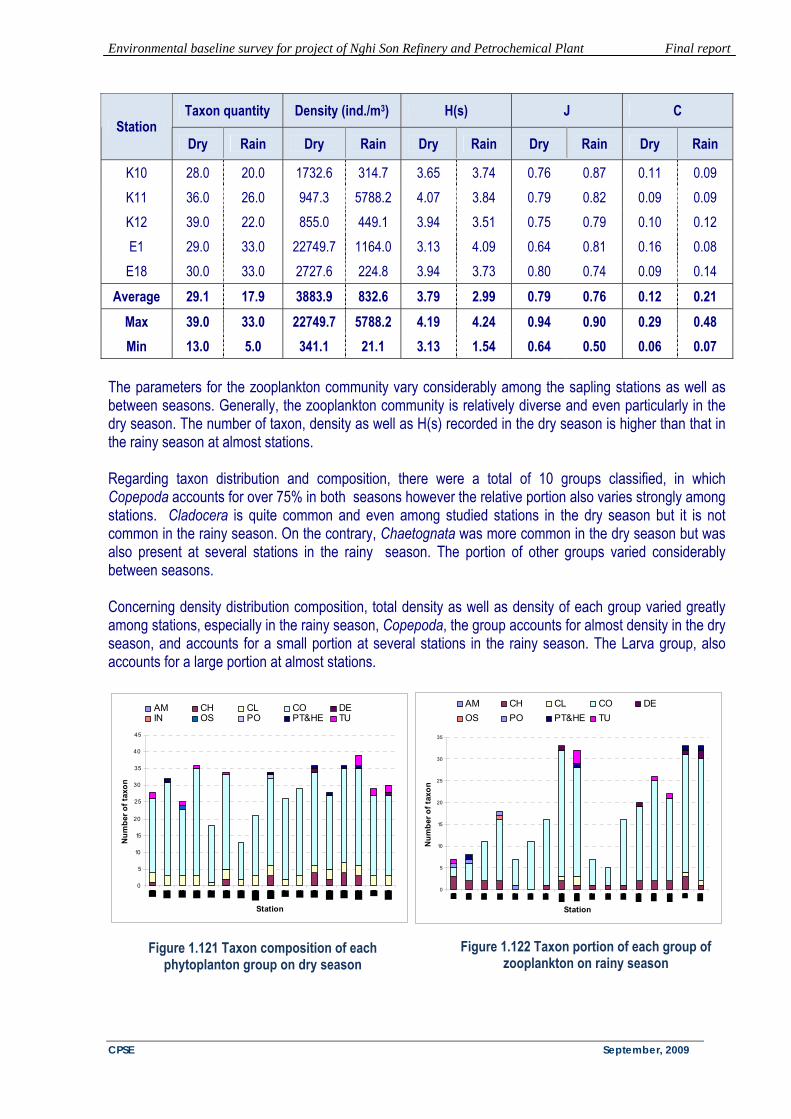
taxon quantity. The second most diverse group is the Chaetognata group. The other groups represent smaller proportions and differ between seasons (see Table 1.18 and Figures 1.36 and 1.37). Regardingdensity composition and distribution: Similar to taxon quantity, the density of the zooplankton community is rather even. An exception is the strong increase of density caused by the strong development of Copepoda and Ostracoda groups recorded at station E17 in the dry season; and the increase in density at station 20 in the rainy season caused by the strong development of Larva, Chaetognata and Ostracoda groups. At other stations, the variation of density between the two seasons as well as among stations is not very high (Table 1.18 and Figures 1.38 and 1.39). In regards to density composition, Copepoda is also the most dominant in both otherainy and dry season; followed by Larvae and Cladocera. The others vary considerably between seasons (Figure 1.38 and 1.39). In both the rainy and dry seasons, all community indices are at relatively good levels (Table 1.18).
Table 1.18 The parameters of zooplankton community at offshore stations in rainy season and dry season.
Figure 1.36 Taxon composition of each zooplankton group on dry season
Figure 1.37 Taxon composition of each zooplankton group on rainy season
Figure 1.38 Taxon composition of each zooplankton group on dry season
Figure 1.39 Taxon composition of each zooplankton group on rainy season
ENVIRONMENTAL BASELINE SURVEY REPORT Page 60 of 141
FOR NGHI SON REFINERY AND PETROCHEMICAL COMPLEX Final Report
CPSE September, 2009
7.2 Onshore area 7.2.1 Ambient air, noise and vibration quality Ambient air quality a. Hourly ambient air quality The hourly ambient air analytical results are presented in Tables 1.19 and 1.20.
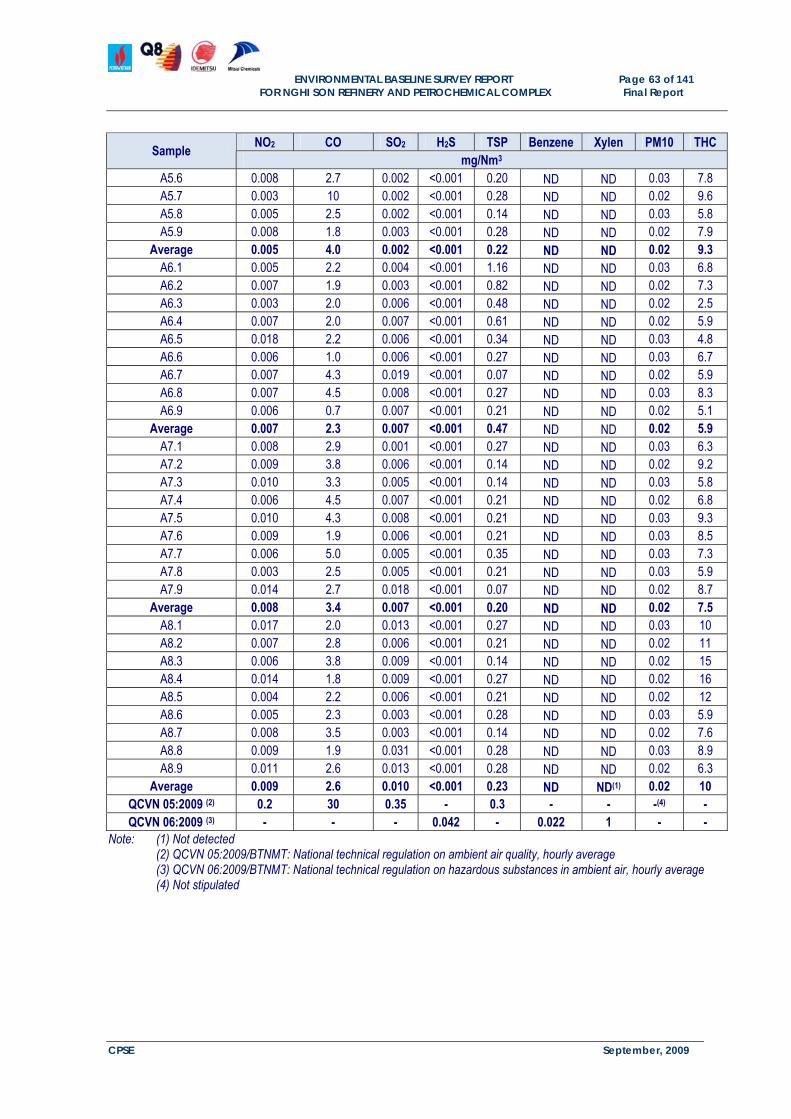
Table 1.19 Summary results of ambient air quality parameters – dry season (Feb., 2009)
Note: (1) Not detected (2) QCVN 05:2009/BTNMT: National technical regulation on ambient air quality, hourly average (3) QCVN 06:2009/BTNMT: National technical regulation on hazardous substances in ambient air, hourly average (4) Not stipulated
ENVIRONMENTAL BASELINE SURVEY REPORT Page 64 of 141
FOR NGHI SON REFINERY AND PETROCHEMICAL COMPLEX Final Report
CPSE September, 2009
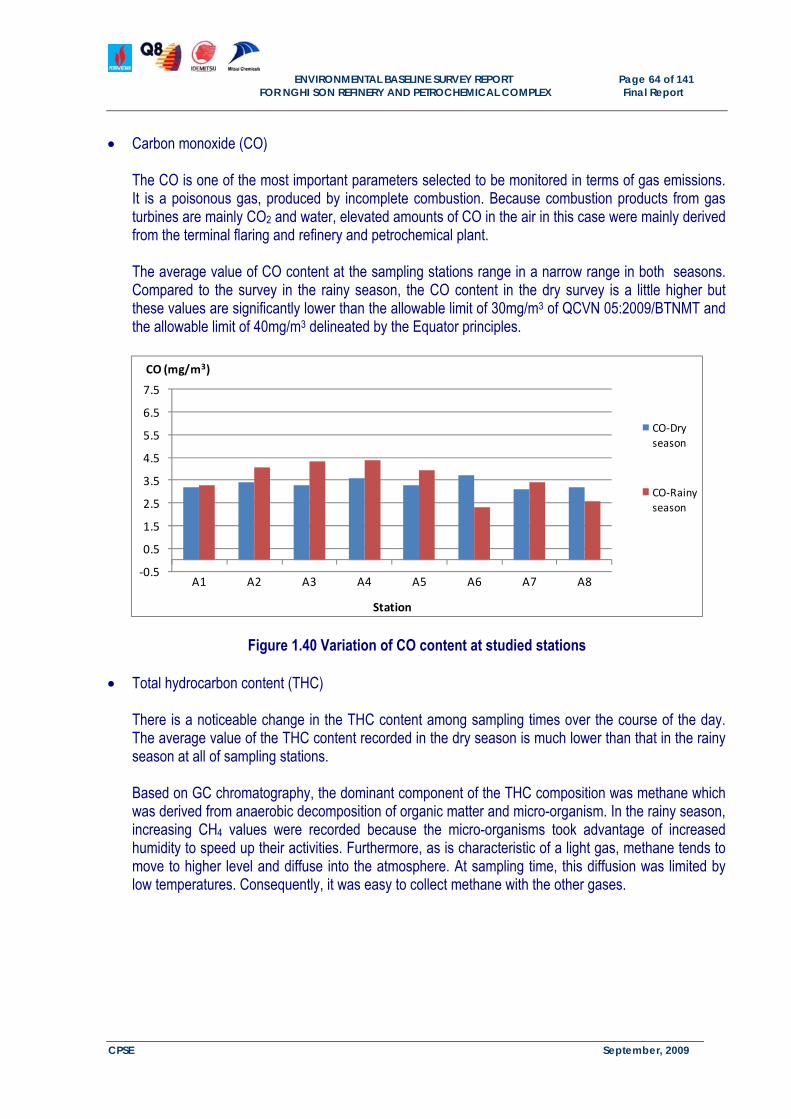
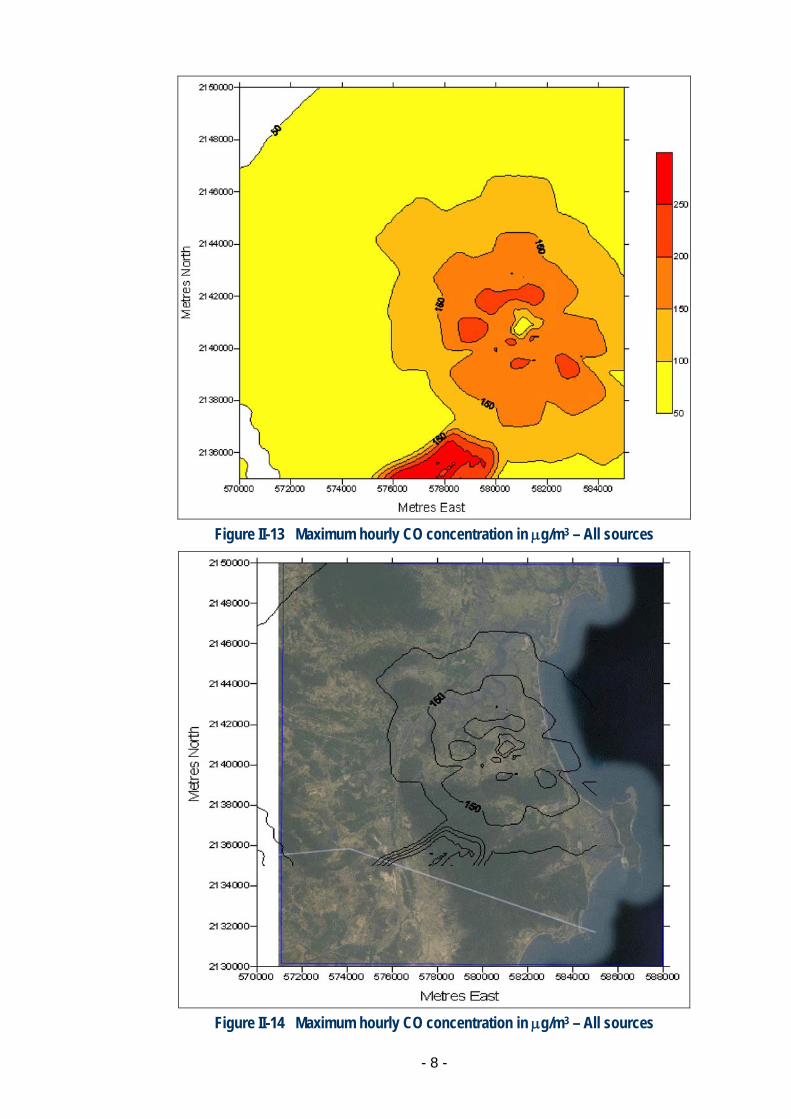
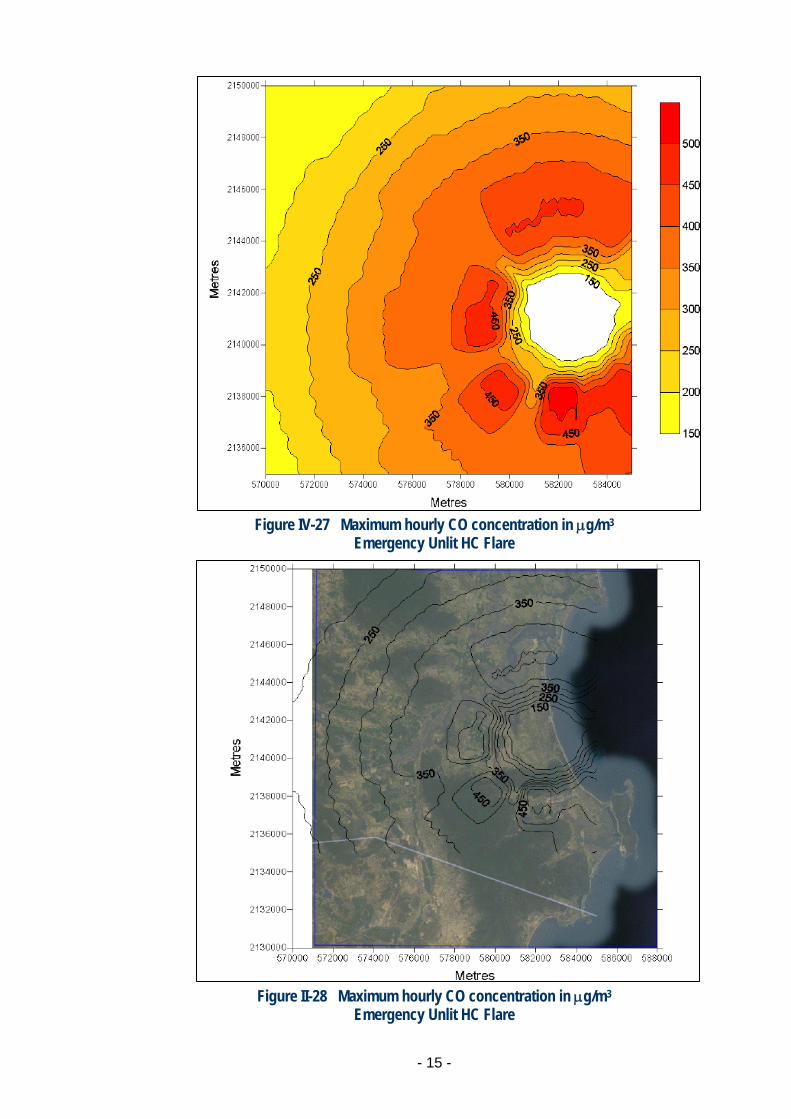
Carbon monoxide (CO)
The CO is one of the most important parameters selected to be monitored in terms of gas emissions. It is a poisonous gas, produced by incomplete combustion. Because combustion products from gas turbines are mainly CO2 and water, elevated amounts of CO in the air in this case were mainly derived from the terminal flaring and refinery and petrochemical plant. The average value of CO content at the sampling stations range in a narrow range in both seasons. Compared to the survey in the rainy season, the CO content in the dry survey is a little higher but these values are significantly lower than the allowable limit of 30mg/m3 of QCVN 05:2009/BTNMT and the allowable limit of 40mg/m3 delineated by the Equator principles.
‐0.5
0.5
1.5
2.5
3.5
4.5
5.5
6.5
7.5
A1 A2 A3 A4 A5 A6 A7 A8
CO (mg/m3)
Station
CO‐Dry season
CO‐Rainy season
Figure 1.40 Variation of CO content at studied stations
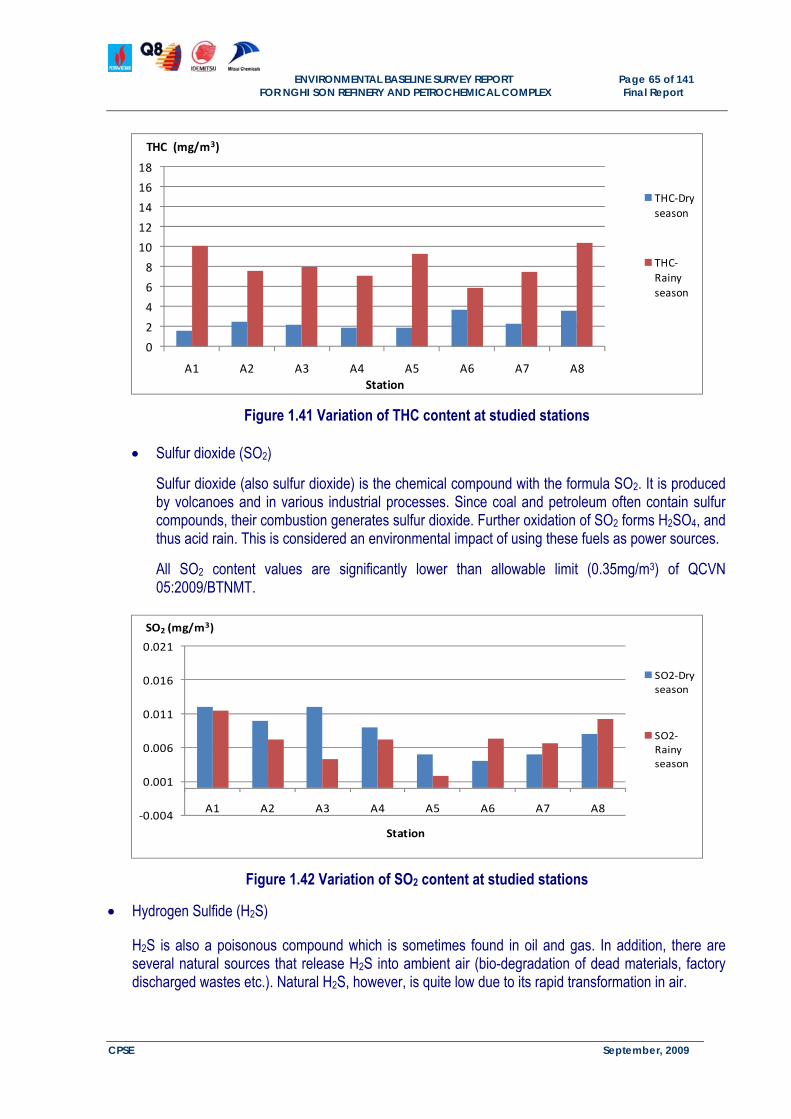
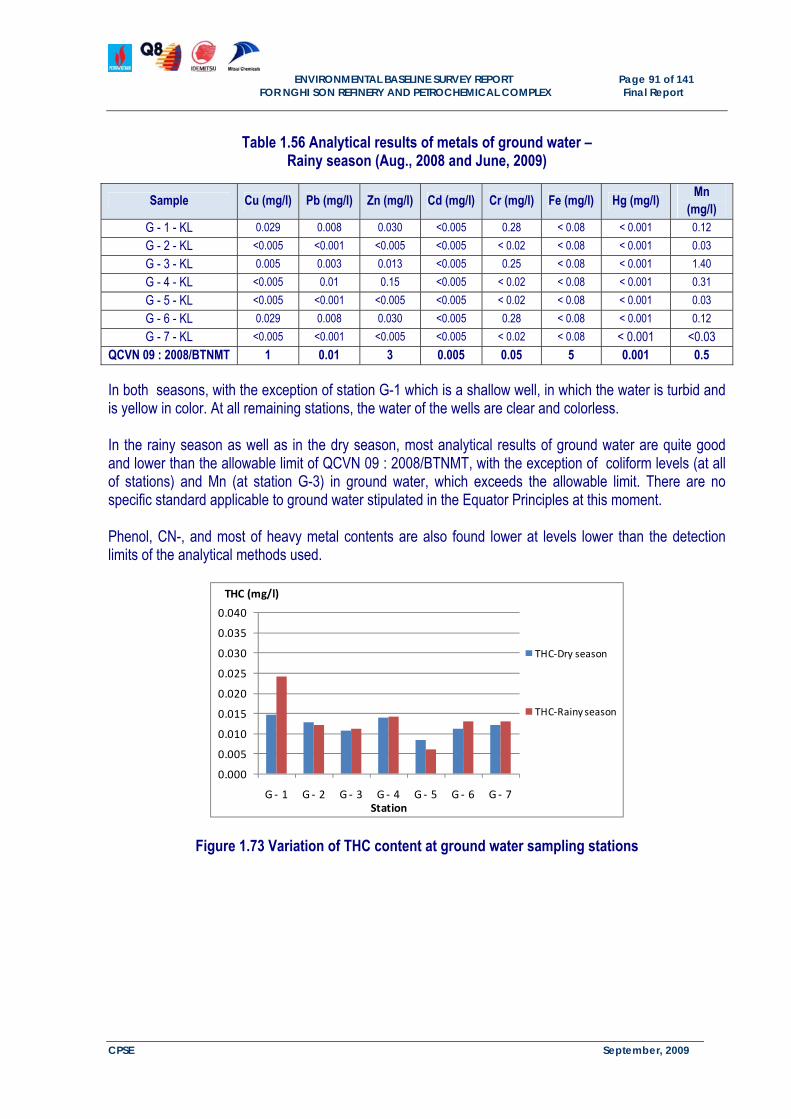
Total hydrocarbon content (THC) There is a noticeable change in the THC content among sampling times over the course of the day. The average value of the THC content recorded in the dry season is much lower than that in the rainy season at all of sampling stations.
Based on GC chromatography, the dominant component of the THC composition was methane which was derived from anaerobic decomposition of organic matter and micro-organism. In the rainy season, increasing CH4 values were recorded because the micro-organisms took advantage of increased humidity to speed up their activities. Furthermore, as is characteristic of a light gas, methane tends to move to higher level and diffuse into the atmosphere. At sampling time, this diffusion was limited by low temperatures. Consequently, it was easy to collect methane with the other gases.
ENVIRONMENTAL BASELINE SURVEY REPORT Page 65 of 141
FOR NGHI SON REFINERY AND PETROCHEMICAL COMPLEX Final Report
CPSE September, 2009
02468
1012141618
A1 A2 A3 A4 A5 A6 A7 A8
THC (mg/m3)
Station
THC‐Dry season
THC‐Rainy season
Figure 1.41 Variation of THC content at studied stations Sulfur dioxide (SO2)
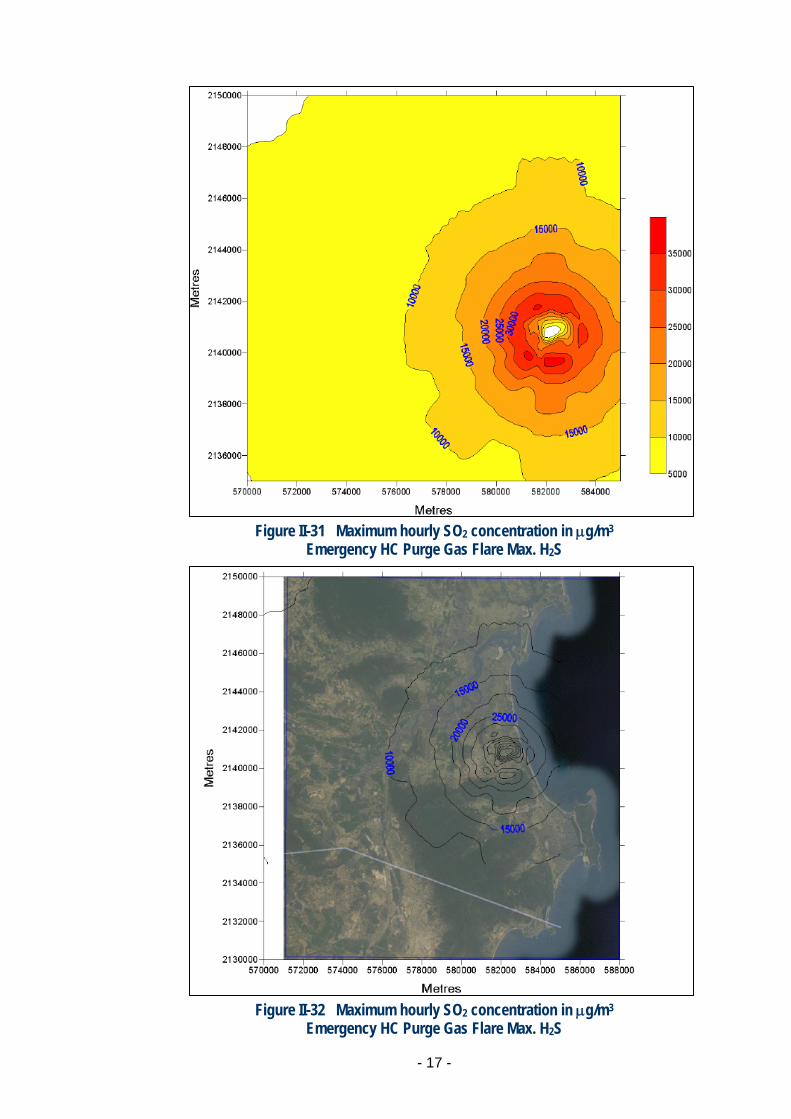
Sulfur dioxide (also sulfur dioxide) is the chemical compound with the formula SO2. It is produced by volcanoes and in various industrial processes. Since coal and petroleum often contain sulfur compounds, their combustion generates sulfur dioxide. Further oxidation of SO2 forms H2SO4, and thus acid rain. This is considered an environmental impact of using these fuels as power sources.
All SO2 content values are significantly lower than allowable limit (0.35mg/m3) of QCVN 05:2009/BTNMT.
‐0.004
0.001
0.006
0.011
0.016
0.021
A1 A2 A3 A4 A5 A6 A7 A8
SO2 (mg/m3)
Station
SO2‐Dry season
SO2‐Rainy season
Figure 1.42 Variation of SO2 content at studied stations
Hydrogen Sulfide (H2S) H2S is also a poisonous compound which is sometimes found in oil and gas. In addition, there are several natural sources that release H2S into ambient air (bio-degradation of dead materials, factory discharged wastes etc.). Natural H2S, however, is quite low due to its rapid transformation in air.
ENVIRONMENTAL BASELINE SURVEY REPORT Page 66 of 141
FOR NGHI SON REFINERY AND PETROCHEMICAL COMPLEX Final Report
CPSE September, 2009
All H2S values recorded in both seasons are lower than the detection limit method and significantly lower than the allowable limit (0.042 mg/m3) of QCVN 06:2009/BTNMT.
Nitrogen dioxide (NO2)
NO2 is also common emission products which may cause acid rain. Its presence in the air is easily detected wherever fuel (oil and gas) combustion occurs. In both of two sampling seasons, NO2 content at all stations was lower than the allowable limit of 0.2 mg/m3 (both in QCVN 05:2009/BTNMT.
‐0.001
0.004
0.009
0.014
0.019
0.024
A1 A2 A3 A4 A5 A6 A7 A8
NO2 (mg/m3)
Station
NO2‐Dry season
NO2‐Rainy season
Figure 1.43 Variation of NO2 content at studied stations
Total Suspended Particulate (TSP)
With the exception of a certain amount of TSP which comes from stationary emission sources (e.g. combustion flares), TSP in ambient air in this case was mainly generated by natural conditions (e.g. traffic vehicle movement. wind disturbance). The average value of TSP content is exceeded the allowable limit (0.3mg/m3 – QCVN 05:2009/BTNMT) at stations A4 and A6 in the rainy season. This may be due to the fact that TSP is not only originated from terminal activity but also from other activities such as movement of some trucks bulldozers, digging, etc.
ENVIRONMENTAL BASELINE SURVEY REPORT Page 67 of 141
FOR NGHI SON REFINERY AND PETROCHEMICAL COMPLEX Final Report
CPSE September, 2009
‐0.05
0.05
0.15
0.25
0.35
0.45
0.55
0.65
0.75
A1 A2 A3 A4 A5 A6 A7 A8
TSP (mg/m3)
Station
SPM‐Dry season
SPM‐Rainy season
Figure 1.44 Variation of TSP content at studied stations Benzene and Xylene
Specific products of Nghi Son Refinery and Petrochemical Plant during the operating period are benzene and xylene. Benzene is an aromatic hydrocarbon compound. It occurs naturally in fossil fuels and is released into the atmosphere as a result of natural processes, and human activities that involved the combustion of organic matter, such as wood, coal, and petroleum products. Petrol vehicle emissions are the predominant source of benzene in the environment, although industries such as petroleum refining and steel works can also contribute to overall levels. Evaporative losses from petroleum fuels storage facilities and service stations are another means by which benzene enters the air environment. At typical ambient concentrations, benzene does not have any short-term or acute health effects. However long-term exposure to benzene has been linked to an increased incidence of blood and immune system disorders including anaemia and leukemia. Xylene is an aromatic hydrocarbon that exists in three isomeric forms Ortho, Meta, and Para Xylen. This compound is a mixture of 40% m- xylene, 20% o- xylene and 20% ethyl benzene. Xylene occurs naturally in crude oil and is also generated through combustion of organic matter such as wood, coal, and petroleum products. Evaporation from petroleum fuels storage facilities and service stations, and the use of products containing xylene based solvents and thinners are other ways xylene enters the air environment. Xylene exposure causes eye, nose and throat irritation and neurological effects such as impaired reaction time short-term memory loss and the loss of bodily coordination. There is no evidence that xylen is carcinogenic. The above effects do not occur at xylene levels typically experienced in ambient air. In both the rainy and dry seasons, benzene and xylene contents at all sampling stations are found at concentrations lower than the detection limit of analytical methods (GC-MS method).
ENVIRONMENTAL BASELINE SURVEY REPORT Page 68 of 141
FOR NGHI SON REFINERY AND PETROCHEMICAL COMPLEX Final Report
CPSE September, 2009
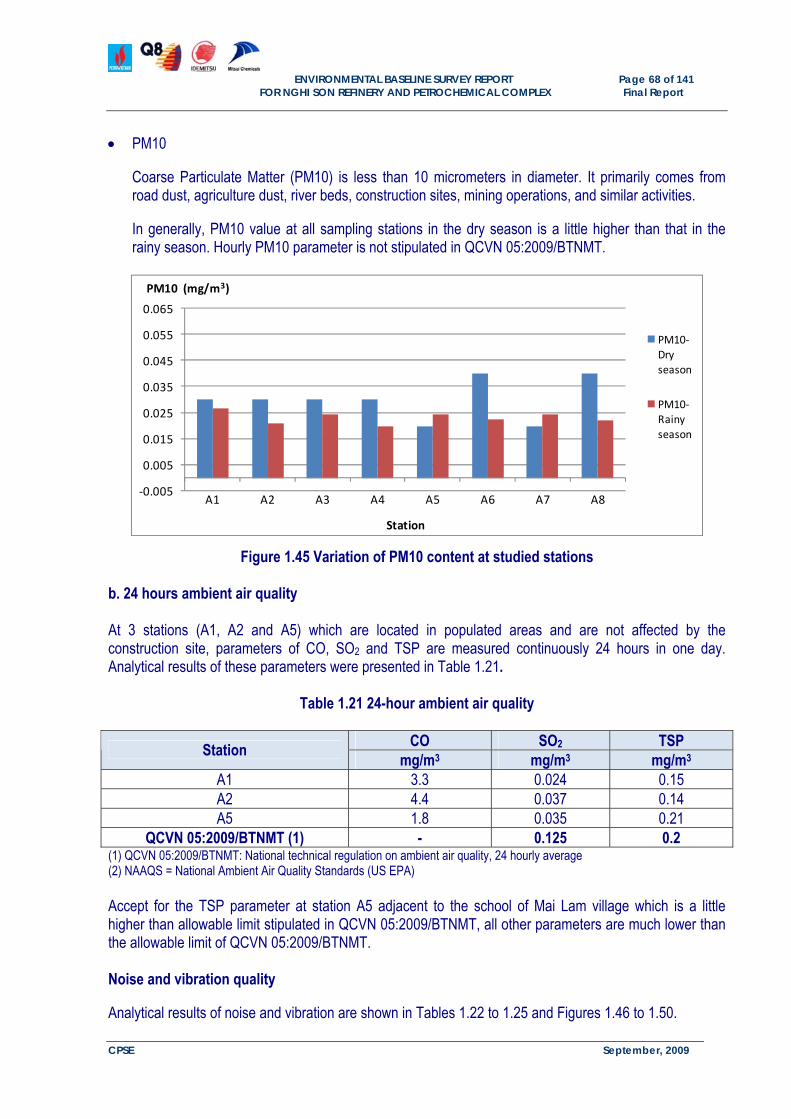
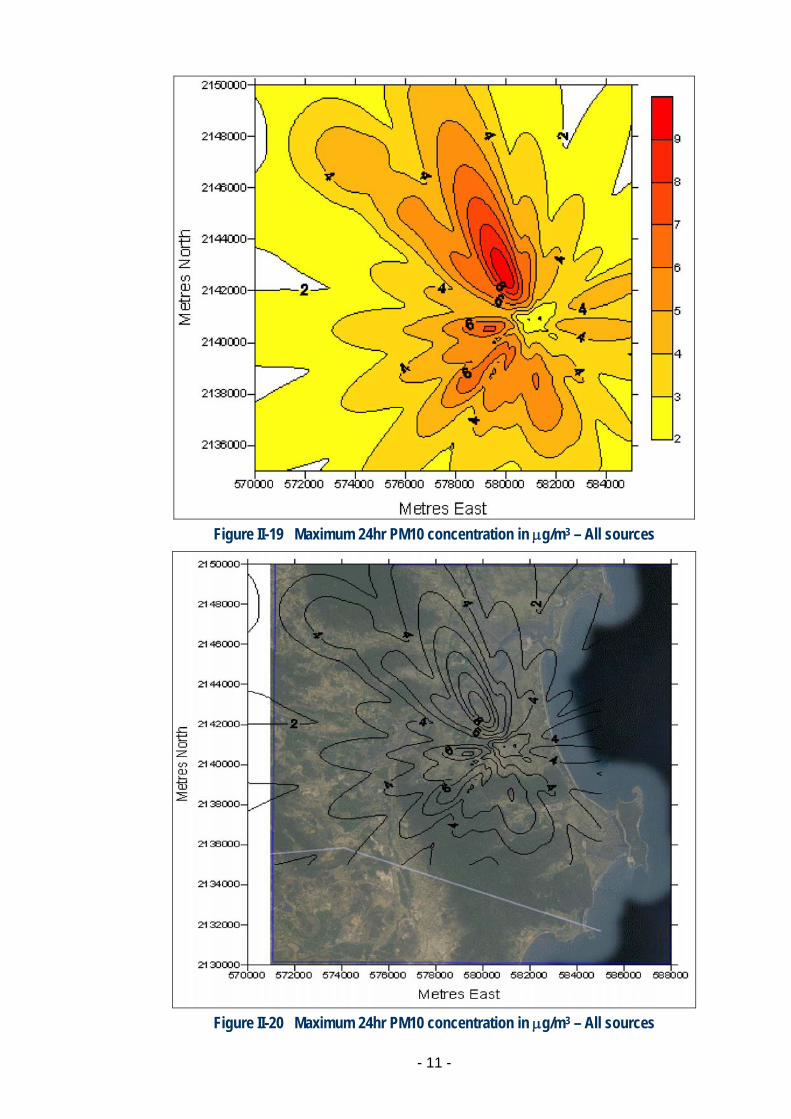
PM10 Coarse Particulate Matter (PM10) is less than 10 micrometers in diameter. It primarily comes from road dust, agriculture dust, river beds, construction sites, mining operations, and similar activities. In generally, PM10 value at all sampling stations in the dry season is a little higher than that in the rainy season. Hourly PM10 parameter is not stipulated in QCVN 05:2009/BTNMT.
‐0.005
0.005
0.015
0.025
0.035
0.045
0.055
0.065
A1 A2 A3 A4 A5 A6 A7 A8
PM10 (mg/m3)
Station
PM10‐Dry season
PM10‐Rainy season
Figure 1.45 Variation of PM10 content at studied stations
b. 24 hours ambient air quality
At 3 stations (A1, A2 and A5) which are located in populated areas and are not affected by the construction site, parameters of CO, SO2 and TSP are measured continuously 24 hours in one day. Analytical results of these parameters were presented in Table 1.21.
QCVN 05:2009/BTNMT (1) - 0.125 0.2 (1) QCVN 05:2009/BTNMT: National technical regulation on ambient air quality, 24 hourly average (2) NAAQS = National Ambient Air Quality Standards (US EPA) Accept for the TSP parameter at station A5 adjacent to the school of Mai Lam village which is a little higher than allowable limit stipulated in QCVN 05:2009/BTNMT, all other parameters are much lower than the allowable limit of QCVN 05:2009/BTNMT. Noise and vibration quality Analytical results of noise and vibration are shown in Tables 1.22 to 1.25 and Figures 1.46 to 1.50.
ENVIRONMENTAL BASELINE SURVEY REPORT Page 69 of 141
FOR NGHI SON REFINERY AND PETROCHEMICAL COMPLEX Final Report
CPSE September, 2009
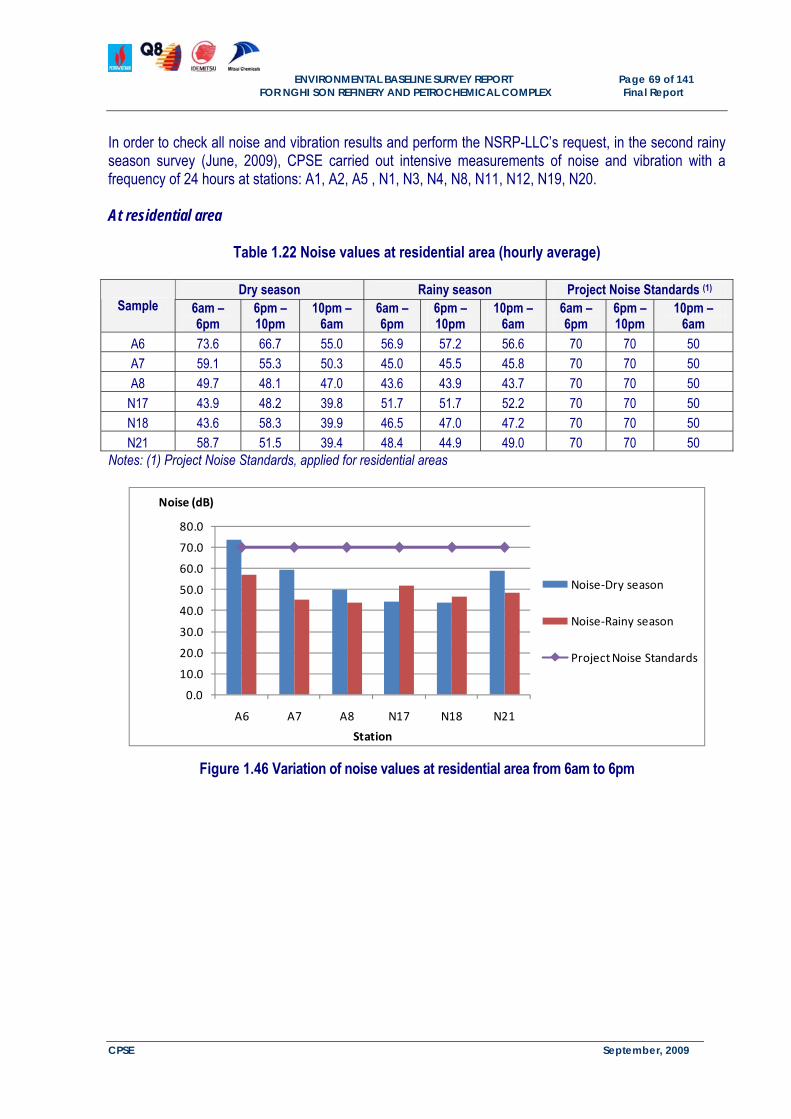
In order to check all noise and vibration results and perform the NSRP-LLC’s request, in the second rainy season survey (June, 2009), CPSE carried out intensive measurements of noise and vibration with a frequency of 24 hours at stations: A1, A2, A5 , N1, N3, N4, N8, N11, N12, N19, N20. At residential area
Table 1.22 Noise values at residential area (hourly average)
Dry season Rainy season Project Noise Standards (1) Sample 6am –
Note: (2)TCVN 6962:2001: Vibration and shock – Vibration emitted by construction works and factories - maximum permitted levels in the environment of public and residential areas, applied for residential areas: Hotels, administration offices, Houses, apartment houses, etc.
0.0
10.0
20.0
30.0
40.0
50.0
60.0
70.0
80.0
A6 A7 A8 N17 N18 N21
Vibration(dB)
Station
Vibration‐Dry season
Vibration‐Rainy season
TCVN 6962:2001
Figure 1.49 Variation of vibration values at residential area from 7am to 7pm
0.0
10.0
20.0
30.0
40.0
50.0
60.0
70.0
80.0
A6 A7 A8 N17 N18 N21
Vibration(dB)
Station
Vibration‐Dry season
Vibration‐Rainy season
TCVN 6962:2001
Figure 1.50 Variation of vibration values at residential area from 7pm to 7am
ENVIRONMENTAL BASELINE SURVEY REPORT Page 72 of 141
FOR NGHI SON REFINERY AND PETROCHEMICAL COMPLEX Final Report
CPSE September, 2009
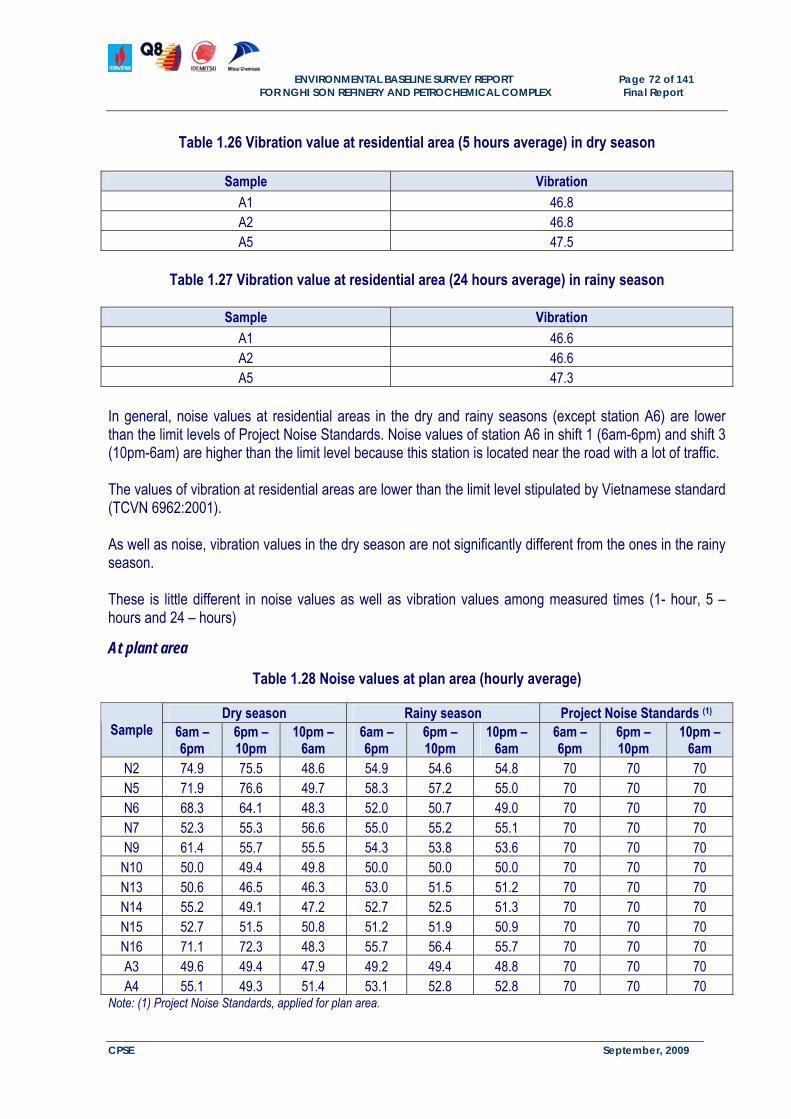
Table 1.26 Vibration value at residential area (5 hours average) in dry season
Sample Vibration
A1 46.8 A2 46.8 A5 47.5
Table 1.27 Vibration value at residential area (24 hours average) in rainy season
Sample Vibration
A1 46.6 A2 46.6 A5 47.3
In general, noise values at residential areas in the dry and rainy seasons (except station A6) are lower than the limit levels of Project Noise Standards. Noise values of station A6 in shift 1 (6am-6pm) and shift 3 (10pm-6am) are higher than the limit level because this station is located near the road with a lot of traffic.
The values of vibration at residential areas are lower than the limit level stipulated by Vietnamese standard (TCVN 6962:2001).
As well as noise, vibration values in the dry season are not significantly different from the ones in the rainy season. These is little different in noise values as well as vibration values among measured times (1- hour, 5 – hours and 24 – hours)
At plant area
Table 1.28 Noise values at plan area (hourly average)
Dry season Rainy season Project Noise Standards (1) Sample 6am –
ENVIRONMENTAL BASELINE SURVEY REPORT Page 75 of 141
FOR NGHI SON REFINERY AND PETROCHEMICAL COMPLEX Final Report
CPSE September, 2009
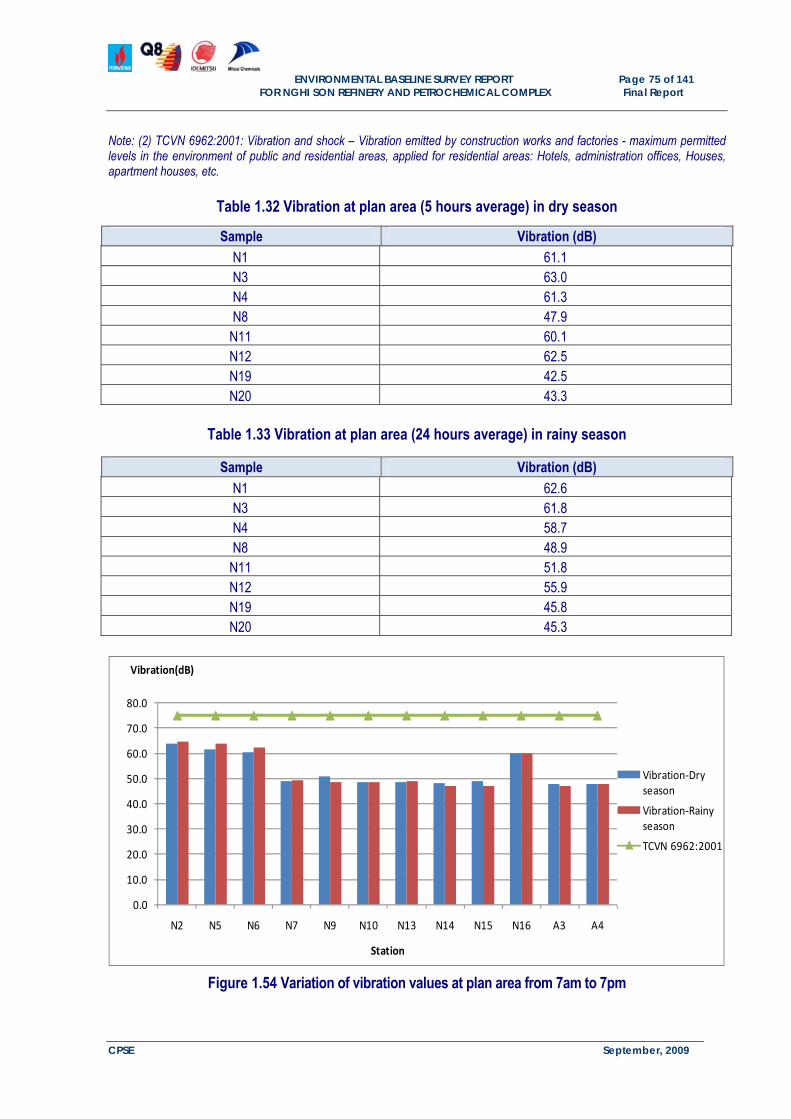
Note: (2) TCVN 6962:2001: Vibration and shock – Vibration emitted by construction works and factories - maximum permitted levels in the environment of public and residential areas, applied for residential areas: Hotels, administration offices, Houses, apartment houses, etc.
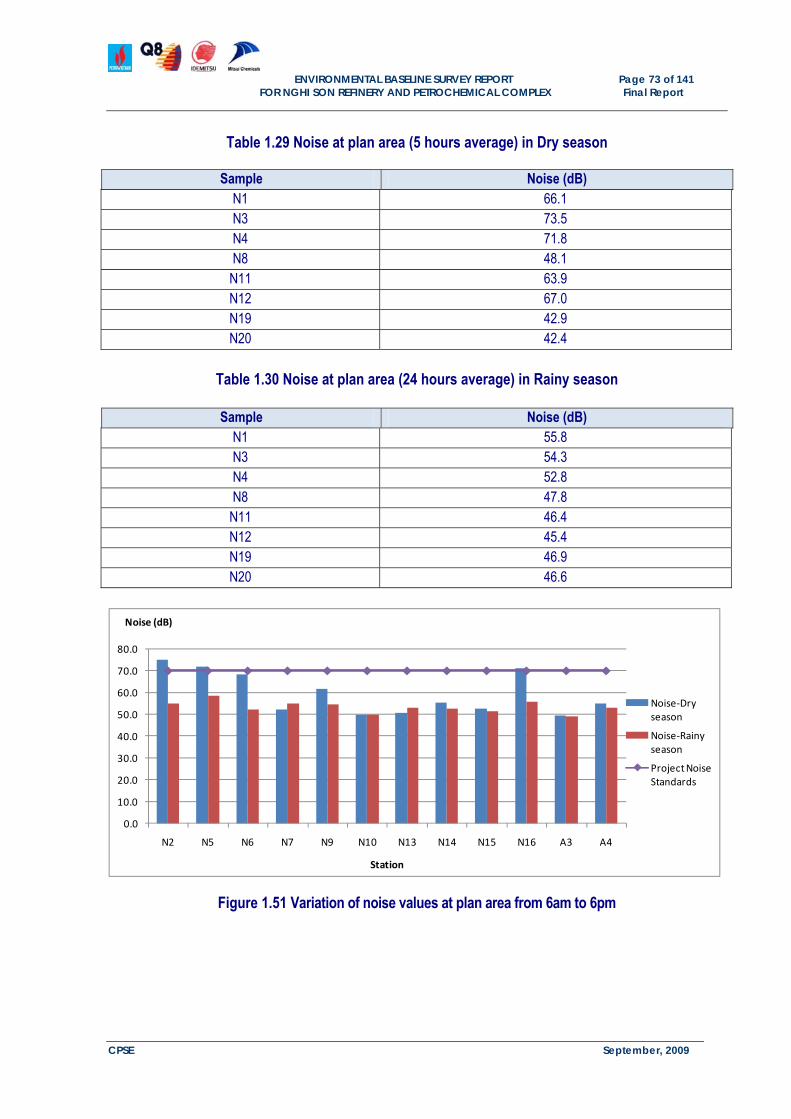
Table 1.32 Vibration at plan area (5 hours average) in dry season
Sample Vibration (dB)
N1 61.1 N3 63.0 N4 61.3 N8 47.9
N11 60.1 N12 62.5 N19 42.5 N20 43.3
Table 1.33 Vibration at plan area (24 hours average) in rainy season
Sample Vibration (dB)
N1 62.6 N3 61.8 N4 58.7 N8 48.9
N11 51.8 N12 55.9 N19 45.8 N20 45.3
0.0
10.0
20.0
30.0
40.0
50.0
60.0
70.0
80.0
N2 N5 N6 N7 N9 N10 N13 N14 N15 N16 A3 A4
Vibration(dB)
Station
Vibration‐Dry season
Vibration‐Rainy season
TCVN 6962:2001
Figure 1.54 Variation of vibration values at plan area from 7am to 7pm
ENVIRONMENTAL BASELINE SURVEY REPORT Page 76 of 141
FOR NGHI SON REFINERY AND PETROCHEMICAL COMPLEX Final Report
CPSE September, 2009
0.0
10.0
20.0
30.0
40.0
50.0
60.0
70.0
80.0
N2 N5 N6 N7 N9 N10 N13 N14 N15 N16 A3 A4
Vibration(dB)
Station
Vibration‐Dry season
Vibration‐Rainy season
TCVN 6962:2001
Figure 1.55 Variation of vibration values at plan area from 7pm to 7am
Except N2, N5 and N16, noise values at other station are lower than the limit level of 70dB referred to Project Noise Standards and the values in the dry season are not significantly different from the ones in the rainy season.
In shifts 1 and 2 (6am to 10pm), the noise values at N2, N5 and N16 exceed the limit level of Project Noise Standards. This can be explained byt the fact that these stations are located near the road where a lot of automobiles and trucks travel. Beside the affection of vehicles, the other stations (N5 and N16) are located near leveling works so that the noise values at these stations are higher than the normal level.
All vibration values in the plan area are lower than limit level stipulated in Vietnamese standard (TCVN 6962:2001). At all stations, the disparity of vibration values between the dry and rainy seasons is not noticeable.
There are not significant differences in the noise values as well as vibration among measured times ( 1- hour, 5 hours and 24 – hours).
7.2.2 Characteristics of Sediment/Soil Sediment grain size distribution Analytical results of sediment grain size distribution are summarized in Tables 1.34 and 1.35.
ENVIRONMENTAL BASELINE SURVEY REPORT Page 77 of 141
FOR NGHI SON REFINERY AND PETROCHEMICAL COMPLEX Final Report
CPSE September, 2009
Table 1.34 Summary results of grain size distribution characteristics of soil sample – Dry season (February, 2009)
STATION MEAN PHI STANDARD DEVIATION
(PHI)
SKEW- NESS
KUR- TOSIS
% COARSE
% FINES
SORTING INDEX
SEDIMENT TYPE VISUAL DESCRIPTION
B-2 3.52 1.73 0.96 4.92 0.89 19.66 Moderate Very Fine Sand There were shell fragments in the sediment. Sediment was black mud.
B-3 3.16 1.44 1.84 8.53 0.64 10.25 Good Very Fine Sand There was seaweed in the sediment. Sediment was mud.
Table 1.35 Summary results of grain size distribution characteristics of soil sample –
Rainy season (August, 2008)
STATION MEAN PHI STANDARD DEVIATION
(PHI)
SKEW- NESS
KUR- TOSIS
% COARSE
% FINES
SORTING INDEX
SEDIMENT TYPE VISUAL DESCRIPTION
B-2 1.55 1.31 1.65 11.16 3.20 3.00 Good Medium Sand
There were shell fragments and bivalves in the sediment. Sediment was mud.
B-3 3.80 1.86 1.38 4.20 0.00 23.79 Moderate Very Fine Sand
There were shell fragments and bivalves in the sediment. Sediment was mud.
It is noted that, sediment at station B2 in the rainy season is coarser than that in the dry season. By visual observation, dry season environmental status at station B2 is contaminated because of many waste sources. Hydrocarbon in sediment/soil Results from sediment/soil hydrocarbon analysis are summarized in Table 1.36 and 1.37
Table 1.36 Summary results of hydrocarbon composition of soil sample – Dry season (February, 2009) (µg/g)
Station UCM ∑n-C13-35 CPI Pr./Ph. UCM /∑n-C13-35 THC
B-2 14 2.2 4 0.7 6 19 B-3 2 1.8 4 3.8 1 5
Table 1.37 Summary results of hydrocarbon composition of soil sample –
Rainy season (Aug, 2008) (µg/g)
Station UCM ∑n-C13-35 CPI Pr./Ph. UCM /∑n-C13-35 THC
B-2 2 0.3 2.2 0.9 7 2 B-3 2 1.8 3.9 2.9 1 4
ENVIRONMENTAL BASELINE SURVEY REPORT Page 78 of 141
FOR NGHI SON REFINERY AND PETROCHEMICAL COMPLEX Final Report
CPSE September, 2009
Table 1.38 Summary results of hydrocarbon composition of soil sample – Dry season (February, 2009) (µg/g dry weight)
Station UCM ∑n-C13-35 CPI Pr./Ph. UCM /∑n-C13-35 THC % TOM
Similar to the variation of grain size, the total hydrocarbon contents in the sediment at station B2 in the dry season is much higher than that in the dry season due to the difference of sediment characteristis between two seasons. The total hydrocarbon contents in the soil sample at the sampling stations change over a wide range (from 3 to 84µg/g in dry season and from 1 to 219µg/g in rainy season). In both seasons, the highest value of THC is found at station D-7 station located at Nghi Son fishing village where organic waste of catching and raising maritime products is discharged.
ENVIRONMENTAL BASELINE SURVEY REPORT Page 79 of 141
FOR NGHI SON REFINERY AND PETROCHEMICAL COMPLEX Final Report
CPSE September, 2009
Metal in sediment/soil
Table 1.40 Summary results of metals in sediment samples – Dry season (February, 2009) (µg/g dry weight)
QCVN 03:2008/BTNMT(*) 100 300 300 10 - - - (*): QCVN 03:2008: National technical regulation on the allowable limits of heavy metals in the soils – column applied for industrial soil.
Table 1.43 Summary results of metals in soil samples – Rainy season (August, 2008 and June, 1009) (µg/g dry weight)
At all onshore stations, the metal contents in the soil samples are lower than the limit values of QCVN 03:2008/BTNMT. Except for Hg content, the metal content in the soil fluctuates within a narrow range in both seasons. At all studied stations, Cd contents are found at lower levels than the detection limit (1µg/g). The Fe content in the sediment as well as the soil recorded in the rainy season is much higher than that in the dry season. 7.2.3 The macrobenthic community at the onshore area
The summary result of macrobenthos community at two onshore stations are presented in Table 1.44 and Figures 1.56 to 1.61. The detailed results are showed in Appendix B.
Table 1.44 The parameters of macrobenthos community at two onshore stations in rainy and dry seasons
It is evident that the macrobenthos community is much different in number of taxon, density as well as biomass. They are high or low according to the sampling location as well as the sampling season (Table 1.44). The community indices are also much different between stations. However, it is similar between seasons. They indices are good at station B3 but poor at station B2. The composition of taxon quantity, density and biomass are presented on Figure 1.56; 1.57; 1.58; 1.59; 1.60 and 1.61. There are 4 groups of benthic fauna identified including Polychaeta, Crustacea, Mollusca and Echinodermata. Polychaeta represent the largest portion of taxon quantity; followed in turn by Crustacea or Mollusca and Echinodermata. In density, Mollusca group takes the largest portion; the second large portion belongs to Polychaeta then Crustacea. Biomass changes considerably between seasons as well as between sampling stations; in the rainy season, the biomass value is too very high based on the increasing biomass of Mollusca. Therefore, the biomass portion is the highest in this season; in the dry season the largest portion belongs to Crustacea.
ENVIRONMENTAL BASELINE SURVEY REPORT Page 81 of 141
FOR NGHI SON REFINERY AND PETROCHEMICAL COMPLEX Final Report
CPSE September, 2009
0
10
20
30
40
50
60
70
80
90
B2 B3
Dens
ity (I
nd./m
2 )
Station
PO MO EC CR
0
100
200
300
400
500
600
700
800
B2 B3
Den
sity
(Ind
./m2 )
Station
CR EC MO PO
0
2
4
6
8
10
12
14
B2 B3
Station
Num
ber
of t
axon
CR EC MO PO
0
2
4
6
8
10
12
14
B2 B3
Station
Num
ber
of t
axon
CR EC MO PO
Figure 1.56 Taxon composition of each macrobenthic group on dry season
Figure 1.57 Taxon composition of each macrobenthic group on rainy season
Figure 1.58 Density composition of each macrobenthic group on dry season
Figure 1.59 Density composition of each macrobenthic group on rainy season
ENVIRONMENTAL BASELINE SURVEY REPORT Page 82 of 141
FOR NGHI SON REFINERY AND PETROCHEMICAL COMPLEX Final Report
CPSE September, 2009
7.2.4 Physical-chemical characteristics of water Surface water The surface water analytical results are presented in Tables 1.45 to 1.50.
Table 1.45 Analytical results of physical characteristics of surface water at the onshore area – Dry season (February, 2009)
Average <0.005 0.004 0.015 <0.005 < 0.02 0.61 < 0.001
QCVN 08 : 2008/BTNMT 1 0.05 2 0.01 0.05 2 0.002
All analytical results of surface water in both seasons are quite good and lower than allowable limits stipulated in QCVN 08:2008/BTNMT. Phenol, benzene, CN- and some heavy metal contents are found under the detection limit of analytical methods. TSS, NH4+ and total P contents at station B2 in the dry season is much higher than the in rainy season. It agrees with visual observations that in the dry season, environmental status is considerably worse than that in the rainy season. The total oil content and presence of trace metals are the major parameters used for water quality assessment. A certain amount of these matters come from various sources such as industrial or shipping wastes. Meanwhile, nitrogen and phosphorous compounds are related to plant nutrients. Various human activities might greatly accelerate the concentration of these compounds in water, especially in natural lakes.
ENVIRONMENTAL BASELINE SURVEY REPORT Page 85 of 141
FOR NGHI SON REFINERY AND PETROCHEMICAL COMPLEX Final Report
CPSE September, 2009
0.0
1.0
2.0
3.0
4.0
5.0
6.0
7.0
8.0
9.0
B‐2 B‐3
pH
Station
pH‐Dry season
pH‐Rainy season
Figure 1.62 Variation of pH at onshore sampling stations
0
5
10
15
20
25
30
35
40
45
B‐2 B‐3
Salinity ‰
Station
Salinity‐Dry season
Salinity‐Rainy season
Figure 1.63 Variation of Salinity at onshore sampling stations
ENVIRONMENTAL BASELINE SURVEY REPORT Page 86 of 141
FOR NGHI SON REFINERY AND PETROCHEMICAL COMPLEX Final Report
CPSE September, 2009
0
5
10
15
20
25
30
35
40
B‐2 B‐3
Temp. oC
Station
Temp‐Dry season
Temp‐Rainy season
Figure 1.64 Variation of Temperature at onshore sampling stations
0.05.0
10.015.020.025.030.035.040.045.0
B‐2 B‐3
TSS (mg/l )
Station
TSS‐Dry season
TSS‐Rainy season
Figure 1.65 Variation of TSS content at onshore sampling stations
0.000
0.002
0.004
0.006
0.008
0.010
0.012
0.014
B‐2 B‐3
THC (mg/l)
Station
THC‐Dry season
THC‐Rainy season
ENVIRONMENTAL BASELINE SURVEY REPORT Page 87 of 141
FOR NGHI SON REFINERY AND PETROCHEMICAL COMPLEX Final Report
CPSE September, 2009
Figure 1.66 Variation of THC content at onshore sampling stations
In both seasons, with the exception of station G-1 which is a shallow well, in which the water is turbid and is yellow in color. At all remaining stations, the water of the wells are clear and colorless. In the rainy season as well as in the dry season, most analytical results of ground water are quite good and lower than the allowable limit of QCVN 09 : 2008/BTNMT, with the exception of coliform levels (at all of stations) and Mn (at station G-3) in ground water, which exceeds the allowable limit. There are no specific standard applicable to ground water stipulated in the Equator Principles at this moment. Phenol, CN-, and most of heavy metal contents are also found lower at levels lower than the detection limits of the analytical methods used.
0.000
0.005
0.010
0.015
0.020
0.025
0.030
0.035
0.040
G ‐ 1 G ‐ 2 G ‐ 3 G ‐ 4 G ‐ 5 G ‐ 6 G ‐ 7
THC (mg/l)
Station
THC‐Dry season
THC‐Rainy season
Figure 1.73 Variation of THC content at ground water sampling stations
ENVIRONMENTAL BASELINE SURVEY REPORT Page 92 of 141
FOR NGHI SON REFINERY AND PETROCHEMICAL COMPLEX Final Report
Figure 1.74 Variation of NH4+ content at ground water sampling stations
0
100
200
300
400
500
600
G ‐ 1 G ‐ 2 G ‐ 3 G ‐ 4 G ‐ 5 G ‐ 6 G ‐ 7
SO42‐ (mg/l)
Station
SO4‐Dry season
SO4‐Rainy season
Figure 1.75 Variation of SO42- content at ground water sampling stations
0.000
0.500
1.000
1.500
2.000
2.500
3.000
3.500
4.000
G ‐ 1 G ‐ 2 G ‐ 3 G ‐ 4 G ‐ 5 G ‐ 6 G ‐ 7
NO3‐ (mg/l)
Station
NO3‐Dry season
NO3‐Rainy season
Figure 1.76 Variation of NO3- content at ground water sampling stations
ENVIRONMENTAL BASELINE SURVEY REPORT Page 93 of 141
FOR NGHI SON REFINERY AND PETROCHEMICAL COMPLEX Final Report
CPSE September, 2009
0
100
200
300
400
500
600
G ‐ 1 G ‐ 2 G ‐ 3 G ‐ 4 G ‐ 5 G ‐ 6 G ‐ 7
Cl‐ (mg/l)
Station
Cl‐Dry season
Cl‐Rainy season
Figure 1.77 Variation of Cl- content at ground water sampling stations
0
100
200
300
400
500
600
G ‐ 1 G ‐ 2 G ‐ 3 G ‐ 4 G ‐ 5 G ‐ 6 G ‐ 7
Hardness (mgCaCO3/l)
Station
Hardness‐Dry season
Hardness‐Rainy season
Figure 1.78 Variation of Hardness content at ground water sampling stations
ENVIRONMENTAL BASELINE SURVEY REPORT Page 94 of 141
FOR NGHI SON REFINERY AND PETROCHEMICAL COMPLEX Final Report
CPSE September, 2009
‐1
1
3
5
7
9
11
13
15
G ‐ 1 G ‐ 2 G ‐ 3 G ‐ 4 G ‐ 5 G ‐ 6 G ‐ 7
COD (mg/l)
Station
COD‐Dry season
COD‐Rainy season
Figure 1.79 Variation of COD content at ground water sampling stations
7.2.5 Planktonic community The summary results for the phytoplankton community at two onshore stations are presented in Table 1.57 and Figures 1.80 to 1.83. The detailed results are showed in Appendix B.
Table 1.57 The parameters of phytoplankton community at two onshore stations in rainy season and dry season
The diversity of the phytoplankton community (H(s), taxon quantity) varies considerably between the two studied stations but is similar between seasons. At station B2, both taxon quantity and the diversity index are higher than at station B3. The changing of other parameters (density, J and C) of phytoplankton is within the normal range between both stations between seasons (Table 1.57). Concerning taxon composition, for both seasons, there are 3 phyla present including Bacillariophyta, Dinophyta and Cyanophyta. The Bacillariophyta is the most diverse. It accounts for 73% and 58% of total taxons in both the dry and rainy seasons. Following these are Dianophyta and Cyanophyta (Figure 1.80 and 1.81). In regards to density composition, Bacillariophyta accounts for the largest portion, in the dry season; following which is Cyanophyta and then Dianophyata. However, in the rainy season, the highest portion belongs to Cyanophyta phylum. The portions of the others are nearly equal (see Figure 1.83).
ENVIRONMENTAL BASELINE SURVEY REPORT Page 95 of 141
FOR NGHI SON REFINERY AND PETROCHEMICAL COMPLEX Final Report
CPSE September, 2009
־ Zooplankton The summary results for the zooplankton community at two onshore stations are presented in Table 1.58 and Figures 1.84; 1.85; 1.86 and 1.87. The detail results are showed in Appendix B.
0
2
4
6
8
10
12
14
16
18
20
B2 B3
Station
Num
ber of
tax
on
BA CY DI
0
2
4
6
8
10
12
14
16
18
20
B2 B3
Station
Num
ber of
tax
on
BA CY DI
0
2000
4000
6000
8000
10000
12000
14000
16000
B2 B3
Station
Den
sity
(x10
3 cel
l/m3 )
BA CY DI
0
50
100
150
200
250
300
350
B2 B3
Station
Den
sity
(x10
3 cel
l/m3 )
BA CY DI
Figure 1.82 Density composition of each phytoplankton phylum on dry season
Figure 1.83 Density composition of each phytoplankton phylum on rainy season
Figure 1.80 Taxon composition of each phytoplankton phylum on dry season
Figure 1.81 Taxon composition of each phytoplankton phylum on rainy season
ENVIRONMENTAL BASELINE SURVEY REPORT Page 96 of 141
FOR NGHI SON REFINERY AND PETROCHEMICAL COMPLEX Final Report
CPSE September, 2009
Table 1.58 The parameters of zooplankton community at two onshore stations in rainy and dry seasons
The parameters of zooplankton community show great variation according to location and season. With the exception of density, all other indices are at relatively poor levels; especially at B2 where just one taxon is present in the rainy season. At both of the two studied stations, the density in the dry season is much higher than that in the rainy season (see Table 1.58). In regards to taxon composition, there are four groups presented including Copepoda, Ostracoda, Chaetognata and Larva. The taxon of larva group is not defined. Copepoda is predominantly present in both seasons as well as at both stations. Ostracoda is only present in the dry season while Chaetognata is only present in the rainy season (see Figure 7.2.5.5 and 7.2.5.6)
In regards to the density composition, Copepoda also represents the largest portion in the dry season and accounts for the second largest portion in the rainy season. The larva group represents the greatest portion in terms of density in both seasons. (See figure 7.2.5.7 and 7.2.5.8).
Figure 1.84 Taxon composition of each zooplankton group on dry season
Figure 1.85 Taxon composition of each zooplankton group on rainy season
ENVIRONMENTAL BASELINE SURVEY REPORT Page 97 of 141
FOR NGHI SON REFINERY AND PETROCHEMICAL COMPLEX Final Report
CPSE September, 2009
0
200
400
600
800
1000
1200
1400
1600
1800
2000
B2 B3
Station
Den
sity
(x10
3 /m3 )
CO LA OS
0
100
200
300
400
500
B2 B3
Station
Den
sity
(x10
3 /m3 )
CH CO LA
Figure 1.86 Density composition of each zooplankton group on dry season
Figure 1.87 Density composition of each zooplankton group on rainy season
ENVIRONMENTAL BASELINE SURVEY REPORT Page 98 of 141
FOR NGHI SON REFINERY AND PETROCHEMICAL COMPLEX Final Report
CPSE September, 2009
7.3 Coastal area 7.3.1 Characteristics of seabed sediment Grain size distribution in seabed sediment Grain size distribution in seabed sediment is summarized in Tables 1.59 to 1.60. A visual description of surface sediment and sampling times are detailed in Appendix A – Survey log.
Table 1.59 Summary results of grain size parameters in sediment sample – Dry season (Feb. 2009)
STATION MEAN PHI STANDARD DEVIATION
(PHI) SKEW-NESS KUR-TOSIS
% COARSE
% FINES
SORTING INDEX
SEDIMENT TYPE
VISUAL DESCRIPTION
K-7 5.11 1.89 0.59 2.49 0.00 57.63 Moderate Medium Silt Sediment was a mixture of mud and a little sand.
K-8 2.43 2.28 0.79 4.04 5.60 11.56 Poor Fine Sand Sediment was a mixture of sand and a little mud.
K-9 4.78 1.87 0.91 2.68 0.00 41.94 Moderate Coarse Silt Sediment was a mixture of mud and a little sand.
K-10 3.86 1.42 1.50 7.91 0.69 17.69 Good Very Fine Sand
There were organisms in the sediment. Sediment was a mixture of sand and mud.
K-11 5.43 1.91 0.28 2.40 0.00 68.41 Moderate Medium Silt
There were organisms in the sediment. Sediment was a mixture of sand and mud.
K-12 5.88 1.80 0.09 2.40 0.00 81.82 Moderate Medium Silt
There were organisms in the sediment. Sediment was a mixture of sand and mud.
E-1 3.21 1.40 -0.17 8.91 2.49 6.75 Good Very Fine Sand
There were shell fragments in the sediment. Sediment was a mixture of sand and a little mud.
E-18 3.74 0.95 3.28 15.69 0.00 10.62 Very Good Very Fine Sand
There were shell fragments in the sediment. Sediment was a mixture of sand and a little mud.
B-1 3.51 0.53 4.87 46.10 0.00 2.55 Very Good Very Fine Sand
There were shell fragments and bivalves in the sediment. Sediment was sand.
B-4 3.74 1.15 1.76 14.21 0.84 9.68 Good Very Fine Sand
There were shell fragments and bivalves in the sediment. Sediment was sand.
ENVIRONMENTAL BASELINE SURVEY REPORT Page 99 of 141
FOR NGHI SON REFINERY AND PETROCHEMICAL COMPLEX Final Report
CPSE September, 2009
STATION MEAN PHI STANDARD DEVIATION
(PHI) SKEW-NESS KUR-TOSIS
% COARSE
% FINES
SORTING INDEX
SEDIMENT TYPE
VISUAL DESCRIPTION
B-5 3.59 0.73 2.29 33.57 0.40 4.51 Very Good Very Fine Sand
There were shell fragments and bivalves in the sediment. Sediment was sand.
B-6 3.48 0.73 -2.22 38.94 1.23 2.42 Very Good Very Fine Sand
There were shell fragments and bivalves in the sediment. Sediment was sand.
B-7 2.06 2.30 0.43 3.17 13.26 12.81 Poor Fine Sand
There was seaweed in the sediment. Sediment was mud.
B-8 4.44 1.85 1.12 3.32 0.03 33.32 Moderate Coarse Silt Sediment was a mixture of sand and mud
B-9 6.39 1.61 -0.27 3.30 0.00 93.62 Moderate Fine Silt Sediment was a mixture of mud and a little sand
B-10 3.37 0.73 3.19 22.85 0.00 3.51 Very Good Very Fine Sand
There were shell fragments in the sediment. Sediment was sand.
There were shell fragments in the sediment. Sediment was
ENVIRONMENTAL BASELINE SURVEY REPORT Page 101 of 141
FOR NGHI SON REFINERY AND PETROCHEMICAL COMPLEX Final Report
CPSE September, 2009
STATION MEAN PHI STANDARD DEVIATION
(PHI) SKEW-NESS KUR-TOSIS
% COARSE
% FINES
SORTING INDEX
SEDIMENT TYPE
VISUAL DESCRIPTION
sand.
The sediment characteristics in the coastal area vary considerably among stations because of differences in geological characteristics. The sediment at coastal sampling stations are classified as very fine silt to fine sand in the rainy season and is classified as fine silt to fine sand in dry season. It should be noted that, dredging activities in the area of the shipping channel was observed during the dry season survey, so sediment at stations B8 and B9 seem to be finer than found in the rainy survey.
It was also recorded that sediment at station B1 is significantly different between the two sampling seasons. This may be due to the fact that stations B1 is located at the estuary of Bang River, which is noticeably effected by the current, and the weather from season to season.
THC values at the coastal sampling stations vary within a wide range in both the rainy and dry seasons (from 2 to 23 µg/g in dry season and from 2 to 32 in rainy season). All THC values are in low.
Similarly to grain size distribution, THC value at stations B8, B9 and K9 greatly differ between the rainy season and the dry season because of the deredging activities in the area of the shipping channel are observed in dry survey.
All CPI values (Carbon Preference Index) are higher in both the rainy and dry seasons. This corresponds to odd chain length n-alkanes predominating in comparison with even chain lengths. This is a feature of the hydrocarbon distributions found in plants and other biological compounds. Non-petrogenic hydrocarbons contribute a given proportion in the total hydrocarbon compositions.
Figure 1.90 Variation of THC content at coastal sampling stations Metals in sediment Analytical results of metals in sediment are summarized in Tables 1.63 and 1.64.
Table 1.63 Summary results of metals in sediment samples – Dry season (Feb. 2009)
Among selected metals, Cd and V are found at lower than the detection limit of the AAS method. Metal content is not much changed from season to season for most of coastal sampling stations accept at stations B8, B9 where deredging activities were observed during the dry season survey.
ENVIRONMENTAL BASELINE SURVEY REPORT Page 105 of 141
FOR NGHI SON REFINERY AND PETROCHEMICAL COMPLEX Final Report
Figure 1.95 Variation of Hg content at coastal sampling stations
7.3.2 Characteristic of macrobenthic community The summary result for the macrobenthos community at coastal stations are presented in Table 1.65 and Figures 1.96 to 1.101. The detailed results are shown in Appendix B.
ENVIRONMENTAL BASELINE SURVEY REPORT Page 107 of 141
FOR NGHI SON REFINERY AND PETROCHEMICAL COMPLEX Final Report
CPSE September, 2009
Table 1.65 The parameters of macrobenthos community at two onshore stations in rainy season and dry season
Station Taxon quantity
(taxa/0.3m2) Density (ind./m2) Biomass (g/m2) H(s) J C
The parameters for the macrobenthos community at the stations in the coastal area differ among stations as well as between stations. On average, however, almost all parameters (except biomass and density) are similar between seasons. At some stations such as B5, B6, B7, B10, the community parameters are at poor levels. However, at other stations such as K8, K11, K12 the parameters are at good levels. Density and biomass are are the parameters which show the greatest variation between sampling stations as well as between seasons (see Table 1.65). At stations B10, B5, B4 and especially at B6, density and biomass are elevated due to the strong development one mollusk species. Regarding the composition, there are 4 groups including Polychaeta, Crustacean, Mollusca and Echinodermata in which, Polychaeta represents the largest portion in terms of taxon quantity, followed by Crustacean, Mollusca and Echinodermata; the Mollusca group represents the largest portion of density as well as biomass, with other groups similar in terms of taxon quantity (Figure 1.96 to 1.101).
ENVIRONMENTAL BASELINE SURVEY REPORT Page 108 of 141
FOR NGHI SON REFINERY AND PETROCHEMICAL COMPLEX Final Report
CPSE September, 2009
0
2000
4000
6000
8000
10000
12000
B1
B4
B5
B6
B7
B8
B9
B10
B11 K7
K8
K9
K10
K11
K12 E1
E18
Station
Den
sity
(Ind
./m2 )
CR EC MO PO
0
2000
4000
6000
8000
10000
12000
B1
B4
B5
B6
B7
B8
B9
B10
B11 K7
K8
K9
K10
K11
K12 E1
E18
Station
Den
sity
(Ind
./m2 )
CR EC MO PO
Figure 1.96 Density portion of each group of zooplanton on dry season
Figure 1.97 Density portion of each group of zooplankton on rainy season
Figure 1.98 Density portion of each group of zooplanton on dry season
Figure 1.99 Density portion of each group of zooplankton on rainy season
0
10
20
30
40
50
60
70
B1
B4
B5
B6
B7
B8
B9
B1
0
B1
1
K7
K8
K9
K1
0
K1
1
K1
2
E1
E1
8
Station
Num
ber
of t
axon
CR EC MO PO
0
10
20
30
40
50
60
70
B1
B4
B5
B6
B7
B8
B9
B10
B11 K
7
K8
K9
K10
K11
K12 E
1
E18
Station
Num
ber
of t
axon
CR EC MO PO
ENVIRONMENTAL BASELINE SURVEY REPORT Page 109 of 141
FOR NGHI SON REFINERY AND PETROCHEMICAL COMPLEX Final Report
CPSE September, 2009
7.3.3 Physical-chemical characteristics of surface water The sea water analytical results are presented in Tables 1.66 to 1.71.
Table 1.66 Analytical results of physical characteristics of seawater – Dry season (Feb., 2009)
In-situ measurement
No. Samples pH DO (mg/l)
Salinity (‰)
Temp. (oC)
1 K - 7.1 7.6 5.6 32.9 24.1 2 K - 7.2 7.5 5.4 32.8 24.2
Average 7.5 5.5 32.9 24.1 3 K - 8.1 7.9 5.7 32.4 24.3 4 K - 8.2 7.7 5.3 32.6 24.5
Average 7.8 5.5 32.5 24.4 5 K - 9.1 7.8 5.7 32.3 24.3 6 K - 9.2 7.7 5.4 32.2 24.4
Average 7.7 5.6 32.3 24.4 7 K - 10.1 7.6 6.0 32.3 24.1 8 K - 10.2 7.8 6.0 32.1 24.3
Average 7.7 6.0 32.3 24.2 9 K - 11.1 7.6 5.6 32.5 24.6 10 K - 11.2 7.5 5.6 32.4 24.3
Average 7.5 5.6 32.5 24.5 11 K - 12.1 7.7 6.0 33.1 24.1 12 K - 12.2 7.8 5.9 32.6 24.2
0
100
200
300
400
500
600
700
B1
B4
B5
B6
B7
B8
B9
B1
0
B1
1
K7
K8
K9
K1
0
K1
1
K1
2
E1
E1
8
Bio
mas
s (In
d./m
2 )
Station
CR EC MO PO
0
50
100
150
200
250
300
350
Station
Bio
mas
s (In
d./m
2 )
CR EC MO PO
Figure 1.100 Density portion of each group of zooplanton on dry season
Figure 1.101 Density portion of each group of zooplankton on rainy season
ENVIRONMENTAL BASELINE SURVEY REPORT Page 110 of 141
FOR NGHI SON REFINERY AND PETROCHEMICAL COMPLEX Final Report
CPSE September, 2009
In-situ measurement No. Samples
pH DO (mg/l) Salinity
(‰) Temp.
(oC) Average 7.7 6.0 32.9 24.2
13 E - 1.1 7.7 5.6 33 25 14 E - 1.2 7.6 5.8 33 25
Average 7.7 5.7 33 25 15 E - 18.1 7.7 5.9 33 25 16 E - 18.2 7.5 5.2 32 24
Average 7.6 5.6 33 25 17 B - 1.1 7.8 - 31 23 18 B - 1.2 7.7 - 32 23
Average 7.8 - 31 23 19 B - 4.1 7.8 - 32 22 20 B - 4.2 7.8 - 32 23
Average 7.8 - 32 22 21 B - 5.1 7.7 - 32 22 22 B - 5.2 7.8 - 32 23
Average 7.8 - 32 23 23 B - 6.1 7.7 - 32 23 24 B - 6.2 7.7 - 32 23
Average 7.7 - 32 23 25 B - 7.1 7.7 - 28 22 26 B - 7.2 7.7 - 29 22
Average 7.7 - 29 22 27 B - 8.1 7.8 - 33 25 28 B - 8.2 7.8 - 33 24
Average 7.8 - 33 24 29 B - 9.1 7.8 - 33 25 30 B - 9.2 7.8 - 33 24
Average 7.8 - 33 24 31 B - 10.1 7.8 - 32 24 32 B - 10.2 7.8 - 33 23
Average 7.8 - 33 23 33 B - 11.1 7.8 - 32 24 34 B - 11.2 7.8 - 32 23
In general, most analytical results of surface water are quite good and lower than allowable limits stipulated in QCVN 10:2008/BTNMT and Equator Principles. Phenol, Benzene, CN- and some heavy metal contents are found at levels under the detection limit of the analytical methods used. The parameters of pH, Temperature, Salinity, Dissolved Oxygen are stable between stations as well asbetween sampling seasons. At some stations, which are located very close to the onshore area, especially at the station B7, because the surface layer has a lot of algae, a phenomenon occurs that slightly increases the values of the parameters BOD, NH4 +, total nitrogen, and TOC levels in the rainy season.
Figure 1.116 Variation of COD content at coastal sampling stations 7.3.4 Plankton
Phytoplankton The summary result for the phytoplankton community at coastal stations are presented in Table 1.72 and Figures 1.117; 1.118; 1.119 and 1.120. The detailed results are showed in Appendix B.
Table 1.72 The parameters of phytoplankton community at coastal stations in rainy season and dry season
Variation of taxon quantity is rather great, especially in the rainy season. The number of taxon also vary greatly among studied stations; in the rainy season, there are two stations (B11 and B7) where the number of taxon is strongly reduced; and several stations where the taxon quantity is increased such as B5, B8 (see Table 1.72). The density recoded in the dry season is about a thousand times higher that in the rainy season. The extremely high density of phytoplankton in the dry season when the average value is about one billion cells/m3 is caused by the strong development of algae species named Pseudonitzschia sp. (Bacillariophyta), and leads to the high density in this area. Accordingly the Bacillariophyta group accounted for the greatest density at all stations. Dinophyta accounts for a very small portion of the density. The relative portion of the densityaccounted for by other species worthies insignificant at all sampling stations (Figure 1.117 and 1.118). As a consequence of the abnormal development of a single species of algae, in the dry season the predominant index is very high while the evenness index and diversity indices are very low. This phenomenon may be related to the concentration of Nitrogen and Phosphorus recorded in the dry season, for the same reason given for the offshore stations section (Table 7.3.4.1).
Figure 1.117 Taxon composition of each phytoplankton group on dry season
Figure 1.118 Taxon composition of each phytoplankton group on rainy season
Environmental baseline survey for project of Nghi Son Refinery and Petrochemical Plant Final report
CPSE September, 2009
Zooplankton The summary results for the zooplankton community at coastal stations are presented in Table 1.73 and Figures 1.121 to 1.124. The detailed results are shown in Appendix B.
Table 1.73 The parameters of zooplankton community at coastal studied stations in rainy season and dry season
The parameters for the zooplankton community vary considerably among the sapling stations as well as between seasons. Generally, the zooplankton community is relatively diverse and even particularly in the dry season. The number of taxon, density as well as H(s) recorded in the dry season is higher than that in the rainy season at almost stations. Regarding taxon distribution and composition, there were a total of 10 groups classified, in which Copepoda accounts for over 75% in both seasons however the relative portion also varies strongly among stations. Cladocera is quite common and even among studied stations in the dry season but it is not common in the rainy season. On the contrary, Chaetognata was more common in the dry season but was also present at several stations in the rainy season. The portion of other groups varied considerably between seasons. Concerning density distribution composition, total density as well as density of each group varied greatly among stations, especially in the rainy season, Copepoda, the group accounts for almost density in the dry season, and accounts for a small portion at several stations in the rainy season. The Larva group, also accounts for a large portion at almost stations.
0
5
10
15
20
25
30
35
40
45
Station
Num
ber o
f tax
on
AM CH CL CO DEIN OS PO PT&HE TU
0
5
10
15
20
25
30
35
Station
Num
ber o
f tax
on
AM CH CL CO DE
OS PO PT&HE TU
Figure 1.121 Taxon composition of each phytoplanton group on dry season
Figure 1.122 Taxon portion of each group of zooplankton on rainy season
Environmental baseline survey for project of Nghi Son Refinery and Petrochemical Plant Final report
CPSE September, 2009
0
5000
10000
15000
20000
25000
B1
B4
B5
B6
B7
B8
B9
B10
B11 K7
K8
K9
K10
K11
K12 E
1
E18
Station
Den
sity
(x10
3 /m3 )
AM CH CL CO DE IN LA OS PT&HE PO TU
0
1000
2000
3000
4000
5000
6000
B1
B4
B5
B6
B7
B8
B9
B10
B11 K7
K8
K9
K10
K11
K12 E
1
E18
Station
Den
sity
(x10
3 /m3 )
AM CH CL CO DE LA OS PO PT&HE TU
Figure 1.123 Density portion of each group of zooplanton on dry season
Figure 1.124 Density portion of each group of zooplankton on rainy season
Environmental baseline survey for project of Nghi Son Refinery and Petrochemical Plant Final report
CPSE September, 2009
8. CONCLUSION 8.1 Offshore area
The seabed sediments at studied areas are fairly different from station to station due to differences in geological characteristics. The seabed sediments at all sampling stations are classified from medium silt to coarse sand. Mean phi ranges in a wide range (from -0.05 to 6.40 in rainy season and from 0.15 to 6.39 in dry season).
At stations K1 to K4, E6, E7, E9, E12, E14 and E23, mean phi and fine content values are
significantly different between the rainy and the dry seasons. It may be due to the fact that geological characteristics at Nghi Son gulf are not homogeneous.
THC values at offshore sampling stations are at low levels and vary in a narrow range in both the
rainy and dry seasons (from 1 to 6 µg/g in dry season and from 2 to 13 in rainy season). Nonpetrogenic hydrocarbon took larger proportion than petrogenic hydrocarbon.
Similar to grain size distribution, THC values at stations K3, E3, E4, E8, E9, E12, E14, E15 and
E24 are changed from season to season. It is evident that, THC and metals values seem to be higher where the sediment is finer.
Metals selected to be analyzed in both the dry and rainy season surveys are Cu, Pb, Zn, Cd, Cr, V
and Hg. Among those metals, Cd and V are found at levels lower than the detection limit of AAS method.
At stations E7, E9 and E24 there is noticeable variation in content of the rest metals (Cu, Pb, Zn,
Cr and Hg) between the rainy and dry seasons. At other stations, these values change in a narrow range among stations as well as between seasons.
Although, the macrobenthos community distributes more evenly on offshore area in comparison to the coastal and onshore areas, some community parameters such as density, biomass also fluctuates strongly among stations as well as between stations. Almost all remaining parameters (except biomass and density) are similar between two seasons and their values are at good levels.
In the surveys of the rainy as well as the dry season, all physio-chemical parameters of sea water
were lower than the limit values of QCVN 10:2008/BTNMT. Among the seven analyzed trace heavy metals, four metals were below the detection limits of the analytical methods used (Cu, Cd, Cr and Hg). Other metals were also found in very low content at offshore sampling stations in both the rainy and dry seasons.
The phytoplanton community in the studied area is not very diverse or even especially in the dry
season, although the number of taxon recorded in the dry season was higher than that in the rainy season. As noted in the previous sections, the poor results for thePhytoplankton community is caused by the strong development of one algae species consider as blooming.
In the dry season, in consequence of the blooming of one algae species, all community indices
are at poor levels. The diversity index -H(s) and the Evenness index –J are low while the predominance index is high at almost stations. At station E14, this phenomenon is not recorded. On the contrary, all community indices are within normal levels in the rainy season.
Environmental baseline survey for project of Nghi Son Refinery and Petrochemical Plant Final report
CPSE September, 2009
In both the rainy and dry seasons, most of the zooplankton community indices were at relatively
good levels. 8.2.1 Onshore area
In both the dry and rainy seasons, all parameters of ambient air quality were recorded at normal levels and lower than the allowable limits stipulated in TCVN as well as in Equator principles.
In general, noise values at residential area in the dry and rainy seasons (except at station A6)
were lower than the limit levels of Project Noise Standards. The noise values of station A6 in shift 1 (6am-6pm) and shift 3 (10pm-6am) were higher than the limit levels due to this station being located near the road with a lot of traffic.
The values of vibration at the residential area were lower than the limit level stipulated by the
Vietnamese standard (TCVN 6962:2001). As well as noise, vibration values in the dry season were not considerably different from the ones in the rainy season.
At plan area, except N2, N5 and N16, the noise values at other stations were lower than the limit
level of 70dB referred to in the Project Noise Standards and these values in the dry season did not vary from the ones in the rainy season.
All vibration values at plan area are lower than the limit level stipulated in the Vietnamese
standard (TCVN 6962:2001). At all stations, the disparity of vibration values between the dry and rainy season were not noticeable.
There is little difference in noise values as well as vibration values among measured times (1-
hour, 5 – hours and 24 – hours)
It is noted that, sediment at station B2 in the rainy season is coarser than that in dry season. By visual observation, in the dry season the environmental status at station B2 is contaminated because of many waste sources.
Similar to variation of grain size, total hydrocarbon contents in sediment at station B2 in the dry
season is much higher than that in the rainy season due to the difference of seasons.
Total hydrocarbon contents of soil at sampling stations changed in a wide range (from 3 to 84µg/g in dry season and from 1 to 219µg/g in rainy season). The highest values was recorded at station D7 located at Nghi Son fishing village.
At all onshore stations, metal contents in the sediment were at normal levels in both seasons.
Except for Hg content, metal contents in soil also fluctuated in narrow range in both seasons.
It was noted that the macrobenthos community is much different in number of taxon, density as
well as biomass. It is high or low depends on the sampling location as well as the sampling season. The community indices were similar between seasons.
All analytical results of surface water in both of two seasons are quite good and lower than
allowable limits stipulated in QCVN 08:2008/BTNMT.
Environmental baseline survey for project of Nghi Son Refinery and Petrochemical Plant Final report
CPSE September, 2009
In the rainy season as well as in the dry season, most analytical results of ground water are quite
good and lower than the allowable limit of QCVN 09 : 2008/BTNMT, except coliform (at all of stations) and Mn (at station G-3) in ground water which both exceeded the allowable limit. In both seasons, except the station G-1, which is shallow; the water of the well is turbid and is yellow in color. At all remaining stations, the water of the wells was clear and colorless.
It worth noting that density strongly changes between seasons as well between stations. It is very
high in the dry season, especially at station B3; but it is low in the rainy season.
The diversity of the phytoplankton community is rather different between the two studied stations but similar between seasons. At station B2, both of taxon quantity and diversity index are higher than that at station B3.
The changing of other parameters of phytoplankton is within the normal range between \stations
as well as between seasons.
The parameters for the zooplankton community vary considerably with location and season. Except for density, all other indices are at relatively poor levels; especially at B2 where just one taxon is present in the rainy season. At both of the studied stations, the density in the dry season is much higher than that in the rainy season. This phenomenon could be a result of nutritive in water.
8.3 Coastal area
The sediment characteristics in the coastal area vary considerably among stations because of the
difference in geological characteristics. Sediment at coastal sampling stations are classified as very fine silt to fine sand in the rainy season and classified as fine silt to fine sand in the dry season. It is noted that, the dredging activity at areas of the shipping channel were observed during the dry survey, so, sediment at stations B8 and B9 seems to be finer than that of the rainy season survey.
It was also noted that sediment at station B1 significantly changes between two sampling
seasons. It may be due to stations B1 located at the estuary of Bang River, which is noticeably affected by current, and weather from season to season.
THC values at coastal sampling stations vary in a wide range in both the rainy and dry seasons
(from 2 to 23 µg/g in dry season and from 2 to 32 in rainy season).
Similar to grain size distribution, THC values at stations B8, B9 and K9 varied greatly from rainy season to dry season because of the dredging activities in areas of the shipping channel during the dry survey.
Metals content did not vary greatly from season to season at most of coastal sampling stations
accept at stations B8, B9 where dredging activities were observed during the dry survey.
The parameters of the macrobenthos community recorded at the stations in the coastal area also varies greatly among stations as well as between stations. On average, however, almost all parameters (except biomass and density) are similar between seasons. At some stations such as
Environmental baseline survey for project of Nghi Son Refinery and Petrochemical Plant Final report
CPSE September, 2009
B5, B6, B7, B10.., the community parameters are poor levels. However, at some other stations such as K8, K11, K12… the parameters were in good levels. Density and biomass are two items that change the most among sampling stations as well as between seasons.
In general, most analytical results related to the surface water are quite good and show levels
lower than the allowable limits stipulated in QCVN 10:2008/BTNMT and Equator Principles.
In regards to the phytoplankton community, the variation of taxon quantity is rather great, especially in the rainy season. The number of taxon are also different among studied stations; in the rainy season, there are two stations (B11 and B7) where the number of taxon is strongly reduced; and several stations where the taxon quantity is increased such as B5, B8.
As a consequence of the abnormal development of one algae species, in the dry season the
predominance index was very high while the evenness and diversity indices were very low. This phenomenon was not recorded in rainy season
The parameters of the zooplankton community varied considerably among sampling stations as
well as between seasons. Generally, the zooplankton community was relatively diverse and even especially in the dry season. The number of taxon, density as well as H(s) recorded in the dry season was higher than that in the rainy season at almost stations.
Environmental baseline survey for project of Nghi Son Refinery and Petrochemical Plant Final report
CPSE September, 2009
9. REFERENCES 1. Adlard, E.R. 1972. Identification of hydrocarbon pollution on seas and beaches by gas chromatography. Analytical Chemistry, Vol. 44, No. 1, Jan. 1972.
2. Auris Environmental 1981. Monitoring hydrocarbon in the marine Environment, Dec. 1981.
3. Auris Environmental 1992. Characterization of the marine sediment around the Clyde platform, Central North Sea, Sep. 1992.
4. Boothe P. N. and Prespley B.J. 1996. Trends in Sediment Trace Element Concentrations around Six Petroleum Drilling Platforms in the Northewestern Gulf of Mexico.
5. Briton E. 1975. Scientific results of marine investigations of the South China-Sea and the Gulf of Thailand 1959-1961. NAGA 1975, volume 4, part. 5.
6. Edward A. 1988. Geochemistry.
7. Institute of Offshore Engineering 1985. Benthic Environmental Baseline Survey of Clyde Oil field, July 1985.
8. Lewis, D.W. 1989. Practical Sedimentology, New York.
9. Nguyễn Ngọc Kiểng 1996. Thống Kê Trong Nghiên Cứu Khoa Học, Nhà Xuất Bản Giáo Dục.
10. PetroVietnam 2001. Guidelines for monitoring of the marine environment in the vicinity of offshore petroleum installation in Vietnam.
12. Vietnam nation environment agency NEA 2000. CD-ROM Atlas environment of Vietnam regions, version 1.0.
13. Vietnam Standard TCVN 5943-1995: Water quality-Coastal water quality standard, Ha Noi-1995.
14. Vietnam Standard TCVN 5944-1995: Water quality-Ground water quality standard, Ha Noi-1995.
15. Vietnam Standard TCVN 5945-2005: Industrial waste water – discharge standards, Ha Noi-2005.
16. Vietnam Standard TCVN 5937-2005: Air quality Ambient Air quality Standards, Ha Noi-2005.
17. Vietnam Standard TCVN 5938-2005: Air quality – Maximum allowable concentration of hazardours substances in ambient air. Ha Noi-2005.
18. Vietnam Standard TCVN 5949-1998: Acoustics - Noise in public places and populated areas - Permitted maximum noise level. Ha Noi-1998.
19. Vietnam Standard TCVN 6962-2001: Vibrations and seismism - Vibrations caused by construction and industrial production activities - Permitted maximum levels for the environment of public places and populated areas, Ha Noi-2001.
Environmental baseline survey for project of Nghi Son Refinery and Petrochemical Plant Final report
CPSE September, 2009
20. Barnes, 1963.Invertebrate Zoology. W. B. Saunders Company.
21. Chinese Crustacean Society. Transactions of the Chinese Crustacean Society, No. 3, 1992. Qingdao Ocean University Press.
23. DNV consulting, 2006. Environmental Monitoring Region I, 2005, Main Report 2006-0187 (rev 1) – BP Norge AS.
24. Kristian Fauchald, 1977. The Polychaete Worms Definitions and Keys to the Orders, Families and Genera. Chapman’s Phototypesetting.
25. Mary J. Rathbun, 1910. The Danish Expedition to Siam 1899 – 1900, V. Brachyura. KOBENHAVN.
26. NAGA, 1967. Scientific Results of Marine Investigations of the South China Sea and the Gulf of Thailand 1959 – 1961. NAGA report vol 4, part 3.
27. Pierre Fauvel, 1953. The Fauna of India – including Pakistan, Ceylon, Burma and Malaya – Annelida, Polychaeta. The Indian Press, Ltd.
28. Sadayoshi Miyake, 1998. Japanese Crustacean Decapods and Stomatopods in Color, vol. I – Macrura, Anomura and Stomatopoda. Hoikusha Publishing Co., LTD.
29. [1] Sadayoshi Miyake, 1998. Japanese Crustacean Decapods and Stomatopods in Color, vol. II – Brachyura (Crabs). Hoikusha Publishing Co., LTD.
30. [2] Maier, J; Mc Connel, H.L; J. Water pollut. Cont. Fedn. 1974, 46, 623.
31. [3] Pedro Sergio Fadini, Wilson F. Jardim, Jose Roberto Guimaraes, 2004. Evaluation of Organic Load Measurement Techniques in Sewage and Waste Stabilisation Pond.
32. QCVN 08 : 2008/BTNMT-National technical regulation on surface water quality, Ha Noi-2008.
33. QCVN 09 : 2008/BTNMT-National technical regulation on underground water quality, Ha Noi-2008.
34. QCVN 10 : 2008/BTNMT-National technical regulation on coastal water quality, Ha Noi-2008
APPENDIX II
EMISSION MODELING RESULTS FOR COMBINED CASES OF 19 STACKS AND FLARE IN
NORMAL OPERATION AND EMERGENCY CASE
- 1 -
Figure II-1 Maximum hourly SO2 concentration in g/m3 – All sources
Figure II-2 Maximum hourly SO2 concentration in g/m3 – All sources
- 2 -
Figure II-3 Maximum 24hr SO2 concentration in g/m3 – All sources
Figure II-4 Maximum 24hr SO2 concentration in g/m3 – All sources
- 3 -
Figure II-5 Maximum Annual SO2 concentration in g/m3 – All sources
Figure II-6 Maximum Annual SO2 concentration in g/m3 – All sources
- 4 -
Figure II-7 Maximum hourly SOX concentration in g/m3 – All sources
Figure II-8 Maximum hourly SOX concentration in g/m3 – All sources
- 5 -
Figure II-9 Maximum 24hr NOX concentration in g/m3 – All sources
Figure II-10 Maximum 24hr NOX concentration in g/m3 – All sources
- 6 -
Figure II-11 Maximum annual NOX concentration in g/m3 – All sources
Figure II-12 Maximum annual NOX concentration in g/m3 – All sources
- 7 -
Figure II-13 Maximum hourly CO concentration in g/m3 – All sources
Figure II-14 Maximum hourly CO concentration in g/m3 – All sources
- 8 -
Figure II-15 Maximum 8hr CO concentration in g/m3 – All sources
Figure II-16 Maximum 8hr CO concentration in g/m3 – All sources
- 9 -
Figure II-17 Maximum 24hr CO concentration in g/m3 – All sources
Figure II-18 Maximum 24hr CO concentration in g/m3 – All sources
- 10 -
Figure II-19 Maximum 24hr PM10 concentration in g/m3 – All sources
Figure II-20 Maximum 24hr PM10 concentration in g/m3 – All sources
- 11 -
Figure II-21 Maximum annual PM10 concentration in g/m3 – All sources
Figure II-22 Maximum annual PM10 concentration in g/m3 – All sources
- 12 -
Figure II-23 Maximum hourly NOx concentration in g/m3
Emergency Unlit HC Flare
Figure II-24 Maximum hourly NOx concentration in g/m3 Emergency Unlit HC Flare
- 13 -
Figure II-25 Maximum hourly NOx concentration in g/m3 HC Purge gas Flare Max. H2S
Figure II-26 Maximum hourly NOx concentration in g/m3 HC Purge gas Flare Max. H2S
- 14 -
Figure IV-27 Maximum hourly CO concentration in g/m3 Emergency Unlit HC Flare
Figure II-28 Maximum hourly CO concentration in g/m3 Emergency Unlit HC Flare
- 15 -
Figure II-29 Maximum hourly CO concentration in g/m3 HC Purge Gas Flare Max. H2S
Figure II-30 Maximum hourly CO concentration in g/m3 HC Purge Gas Flare Max. H2S
- 16 -
Figure II-31 Maximum hourly SO2 concentration in g/m3 Emergency HC Purge Gas Flare Max. H2S
Figure II-32 Maximum hourly SO2 concentration in g/m3