Husky Energy White Rose Extension Project Environmental Assessment Report December 2012 Review Comments March 15, 2013 Page 1 of 68 Environment Canada Chapter 2 Project Description 2.3.2.2 Evaluation of Material Disposal Options Will there be any discharges of deleterious substances to receiving waters? 2.6.2 On-Land Construction What will be the standards used for sewage treatment? 2.6.3.1 Excavation Quote: “Site surface water and groundwater from any dewatering of the graving dock will be collected, assessed and, if necessary, held in an engineered lined settling pond onsite to satisfy all regulatory requirements before being discharged into the marine environment.” Are the regulatory standards both federal and provincial? 2.6.3.4 Site Dewatering and Disposal Quote: “Water will be treated with a mobile treatment unit as required prior to discharge to ensure compliance with provincial and federal requirements.” Confirm that these standards will be used for site surface water and groundwater as above. Chapter 3 Summary of White Rose Extension Project Specific Models General: The document did not reference the regular tanker traffic associated with the Come-by- Chance refinery. Nearshore Project Area will transect the shipping lanes for these oil tankers. What protocols will be developed to allow the safe coordination of project activities with tanker traffic in the dredging, module mating, and transportation to White Rose drilling site phases? Given weather conditions, navigational challenges, length of time required for project phases and the nature of all the vessels involved, there could be potential for close manoeuvring between vessels, which should be considered in the context of the assessment. Nearshore work could involve the use of heavy lift vessels, supply vessels, tugs, as well as on- shore large construction equipment. The nearshore spill modeling considered fuel spills ranging from 100 to 350 m 3 . Supply vessels can have a capacity of over 1100 m 3 of fuel and, in the event of collision, could lose more than 350 m 3 . It may be useful to run nearshore scenarios with expanded fuel capacity reflecting what is carried in larger vessels. Again, for nearshore work, it may be useful to examine the potential for spills in the land- water interface (e.g., heavy equipment upset into a water body; puncturing of an onshore fuel tank that could spill into a water body). Planning could include placing in local inventory the material and equipment needed to deploy a boom from land to contain a water-borne slick, as well as having appropriately trained personnel.
Transcript
Husky Energy White Rose Extension Project Environmental Assessment Report
December 2012
Review Comments March 15, 2013 Page 1 of 68
Environment Canada
Chapter 2 Project Description
2.3.2.2 Evaluation of Material Disposal Options
Will there be any discharges of deleterious substances to receiving waters?
2.6.2 On-Land Construction
What will be the standards used for sewage treatment?
2.6.3.1 Excavation
Quote: “Site surface water and groundwater from any dewatering of the graving dock will be
collected, assessed and, if necessary, held in an engineered lined settling pond onsite to satisfy
all regulatory requirements before being discharged into the marine environment.”
Are the regulatory standards both federal and provincial?
2.6.3.4 Site Dewatering and Disposal
Quote: “Water will be treated with a mobile treatment unit as required prior to discharge to
ensure compliance with provincial and federal requirements.”
Confirm that these standards will be used for site surface water and groundwater as above.
Chapter 3 Summary of White Rose Extension Project Specific Models
General:
The document did not reference the regular tanker traffic associated with the Come-by-
Chance refinery. Nearshore Project Area will transect the shipping lanes for these oil tankers.
What protocols will be developed to allow the safe coordination of project activities with
tanker traffic in the dredging, module mating, and transportation to White Rose drilling site
phases? Given weather conditions, navigational challenges, length of time required for project
phases and the nature of all the vessels involved, there could be potential for close
manoeuvring between vessels, which should be considered in the context of the assessment.
Nearshore work could involve the use of heavy lift vessels, supply vessels, tugs, as well as on-
shore large construction equipment. The nearshore spill modeling considered fuel spills
ranging from 100 to 350 m3. Supply vessels can have a capacity of over 1100 m
3 of fuel and,
in the event of collision, could lose more than 350 m3. It may be useful to run nearshore
scenarios with expanded fuel capacity reflecting what is carried in larger vessels.
Again, for nearshore work, it may be useful to examine the potential for spills in the land-
water interface (e.g., heavy equipment upset into a water body; puncturing of an onshore fuel
tank that could spill into a water body). Planning could include placing in local inventory the
material and equipment needed to deploy a boom from land to contain a water-borne slick, as
well as having appropriately trained personnel.
Husky Energy White Rose Extension Project Environmental Assessment Report
December 2012
Review Comments March 15, 2013 Page 2 of 68
3.6 Hydrocarbon Spill Probabilities
In general, this section is difficult to follow. Some of the sources and information used are
fairly dated (e.g., NAS 2000; Scandpower 2000). It might also be useful to change the format
of the section so that calculations are done in an equation format with corresponding data
tables reflecting the results of those calculations. In the discussion, it would also be useful to
indicate which calculations were used to derive the spill probability for the White Rose
Expansion Project.
3.6.1.1 Blowouts During Drilling
Quote: “Up to 2011, four development-drilling blowouts have produced spills in the very
large spill category (Table 3-48, including the recent incident in Australia, and including the
spill in the extremely large category).”
Unclear. The description could be reworded to something like, “From Table 3-48, there are
four large spills from development well blowouts, giving a spill frequency of (4/67,703) x 5.9
x 10-5
/ well drilled = 1 spill / 17,000 wells drilled.”
3.6.1.2 Blowouts During Production and Workovers
Quote: “…it is estimated that the total oil produced offshore on a worldwide basis up to 2011
has been approximately 210 billion bbl, and that the total producing oil well-years has been
350,000 well-years… On this basis, the world-wide frequency of extremely large hydrocarbon
spills from oil-well blowouts that occurred during production or workovers is 5.7 X 10⁻⁶
blowouts/well-year. For very large, the number is 1.4X10⁻⁵
blowouts/well-year.”
In recent decades, there has been an increasing move to explore and exploit hydrocarbon
reserves that had been previously less accessible, or even inaccessible, given technologies
available at the time. With the move to exploration in less hospitable frontiers, there would
seem to be greater risk for spills from blowouts posed by environmental and geological
conditions. These differences could be statistically smoothed by looking at the longer term
drilling record. Perhaps the reference cited (Deloitte Petroleum Services. 2012. List of
Offshore Petroleum Wells to December 31, 2011. Report generated on request from Deloitte
LLP. London, England) discussed this aspect -- it would be informative if this was addressed
in looking at exploration that has occurred in more challenging environments, which could
have an impact on the calculated probabilities.
3.6.1.3 Summary of Extremely Large and Very Large Oil Spills from Blowouts
Quote: “…the Ixtoc l oil-well blowout ... was caused by drilling procedures (used by
PEMEX, …) that are not practised in US or Canadian waters and that are contrary to US or
Canadian regulations and to the accepted practices within the international oil and gas
industry. Therefore, extremely large spill frequencies in North America are expected to be
even lower.”
A few points to consider:
Mexico is part of North America;
the Macondo blow-out in the Gulf of Mexico occurred partly due to “… BP,
Transocean, and Halliburton’s conduct violated federal offshore safety regulations
Husky Energy White Rose Extension Project Environmental Assessment Report
December 2012
Review Comments March 15, 2013 Page 3 of 68
under BOEMRE’s jurisdiction… “ and poor risk management (Oil and Gas Journal,
Sept. 14, 2011);
there are different regulations in the US and Canada (e.g., 3.6.2.1 Shallow Gas versus
Deep-well Blowout, Page 3-63 indicates that Canada requires two barriers in
exploration and development, while only one is required in the US); and
Quote: “…extremely large spill frequencies in North America are expected to be even
lower” is a conclusion that could be modified based on the above.
3.6.2.1 Shallow Gas versus Deep-well Blowout
Blowout stats are derived from Scandpower (Scandpower A/S 2000. Blowout Frequencies
2000, BlowFAM Edition. Report No. 27.20.01/R3.). While very informative, it would be good
to have stats up to 2013, given the significant blowouts that have occurred since 2000 (e.g.,
Deep Water Horizon in the Gulf of Mexico (2010) and the Montara spill off the west coast of
Australia (2009)). These occurrences would not have been included in the other document
cited (IAOGP 2010) since statistics quoted are up to 2005.
Quote: “Finally, it is worth noting (Table 3-52) that shallow gas blowout frequencies in the
North Sea and in the US GOM have been on the decline in the most recent years of the
record.”
This is based on a period up to 1997 – 16 years ago. It would be good to determine if data are
available to the present to indicate whether that trend has changed.
3.6.3 Large Platform Spills
Quote (P. 3-65, para. 2): “BOEMRE statisticians … have decreased the estimate gradually
over the past 15 years, mostly in recognition of a statistical trend towards a lower spill
frequency.”
What is the lower value? For what year?
Quote (P. 3-65, para. 4): “Note that the above statistic for spills >10,000 bbl (i.e. 5.5 x 10⁻⁶
spills/well-year) is almost four times smaller than the statistic derived earlier for production
blowout spills >10,000 bbl (i.e. 2.0 x 10⁻⁵
). This is impossible because the first category
includes blowout spills. The reason for the anomaly is that the US record was used for the
former and the world-wide record was used for the latter. The world-wide statistic is higher
than the US-derived one because the former was developed on a very conservative basis,
which considered an exposure of only oil wells and not gas wells.”
This paragraph is unclear, please clarify which probability is going to be used and why.
Quote: “It is noted that there has been … Given the limited statistical database of
Newfoundland and Labrador production operations, the US statistics are used in this
frequency calculation.”
Is it because of similar geologic and marine conditions? Are there greater similarities with
North Sea operations?
Husky Energy White Rose Extension Project Environmental Assessment Report
December 2012
Review Comments March 15, 2013 Page 4 of 68
3.6.6 Summary of Blowout and Spill Frequencies
Quote (P. 3-68, last para.): “…0.5 and 0.2, respectively.”
Are those values percentages?
3.7 Fate and Behavior of Hydrocarbon Spills in the Nearshore Study Area (Trajectory
Modelling) and 3.8 Fate and Behavior of Hydrocarbon Spills from a Platform or
Seafloor Blow-out in the Offshore Study Area (Trajectory Modelling)
Please see the attached report “Review of Husky Energy Proposal for The White Rose
Extension Project Oil Spill Aspects” by Dr. Merv Fingas.
In general, Environment Canada is in agreement with the proponent’s findings with some
differences in direction due to differences in winds and currents utilized (the EC modelling
was done in stochastic mode with winds from CMC and currents from DFO). The persistence
of the oils differed somewhat, with the proponent overestimating dispersion. In the EC
modelling, there were a few cases where oil impacted the shorelines in Placentia Bay and the
movement was consistently to the south, driven by NE winds. In contrast, the proponent had
the oil moving further into the bay.
3.7.1 Model Inputs and Scenarios
Quote (P. 3-69, para. 1): “The only potential sources of marine spills from the WREP
nearshore operations are batch spills of fuel as a result of ship accidents or groundings during
tow-out activities from the graving dock to the deep-water mating site and the support vessel
activities during the topsides installation.”
Could add dredging operations here.
P. 3-69, para. 2:
If supply vessels are in the nearshore, they can have fuel capacities of around 1150 m3, so the
batch spills could range from 100 to 1150 m3 rather than the 350 m
3 suggested.
P. 3-69, para. 3:
Why not include current maps for the autumn (Oct – Dec) as well?
3.8.22 Surface (Platform) Spill
Quote (last para.): “…the oil will be broken into small tar-balls spread over a large area, with
the oil particles separated by large expanses of water.”
Where would the tar-balls end up? Are there potential impacts for Greenland, Iceland and
further east?
Chapter 4 Socio-Economic Terrestrial and Physical Environment Setting
4.2.1.1 Climate Overview and 4.2.1.3 Wind Climatology
The stations used to describe the nearshore climate of Placentia Bay did not include St.
Lawrence, located near the mouth of the bay on the west side, with a record of hourly and
Husky Energy White Rose Extension Project Environmental Assessment Report
December 2012
Review Comments March 15, 2013 Page 5 of 68
daily weather reports nearly as long as that of Argentia. It is more exposed to open water
conditions than the other three land stations with hourly data.
EC recommends that hourly wind reports from St Lawrence be analyzed to improve the wind
climatology near the mouth of the bay, and could be compared to the southernmost MSC50
grid point.
4.2.1.3 Wind Climatology
Winds from the MSC50 grid point locations and the SmartBay buoys are compared in Tables
4-8 and 4-9. The differences in wind statistics are attributed to the much shorter record of the
buoys, but the low buoy anemometer heights, compared to the 10 m MSC50 winds, would
also contribute to an apparent low bias.
The wind climatology describes only the hourly-reported sustained (mean) wind speeds.
Analysis of gust wind speeds, available from the hourly automatic stations, would be
important for planning and design.
4.2.2.2 Waves
The MSC50 dataset was not intended for use very nearshore. The model resolution,
representation of the coastline and islands, and the bathymetry, are not optimized for
nearshore applications, such as well into the Placentia Bay. EC suggests that this limitation
be acknowledged.
4.2.2.5 Tides, Storm Surges
The text gives an estimate of 0.8 m for probable maximum storm surge from 40-year return
period hindcast values (from Bernier and Thompson (2006), Figure 4-64), however the storm
surge model used by Bernier and Thompson does not include wave set-up or wave run-up or
seiche effects, which can contribute significantly to extreme water levels. EC recommends
that the EIS include an extremal analysis of water levels based on long time series tide gauge
data at Argentia.
4.2.4 Sea Ice and Icebergs
Page 4-112, Figure 4-75:
Typo – The x and y axes are labelled identically as ”Annual Total Number of Icebergs
Observed South of 48N”. The label is correct for the x-axis, but the y-axis should simply be
labelled “Year”.
4.2.4.1 Sea Ice Conditions in Placentia Bay
Page 4-112, Sentence 3:
Two errors
The ice that enters the Bay in February is generally grey or grey-white ice (less than 30cm
thick), and is not first-year ice (>30cm thick). First-year ice incursions into Placentia Bay
only take place from March onwards.
First-year ice is >30 cm thick. Contrary to indicated, it can be >120cm thick. First-year ice
that is >120 cm is called “thick first-year” ice. Ice that is 30-70cm is thin first-year ice,
and ice that is 70-120cm is medium first-year ice.
Husky Energy White Rose Extension Project Environmental Assessment Report
Husky Energy White Rose Extension Project Environmental Assessment Report
December 2012
Review Comments March 15, 2013 Page 17 of 68
John Cabot Building, 10 Barter’s Hill
PO Box 1300
St. John’s, NL A1C 6H8
Tel: (709) 772-5167
Section 15.2.1 - The Proponent is advised that Transport Canada may conduct compliance
monitoring in relation to conditions listed on any Part 1, Section 5 Approval issued under the
Navigable Waters Protection Act. The potential environmental effects associated with any
NWPA approvals may also be evaluated by Transport Canada.
Page 2-22 of the EA Report - The Proponent is advised to communicate the final design of
the graving dock to Transport Canada should the graving dock remain flooded and accessible
to the navigating public once construction activities are complete.
Husky Energy White Rose Extension Project Environmental Assessment Report
December 2012
Review Comments March 15, 2013 Page 18 of 68
Canada-Newfoundland and Labrador Offshore Petroleum Board
Page v of xxix - says “Husky has an Environmental Protection and Compliance Monitoring
Plan for its existing activities in the White Rose field. The Environmental Protection and
Compliance Monitoring Plan will be modified to include the offshore activities associated
with the WREP...”
The WHP, if the option selected, will require an installation specific EPP.
Page v of xxix – says “On June 19, 2012, the Newfoundland and Labrador Department of
Environment and Conservation (NLDEC) advised Husky of its determination that the WREP
is an undertaking requiring environmental review pursuant to the Environmental Protection
Act and that registration was therefore required. Husky formally submitted the Registration to
the Province of Newfoundland and Labrador on August 3, 2012.”
[only] the construction site for the WHP is a provincial undertaking ?
Page vi of xxix – the subsection Assessment Scope and Approach
needs more clarity around the geographic and temporal scope of the assessment
Page vi of xxix – says “This environmental assessment meets these requirements, as well as
the requirements of the C-NLOPB Development Plan Guidelines (C-NLOPB 2006).”
It would be more appropriate to preface the word “meets” with the words “is intended
to”
Page x of xxix – says “The environmental effects of hydrocarbon spills could be significant if
spills are large and persistent enough to affect more than one generation.”
Is this intended to mean that the on-water slick or shoreline fouling would persist for
longer than one generation [which I read as one year but which could be longer], or
that the population effect from a large and persistent spill will endure for longer than
one generation. Some improvement in sentence construction would be appropriate
here.
Page xi of xxix – the sections after the header Species at Risk should be designated as SAR
Marine Fish, SAR Marine Mammals and Sea Turtles, and SAR Birds since there is no
other way to distinguish between these headers and the same headings for non-SAR fauna on
preceding pages.
Page xiv of xxix – says “WREP design and planning will benefit from the years of physical
data collection in the White Rose field. The WREP design and operations planning
incorporates metocean criteria for specific nearshore and offshore conditions. Physical
metocean data collection will continue during the WREP.”
Check against development plan for inclusion of modern metocean data.
Page 1-9 - says “This environmental assessment meets these requirements, as well as the
requirements of the C-NLOPB Development Plan Guidelines (C-NLOPB 2006).”
Replace “meets” with “is intended to meet”.
Husky Energy White Rose Extension Project Environmental Assessment Report
December 2012
Review Comments March 15, 2013 Page 19 of 68
Page 1-10, Section 1.5.1
Need temporal scope
Page 1-11, Section 1.5.2
Need temporal scope
Page 2-7 says “AMA would also have to take ownership of the material post-excavation, as
material handling is not part of Husky’s business.” But page 2-9 says “In an effort to
minimize the environmental footprint and disturbance to all stakeholders as much as possible,
Husky has committed to ensuring proper disposal and use of the excavated and dredged
material within the Argentia Peninsula. Husky has assumed environmental responsibility for
the material from the AMA, and will test and treat the material as required, for the designated
use.”
Are these statements coherent? If not, make them coherent.
Page 2-9, Table 2-4: WHP Life of Field/Structure is up to 25 Years and Subsea Drill centre
productive life is up to 20 years.
Is this consistent with the original White Rose Environmental Assessment? Is it the
proponent’s intent to revise the project temporal scope?
Page 2-10, Table 2-4: Well Treatment fluids attribute is described as “≤ 30 mg/L…”
Insert OIW before ≤ 30 mg/L
Page 2-11, Section 2.4.2 lists “Seawater systems including cooling water and firewater” and
Table 2-4 shows “No discharge limit” for “Fire Control Systems Test Water.”
The SeaRose FPSO has [in the past] required continuous discharge from the firewater
ringmain to prevent freezing and that this water is expected to meet discharge limits
for chlorine concentration. This potential discharge should be considered for the WHP
as well.
Page 2-11 and elsewhere – references to OWTG
References to the OWTG (National Energy Board et al. 2010) should include the
phrase “as amended.”
Page 2-11 and 2-12 – Discussion of water based mud and cuttings
This discussion of WBM and Table 2-5 should be moved to a separate section for
discussion of mud and cuttings since it is not a discussion of wellhead platform
systems and the associated systems are already listed in the preceding list.
Page 2-12 – Discussion of Subsea Drill Centre
The MODU and its subsystems have been omitted and should be included here
Page 2-13 – Discussion of WBM and SBM cuttings
This discussion of WBM and SBM cuttings and Table 2-6 should be moved to a
separate section for discussion of mud and cuttings since it is not a discussion of
subsea drill centre equipment.
Husky Energy White Rose Extension Project Environmental Assessment Report
December 2012
Review Comments March 15, 2013 Page 20 of 68
Page 2-13 Section 2.5
The phrase “life of the White Rose field” should be clarified with respect to assessed
temporal scope.
Page 2-16
What is meant by the term “industrial-sized road”?
Page 2-20 On-Land Construction Section 2.6.2 – does the emergency generator have a
capacity of 750 kilowatts per hour as well? If not, then what is the hourly kilowatt number?
Kilowatts per hour is the much more common and useful value.
Page 2-23, Section 2.6.3.2 says “As part of PWGSC’s site-wide environmental site
assessments (ESAs) completed in 1993/1994 and 1995, 64 test pits, 62 monitor wells, and 15
boreholes with related soil and groundwater sampling were completed at the NFSA site, with
the primary emphasis on petroleum hydrocarbon contamination in the area of petroleum
hydrocarbon product tank storage, located immediately east of the current site (Figure 2-7)”
and Page 2-24, Figure 2.7:
Are the test pits, boreholes and wells referred to above shown on figure 2-7 since this
drawing is titled “Casting Basin Geotechnical Borehole Location Plan” and the notes
are somewhat cryptic. Are the existing boreholes locations completed as wells or filled
and abandoned? Are the test pits in place or filled and abandoned? Are the proposed
observation wells to be installed by Husky or were these proposed and installed some
time ago by PWGSC. Please provide additional clarity in relation to figure 2-7.
If figure 2.7 is to be used for reference then the quality of the figure needs
improvement
Page 2-45, Section Wellhead Platform – Flowlines are discussed in Section 2.8.2 Subsea
Drill Centre but not here. Are they proposed for the Wellhead Platform? If so, details with
regard to installation (e.g. buried, rock covered) should be provided
Page 2-46 Section 2.8.2 Subsea Drill Centre – The particulars of the drill centres should be
compared to the previously assessed drill centres, such as size, depth, amount of seabed
sediment to be removed per drill centre, etc. If different then it must be addressed.
Page 2-49 White Rose Extension Project Operation Section 2.9 – it is stated that if the
WHP development option is selected, then SBM cuttings will be reinjected. How will the
SBM cuttings be dealt with before the cuttings reinjection well is drilled?
Page 2-51, Section 2.9.2 says “SBM cuttings will be treated and discharged from the MODU
in accordance with the OWTG (NEB et al. 2010).”
References to the OWTG (National Energy Board et al. 2010) should include the
phrase “as amended.”
Husky Energy White Rose Extension Project Environmental Assessment Report
December 2012
Review Comments March 15, 2013 Page 21 of 68
Page 2-47 Subsea Drill Centre Section 2.8.2 – “Dropped object proection”, assume it is
supposed to be “protection.”
Page 2-52 Shipping/Transportation Section 2.12 – “Oil will be stored on the ...”
Page 2-53 Offshore Section 2.14.2– “... in accordance with standard oil field practices AND
approved by the C-NLOPB, then...”
Page 2-53, Section 2.14.2 says” Under the WHP development option, the WHP will be
decommissioned and abandoned by first abandoning the wells in accordance with standard
oil field practices, then decommissioning the topsides, followed by decommissioning and
abandonment of the CGS. All infrastructure will be abandoned in accordance with the
relevant regulations. The topsides will be removed from the CGS in a manner evaluated to be
most effective at the time of decommissioning. The WHP will not be abandoned and disposed
of offshore, nor converted to another use on site.”
How does this compare to statements in the 2000 ES
Should we require a surety for removal costs?
Page 2-53, Section 2.14.2, says” Under the WHP development option, the WHP will be
decommissioned and abandoned by first abandoning the wells in accordance with standard
oil field practices, then decommissioning the topsides, followed by decommissioning and
abandonment of the CGS. All infrastructure will be abandoned in accordance with the
relevant regulations. The topsides will be removed from the CGS in a manner evaluated to be
most effective at the time of decommissioning. The WHP will not be abandoned and disposed
of offshore, nor converted to another use on site.”
Under the subsea drill centre development option, the wells will be plugged and
abandoned and the subsea infrastructure will be removed or abandoned in accordance with the
relevant regulations.”
The text regarding decommissioning should be consistent with the 2001
Comprehensive Study Report…
[Husky 2001] Page 24, Section 2.5 says “At the end of the production life of the White
Rose oilfield development, the operator will decommission and abandon the site
according to C-NOPB requirements and Newfoundland Offshore Area Production and
Conservation Regulations. The floating production facility will be removed from the
oilfield. Subsea infrastructure will be removed and the wells will be plugged and
abandoned.”
[Husky 2001] Page 38, Section 4.1.2.3 says “The White Rose site will be abandoned
at the end of the production life and will be restored to minimize
residual effects on the environment…conditions should revert to those before
development and overall there will be no adverse effect. If some structures remain
projecting above the seabed, there will be a positive, very localized effect on fish
Husky Energy White Rose Extension Project Environmental Assessment Report
December 2012
Review Comments March 15, 2013 Page 22 of 68
populations due to the reef effect, provided these structures are protected from
trawlers.”
[Husky 2001] Page 47, Section 4.2.2.3 says “The White Rose site will be abandoned
and restored to near pre-development conditions at the end of its
production life to minimize potential residual effects on the environment…”
[Husky 2001] Page 53, Section 4.3.2.3 says “The White Rose site will be abandoned
and restored at the end of production to minimize permanent effects on the
environment…”
Page 2-53, Section 2.15 says “Regardless of the development drilling option selected,
potential future activities include excavating and installing up to two additional drill centres
within the White Rose field. Note that these drill centres have been previously assessed (LGL
2007a), but are included in this environmental assessment in order to extend the temporal
scope of these activities.”
Is this consistent with the original White Rose Environmental Assessment? The
production project temporal scope extends only to 2020. Is it the proponent’s intent to
revise the project temporal scope?
Page 3-2, Section 3.1.1 says “…receptor height was set to sea level… the height of the
platforms was set at 30 m above sea level to represent the first deck…”
Since human exposure to air emissions is one of the primary concerns for air quality,
is the meaning of the text noted above for the three discrete receptors [adjacent
structures]? The air quality is modeled at the height of the [human] receptors.
Page 3-3, Section 3.1.1 says” Ground level concentrations have been predicted for all these
listed air contaminants.”
Do you mean sea level or deck level?
Page 3-3, Section 3.1.2.1 says” The maximum predicted 1-hour ground level concentrations
at each of the three discrete installations for CO, NO2, SO2, total particulate matter (TPM),
PM10 and PM2.5 during normal operation of the proposed WHP are listed in Table 3-1.” The
term “ground level is used repeatedly in this section.
Do you mean deck level concentrations?
Page 3-5, Section3.1.2.2
Page 3-9, Section 3.1.2.3
Page 3-10, Section 3.1.2.4
Page 3.14, Section 3.1.2.5
Do you mean deck level where the term “ground level” occurs?
Page 3-17, Table 3-26 and 3-27
In the total column in Table 3-7 the WHP carries over the total burden of operations as
described in Table 3-26 while the MODU carries over only the MODU specific
emissions. Make these consistent.
Husky Energy White Rose Extension Project Environmental Assessment Report
December 2012
Review Comments March 15, 2013 Page 23 of 68
Can the proponent verify that the GHG emissions obtained from Environment Canada
are calculated in the same manner as those presented for the WHP and MODU
operations?
Please provide details on what activities at the WHP account for the large difference
between WHP Operations, specifically power generation, and MODU Operations.
Page 3-18, Section 3.2 and subsections
Some reference to the sections where impacts of underwater noise are assessed would
make this information relevant. It might be useful to include something very brief
regarding the sound level magnitude where effects would be detected in identified
receptors [or even to say where this information is in the report].
Page 3-33 Model Inputs Section 3.3.1- “... that a 160 m-wide swath is required to...”
Page 3-39, Section 3.4 and subsections:
Page 3-40 lists a number of assumptions about cuttings size distributions…Husky has
been drilling in the Jeanne d’Arc basin for some time now and should be able to
provide an average particle size distribution from SBM drilling operations.
Page 3-40 Drill Cuttings Deposition Section 3.4 & Table 3-36 – “These times do not
include...”
Page 3-56, Section 3.6 refers to a “recent study”
(NAS 2002) is not recent even if it is the last iteration from NAS and the most
appropriate reference.
Page 3-57 says “Other sources used, notably Scandpower (2000), and NAS (2002), have not
been updated.”
The proponent is directed to two studies referenced in the Hebron Comprehensive
Study
o Scandpower Risk Management AS. 2006. Blow-out and Well Release
Frequencies – based on SINTEF Offshore Blow-out Database, 2006. Report
No. 90.005.001/R2
o IAOGP (International Association of Oil & Gas Producers). 2010. Blow-out
Frequencies. Report No. 434-2.
Page 3-57 says “Each drill centre will have 16 wells. Based on this, the total number of wells
could range from 48 under the subsea drill centre option and 72 wells under the WHP option.
For calculation purposes, the number of wells to be drilled will be assumed to be 60 (average
of the range of 48 to 72) and the production well-years assumed to be 300 (60 wells, half of
which assumed to be producers, each with a producing life of 10 years).”
It would be more appropriate to calculate separate exposures for each scenario rather
than to pool them.
Husky Energy White Rose Extension Project Environmental Assessment Report
December 2012
Review Comments March 15, 2013 Page 24 of 68
Page 3-57 Hydrocarbon Spill Probabilities Section 3.6 – “... using an exposure variable
based on the number...”
Page 3.58, Table 3-48 - It is stated that the Australia spill is under investigation.
This spill investigation has been completed. Spill volume estimate remains “best
estimate”.
Page 3-58 to 3-59, Section 3.6.1.1…
If Deloitte (2012) says there are 85,796 development wells to end 2011, why is the
frequency of an extremely large blowout calculated as [1/67,703] not [1/85,796]?
Please explain or correct.
The same calculation error is repeated for very large spills and should be corrected. In
addition the statistic being calculated is actually frequency of “Spills >10,000 bbl
Volume” which includes very large and extremely large spills.
Page 3-59 Blowouts During Production and Workovers Section 3.6.1.2
The frequency of very large spills (including extremely large) should be [8/350,000]
or 2.28 x10⁻⁵
blowouts/well-year.
Page 3-60 says “With respect to the WREP, there will be approximately 70 development wells
drilled, and an estimated 300 well-years of production” but page 3-57 says “For calculation
purposes, the number of wells to be drilled will be assumed to be 60”
Make these numbers agree
Page 3-60… the section is inserted below in its entirety:
With respect to the WREP, there will be approximately 70 development wells drilled,
and an estimated 300 well-years of production. Using the above world-wide spill
frequency statistics as a basis for prediction, the spill frequencies estimated for the
WREP would be as follows:
Predicted frequency of extremely large hydrocarbon spills from blowouts during
a drilling operation, based on an exposure of wells drilled: 70 x 1.5 x 10-5 = 1.1 x
10-3,
or a 0.11 percent chance over the life of the WREP.
Predicted frequency of very large hydrocarbon spills from drilling blowouts based
on
an exposure of wells drilled: 70 x 5.9 x 10-5 = 4.1 x 10⁻³ or a 0.41 percent chance
over the life of the WREP.
Predicted frequency of extremely large hydrocarbon spills from
production/workover blowouts, based on an exposure of well-years = 300 x 5.7 x
10-6 = 1.7 x 10⁻³ or a 0.17 percent chance over the life of the WREP.
Predicted frequency of very large hydrocarbon spills from production/workover
blowouts, based on an exposure of well-years = 300 x 1.4 x 10-5 = 4.2 x 10⁻³ or a
0.42 percent chance over the life of the WREP.
The content above is wrong, the following corrections are provided
Husky Energy White Rose Extension Project Environmental Assessment Report
December 2012
Review Comments March 15, 2013 Page 25 of 68
With respect to the WREP, there will be approximately 70 development wells drilled, and an
estimated 300 well-years of production. Using the above world-wide spill frequency statistics
as a basis for prediction, the spill frequencies estimated for the WREP would be as follows:
The frequency of an extremely large hydrocarbon spill from a blowout during
development drilling operations is 1/85,796 = 1.16 x 10⁻⁵
spills/well
The predicted number of extremely large hydrocarbon spills from blowouts during a
drilling operation, based on an exposure of wells drilled: 70 wells x1.16x10-5
spills/well =
8.2 x 10⁻⁴
spills
The frequency of very large hydrocarbon spills (including the extremely large category)
from a blowout during development drilling operations is (4/85,796) = 4.66 x 10⁻⁵
spills/well
The predicted number of very large hydrocarbon spills from blowouts during a drilling
operation, based on exposure of wells drilled: 70 wells x 4.66 x 10⁻⁵
spills/well= 3.26 x
10-3
spills
The frequency of extremely large hydrocarbon spills from production/workover blowouts
is 2/350,000 = 5.71 x 10⁻⁶
spills/well-year
The predicted number of extremely large hydrocarbon spills from the WREP based on
well-years is calculated as 300 well-year x 5.71 x 10⁻⁶
spills/well-year=1.7 x 10-3
spills
The frequency of very large hydrocarbon spills (including extremely large) from
production/workover blowouts is 8/350,000 = 2.28 x 10⁻⁵
blowouts/well-year
The predicted number of very large hydrocarbon spills (including extremely large) based
on an exposure of well-years = 300 well-years x 2.28 x 10⁻⁵
blowouts/well-year = 6.8 x
10-3
spills
The following text is to provide background to comments
Of course you can’t have 6.8 x 10⁻³
spills, which is what makes someone who didn’t carry
units through their equation think that they’ve calculated a probability. However, the problem
is that the calculation of a probability for such an event is more complex.
Having a blow-out is a yes or no event (i.e. you either have one or you don’t) and events of
this type are typically viewed as being binomially distributed. If you model blow-outs as
binomially distributed data using historical frequencies you find that you can use the
Binomial Probability Formula to generate probabilities of x number of events occurring
(where x has a value from 1 to n, and n is the total number of trials: 70 wells-drilled or 300
well-years as appropriate. If you do that and take the sum of probabilities for potential x
Husky Energy White Rose Extension Project Environmental Assessment Report
December 2012
Review Comments March 15, 2013 Page 26 of 68
(1,2,3,4,5...n) as the “probability of at least one event”; then for low probability events that
sum is very close to ( i.e. the same as) the number calculated using the formula used by the
proponent, but, as the likelihood of the event increases, the numbers become increasingly
different.
For example, to model the likelihood of a very large blowout spill during development drilling
where the frequency is 4.66x10⁻⁵
spills/well. The binomial probability of any discrete number
of spills k (1 to 70) in n trials (70) can be modeled using the binomial probability function
Where n = number of trials (wells)
k = number of successes (spills)
p =probability of success in one trial (spills per well)
q =1-p
k P
1 0.00325153
2 0.00000523
3 0.00000001
4 0.00000000
Sum 0.00325
One can see that the value of P is vanishingly small with larger k (i.e. the probability of 4 [or
more] very large spills in 70 wells is very small). The probability of at least one very large
spill in 70 wells is the sum of the calculated values ≈ 0.00325.
Or you could use to directly calculate a P value for probability that
there will be at least one very large spill in n=70 wells. Which, for the example above, yields
P =0.00325.
The formula used by the proponent to calculate “frequency over the life of the project” is
both mathematically incorrect (as it does not preserve units) and will fail to produce a
“statistically reasonable” answer for higher frequency events since the calculated probability
will be greater than 100 percent.
Page 3-62 says “The probabilities of the various blowout categories are shown in Table 3-50,
abstracted from Scandpower (2000).”
This table actually contains the incident counts for various blowout categories and
should be labeled as such.
Page 3-64, table 3-53
Note that the blowout frequency has the units “Blowout per Well-year”
Husky Energy White Rose Extension Project Environmental Assessment Report
December 2012
Review Comments March 15, 2013 Page 27 of 68
Page 3-64 Section 3.6.2.3 says “There are an estimated 70 wells to be drilled for the WREP,
so the calculated number of deep blowouts during development drilling becomes 70 [wells] x
4.8 x 10⁻⁵
[blowouts/well]= 3.4 x 10⁻³
[blowouts]’
Insert “using the deep-blowout frequency from OGP (2010)” and the units as indicated
above
It then says “For gas blowouts occurring during production and workovers, the statistic for the
WREP becomes 300 well-years x 1.17 x 10⁻⁴
blowouts/well-year, or approximately 3.5
percent probability over the 20-year life of the WREP.
The quantity calculated is the number of events predicted. However, it is very close to
the “probability of at least one spill” which may be calculated in the manner described
in the note above as 0.0345
It also says “For gas blowouts that occur during production and workovers that involve some
hydrocarbon discharge (>1 bbl), the statistic for White Rose becomes 300 well-years x 2.8 x
10-5
blowouts/well-year, or approximately 0.84 percent probability over the 20-year life of the
WREP.
The quantity calculated is the number of events predicted. However, it is very close to
the “probability of at least one spill” which may be calculated in the manner described
in the note above 0.0084.
Page 3-65 Section 3.6.3 says” The number of production well-years for WREP is 300;
therefore, the probability over the WREP period would be 4.5 x 10⁻³
for a 1,000 bbl spill and
1.7 x 10⁻³
for a 10,000 bbl spill.”
These are the “probability of at least one spill” of the given size
Page 3-68, Table 3.6.6
The proponent should review the contents of the table in relation to the notes above
If “Platform Spills” includes blowouts the probability for platform spill >10,000 bbl
should be larger than the probability of a production/workover blowout > 10,000 bbl.
Please review the contents of the “Probability over the WREP Life” column.
Page 3-68, says “Over the 20-year life of the WREP, the probability of having a large or very
large spill as a result of an accident on a platform is 0.5 and 0.2, respectively. This is
calculated on the basis of US OCS experience.”
Is the word “percent” missing?
Page 3-78 Subsea (seafloor) Blow-out Spill Section 3.8.2.1– Figure 3-47 and Figure 3-48 – these figures need to be redrawn to fit the results of the oil spill trajectory model results. The
author has erroneously placed the results of the oil spill model into a fixed diagram. This error
is also present in the supporting oil spill trajectory model document. The author is advised to
redraw any other figures that have the oil spill modelling results truncated by the fixed
diagram.
Page 4-213 Sea Ice Floe Size Section 4.3.4.1 – the author has identified “melting” as a
reason why floe sizes are smaller south of 49oN. What about warmer air? Also, why is it
Husky Energy White Rose Extension Project Environmental Assessment Report
December 2012
Review Comments March 15, 2013 Page 28 of 68
necessary to include “higher water temperatures” when you have stated “melting”, which
Husky Energy White Rose Extension Project Environmental Assessment Report
December 2012
Review Comments March 15, 2013 Page 30 of 68
for recent executed geophysical activity and incorporate the results of the respective marine
mammal monitoring programs.
11.3.1.3 Fisheries and Oceans Canada Cetacean Sighting Database page 11-11 – the
personal communication with J. Lawson is somewhat dated. When wad the last time the
author communicated with DFO on the cetacean sighting database?
11.4.1.1 Graving Dock Construction – Effects of Pile Driving – page 11-35 – this
section/paragraph requires explanation or support from analysis of actual data or peer-
reviewed research. The author simply cannot make statements that downplay the effects
without scientific support or is this a non-qualitative assumption? Explain.
11.5.1.1 Graving Dock Construction – Pile Driving – page 11-64 – provide evidence to
support “it is very unlikely that on-land pile driving...” See comment 11.4.1.1 Graving Dock
Construction – Effects of Pile Driving – page 11-35 above.
11.5.1.2 Concrete Gravity Structure Construction and Installation – Change in Habitat
Quality – page 11-65 – the author’s concluding statement that effects are negligible does not
coincide with the “Medium” effects in Table 11-10. Rewrite this conclusion to better reflect
the actual magnitude of effect.
11.5.1.2 Concrete Gravity Structure Construction and Installation – Change in Habitat
Quality – Dredging - page 11-66 – change the “negative effects language” to coincide with
the medium magnitude effect in Table 11-10.
11.5.1.3 Accidental Effects in the Nearshore – Change in Habitat Quantity – page 11-71 “... in habitat quality, because of an accidental hydrocarbon spill, may directly reduce...” An
accidental spill does not have an indirect effect on habitat, it is a direct effect of an accidental
event.
11.5.2.2 Production/Operations and Maintenance – Change in Habitat Quality – Other
Activities – page 11-80 – it is not necessary to write out the reference to the OWTG (NEB et
al. 2010) after it has been repeatedly abbreviated.
13.0 Sensitive Areas – page 13-1 – “... stakeholder and regulatory requirements about the...”
Figure 13-2 – Sensitive Areas Identified Within or Near to the Offshore Study Area – the
Placentia Bay/Grand Banks LOMA does not have a land component, redraw the Figure with
this correction.
Page 13-10 Eelgrass Beds – remove the very first sentence in this section as it is not
necessary. The third sentence is referenced and is better placed after the second sentence,
which introduces the idea of eelgrass beds.
Page 16-4, Section 16.4
Should include a reference to the Environmental Protection Plan Guidelines (National
Energy Board, et al. 2011) to be consistent with other similar sections.
Husky Energy White Rose Extension Project Environmental Assessment Report
December 2012
Review Comments March 15, 2013 Page 31 of 68
Page 16-22, Section 16.13.2
Husky has not indicated how they avail of the GRN.
Page 17-1 Summary and Conclusions Section 17.0 – “All production from the potential
future drill centres will be processed through the SeaRose FPSO currently operating at White
Rose. The effects of production have been previously assessed (Husky Oil 2000; LGL 2007a),
and are not addressed in this document.” Again, the temporal scope for the previous EAs for
operation of the SeaRose FPSO will have to be considered in relation to the temporal scope
for the operation of this proposed project.
Page 17-2 Results of White Rose Extension Project Modelling Section 17.2.1 – See
specific comments on Supporting Document below.
Page 17-4 Air Quality Section 17.2.2 – See specific comments on Supporting Document
below.
SUPPORTING DOCUMENT COMMENTS
Drill Cuttings and WBM Operational Release Modelling (AMEC June 2012)
General Comments
G1 Throughout the document it is stated that the release of mud and cuttings will be in
accordance with the Offshore Waste Treatment Guidelines (OWTG). The OWTG
outline: “ …the goals, objectives and requirements of the applicable acts and
regulations, and to explain the expectations of the Boards regarding the management
of waste material …”. For an operator, the governing document with respect to
management of discharges to the natural environment is the Environmental Protection
Plan (EPP) submitted as part of the authorization application (OWTG page 2). The
document should describe the discharge of cuttings and mud expected for the project
(e.g. mud types, discharge locations, oil on cuttings).
G2 There are a number of assumptions made, such as particle size and distribution, well
depths and aggregation of cuttings. It is difficult to say if the assumption is valid. The
basis on which all model assumptions are based should be provided.
G3 It is not clear from the report that the modeling accounts for the effect the WHP and its
orientation may have on local currents and the dispersion of cuttings. An explanation
of how the WHP would affect currents and dispersion should be provided.
G4 Husky has completed a number of Environmental Effects Monitoring (EEM)
Programs which give an indication of the extent of area affected by cuttings discharge
from a MODU. There is no indication that the model has been calibrated or compared
to the results of the EEM Programs. Such a comparison would demonstrate the
accuracy of the model to predict the deposition of cuttings discharged.
Husky Energy White Rose Extension Project Environmental Assessment Report
December 2012
Review Comments March 15, 2013 Page 32 of 68
Specific Comments
Executive Summary, pgs i-ii – “These will be almost exclusively the fast-settling pebbles
and coarse sand (a very small percentage of the fines will drift for a time and ultimately settle
near the WHP…”. Please provide the reference for the grain sizing.
Executive Summary, pg ii – “Under the subsea scenario, the footprint of WBM cuttings is
smaller than that for the WHP option, with a range generally restricted to within 2 km. The
primary difference factor is the reduced number of wells drilled (16 as opposed to 40) and the
reduced volume of cuttings material released (267 m3 per well as opposed to 295 m3) for the
subsea option”. This statement should be reviewed, as the settling rate would be the main
determining factor for the area affected and to a much lesser extent the volume of material
discharged.
Executive Summary, pg ii – “Under the subsea drill centre option, the majority of SBM
cuttings are deposited quite close to the drill centre, due to the large percentage of large
cuttings pieces having fast settling speeds.” Please provide the reference for both the grain
sizes expected for cutting and settling rates, and how they were determined.
Executive Summary, pg ii – “The environmental effects of released WBMs are generally
associated with the potential physical toxicity of fine particulate matter, either barite or
bentonite, which are sometimes used to increase the density of the mud mixture, and these
additives have greater potential to affect filter feeding organisms as they remain suspended in
the bottom boundary layer.” Barite and bentonite should sink to the ocean floor and not
remain suspended in the bottom boundary layer. Explain what is meant by the bottom
boundary layer and provide a reference for the assertion that WBM are generally associated.
Executive Summary, pg ii - “The most likely composition of the WBM planned for use
during the WREP does not include these weighting agents”. Either the WBM contains or does
not contain weighting agents. The authors need to consult with the proponent regarding the
types and general composition of muds to be used.
Executive Summary, pg ii – “No component of the WBM has been identified as potentially
toxic; therefore…”. Please define toxic and identify the generic composition of the mud and
the toxicity of its components. Provide references for the toxicity of the mud components.
Section 2 Drilling Program, pg 2 – “For drilling of the deeper intermediate and main hole
sections - for both WHP and MODU drilling - SBM will be used. Under the WHP option the
base case is to use two cuttings reinjection wells into which treated SBM and cuttings will be
re-injected (i.e., no return of materials to the sea)”. The discharge of SBM cuttings will not
be permitted until the cutting reinjection system is operative. This would mean no drilling
with SBM.
Section 2 Drilling Program, pg 3 – “Well lengths assumed are for a typical producing well
from a MODU, which is approximately 5,500 m (mKB).” Well length should be typical to
Husky Energy White Rose Extension Project Environmental Assessment Report
December 2012
Review Comments March 15, 2013 Page 33 of 68
what is being drilled and what the proponent expects to be drilling and not typical to a
MODU.
§3.1.1 Advection Dispersion Model Description, pg 6 - “For the purposes of predicting
their physical deposition on the seabed, the cuttings are considered as a composition of
particle types or sizes; typically larger cuttings pieces pebbles coarse sand, medium sand and
fines. These particle sizes are assumed to be generally representative of the materials likely to
be encountered in the area and generated using WBM or WBM.” Please provide the
percentage of each particle size and reference the source of the composition. It is
inappropriate to make assumptions and where assumptions are made the rational for that
assumption needs to be described.
SBM are proposed to be discharged from the MODU for subsea development but according to
the statement only WBM are modeled. SBM are to also be modeled.
§3.1.1 Advection Dispersion Model Description, pg 6 - “After completion of a model run,
when all particles have settled, or have reached the model grid boundaries (in which case,
they are taken to have drifted outside the domain and are tabulated as ‘lost’)…”. If particles
reach the boundary then the boundary will need to be extended. Otherwise, no conclusion can
be reached as to the extent of the affected area. State if the particles exceed the boundary.
§3.1.1 Advection Dispersion Model Description, pg 7– “All cuttings are assumed to be
adequately treated to reclaim oil as required by present regulations. Oil content on cuttings
produced during drilling with SBM, OCinitial was set to 7.4 g / 100 g, equal to 6.9 g / 100 g oil
on wet solids, as per the OWTG (NEB et al. 2010).” The use of oil on cuttings data from the
proponent’s current operation would be more appropriate for modeling purposes.
§3.2.1 Scenarios, Well Sequences, Well Types, Table 3-1, pg 8 – Please provide the
information on the duration for drilling each well section. Duration should be based on actual
time to drill a well in the White Rose field.
§3.2.2 Cuttings Particle Characterization, pg 9 - “Information for the Hibernia K-18 well
is available from a sieve analysis performed by AGAT Laboratories (1993) and details depths
of 900 to 5,010 m. This has been employed in the previous cuttings modelling for Hibernia,
Terra Nova and White Rose (Hodgins 1993; Hodgins and Hodgins 1998, 2000), and Hebron
(AMEC 2010), with estimates of percentage pebbles, coarse sand, medium sand and fines,
and is the best available source of information.” Information on particle size could be
obtained through Husky’s current drilling program and would be more representative of
particles sizes while drilling with SBM.
§3.2.2 Cuttings Particle Characterization, pg 9 – “Experience with both SBM and WBM
has shown that SBM systems are not dispersive; cuttings are large, and they remain intact
until deposited on the seabed.” Whose experience and what is the basis of that experience?
For SBM cuttings, the more the cuttings are processed the more the particle size decreases
and remain suspended in the water column. This increases the affected area. In addition, as
cuttings get drier, the amount of oil decreases. Please see Brandsma, 1996 which states that
“The explanation for this apparent conundrum is that while treatments other than
Husky Energy White Rose Extension Project Environmental Assessment Report
December 2012
Review Comments March 15, 2013 Page 34 of 68
centrifugation also reduce oil content (from an untreated level of 15.8% [w/w] to a range of
0.3% to 5.1%, these treatments also generate cuttings with finer particle sizes. Thus,
according to the model, the untreated and centrifuged OBF-cuttings would not reach the 1000
m mark to the same extent that the treated OBF-cuttings would because the finer particles
created by the treatment have lower settling velocities and are transported farther in the
water column.”
US EPA. 2000. Environmental Assessment Of Final Effluent Limitations Guidelines And
Standards For Synthetic-Based Drilling Fluids And Other Non-Aqueous Drilling Fluids In
The Oil And Gas Extraction Point Source Category, December 2000, report number EPA-
821-00-014 Page 4-4.
Brandsma, M.G. 1996. Computer simulations of oil based mud cuttings discharge in the
North Sea. In: The Physical and Biological Effects of Processed Oily Frill Cuttings. E&P
Forum Report No.2.61/202. April 1996. Pages 25-40.
§3.2.2 Cuttings Particle Characterization, pg 9 – “Cuttings drilled with SBM will be large,
on the order of 2.5” in length, 1” wide, and 1/8” thick. To characterize these large cuttings
as spherical particles for the model, their volume corresponds to a particle diameter of about
1 to 3 cm. This large cutting size type was added to the pebbles, coarse sand, medium sand
and fines types used to characterize the WBM-cuttings noted above. It was assumed that most
(approximately 70 percent) of the cuttings will be large, approximately 20 percent 0.5 to 1
cm, 5 percent 0.1 cm, with the remaining 5 percent being very fine particles, with diameters of
0.01 cm (Table 3-3).” Provide the reference for the data source.
§3.2.2 Cuttings Particle Characterization, pg 10 – “It is assumed that the cuttings will
enter the sea in a disaggregated form”. There are a lot of assumptions made for this modeling
however no basis for the assumptions is given. Provide the basis on which this assumption is
made.
§3.2.2 Cuttings Particle Characterization, pg 11 – Reference the source of the data
provided in Table 3-4.
§3.2.3 Ocean Currents, pg 12 – “It was assumed that drilling would commence in the fall,
for either the WHP or subsea”. Drilling can occur at any time of the year. Will the timing of
drilling activities affect the outcome of the modeling? Please confirm the timing of drilling
activities.
§3.2.4 Model Geometry, pg 14 - “The subsea development option differed from the WHP
option only in that West White Rose was drilled with a MODU rather than from the WHP;
and 16 wells as opposed to 40 were drilled with the subsea option. For visualizations of
combined scenario results (e.g., for the WHP option, 40 wells at the WHP, plus 16 wells at
the SWRX, for a total of 56 wells”.
It is stated in the Introduction that “Two development options are being considered for the
West White Rose component of the WREP: a WHP, which essentially is a fixed drilling
Husky Energy White Rose Extension Project Environmental Assessment Report
December 2012
Review Comments March 15, 2013 Page 35 of 68
platform; or a subsea drill centre with wells drilled by a mobile offshore drilling unit
(MODU). Also as part of the WREP are up to three additional drill centres in other areas of
the White Rose field. If a WHP is used in the West, the total number of wells could be up to
88: 40 wells from the WHP, plus up to three additional subsea drill centres, each with up to16
wells (Husky 2012). For the subsea drill centre option, the total number of wells could be up
to 64: 16 wells each for West White Rose plus up to three additional drill centres (Husky
2012). These wells will be a combination of producing, water injection, gas injection and
(WHP option only) cuttings reinjection.”
Modeling 56 wells when there is potentially 88wells is not adequate to show the extent of the
area that may be affected by cuttings. Modeling is to be done for the project scenarios
described in the environmental assessment report. The proposal for the WHP and subsea
development is 40 platform wells and 48 subsea wells, and the subsea option of 64 wells.
§3.3.1 Water-based Mud Cuttings, pg 15 – “Cuttings from drilling the upper two well
sections with WBM will all be released as per the OWTG (2012) close to the seafloor, under
either the WHP option with chute release, or under the subsea option with MODU riserless
drilling. Therefore, there is little time for the cuttings to be transported large distances by the
ambient currents.”. The Cuttings are not being released as per the OWTG, they are being
released based on the design of the facilities and drilling practices. Also, the MODU
discharges WBM at the sea floor while the wellhead platform will release discharges above
the sea floor. The paragraph should be reworded to reflect that cuttings are being released
based on facility design and practice and that the release of WBM from the platform and
MODU are different but simplified for the purposes of the modeling.
§3.3.1 Water-based Mud Cuttings, pgs 16-17 - There is no figure showing the combined
deposition of WBM and cuttings for either the WHP option or the Subsea option. There is
also no figure showing the disposition of WBM cuttings discharged from all of the subsea
wells. The only figure presented is for 16 wells and not the 88 wells for the wellhead platform
or the 64 with the subsea option.
§3.3.2 Synthetic-based Jud Cuttings, pg 21 – “For MODU drilling, SBM cuttings will be
treated and released in accordance with the Offshore Waste Treatment Guidelines (OWTG)
(National Energy Board (NEB) et al. 2010)”.
See previous comments.
§3.3.2 Synthetic-based Jud Cuttings, pg 28 - A smaller scale figure would be useful to
distinguish the near field deposition.
§3.4 Sensitivity Discussion, pg 31 - “Sensitivity to the amount of cuttings material is
straightforward; in general, the cuttings weights, densities and thicknesses seen over a given
area are directly proportional to the volume of materials released.” Provide the reference as
to the source of the statement or more detail as to how the conclusion that densities and
thicknesses are proportional to the volume of material released.
Husky Energy White Rose Extension Project Environmental Assessment Report
December 2012
Review Comments March 15, 2013 Page 36 of 68
§3.4 Sensitivity Discussion, pg 32 – “For the present modelling, one settling velocity is
employed for each particle type. For a faster fines settling velocity sensitivity, the value of
0.005 m/s from Tedford et al. (2003) was selected and applied for the scenario of drilling one
of the potential future subsea drill centres.” A more detailed explanation as to why this
velocity was selected and the others excluded is required. Also, Tedford et al. only studied
water based muds so an explanation as to the application of the settling velocities for WBM is
comparable to SBM cuttings.
Section 4 Drilling Mud Properties and Discharge characteristics, pg 38 – “The use and
disposal of water-based muds are subject to the Offshore Waste Treatment Guidelines
(OWTG) (NEB et al. 2010)”.
Previous comments
Section 4 Drilling Mud Properties and Discharge characteristics, pg 38 – “The most likely
composition of the WBM planned for use during the WREP does not include these weighting
agents, therefore no amount of particulate matter is expected to be introduced to the
environment due to the release of WBM during any stage of the drilling process. The
anticipated composition of WBM (Table 4-1) constitutes primarily of brine, with the possible
addition of Sodium Acid Pyrophosphate (SAPP). SAPP is a white powder that is water
soluble. It is used as a mud thinner and dispersant, and is especially effective for treating
cement contamination (MiSwaco 2006).” Confirm with the proponent what the composition
The proponent must obtain a Water Use License from this Division for the use of any
volume of water from any water source. As part of this licence the proponent will be
Husky Energy White Rose Extension Project Environmental Assessment Report
December 2012
Review Comments March 15, 2013 Page 45 of 68
required to provide a water use or diversion monitoring and reporting plan for all
groundwater and surface water sources.
Contact: Manager, Water Rights Section (709) 729-4795
The proponent will require approval from this Division under Section 48 of the Water
Resources Act before starting construction activities within 15 metres of any water body
(including wetlands). Construction activities include all stream crossings, dams, drainage
works, fording and any other work such as landscaping, clearing or cutting of any natural
vegetation within 15 metres of a body of water.
Contact: Manager, Water Investigations Section, (709) 729-5713
Any effluent or runoff leaving the site will be required to conform to the requirements of
the Environmental Control Water and Sewage Regulations, 2003.
Executive Council, Women’s Policy Office
The Women’s Policy Office is in agreement with the assessment provided by Natural
Resources.
The Operator failed to include comments requested by WPO in the Guidelines and we
reiterate the need for the Operator to include in the EPR document the following
commitment:
All benefit amendment components including Gender Equity and Diversity Plans
(including Business Access Strategies) with the Province for the construction,
operations and decommissioning phases of the project will be finalized and
approved by the Minister of Natural Resources, and for Gender Equity and
Diversity, the Minister responsible for the Status of Women prior to the start of
construction.
Husky Energy White Rose Extension Project Environmental Assessment Report
December 2012
Review Comments March 15, 2013 Page 46 of 68
Department of Natural Resources
On behalf of Natural Resources (Mines and Energy), we have reviewed the EPR report for
the Argentia Wellhead Platform Project and have found that the Operator failed to include
comments requested in the Guideline.
Thus, we reiterate the need for the Operator to include in the EPR document the following
commitments:
All benefit amendment components including local benefit capture, and Gender Equity
and Diversity Plans (including Business Access Strategies) with the Province for the
construction, operations and decommissioning phases of the project will be finalized and
approved by the Minister of Natural Resources, and for Gender Equity and Diversity, the
Minister responsible for the Status of Women prior to the start of construction,
The Operator must agree to address any additional benefit concerns identified by the
province arising from the Wellhead project, and
Any Benefit Amendments will be submitted to the CNLOPB as an amendment to the
Benefits Plan, and will also be amended in the overall White Rose Benefit Framework if
deemed necessary by the Province.
Husky Energy White Rose Extension Project Environmental Assessment Report
December 2012
Review Comments March 15, 2013 Page 47 of 68
Fish, Food and Allied Workers
While the FFAW is generally supportive of the proposed project we have to balance that
support with our responsibility to protect the interests of our fish harvester and plant worker
membership and the health of our ocean for future generations.
Fundamentally, the overall project will impact fish harvesters both in Placentia Bay and the
offshore. The near-shore component of the project will result in some loss of fishing grounds
to harvesters in Placentia Bay. It needs to be noted that accessing alternate fishing grounds
can be problematic when considering the traditional nature of the fishery in Newfoundland &
Labrador. Fishing alternate grounds generally means that they are infringing on another
harvester's "territory". As well, commercial species are not distributed equally in bays and
coves. Therefore, the impacts of project-related activities in the next few years will have an
impact on many harvesters in Placentia Bay, that is, not just those in the communities adjacent
to the construction activities. All Placentia Bay harvesters will be subjected to increased risk
of gear/vessel loss and damage, accidental spills, as well as reduced safety on the water,
access to fishing grounds, and catch rates as a result of this project. As well, similar impacts
will be faced by offshore harvesters with quotas to fish in NAFO Division 3L as offshore
development begins.
Specific Comments
1. Establishing a Fisheries Liaison Committee with adequate fish harvester representation will
be key in the coming months to enable appropriate consultation with the affected harvesters as
the project proceeds (Section 6.2.1.3 and 9.5.1.2). Involving harvesters in the development of
a near-shore Environmental Effects Monitoring program prior to the start of construction at
the site will also provide opportunity for collaboration (Section 15.2.1). The FFAW and the
harvesters whom it represents are looking forward to future consultations regarding the
deepwater mating location as committed to by the Partners (Section 2.7.5)
2. In the discussion on planning for the development of the White Rose Expansion Project
involving the western expansion in Section 2.4 there the acronym for the Wellhead Platform
(WHP) is used on page 2-14, yet in Figure 2-1 said acronym is not involved in the depiction.
3. Possible construction of the proposed Wellhead Platform structure in Placentia Bay will
have an impact on the environment in the bay and more specifically fish habitat. Concerns
from fish harvesters have been noted in the report with respect to dredging, debris, discharges,
dumping, accidental spills, construction related noise and lighting. It needs to be reiterated
however that construction activity will also impact catchability, and therefore profitability, for
fish harvesters.
4. The future fisheries were nominally encountered in this Environmental Assessment. With
significant environmental changes it is anticipated that there will be a change in the biomass
composition in Newfoundland & Labrador waters. With the environment readjusting to more
stable/normal state there is an expectance of an increased presence of finfish (such as Cod).
Therefore, although Figure 9-23 shows a drastic decrease around 1990 and since stability,
there are indicators that this is about to change again. The likelihood is that harvesting
patterns will change and there will be a significantly increased level of fishing activity
Husky Energy White Rose Extension Project Environmental Assessment Report
December 2012
Review Comments March 15, 2013 Page 48 of 68
throughout the Grand Banks. Potentially that activity could rival the time prior to the cod
moratorium. The White Rose Partners should consult with the fishing industry on a regular
basis to keep up to date with the fishing trends for the various species.
5. Also with respect to future fisheries, information presented at RAP meetings in 2009 and
2010 indicated that there are increasing signs of cod in the offshore with scope for more
recovery, with indication of a low natural mortality. The 2011 Assessment of Northern
(2J3KL) Cod (Science Advisory Report) noted that the annual DFO trawl surveys indicated
an eight-fold increase in the spawning stock biomass from 2004 to 2008. A commercial
fishery for Atlantic cod on the Flemish Cap (an adjacent, NAFO-regulated stock) opened in
2010. For Southern Grand Banks cod (3NO) it is expected that the spawning stock biomass
will surpass the conservation limit reference point set by DFO in 1999 at 60,OOOt.The
resumption of offshore groundfish fisheries would significantly alter fishing patterns and
activities within the Jean d'Arc Basin of the Grand Banks and have an impact on fishing
enterprises. Again, the fishing industry should be regularly consulted to keep apprised of
fishing trends.
6. The FFAW feels that the fisheries statistics contained in the Environmental Assessment are
insufficient in that they do not give any reflection of the historical harvest for groundfish on
the Grand Banks. With the changing environment it would be pertinent for the Environmental
Assessment to contain indicators of where and how groundfish harvest was pursued on the
Grand Banks, especially the formerly important codfish. Effectively, a five year horizon for
past fisheries is not sufficient and does not provide a good enough perspective of the activities
for the members of the FFAW.
7. Looking at the various discussions on habitat through out the Environmental Assessment
there are some mishaps, such as a subheading in Section 8.5.2.1 being Change of Habitat
Quality, the lead sentence then reads. "Habitat quantity may be reduced as a result of lighting,
discharges, sedimentation and increased noise occurring due to the above activities." There
obviously is a disconnect between what is written and what was intended written. It is further
worth to note that the final paragraph of Section 8.5.1.3 suggests that in a worst case scenario
of an accidental event the impact would be such to only affect abundance or distribution of
one generation of fish, and to be re-established to previous levels within several generations.
This is a significant statement as with the state of the Newfoundland & Labrador fisheries any
impact on the biomass or resource availability is significant.
9. The establishment of a Safety Zone (Section 9.5.1.1 and 9.5.1.2) at the locations in
Placentia Bay will result in a loss of fishing grounds to harvesters in Placentia Bay. This is
significant for inshore harvesters in Placentia Bay as previously discussed.
10. The Husky Energy Extension Project Environmental Assessment presents an untenable
spin on an unfortunate situation in the Gulf of Mexico, making light of an environmental
disaster (Section 9.5.3). There are now cases of species in the Gulf of Mexico that are
experiencing changes in gender composition, directly affecting the species recruitment. The
FFAW does not appreciate a suggestion of a potential better economic return per volume
harvested, due to diminished resource availability on the market as a result of an
Husky Energy White Rose Extension Project Environmental Assessment Report
December 2012
Review Comments March 15, 2013 Page 49 of 68
environmental disaster. Section 9.5.3 leads with the indication that the “...effects from a spill
or blowout will be not significant. However, economic impacts might still occur if a spill
prevented or impeded a harvester's ability to access fishing grounds, caused damage to fishing
gear or resulted in a negative effect on the marketability of fish products."
11. With regards to socio-economic considerations there is a mention that "90 percent of the
nickel processing plant's construction workforce live outside of the Argentia area and
commute to the WREP site on a daily basis, and a similar situation is expected with the
WREP." It is unfortunate that this was not caught before the document was sent out for
review. In addition who is to say that the WREP will have access to the potential labour
supply surplus resulting from the completion of the nickel processing plant, there are two
other major industrial projects taking place in the province at the same time that the Wellhead
Platform is expected to be constructed.
12. In the consultation session with the Offshore Harvesters, one fisherman raised an issue
with regards to the possibility of the petroleum activity within the White Rose Field
expanding to the Northeast. If this were to take place it would have a direct impact on some of
the most fruitful snow crab harvesting grounds. This was brought up as the diagrams showing
the White Rose field with new drilling centres had one listed to the Northeast of the current
North Drill Centre (Figure 2-15 and/or Figure 2-16). At a subsequent meeting on October 9th
,
2012 between the Husky Energy and the FFAW (One Ocean was also present) Husky was
indicating that any expansion towards the Northeast was not within the horizon, and there are
currently no plans to pursue anything in this area. Nevertheless, when the Environmental
Assessment was sent out for review this is still listed in the figures listed above. Further to
this, it is mentioned that offshore harvesters were concerned that the extension into the west
of the White Rose field would go into snow crab grounds (Section 6.2.2.2). This is factually
inaccurate, the concern raised by the harvesters was about extending to the north, there is very
limited harvest taking place to the west of the White Rose field as evident from the (limited)
information presented in Figure 9-28.
13. With regards to the concerns that were raised in the context of the SWRX (Page 6-10), the
issue at hand was that the Safety Zone depicted in the consultation slide differed from that
which is in place out in the field. The map which was used included a zonal change, which
Husky subsequently went on to apply to get implemented. At the September 20th
, 2012
consultation meeting the submission to change the Safety Zone had not been made. However,
at the follow-up meeting on October s". 2012 Husky indicated that the application for
changing the Safety Zone had been submitted. The issue was not that the FFAW and One
Ocean were not consulted on the SWRX, but rather that said consultation had not had any
mention of a change to the White Rose Safety Zone. This approach was not conducive to the
enhancement of mutual trust between the two industries. The FFAW does realize that at the
time of submitting the original Environmental Assessment for the subsea drill centres Husky
did not know the exact location where they would be drilling. But when the proponent knows
where the drill centres will be, there needs to be further consultation if there is going to be an
impact on the fishing vessels that use the area.
Husky Energy White Rose Extension Project Environmental Assessment Report
December 2012
Review Comments March 15, 2013 Page 50 of 68
14. The FFAW and its members are very concerned about the potential of aquatic invasive
species, such as green crab, infesting our bays and coastal waters. The additional vessel traffic
associated with the construction of the Wellhead Platform in Placentia Bay may potentially
lead to the introduction or proliferation of unwanted aquatic invasive species. The green crab
that has become resident in areas of Placentia Bay for example has destroyed eel grass beds
and competes with native crab and lobster species for food. The potential for the introduction
of aquatic invasive species in the area was merely mentioned in passing (Section 12.4.2.3) in
the White Rose Extension Project Environmental Assessment document. The FFAW strongly
encourages the Partners to consider and detail the mitigation strategies that the contracting
marine vessel companies will need to follow to prevent the introduction and/or proliferation
of aquatic invasive species in Placentia Bay. Furthermore, the FFAW calls upon the various
regulatory bodies to be very stringent regarding any ballast water exchange plans proposed by
the Partners and ensure vessels follow proper ballast water management practices. As well,
aquatic invasive species should be incorporated into the near-shore Environmental Effects
Monitoring program.
Husky Energy White Rose Extension Project Environmental Assessment Report
December 2012
Review Comments March 15, 2013 Page 51 of 68
Fisheries and Oceans
See Appendix 1
Husky Energy White Rose Extension Project Environmental Assessment Report
December 2012
Review Comments March 15, 2013 Page 52 of 68
Appendix 1
Husky Energy White Rose Extension Project Environmental Assessment Report
December 2012
Review Comments March 15, 2013 Page 53 of 68
No. Sector Reviewer
Initial
Section / Page No. Comment / Information Request
GENERAL COMMENTS
1 HPD SL DFO has recently reviewed the post-construction survey for the South White Rose Extension. It has been determined
that the authorized footprint for excavation of the South White Rose drill center and associated spoils disposal has
been significantly exceeded.
Throughout the document, Husky states there is sufficient capacity within the existing authorization for all works
and undertakings proposed for the offshore component. DFO would like to highlight the fact that although Husky
Energy has a valid authorization (Authorization No. 07-01-002) until December 31, 2015 for the White Rose
Extension Project, an amendment may be required if Husky Energy plans to carry out any further excavation
activities at the West White Rose other than that required for installation of the CGS and/or develop the North White
Rose drill center as originally authorized.
2 HPD SL Based on recent ROV surveys of a nearby oil development, it appears that accumulation of drill cuttings in
proximity to offshore oil drilling sites may be greater than predicted during the environmental assessment (EA). As
such, DFO will be requesting that all oil developments (existing and future) conduct additional monitoring to
determine the magnitude and extent of deposition of drill cuttings closer to the drill centers where current monitoring
has not been carried out (i.e., within 250-500 m). This will require further discussions with DFO.
3 HPD SL There is no mention in the EA of subsea cables occurring within the nearshore dredging/excavation areas. The
proponent should contact Canadian Hydrographic Service, NL Region to ensure that there are no cables or other
impediments within the proposed route prior to commencement of dredging activities and CGS tow-out.
Husky Energy White Rose Extension Project Environmental Assessment Report
December 2012
Review Comments March 15, 2013 Page 54 of 68
No. Sector Reviewer
Initial
Section / Page No. Comment / Information Request
4 DFO (Sci.) Species descriptions should include the most up-to-date, relevant information available. For example, many of the
distribution maps, particularly those for marine fish and SAR, are based on data prior to 2001 and need to be updated
accordingly. Significant changes have occurred over the past 10 to 20 years for many marine species, as well as the
marine environment.
SPECIFIC COMMENTS
1 HPD SL 2.4.1 White Rose
Extension Project Design
Criteria Table 2-4, P. 2-10
Please provide the correct dimensions of the CGS as the table reports the diameter in m2. The exact footprint of the
CGS is not specifically reported, which is needed to confirm that the authorized area under the current Fisheries Act
Authorization has not been exceeded.
2 HPD SL 2.6.3.1 Excavation, P. 2-20 The proponent should ensure that the cut-off wall is constructed using appropriate mitigations, such as sedimentation
and erosion control measures as outlined in DFO’s Guidelines for Protection of Freshwater Fish Habitat in
Newfoundland and Labrador. Please note that mitigation measures as described in this document are applicable in
both the freshwater and marine environments. Also, please confirm that there will be no in-water works during
construction of the cut-off wall.
3 DFO (Sci.) Section 2.6.3.3, P. 2-25 to
2-29
Baseline data on the health of fish in Argentia Harbor would be useful. Data is presented on levels of contaminants
in sediment, but information on contaminant levels alone is of very limited value in assessing any potential risks to
aquatic organisms. It is also noted that levels of contaminants in some sediment samples are above Canadian Council
of the Ministers of the Environment (CCME) guidelines.
4 HPD SL 2.6.4 The Pond, P. 2-30 During water withdrawal at The Pond, ensure adherence to DFO guidelines as described above, including the use of
appropriately sized screens as described in DFO’s Freshwater Intake End-of-Pipe Fish Screen Guidelines (1995).
5 HPD SL P. 2-32 Please confirm that activities within The Pond will not compromise the integrity of the bar sway/berm, which could
result in a breach of the structure and a resultant release of sediment into the marine environment.
Husky Energy White Rose Extension Project Environmental Assessment Report
December 2012
Review Comments March 15, 2013 Page 55 of 68
6 HPD SL 2.7.2 Shoreline Dredging,
P. 2-37
During shoreline dredging, please ensure appropriate mitigations are implemented, particularly erosion and
sedimentation control measures. Dimensions of the graving dock entrance are unclear. Please clarify whether the
excavated/dredged area will be 18-20 m deep across the entire 180 m channel.
7 HPD SL 2.7.3 Tow-out Channel
Dredging, P. 2-38
The overall size of the dredging footprint appears to be different than that reported in the Marine Habitat
Characterization Report, dated September 2012 (i.e., decreased from 223,800 to 215,000 m2). Prior to the start of
construction, a final estimate of the dredging footprint should be provided to DFO.
8 HPD SL 2.7.6 Topsides Mating and
Commissioning, P. 2-42
Please provide more detailed information on the proposed mooring systems, including anchor dimensions, water
depth and substrate type at anchoring points, timing and duration of deployment, etc.
9 HPD SL 2.8.1 Wellhead Platform,
Figures 2-15 and 2-16, P.
2-45 & 2-48, respectively
The drill center SWRX should be included in the figures as it has been excavated and will be developed in 2013 with
completion of the site prior to the offshore component of this project.
10 HPD SL 2.8 White Rose Extension
Project: Installation, Table
2-12, P. 2-46
The table indicates that rock berms could be installed offshore. It is DFO’s understanding that there would not be
extensive use of rock berms in the offshore. Please confirm in writing that concrete sleeves will be used instead of
berms for flowline protection (phone conversation between S. Lewis and D. Pinsent, February 8, 2013), as this could
have implications under s.35(2) of the Fisheries Act.
11 HPD SL 2.8.2 Subsea Drill Centre,
Table 2-13, P. 2-49
Maintenance of drill centers and flowlines, including the removal of excess drilling muds should be included in the
list of activities as there could be implications under s. 35(2) of the Fisheries Act depending on the scale of activities
required.
12 HPD SL 2.9.1 Wellhead Platform
Operation and
Maintenance, P. 2-51
This section indicates that SBMs will be re-injected if a suitable formation can be found. Please provide a
contingency plan if this is not possible.
13 HPD SL 2.14 Decommissioning and
Abandonment, P. 2-53
As part of the decommissioning plan for the graving dock, stabilization and erosion control measures should be
implemented to ensure the conservation and protection of fish habitat. The long term plans of the graving dock
should also be discussed with DFO to ensure whether there is any potential for fish habitat restoration measures.
It is important to note that during offshore decommissioning, any structures currently considered as fish habitat (i.e.
existing rock berms) should not be removed without prior consultation and approval with DFO.
Husky Energy White Rose Extension Project Environmental Assessment Report
December 2012
Review Comments March 15, 2013 Page 56 of 68
14 HPD SL 2.15 Potential Future
Activities, P. 2-53
See comment G-1.
15 HPD SL 3.4 Drill Cuttings
Deposition, P. 3-39
Figures in this section should include finer scale images such as 0-1 km scale. As described in the general comment
(G-2), based on recent ROV surveys at a nearby oil development, it appears that accumulation of drill cuttings in
proximity to offshore oil drilling sites may be greater than predicted during the EA. As such, DFO may require
Husky Energy, as well as operators of other existing and future oil developments, to provide additional monitoring
adjacent to the drill centers in order to verify these predictions. It should be noted that in the past, DFO has
recognized that drill cuttings deposition with thicknesses of greater than 10 cm are considered harmful to benthic
organisms. Predictions provided in this section suggest that maximum thicknesses could reach approximately 8.6 cm
within 100 m from the deposition area.
16 HPD SL 3.5 Synthetic-based Whole
Mud Spill Trajectory
Modelling, P. 3-52
The EA indicates that the SBM would biodegrade over several weeks; however, the properties are unknown. Please
provide references or evidence to support this claim.
17 HPD SL Tables 3-50 to 3-52, P. 3-
62 to 3-63
Oil spill information presented in these tables is based on data from 1987 to 1997. Although, previous EAs have also
used the same data, it may be useful to incorporate more recent information as available.
18 HPD SL 5.2 Scope of
Environmental
Assessment, P. 5-2
See comment G-1.
19 DFO (Sci.) 5.3.1 Step 1 - Scoping
Issues and Selecting
Valued Environmental
Components, P. 5-7
The EA states “Populations of marine mammals and some sea turtle species migrate to the Offshore Study Area
primarily to forage for food”. It should be noted that some marine mammal species and the Leatherback Sea Turtle
also migrate to the nearshore study area to feed in the summer and fall. The draft Critical Habitat for the
Leatherback Sea Turtle may encompass part of the southern Placentia Bay area so this may require further
mitigation and monitoring.
21 DFO (Sci.) 8.3.1.5 Fish and Shellfish –
Capelin, P. 8-22
The statement: “…migrate to deeper waters to spawn offshore at depths up to 125 m (likely when conditions for
beach spawning are not ideal” is incorrect. Nakashima and Wheeler (2002) indicate that spawning occurs subtidally
when water temperatures at the beach are too warm. Furthermore, this redirected spawning occurs in coastal waters
generally at depths considerably less than 125m. Please adjust the statement appropriately.
Husky Energy White Rose Extension Project Environmental Assessment Report
December 2012
Review Comments March 15, 2013 Page 57 of 68
The statement that eggs “…remain in the sediment for 14 to 52 days…” is not supported by Scott and Scott (1988) as
indicated in the document. Scott and Scott (1988) indicate that eggs hatched in the beach from 9 to 24 days
depending on where they were in the intertidal zone. If this statement is in reference to demersal spawning on the
Southeast Shoal where water temperatures are much cooler, 52 days may be acceptable.
22 DFO (Sci.) 8.3.1.5 Fish and Shellfish –
Capelin, P. 8-23
The statement that juvenile Capelin in the nearshore prefer eelgrass habitat should be supported with a reference.
Most juvenile Capelin are found offshore where eelgrass does not occur. The following statement “….except in
autumn, when they have a reverse vertical migration (migrate to the surface during the day)” that is attributed to
Mowbray (2002) is incorrect.
23 DFO (Sci.) 8.3.1.5 Fish and Shellfish –
Herring, P. 8-23
The description for Herring should be updated using DFO (2012).
24 HPD SL 8.4.1.2 Concrete Gravity
Structure Construction and
Installation, P. 8-41
The EA states that a gated structure could be installed at the entrance of the graving dock post-flooding. Installation
of the gate should be included in the assessment as an activity resulting in potential impacts to fish and fish habitat.
25 EAMP LN 8.4.4 Summary of Potential
Environmental Effects,
Table 8-5, P. 8-43
i. Under Subsea Drill Center Installation, installation of subsea equipment: “x/+” should be depicted under Change
in Habitat Quantity, as habitat is being lost as a result of the placement of equipment on the seafloor.
ii. Under Potential Future Activities, excavation of drill centers: “-“ should be depicted under Potential Mortality,
as there will likely be loss of benthic organisms as a result of the excavation and disposal of dredge spoils.
iii. Under Wellhead Platform Installation/Commissioning, Dredging and disposal of dredge material should have
“X” for Potential Mortality
iv. Under Potential Future Activities, Installation of Pipeline(s) and Testing from Drill Centres to FPSO, including
Flowline Protection should have an “X” for Potential Mortality.
26 HPD SL 8.5.1.1 Graving Dock
Construction, P. 8-46
As discussed in the EA, The Pond will be drained prior to disposal of the graving dock and dredge spoils. However,
given the permeable nature of the berm/barasway, please provide justification/evidence to illustrate that there will be
no contamination or sedimentation from The Pond into the marine environment.
Also, it should be noted that appropriately sized screens should be employed during the draining of The Pond as
noted above (S-4).
Husky Energy White Rose Extension Project Environmental Assessment Report
December 2012
Review Comments March 15, 2013 Page 58 of 68
27 HPD SL 8.5.1.2 Concrete Graving
Structure Construction and
Installation, P. 8-50
The proposed Dredging Area nearshore was originally proposed to be 24,150 m2
(as stated in the Marine Habitat
Characterization Report, 2012), whereas the EA indicates that a significantly smaller area will be dredged/excavated
(55 m x 200 m). Please confirm the actual amount of habitat that will be potentially affected. Also, depending on the
final design of the graving dock entrance (i.e. gated or left open), additional habitat protection measures may be
required. Measures to offset the impacts to fish habitat as a result of dredging/excavation of eelgrass beds and other
productive nearshore habitats should be included. The EA should demonstrate that there are sufficient mitigation
measures in place to ensure there are no significant adverse environmental effects.
As discussed above (S-8), please confirm there will be no change in the quantity of fish habitat at the deep-water
mooring points.
28 EAMP LN 8.5.1.2 Concrete Graving
Structure Construction and
Installation
Table 8-6 /P 8-52
The Ecological/Social/Cultural/Economic Significance should be rated “2 (Evidence of existing adverse activity)”.
29 HPD SL 8.5.1.3 Accidental Events
in the Nearshore, P. 8-54
The potential collapse of the settling pond at The Pond and a breach at the berm/barasway resulting in a
sedimentation event in the marine environment are potential accidental events that should be included in this section.
30 EAMP LN 8.5.1.3 Accidental Events
in the Nearshore
P 8-59
In the nearshore, another accidental event that could potentially have an adverse effect on fish and fish habitat is a
oil spill near a capelin spawning beach during a sensitive time of the year.
31 EAMP LN 8.5.2.2
Production/Operation and
Maintenance
Table 8-8 / P. 8-64
i) The Ecological/Socio/Cultural/Economic Significance should be given a lower rating of 2 = evidence of
existing adverse activity. In fact, this would apply for any of the potential effects assessment summary tables.
ii) The change in habitat quantity for flowline rock berms is Negative as well as Positive.
32 HPD SL 8.5.2.2
Production/Operation and
Maintenance, P. 8-67
It is important to note that even though Husky Energy has already been previously authorized for the footprint of the
CGS, this will cause a change in fish habitat quantity and therefore should be included. Although a “reef effect” may
occur at the installation site, it is temporary in nature as the CGS will be removed during decommissioning.
33 HPD SL 8.5.2.3 Offshore
Decommissioning and
Abandonment, P. 8-69, 8-
72
As stated above (S-10), the removal of rock berms and flowlines which were approved as compensation for fish
habitat loss may constitute a harmful destruction of fish habitat and as such could require a Fisheries Act
Authorization.
Husky Energy White Rose Extension Project Environmental Assessment Report
December 2012
Review Comments March 15, 2013 Page 59 of 68
34 HPD SL 8.5.2.4 Potential Future
Activities, P. 8-72
Future maintenance of drill centers could result in further harmful alteration and/or destruction of fish habitat
depending on the magnitude and extent of operations. For large-scale maintenance projects and extensive
installations of new equipment, Husky is advised to consult DFO to determine whether there are any Fisheries Act
implications.
35 EAMP LN 8.5.2.4 Potential Future
Activities
Table 8-11 / P 8-74
i) The intentions surrounding the potential future activities should be clarified as the potential effects associated
with activities or components outside of the current project description would be subject to regulatory view
and may require additional EA.
ii) The Ecological/Socio/Cultural/Economic Significance should be given a lower rating of 2 = evidence of
existing adverse activity.
iii) Please provide clarification on the mitigation measure referring to s.32 Fisheries Act Authorization. The
issuance of a s.35(2) Fisheries Act Authorization is more accurate.
36 HPD SL 8.5.3.1 Nearshore, P. 8-80
As described in the general comments (S-4), submarine cables and other obstacles may be present in the coastal
environment which could pose a risk during dredging activities.
37 HPD SL 8.5.5 Follow-up and
Monitoring, P. 8-83
Fish habitat compensation monitoring will be required as a condition of the s. 35(2) Fisheries Act Authorization to
be issued for the harmful alteration or destruction of fish habitat associated with the dredging/excavation activities
within the immediate vicinity of the graving dock.
38 EAMP LN 11.4.4 Summary
Table 11-9 / Pg 11-57
12.4.1.5 Summary
Table 12-4 / Pg 12-61
i) Avoidance should be considered a Change in Habitat Quantity associated with seismic activities.
ii) Collisions should be considered as Potential Mortality associated with Cumulative Effects.
39 EAMP LN 11.5.1.1 Graving Dock
Construction,
Table 11-10, P. 11-61
Avoiding mammal concentrations, maintaining a steady course and safe speed (identify limit, i.e., less than 26
km/hr) should be mandatory rather than “when possible”, otherwise, conditions not likely to implement a safe speed
should be identified.
40 EAMP LN 11.5.2.5 Accidental Events,
P. 11-87
Please provide additional rationale why the Killer Whale population-level effects conclude “no population-level
effects.”
41 EAMP LN 12.2 Definition of
Significance, P. 12-2
The qualifying statement, “…if a population is vulnerable to extinction” should be removed from the definition.
This also applies to inclusion of “vulnerable to extinction” in the summary on page 12-71.
Husky Energy White Rose Extension Project Environmental Assessment Report
December 2012
Review Comments March 15, 2013 Page 60 of 68
42 DFO (Sci.) 12.3 Existing Environment,
Table 12-3, P. 12-5
For Smooth Skate, Table 12-3 should also state “Southern NF population has moderate potential for occurrence in
Nearshore Study Area”. This addition also applies to Page 12-25 (para. 4).
The second most common skate species caught in the inshore NF/Subdiv. 3Ps skate fishery is Smooth Skate
(Malacoraja senta), all discarded at sea; albeit not SAR population of the Funk Island Deep DU.
43 DFO (Sci.) 12.3 Existing Environment,
Table 12-3, P. 12-6
For Blue Shark, Table 12-3 should read “Prionace glauca”; not “Priomace glauca”. Also should read “Cape
Hatteras”; not “Cape Hattaras” for Spiny Dogfish (Squalus acanthias) and elsewhere.
The EA statement, “Most abundant along the coast of Nova Scotia and offshore Scotian Shelf” is irrelevant to this
Newfoundland EA study; however, Blue Sharks (Prionace glauca) are an abundant regular seasonal visitor to
Newfoundland waters.
44 DFO (Sci.) 12.3 Existing Environment,
Table 12-3, P. 12-7
For Basking Shark, Table 12-3 should read “Low to moderate potential for occurrence in Nearshore Study Area
during summer”; not “Low”. Also, the table should read “Usually present in surface waters of Newfoundland bays
feeding on plankton from May to September.” This correction also applies to Page 12-40 (para. 2).
45 DFO (Sci.) 12.3 Existing Environment,
Table 12-3, P. 12-7
For Thorny Skate, Table 12-3 should read “Moderate to high potential for occurrence in Nearshore Study Area; not
“Moderate” as suggested. This correction also applies to Page 12-44 (para. 2).
46 DFO (Sci.) 12.3.1.2 Wolffish, P. 12-9 Regarding the following statement, “No wolffish were observed during the nearshore ROV habitat survey of
Argentia and area”, any conclusions are dependent upon the date(s), time of day, survey depth(s), and remotely
operated vehicle (ROV) proximity to bottom topographic features. The ROV survey was conducted “outside” of the
Atlantic Wolffish (Anarhichas lupus) spawning/nesting season; therefore, it is not unexpected to find low/no
observations of adults “near shore”. If this ROV survey was conducted “within” the wolffish spawning/nesting
season, this conclusion may change. Therefore, the specifics of the ROV survey are crucial for the validation of
conclusions in regard to wolffish in the proposed Argentia Peninsula (i.e., Nearshore) development.
47 DFO (Sci.) 12.3.1.2 Wolffish, P. 12-11 The following statement, “Females guard the nests”, is incorrect and the cited references do not support those
statements. For all three wolffish species, the adult male of each mated pair guards and aerates the resultant egg
mass (i.e., “nest”) until hatching.
Husky Energy White Rose Extension Project Environmental Assessment Report
December 2012
Review Comments March 15, 2013 Page 61 of 68
48 DFO (Sci.) 12.3.1 Marine Fish Species
at Risk, Figures 12-1 to 12-
7, 12-9 to12-12, 12-14 to
12-16, and 12-18
Please update the figures as more recent data is available.
49 DFO (Sci.) 12.3.1.3 Atlantic Cod, P.
12-15
The distribution plots for Atlantic Cod (and other species using Kulka et al. 2003) are based on data from 2000 and
should be updated, particularly in relation to baseline information for the project.
50 DFO (Sci.) 12.3.1.5 Porbeagle Shark,
P. 12-22
The statement, “Porbeagle are also caught as bycatch in other fisheries…of the 57 mt of discards annually” (based
on Campana et al. 2011), underestimates fishing bycatch mortality for this species. A more realistic
estimate/fisheries overview can be obtained from Benjamins et al. (2010). This paper also considers several other
SAR shark species including Shortfin Mako, Spiny Dogfish, Blue Shark, and Basking Shark.
51 DFO (Sci.) 12.3.1.8 Redfish, Figure
12-9, P. 12-27
The distribution plots for redfish indicate very low relative abundance except for an occasional hot spot. This was
not expected and should be reviewed for accuracy. In addition, the low abundance of the distribution plots for
redfish appear to contradict the results of the DFO RV survey in Div. 3L for 2010 and 2011 where Deepwater
Redfish (Sebastes mentella) is the dominant species by weight both years (Page 8-34).
52 DFO (Sci.) 12.3.1.12 Atlantic Salmon,
P. 12.32
For the south coast of Newfoundland, Atlantic salmon (Salmo salar) remain in the river until age three or four, not
“age two”. The species is no longer valued as “commercial fisheries” (also delete sentence 2 of para. 6). The third
sentence of para. 2 should be revised because salmon breed in other areas besides the southeast tip. In para. 5, the
last sentence should state “20 percent for small salmon and by 11 percent for large salmon.” Note that the small
salmon are adults. In Figure 12-13, “post-smelt” should be post-smolt.
53 DFO (Sci.) 12.3.1.18 Thorny Skate, P.
12-44
The statement, “Simon and Frank (2000) found that in the skate fishery on the eastern Scotian Shelf…majority was
Winter Skate”, is irrelevant to this EA study. Instead, scientific papers reporting on the annual Newfoundland skate
fishery - in which 95% of the skate catch is Thorny Skate (Amblyraja radiata) - should have been used.
This fact, “95% of the skate catch is Thorny Skate”, also applies to the skate fishery in Placentia Bay; rather than the
ambiguous EA statement, “is thought to be Thorny Skate”. (Simpson and Miri, 2012).
54 DFO (Sci.) 12.5.1.1 Nearshore, P. 12-
97 and 12-98
Previous published studies of the possible effects of pile driving are discussed, but not in relation to the pile driving
activities proposed in the EA. In addition, there is no mention of sound output into the marine environment from
pile driving in Section 17.2.1.
Husky Energy White Rose Extension Project Environmental Assessment Report
December 2012
Review Comments March 15, 2013 Page 62 of 68
55 DFO (Sci.) 12.5.1.1 Nearshore, P. 12-
120
The EA states that “Although effects of the Exxon Valdez oil spill were substantial on killer whales, killer whales
are uncommon in Placentia Bay, and no population-level effects would be expected.” This conclusion may be
incorrect based on the apparent small size of the Northwest (NW) Atlantic Killer Whale population. Even if the
number of known individuals reaches 100, loss of one or two animals would represent a “population-level effect”.
56 12.5.2.2 Offshore, P. 12-
126
Please specify a “safe speed” for project vessels. To ensure no mortality to listed marine mammals or sea turtles the
safe speed would be (an unrealistic) zero knots. And it is unlikely that vessels transiting in night, fog, or high wave
height conditions will be able to detect, much less, avoid a sea turtle or beaked whale.
57 DFO
Oceans
13.0 Sensitive Areas, P.
13-1
The definition for sensitive areas quoted from the Scoping Document differs from the sensitive areas definition that
has been used for other recent strategic and project based EAs (ex. Western Newfoundland SEA Update). In
addition, in some assessments, sensitive areas are grouped with “special areas” (Western Newfoundland SEA),
referred to as “potentially sensitive areas” (Southern Newfoundland SEA) or simply referred to as “special areas”
(Laurentian Sub-Basin SEA). In the interest of clarity and consistency, it is suggested that the C-NLOPB identify a
common, comprehensive definition and use common terminology for all SEAs and project based EAs when
referring to special and sensitive areas.
58 DFO
Oceans
13.3 Existing Environment,
P. 13-5
Please provide consistency in reference to the CPAWS Special Marine Areas. There are three areas not two areas, as
specified in the EA. These three Special Marine Areas should be depicted on a map as they are currently not shown
in the document.
59 DFO
Oceans
13.3.1 Nearshore, P. 13-6 The EA states: “…The Placentia Bay Extension EBSA (which includes all of Placentia Bay) is ranked second by
DFO (2007b) in priority among the 11 identified EBSAs within the PBGB LOMA as candidate sites for designation
as an MPA…”. The Placentia Bay Extension EBSA was not ranked second in relation to priority for Marine
Protected Area designation. The area scored second out of the 11 EBSAs in relation to the criteria evaluated to
determine the ecological or biological significance of the areas examined by DFO Science. The EA document refers
to these criteria on p.13-16 in Section 13.3.2.1. The identification of EBSAs is not restricted to considerations for
MPA designation. While portions of EBSAs may be potentially considered for MPA designation, there are a suite of
potential management measures that may be established for EBSAs, not just strict protection. It is suggested that the
proponent refer to Appendix 1 of the Southern Newfoundland Strategic Environmental Assessment
http://www.cnlopb.nl.ca/pdfs/snsea/snseaapp1.pdf where DFO submitted a clarification of the purpose for


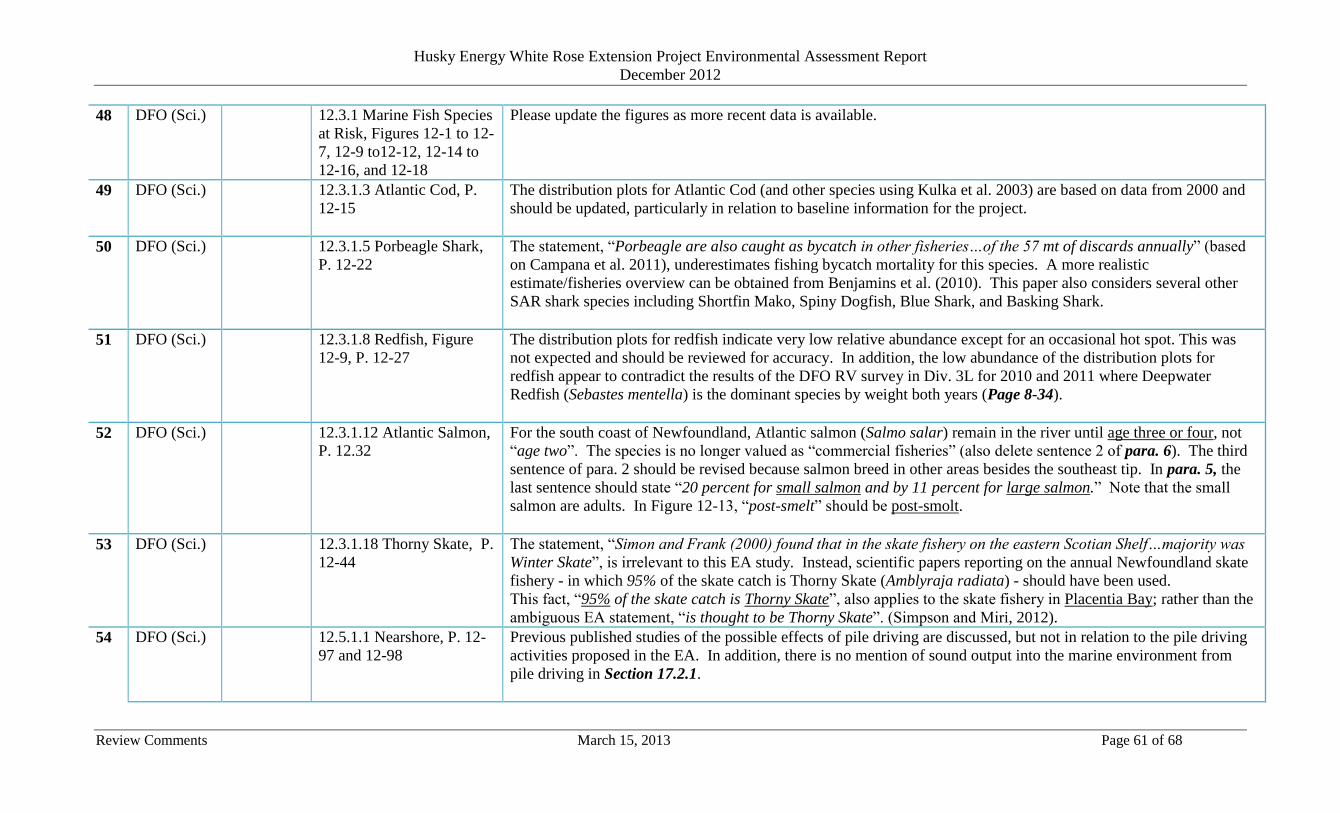


![27849394 Canada and Environment[1]](https://static.documents.pub/doc/80x56/577d38d41a28ab3a6b9892da/27849394-canada-and-environment1.jpg)


