20

Aviation Outlook OverviewBy ICAO Secretariat
ICAO ENVIRONMENTAL REPORT 201018
This chapter presents ICAO’s outlook on global demand for airtransport services, as well as projections of future aircraft noiseand emissions. The trends presented in this chapter weredeveloped by ICAO’s Committee on Aviation EnvironmentalProtection (CAEP) and the ICAO Secretariat.
Air Traffic OutlookEconomic growth, fuel price volatility, airline productivity gains,the evolution of low cost carriers and the liquidity position of theair carriers are reviewed in the context of the past history andprojected future trends for air traffic demand.
Noise OutlookAlthough aircraft being produced today are 75% quieter thanthose manufactured 50 years ago, aircraft noise remains themost significant cause of adverse community reaction relatedto the operation and expansion of airports worldwide. Thisoutlook reviews the tremendous progress being made inaircraft noise technology and the projected trends of aircraftnoise through the year 2036.
Local Air Quality OutlookThe health and well-being of all people is affected by the qualityof the air that they breathe. While aircraft emissions typicallycontribute a small percentage to the overall emissions loadingwithin a region, particularly in urban areas, ICAO has set strictemissions certification requirements for nearly 30 years. Thisoutlook reviews projected trends of aircraft emissions thataffect local air quality through the year 2036.
Climate Change OutlookAs the world has become increasingly concerned with globalclimate change, ICAO has taken the lead in addressing inter-national aviation’s contribution, which is estimated by the IPCCto be less than 2% of global human-made CO2 emissions. Asthis outlook discusses, projections of global aviation fuelconsumption and efficiency through the year 2050 reveal thaton a per flight basis, fuel efficiency is expected to improve overthe period. However in absolute terms an emissions “gap”could exist relative to 2006 or earlier in order to achievesustainability. For this reason, ICAO has established the firstand only globally-harmonized agreement from a sector on agoal to address its CO2 emissions and continues to pursueeven more ambitious goals.
Key PointsThe key points from the articles in this part of the report canbe summarized as follows:
● The world’s airlines carry around 2.3 billion passengersand 38 million tonnes of freight on scheduled services,representing more than 531 billion tonne kilometrescombined.
● Passenger traffic is expected to grow at an average rate of 4.8% per year through the year 2036.
● Overall, global trends of aviation noise, emissions thataffect local air quality, and fuel consumption predict an increase through the year 2036 at less than the 4.8% growth rate in traffic.
● In 2006, the global population exposed to 55 DNLaircraft noise was approximately 21million people. This is expected to increase at a rate of 0.7% to1.6% per year through the year 2036.
● In 2006, 0.25 Mt of NOx were emitted by aircraft within the LTO cycle globally. These emissions are expected to increase at a rate of between 2.4% and3.5% per year.
● In 2006, aircraft consumed approximately 187Mt of fuel globally.
● International flights are responsible for approximately62% of global aviation fuel consumption.
● Global aircraft fuel consumption is expected to increaseat a rate of between 3.0% and 3.5% per year.
● Environmental standards set by ICAO and the investments in technology and improved operational procedures are allowing aviation’s noise, local air quality, and CO2 footprints to grow at a rate slower than the demand for air travel.
● The ICAO Programme of Action on International Aviation and Climate Change, agreed in 2009, set a goal of 2% annual fuel efficiency improvement through the year 2050. It is the first and only globally-harmonized agreement from a sector on a goal and on measures to address its CO2 emissions. ICAO continues to pursue even more ambitious goalsfor aviation’s contribution to climate change. n
AVIATION OUTLOOK
AVIATION AND CLIMATE CHANGE 19
AVIATION OUTLOOK
Historical Growth of Air TravelOver the period 1989-2009, total scheduled traffic, meas-ured in tonne kilometres performed, grew at an averageannual rate of 4.4%. In 2009, the world’s airlines carriedabout 2.3 billion passengers and 38 million tonnes offreight on scheduled services.
The financial crisis of 2008 followed by the 2009 recessioncaused a severe decline in all air transport areas and signif-icantly impacted the average air traffic growth rates for1999-2009 which fell compared to previous decades, ashighlighted in Table 1.
However, in the last ten years, the airline industry has grownin absolute size, showing an increased diversity in the cate-gorization of airlines operating in the different markets.Thanks to liberalization in many countries, completely newtypes of airlines have been entering the air transportmarket. These new entrants, mainly Low Cost Carriers(LCCs), which refers to their low cost operating basis, havehad a dramatic impact on air traffic growth in all parts of theworld.
Factors that Promote or Constrain Air Traffic GrowthEconomic growth and falling ticket prices expressed in realterms are the main drivers of air traffic growth. Whileeconomic growth is largely determined outside the industry,airfares reflect� many factors that are determined mostly bythe industry environment.
Over the previous five decades, better aerospace technologyhas allowed airlines to increase their management efficien-cies, thereby enabling them to lower their costs. The endresult is that the passengers have been the greatest benefi-ciaries of these technical improvements. In parallel, liberal-ization of aviation markets, resulting in increased airlinecompetition, has ensured that customers benefit from lowerairline costs through lower ticket prices. A decrease in fareshas encouraged people of all incomes to travel more,causing a growth in air travel demand significantly largerthan what economic growth alone would have created.
Consequently, airlines have adapted their business models.LCCs started operating flights to airports that were under-served by the incumbents, building on their competitiveadvantage, and attractive air fares. The regional airlinescontinued to operate short haul routes, mainly as a feederfor the hub and spoke network of a large airline, and thelegacy carriers reacted to LCCs by lowering their fares andby adopting many of the LCC’s attributes. This shift hasblurred the distinction between the business models ofLCCs and legacy airlines.
A more liberalized regulatory environment provides stimulusto the growth of commercial aviation, but may also putpressure on aviation infrastructure, States capabilities forsafety oversight and other technical regulations, operatingyields of airlines (due to heightened competition) and envi-ronmental protection. The profit margin has been very smallfor commercial airlines. Despite some consistently prof-itable exceptions, most airlines have performed very poorlyfor investors. Average operating margins between 1999and 2009 ranged from 3.8% to 4%; showing insufficientlevels to cover overheads, generate a profit, or attract newcapital. Intense price competition under liberalized regimes,including those from LCCs, coupled with increasing andwidespread use by consumers of low fares rendered byinternet search engines, have contributed to the reducedearnings.
Air Traffic OutlookBy ICAO Secretariat
Passenger-kilometres performed (PKPs)Freight tonne-kilometres performedMail tonne-kilometres performedTotal tonne-kilometres performed
1979-19895.37.44.05.8
1989-19994.76.61.25.2
1999-20094.32.6-2.73.7
Average annual growth (%)
Table 1 – Trends in Total Scheduled Air Traffic (1979-20091)2009 ICAO Provisional Data

ICAO ENVIRONMENTAL REPORT 201020
AVIATION OUTLOOK
On the cost side, the inherent volatility of fuel prices willcontinue to cause short term changes in operating costs. Inearly 2008 crude oil price was on average US$ 80 perbarrel, before reaching in July 2008 US$ 134 and endingthe year at around US$ 40. In 2008, fuel accounted for30% of total airline operating expenses. The fuel pricehedging practice was highly profitable for some carriers,enabling them to offset severe losses in their core business,while leading to large losses for other airlines.
Liberalization and the severe 2009 economic downturnhave encouraged airlines to optimize the use of their assets,as shown in Table 2. Higher load factors, resulting frombetter capacity supply management, helped airlines tomaintain revenues while average ticket prices have fallen.The higher aircraft utilization resulted from greater aircraftreliability and versatility, and the decline in average aircraftcapacity after 1989 could notably be attributed to the intro-duction of regional jets and the extended ranges of tradi-tionally short haul aircraft.
Despite the current industry’s profitability issues, ICAO’straffic forecasts are assuming that growing demand for airtravel will ensure that the airline industry has continuedaccess to capital markets, in order to enable the renewal ofthe different assets needed to operate an airline.
Air Traffic ForecastsThe new ICAO forecast methodology uses a sophisticatedset of econometric models, combined with industry knowl-edge at a global and regional level. The forecasts considerboth quantitative relationships, such as the impact ofeconomic growth on traffic, and insights about the factorsdriving growth in each geographical market. The latter, dueto their qualitative nature, could not be factored into themodels. The world has been divided into 9 forecastingregions defining 53 route groups ( 36 international markets,8 intra-region market and 9 domestic markets ), with anadditional non-scheduled segment. ICAO produces fore-casts of revenue passenger-kilometres through to 2030
extended to the 2040 horizon which could be required forsome environmental analysis.
The future growth of air traffic will depend on the economicgrowth and on the technological advances that allowdecreasing the cost of air travel. Besides, market liberaliza-tion has greatly stimulated air traffic growth in the past andwill continue to do so. It has been observed that during thefirst steps of the liberalization process, the growth rates arethe fastest and they stabilize to a standard level, after themarket has absorbed the changes.
According to economic forecasters, annual economic growthbetween 2010 and 2030, expressed in terms of percentchange in Gross Domestic Product (GDP), will range from 2%in North Asia to 6.9% in China. The developed economies ofNorth America, Japan and Western Europe will experienceslow growth because of the economic maturity of their aginglabour forces. The developing areas of Asia, Latin America,Eastern Europe and Africa will see strong and sustainedgrowth. As a result, at the world level, GDP, expressed in realterms and calculated on the basis of Purchasing PowerParity (PPP), is expected to grow on average at 4% per year.
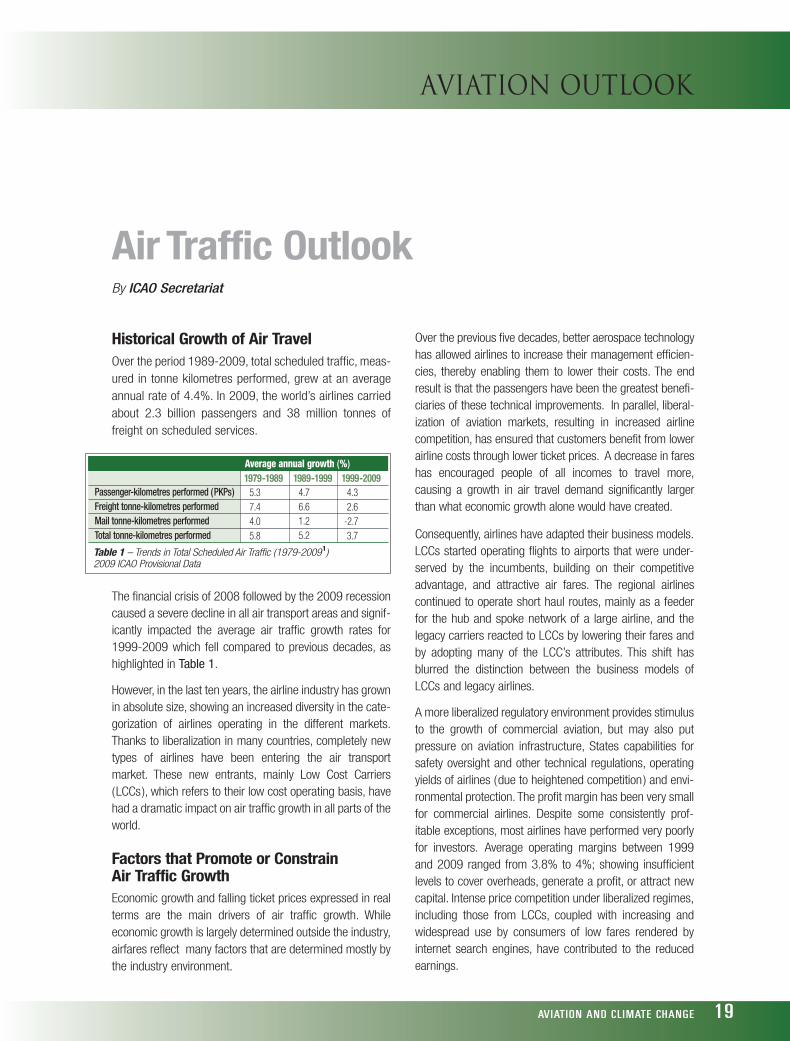
Accordingly, the forecasts of the current top ten markets arefeatured in Figure 1.
Domestic services in North America will grow at the lowestrate of any of the top ten routes. However, their large magni-tude – the product of a large and prosperous economy andthe longest post-liberalization period (which has allowed theeffects of liberalization to be felt ), will preserve their leader-ship through to 2030. Domestic services in China willbenefit from the very high growth rates that will result fromeconomic development. The large scale of Western Euro-pean traffic and the growth of Eastern Europe will togethermake the Intra-European market, the third largest in 2030.
Based on these route groups forecasts, ICAO is derivingboth regional passenger forecasts for its statistical regions( as shown in Figure 2 ) and aircraft movement forecasts.
Passenger load factor (%)Aircraft utilization (hours per aircraft per year)Average aircraft capacity (seats)
1979662,068149
1989682,193181
1999692,770171
20092
763,502166
Table 2: Developments in Selected Elements of Airline Productivity (1979-2009)2009 ICAO Provisional Data, Source – ICAO Statistics Programs
AVIATION AND CLIMATE CHANGE 21
AVIATION OUTLOOK
Air traffic will grow at rates set by, but larger than, the GDPgrowth in all world regions. The growth that will be regis-tered by Asia/Pacific airlines will reflect the expansion ofcivil aviation in China, India and Southeast Asia. The airlinesdomiciled in Middle East, Latin America and Africa will expe-rience very strong growth, although their small absolutesizes in 2010 will limit the resulting traffic increases.
The detailed regional analyses, forecasting methodologiesand results for ICAO traffic forecasts are available in a forth-coming publication which will be available in November2010. n
20-Year Growth %2.6%7.9%4.3%2.6%6.7%5.3%7.8%5.0%5.99.0
%World PKPs15.0%10.7%7.4%5.7%4.1%3.6%3.5%3.3%3.1%2.9%
Domestic North America
Domestic China
Intra Europe
North American - Europe
Domestic Pacific/South East Asia
Latin America/Caribbean - Europe
Europe - China
North America - Latin America/Caribbean
Europe - Africa
Middle East - Pacific/Southeast Asia
0 500,000 1,000,000 1,500,000 2,000,000PKPs ( Millions )
2009 2030
Figure 1: Top 10 Traffic flows in 2030.
4,500
4,000
3,500
3,000
2,500
2,000
1,500
1,000
500
0
12%
10%
8%
6%
4%
2%
0%
RPK
RPK
Gro
wth
201
0-20
30
Asia/PacificEurope
North America
Middle East
Latin Am./Carib Africa
Asia/Pacific
Latin Am./Carib
Middle EastAfrica
Europe
North America
1995 Change 1995-2010 Change 2010-2030 Growth Rate 2010-2030Legend
Figure 2: ICAO Passenger Traffic Forecasts by ICAO Statistical Region.
Since the introduction of modern jet aircraft in the 1960s,aircraft noise has remained the most significant cause ofadverse community reaction related to the operation andexpansion of airports worldwide. Limiting or reducing thenumber of people affected by significant aircraft noiseremains a key environmental goal for ICAO. The ICAO Envi-ronmental Report of 2007 provided detailed backgroundinformation on the issue of aircraft noise and the Standardsand Recommended Practices ( SARPs ) put in place by ICAOto mitigate these noise impacts. More information is alsoavailable in the report of the eighth meeting of ICAO’sCommittee on Aviation Environmental Protection ( ICAO Doc.9938 ) which contains a status update of CAEP’s work onthis issue. This article provides a high-level overview as wellas an update on some of the issues related to aircraft noisefirst described in the 2007 Environmental Report.
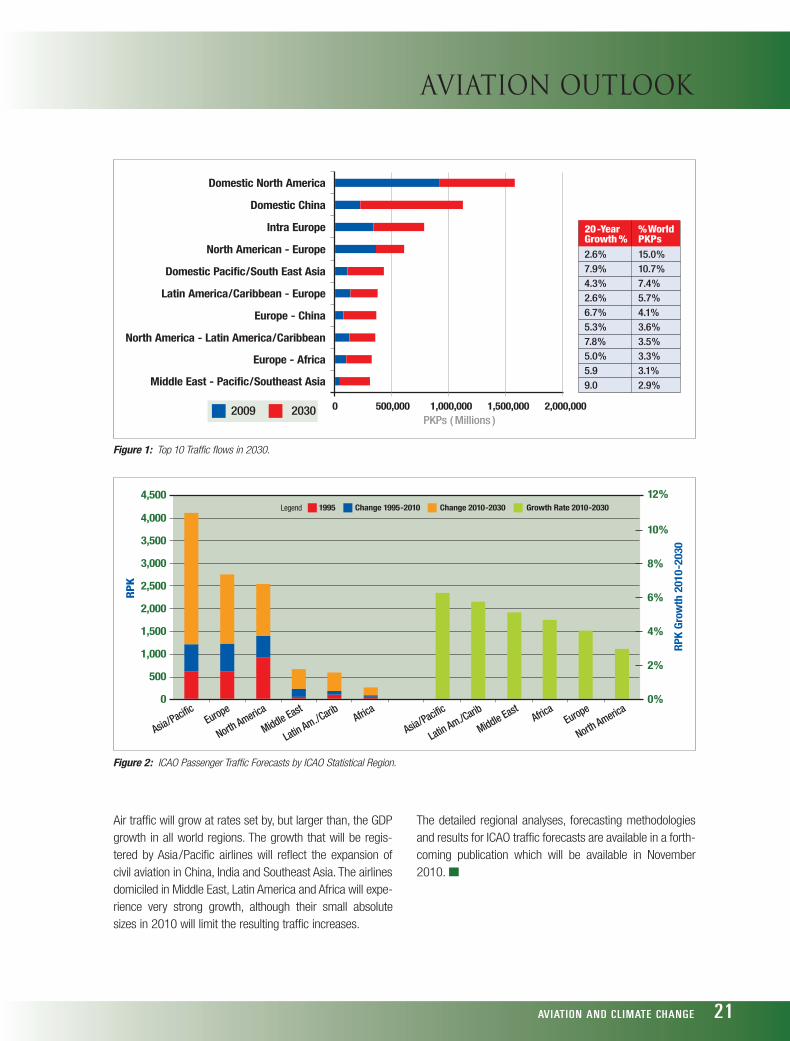
BackgroundBecause of improved aircraft noise SARPs developed byICAO, the number of people exposed to significant aircraftnoise has decreased by as much as 90% in parts of the
world over the last half century. Tremendous technologicaladvancements have made aircraft more than 75% quieterthan they were 50 years ago. Figure 1 illustrates this pointby plotting the cumulative aircraft noise relative to theChapter 4 Noise Standard ( see inset box on certificationpoints and Chapter 4 requirements ) in effective perceivednoise level expressed in decibels ( EPNdB 1 ) by year. Theaircraft are grouped by engine bypass ratio ( BPR2 ), a keydriver of overall aircraft noise.
On the other hand, the projected growth in air traffic meansthat the number of people exposed to significant aircraftnoise is expected to increase in the future rather thandecrease. In addition, because of the increased awarenessof environmental issues, the public has become moresensitized to aviation noise. For these reasons, aircraft noiseis expected to remain an environmental concern for theforeseeable future.
Noise OutlookBy ICAO Secretariat
ICAO ENVIRONMENTAL REPORT 201022
AVIATION OUTLOOK
50
40
30
20
10
0
-10
-201960 1970 1980 1990 2000 2010 Year
Chapter 2
Chapter 3
Chapter 4
Cum
ulat
ive
Noi
se R
elat
ive
to C
hapt
er 4
(EPN
dB)
BPR: less than 2BPR: 2 to 7BPR: greater than 7
Figure 1: Progress made in noise reduction at source since implementation of aircraft noise Standards - by engine bypass ratio ( ICCAIA 2008 ).
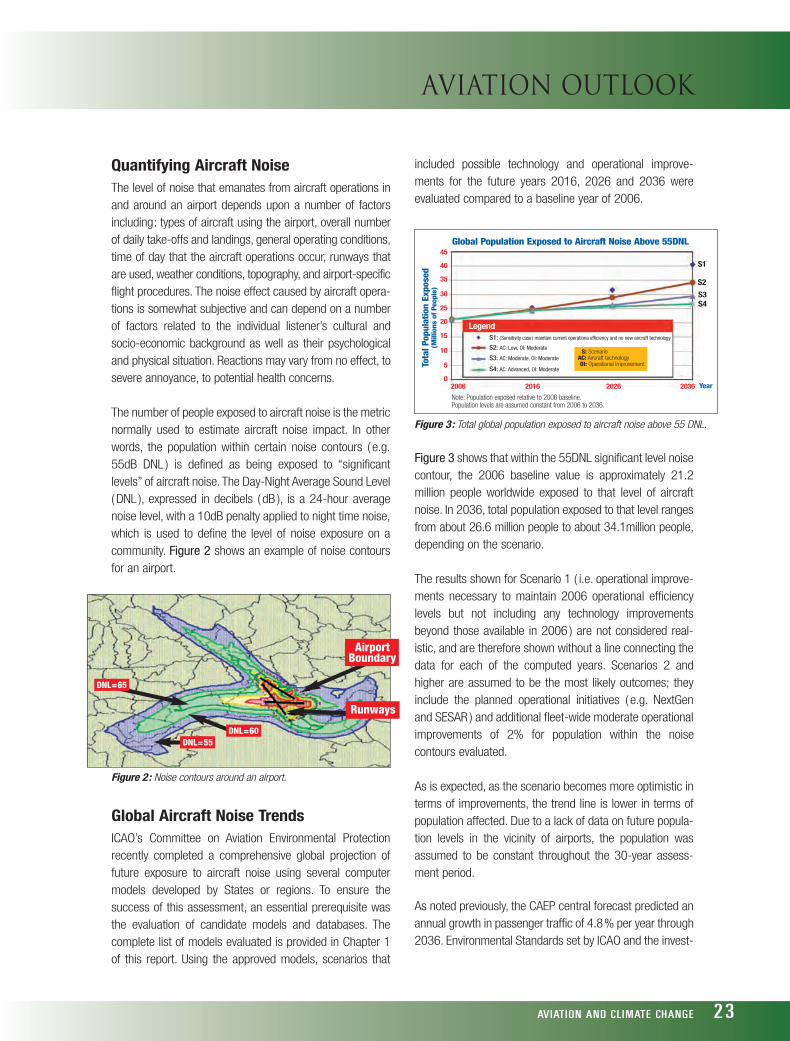
Quantifying Aircraft NoiseThe level of noise that emanates from aircraft operations inand around an airport depends upon a number of factorsincluding: types of aircraft using the airport, overall numberof daily take-offs and landings, general operating conditions,time of day that the aircraft operations occur, runways thatare used, weather conditions, topography, and airport-specificflight procedures. The noise effect caused by aircraft opera-tions is somewhat subjective and can depend on a numberof factors related to the individual listener’s cultural andsocio-economic background as well as their psychologicaland physical situation. Reactions may vary from no effect, tosevere annoyance, to potential health concerns.
The number of people exposed to aircraft noise is the metricnormally used to estimate aircraft noise impact. In otherwords, the population within certain noise contours ( e.g.55dB DNL ) is defined as being exposed to “significantlevels” of aircraft noise. The Day-Night Average Sound Level( DNL ), expressed in decibels ( dB ), is a 24-hour averagenoise level, with a 10dB penalty applied to night time noise,which is used to define the level of noise exposure on acommunity. Figure 2 shows an example of noise contoursfor an airport.
Global Aircraft Noise TrendsICAO’s Committee on Aviation Environmental Protectionrecently completed a comprehensive global projection offuture exposure to aircraft noise using several computermodels developed by States or regions. To ensure thesuccess of this assessment, an essential prerequisite wasthe evaluation of candidate models and databases. Thecomplete list of models evaluated is provided in Chapter 1of this report. Using the approved models, scenarios that
included possible technology and operational improve-ments for the future years 2016, 2026 and 2036 wereevaluated compared to a baseline year of 2006.
Figure 3 shows that within the 55DNL significant level noisecontour, the 2006 baseline value is approximately 21.2million people worldwide exposed to that level of aircraftnoise. In 2036, total population exposed to that level rangesfrom about 26.6 million people to about 34.1million people,depending on the scenario.
The results shown for Scenario 1 ( i.e. operational improve-ments necessary to maintain 2006 operational efficiencylevels but not including any technology improvementsbeyond those available in 2006 ) are not considered real-istic, and are therefore shown without a line connecting thedata for each of the computed years. Scenarios 2 andhigher are assumed to be the most likely outcomes; theyinclude the planned operational initiatives ( e.g. NextGenand SESAR ) and additional fleet-wide moderate operationalimprovements of 2% for population within the noisecontours evaluated.
As is expected, as the scenario becomes more optimistic interms of improvements, the trend line is lower in terms ofpopulation affected. Due to a lack of data on future popula-tion levels in the vicinity of airports, the population wasassumed to be constant throughout the 30-year assess-ment period.
As noted previously, the CAEP central forecast predicted anannual growth in passenger traffic of 4.8% per year through2036. Environmental Standards set by ICAO and the invest-
AVIATION AND CLIMATE CHANGE 23
AVIATION OUTLOOK
Figure 2: Noise contours around an airport.
Figure 3: Total global population exposed to aircraft noise above 55 DNL.
Global Population Exposed to Aircraft Noise Above 55DNL 45
40
35
30
25
20
15
10
5
02006 2016 2026 2036
S1
S2
S3S4
Total P
opulation Exposed
(Millions of People)
LegendS1: (Sensitivity case) maintain current operationa efficiency and no new aircraft technology
S2: AC: Low, OI: Moderate
S3: AC: Moderate, OI: Moderate
S4: AC: Advanced, OI: Moderate
S: ScenarioAC: Aircraft technologyOI: Operational improvement
Year
Note: Population exposed relative to 2006 baseline.Population levels are assumed constant from 2006 to 2036.
AirportBoundary
Runways
DNL=65
DNL=60DNL=55

ICAO ENVIRONMENTAL REPORT 201024
AVIATION OUTLOOK
ments in technology and improved operational proceduresare allowing aviation noise to grow at a rate far slower thanthe demand for air travel. The population exposed to aircraftnoise is expected to grow at an average annual growth rateof 0.7% to 1.6% under the central forecast, and for the lowdemand forecast case it is possible that, following a peak in2026, the global population exposed to significant aircraftnoise may actually decline.
ICAO Work on Aircraft Noise ReductionICAO has been addressing the issue of aircraft noise sincethe 1960s.3 The first Standards and Recommended Prac-tices ( SARPs ) for aircraft noise certification were published in1971 and have been updated since then to reflect improve-ments in technology. They are contained in Volume I ofAnnex 16 to the Convention on International Civil Aviation.Aircraft noise certification involves measuring the noise levelof an aircraft in EPNdB at three points: two during take-off( flyover and sideline ), and the third during the approach ( seeinset box on certification points and Figure 4 ).
Noise Certification Reference Points - DefinedFor noise certification, aircraft noise levels are measured at three certification points:
1- Fly-over: 6.5 km from the brake release point,under the take-off flight path.
2- Sideline: the highest noise measurement recorded at any point 450 m from the runway axis during take-off.
3- Approach: 2 km from the runway threshold, under the approach flight path. Cumulative levels are defined as the arithmeticsum of the certification levels at each of the three levels.
The initial standards for jet-powered aircraft designedbefore 1977 were included in Chapter 2 of Annex 16.Subsequently, newer aircraft were required to meetthe stricter standards contained in Chapter 3 of theAnnex. Starting 1 January 2006, the new Chapter 4standard became applicable to newly certificatedaeroplanes.
In September 2001, ICAO established a global policy toaddress aircraft noise, referred to as the “balanced approach”to noise management ( ICAO Doc 9829, Guidance on theBalanced Approach to Aircraft Noise Management ). Thispolicy has provided ICAO Contracting States with an inter-nationally agreed approach for addressing aircraft noiseproblems in a comprehensive and economically responsibleway. It is ultimately the responsibility of individual States toimplement the various elements of the balanced approachby developing appropriate solutions to the noise problemsat airports. This must be done with due regard to ICAOprovisions and policies, while recognizing that States mayhave existing constraints such as: relevant legal obligations,existing agreements, current laws and established policieson noise management. Any of these may influence the wayin which States implement the Balanced Approach.
Figure 4: Aircraft noise certification reference points.
AVIATION AND CLIMATE CHANGE 25
AVIATION OUTLOOK
ICAO/CAEP - Balanced Approach to Aircraft Noise Management
ICAO’s Balanced Approach consists of identifying thenoise problem at an airport and then analyzing thevarious measures available to reduce the noise, usingfour principal elements, namely:
1- reduction of noise at source;
2- land-use planning and management;
3- noise abatement operational procedures; and
4- operating restrictions.
The goal is to address the local noise problems on anindividual airport basis and to identify the noise-relatedmeasures that achieve maximum environmentalbenefit most cost-effectively using objective and meas-urable criteria.
An emerging issue over the last few years has been theimpact of night-time curfews related to noise at someairports on airports in other regions of the world. ICAOundertook a study to estimate the environmental impact ofcurfews in one region on other regions of the world. Basedon case-studies, it was concluded that, while the curfewsmay be a contributing factor to the transfer of night-timeaircraft movements from one airport to other airports, thereare probably a number of other influencing factors such astime zones, airline economics and passenger demand.
Aircraft Noise Reduction TechnologyReduction of aircraft noise at source is one of four prin-cipal elements of ICAO’s Balanced Approach to noisemanagement and it remains a cornerstone of the Organi-zation’s efforts to reduce the adverse effects of aircraftnoise on the public.
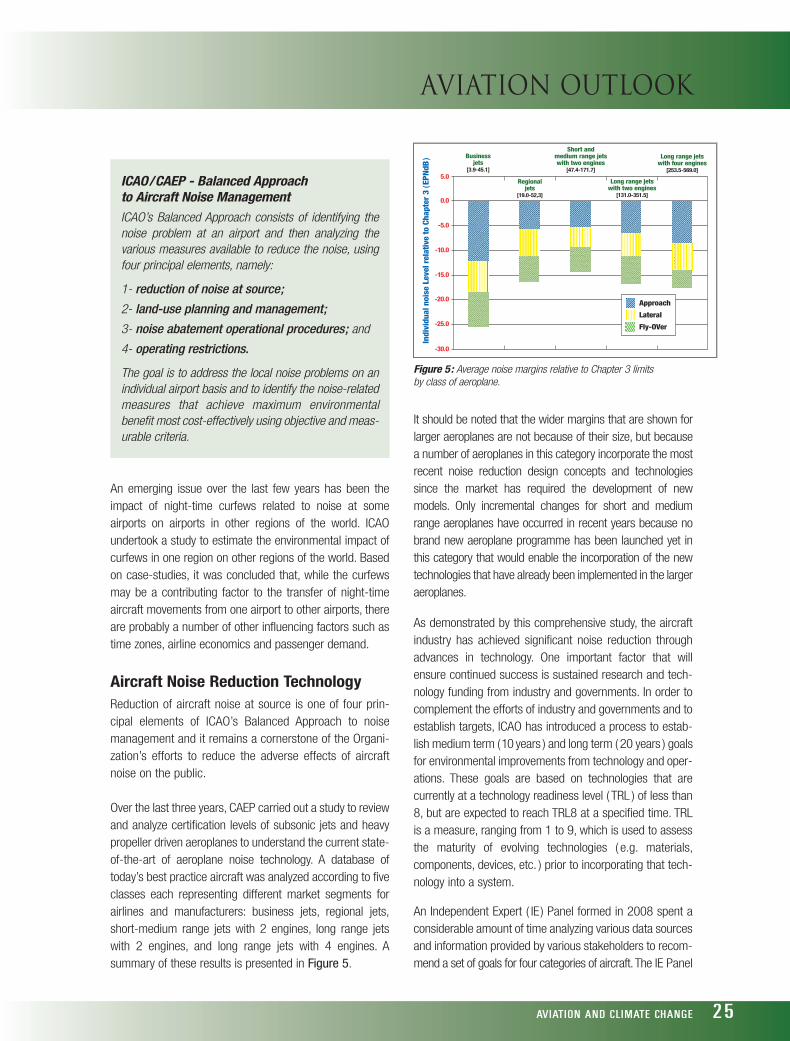
Over the last three years, CAEP carried out a study to reviewand analyze certification levels of subsonic jets and heavypropeller driven aeroplanes to understand the current state-of-the-art of aeroplane noise technology. A database oftoday’s best practice aircraft was analyzed according to fiveclasses each representing different market segments forairlines and manufacturers: business jets, regional jets,short-medium range jets with 2 engines, long range jetswith 2 engines, and long range jets with 4 engines. Asummary of these results is presented in Figure 5.
It should be noted that the wider margins that are shown forlarger aeroplanes are not because of their size, but becausea number of aeroplanes in this category incorporate the mostrecent noise reduction design concepts and technologiessince the market has required the development of newmodels. Only incremental changes for short and mediumrange aeroplanes have occurred in recent years because nobrand new aeroplane programme has been launched yet inthis category that would enable the incorporation of the newtechnologies that have already been implemented in the largeraeroplanes.
As demonstrated by this comprehensive study, the aircraftindustry has achieved significant noise reduction throughadvances in technology. One important factor that willensure continued success is sustained research and tech-nology funding from industry and governments. In order tocomplement the efforts of industry and governments and toestablish targets, ICAO has introduced a process to estab-lish medium term (10 years ) and long term ( 20 years ) goalsfor environmental improvements from technology and oper-ations. These goals are based on technologies that arecurrently at a technology readiness level ( TRL ) of less than8, but are expected to reach TRL8 at a specified time. TRLis a measure, ranging from 1 to 9, which is used to assessthe maturity of evolving technologies ( e.g. materials,components, devices, etc. ) prior to incorporating that tech-nology into a system.
An Independent Expert ( IE) Panel formed in 2008 spent aconsiderable amount of time analyzing various data sourcesand information provided by various stakeholders to recom-mend a set of goals for four categories of aircraft. The IE Panel
Figure 5: Average noise margins relative to Chapter 3 limits by class of aeroplane.
5.0
0.0
-5.0
-10.0
-15.0
-20.0
-25.0
-30.0
Indi
vidu
al n
oise
Lev
el rel
ativ
e to
Cha
pter
3 (EP
NdB
) Business jets
[3.9-45.1]
Regional jets
[19.0-52,3]
Short and medium range jets with two engines
[47.4-171.7]
Long range jets with two engines
[131.0-351.5]
Long range jets with four engines
[253.5-569.0]
Approach
Lateral
Fly-OVer

ICAO ENVIRONMENTAL REPORT 201026
AVIATION OUTLOOK
identified two contributors to aircraft system source noisereduction: cycle improvements related to BPR increase andcomponent noise reduction technologies. A modelling exer-cise was then undertaken to consolidate the results and toascertain the uncertainty associated with the noise levelgoals. The goals are given in terms of cumulative marginsrelative to the ICAO Annex 16, Chapter 4 limits. These Goalsare summarized in Table 1.
These goals are shown in graphical format in Figure 6.
The reduction of noise at source through technologyimprovements has always been one of the cornerstones ofICAO’s noise mitigation efforts. ICAO will continue to closelymonitor the latest developments in technology which mightlead to quieter aircraft and will translate this new technologyinto even more effective noise standards.
Next StepsThe eighth meeting of ICAO’s Committee on Aviation Envi-ronmental Protection ( CAEP ) in February 2010, identifiedthe need for further analyses to assess several stringencyscenarios in order to potentially improve the aircraft noiseStandards. The assessment results will be reviewed byCAEP/9 in 2013.
ICAO’s goal of sustainable growth is directly related tonoise where a major constraint on growth at the airportlevel is believed to be noise in the vicinity of airports. Otheremerging issues in this regard include the increasing noisefarther away from airports and introduction of new airtraffic procedures leading to concentration of noise incertain corridors. These additional issues need to beexplored and solutions provided to ICAO member States inthe form of SARPs.n
Table 1: Independent Expert Panel aircraft noise reduction technology goals.
Figure 6: Medium and long term technology goals for noise reduction technology.
EPNdB is a measure of human annoyance toaircraft noise which has special spectralcharacteristics and persistence of sounds. Itaccounts for human response to spectralshape, intensity, tonal content and duration ofnoise from an aircraft.
Bypass ratio refers to how much air goesthrough a jet engine’s propulsor versus howmuch air goes through its core.
For more information on ICAO work on aircraft noise, please see ICAO Environmental Report 2007, Chapter 2 – Aircraft Noise, www.icao.int/env/pubs/env_report_07.pdf.
1
2
3
References
Independent Expert Panel aircraft noise reduction technology goals
Aircraft Category
Regional JetSmall-Medium-Range TwinLong-Range TwinLong-Range Quad
Margin to Chapter 4 (EPNdB )Medium Term (2018)
13.0±4.621.0±4.620.5±4.621.0±4.6
Long Term (2028)
20.0±5.523.5±5.523.0±5.523.5±5.5
Long Term (2028) Cumulative Noise Goals
Cumulative Noise Level, EPN
dB
Max. Takeoff Mass (Tonnes)10 100 1000
310
300
290
280
270
260
250
240
RJSMR2
LR2
LR4Chapter 4 Limit
Long-Term Goal
Long-Term Upper Bound
Long-Term Lower Bound
Medium Term (2018) Cumulative Noise Goals
Cumulative Noise Level, EPN
dB
Max. Takeoff Mass (Tonnes)10 100 1000
310
300
290
280
270
260
250
240
RJSMR2
LR2
LR4Chapter 4 Limit
Mid-Term Goal
Mid-Term Upper Bound
Mid-Term Lower Bound

AVIATION AND CLIMATE CHANGE 27
AVIATION OUTLOOK
Local Air Quality OutlookBy ICAO Secretariat
The ICAO Environmental Report for 2007 provided detailedbackground information on the issue of aircraft emissions andthe Standards and Recommended Practices ( SARPs) put inplace by ICAO to mitigate local air quality concerns. Moreinformation is also available in the report of the eighthmeeting of ICAO’s Committee on Aviation EnvironmentalProtection ( CAEP/8, ICAO Doc 9938 ) which contains astatus update of the CAEP’s work on this issue. This articleprovides a brief summary as well as an update on some ofthe issues related to aircraft emissions that affect local airquality that were first described in Chapter 3 of the 2007ICAO Environmental Report1.
OverviewThe potential adverse effects of air pollutants released withinan aircraft’s landing and takeoff cycle ( LTO, nominally up to
3,000 feet or 915 meters above ground level ) primarilypertain to human health and welfare. The current ICAO Stan-dards for emissions certification of aircraft engines containedin Volume II of Annex 16 to the Convention on InternationalCivil Aviation were originally designed to respond toconcerns regarding air quality in the vicinity of airports. Toachieve certification, any engine must demonstrate that its char-acteristic emissions of HC (unburned hydrocarbons ), CO( carbon monoxide ), NOx ( oxides of nitrogen ) and smoke, arebelow the limits defined by ICAO. The contribution of aircraftemissions during the LTO cycle to the overall emissions in atypical urban area is small and the Standards set by ICAO aredesigned to ensure that they remain that way. The certificationprocess is performed on a test bed, where the engine is run atfour different thrust settings ( see Figure1 ), to simulate the
Taxi 26 min 7% Approach
4 min 30%
Take-off0.7 min 100%
Climb2.2 min 85%
Thrust settings
Figure 1: Illustration of ICAO emissions certification procedure in the LTO cycle.

ICAO ENVIRONMENTAL REPORT 201028
AVIATION OUTLOOK
various phases of flight, as follows:
- Takeoff ( 100% available thrust ) for 0.7 min;- Climb ( 85% available thrust ) for 2.2 min;- Approach ( 30% available thrust ) for 4.0 min; and- Taxi ( 7% available thrust ) for 26 min.
Dramatic progress in reducing the emissions from aircraftengines has been made since the first Standards were set.Unburned hydrocarbons have been virtually eliminated fromthe exhaust stream due to improved engine technologiesand visible smoke is also almost completely gone. However,ICAO’s focus is now shifting to improved understanding ofthe formation of aircraft particulate matter ( PM ), which issometimes referred to by the more general term, soot.Potential effects on human health due to various species ofemissions are described in Table 1.
Since the original NOx Standard was adopted in 1981, it hasbeen made 50% more stringent. CAEP/8 in February 2010reviewed the analyses of various scenarios of increased NOxstringency options, and agreed on a new NOx Standard
(CAEP/8 NOx Standard ). It improves on the current CAEP/6NOx Standard by between -5% and -15% for small engines,and by -15% for large engines; and will be in effect on 31December 2013. In addition, engines not meeting the currentCAEP/6 Standard will no longer be produced as of 31December 2012.
CAEP has also set mid and long-term technology goals foraircraft engine NOx emissions through a panel of inde-pendent experts ( see Setting Technology Goals, Chapter 3 ofthe 2007 Environmental Report ). Although NOx Standardswere initially intended to address local air quality, they alsocontribute to reducing the impact of aviation on climate.
Impact of Aircraft Emissions On Local Air Quality – TrendsIn 2010, CAEP completed a comprehensive global projectionof future emissions trends that affect local air quality. For thisanalysis, the aircraft engine emissions were projected for NOxand PM from aircraft operating at up to 3,000 feet ( 915metres ) above ground level. As with the noise analysis ( seeNoise Outlook, Aviation Outlook of this report ), aircraft emis-sions were modelled for a baseline year of 2006 and then for
the future years 2016, 2026, and 2036,across a range of scenarios that considereddifferent technological and operationaloptions, as per Table 2. For context, aircraftNOx emissions contribute between 70%and 80% of total airport NOx emissions.
Aircraft NOx emissions emitted at less than3,000 feet above ground level for thosescenarios is projected to increase from 0.25million metric tonnes (Mt ) in 2006 tobetween 0.52 Mt and 0.72 Mt in 2036 ( seeFigure2 ). These results are presented forthe central demand forecast case. Theanalysis shows that the results are particu-larly sensitive to the level of projected airtraffic demand. This corresponds to growthin NOx emissions of between 2.4% and3.5% per year, which is less than theprojected growth rate in traffic of 4.8%annually ( see Air Traffic Outlook, AviationOutlook of this report ).
Pollutant
CO – Carbon Monoxide
HC – Unburned Hydrocarbons( a primary component of Volatile Organic Compounds, or VOC )
NOx– Nitrogen Oxides
O3 – Ozone ( HC is a precursor for ground-level O3 formation )
PM – Particulate Matter( smoke is a primary componentof PM.)
Health Effect
● Cardiovascular effects, especiallyin those persons with heart conditions
● Eye and respiratory tract infection● Headaches● Dizziness● Visual disorders● Memory impairment
● Lung irritation● Lower resistance to respiratory infections
● Lung function impairment● Effects on exercise performance● Increased airway responsiveness● Increased susceptibility to respiratory infection
● Increased hospital admissions and emergency room visits
● Pulmonary inflammation, lung structure damage
● Premature mortality● Aggravation of respiratory and cardiovascular disease
● Changes in lung function● Increased respiratory symptoms● Changes to lung tissues and structure● Altered respiratory defence mechanisms
Table 1: Representative health effects from local air quality pollutants.2

AVIATION AND CLIMATE CHANGE 29
AVIATION OUTLOOK
Scenario 1 is the sensitivity case that assumes theoperational improvements necessary to maintain currentoperational efficiency levels, including the planned introduction of NextGen and SESAR, but does notinclude any aircraft technology improvements beyondthose available in current ( 2006 ) production aircraft.Since Scenario 1 is not considered a likely outcome, it is purposely depicted with no line connecting themodelled results in 2006, 2016, 2026 and 2036.
Scenario 2 is the moderate aircraft technology andoperational improvement case that assumes aircraftNOx improvements based upon achieving 50% of thereduction from the current NOx emission levels to theNOx emissions levels set by CAEP/7 NOx IndependentExpert goals review ( 60% +/-5% of current CAEP/6NOx Standard ) for 2026, with no further improvementthereafter. This scenario also includes fleet-widemoderate operational improvements by region.
Scenario 3 is the advanced aircraft technology andoperational improvement case that assumes aircraftNOx improvements based upon achieving 100% of thereduction from the current NOx emission levels to the NOx emissions levels set by CAEP/7 NOxIndependent Expert goals review for 2026, with nofurther improvement thereafter. This scenario alsoincludes fleet-wide advanced operational improvements by region that are considered to be an upper bound of those improvements.
In recent years, there has been considerable research into theformation of particulate matter (PM) and its effect on humanhealth. ICAO sets standards for smoke from aircraft engines,but has not yet set specific requirements for PM. Since PMemissions are not currently measured directly as part of theICAO engine certification process, they were estimated for theCAEP trends assessment using a technique called First OrderApproximation. The results for PM emissions at less than3,000 feet follow the same trends as those for NOx, althoughat significantly lower levels. The 2006 baseline value is 2,200metric tonnes and the total global aircraft PM is projected toincrease at a rate of 3.3% per year to a total of about 5,800metric tonnes in 2036.
Aircraft Airport Emissions Put Into ContextThe contribution of airport emissions to the overall emis-sions loading in the vicinity of airports is dependent uponthe emission sources surrounding the airport. For a typicalurban environment, airport emissions represent approxi-mately 10% of total regional emissions in the vicinity ofairports, whereas in more rural environments airport emis-sions would tend to be a higher percentage. In this case, theterm “region” refers to the local communities surrounding theairport ( i.e. within 50 km ).
Table 2: Scenarios used for the NOx analysis.
2006 2016 2026 2036
1.8
1.6
1.4
1.2
1.0
0.8
0.6
0.4
0.2
0.0Year
S1
S2
S3
Legend
S: ScenarioAC: Aircraft technologyOI: Operational
improvement
Total Aircraft NOxEmissions
(Million of Metric Tonnes)
S1: (Sensitivity case) maintain current operational efficiency and no new aircraft technology
S2: AC: Moderate, OI: Moderate
S3: AC: Advanced, OI:Advanced
Global Aircraft NOx Below 3,000 Feet
Figure 2 : Total global aircraft NOx below 3,000 feet (915 Metres ) AGL.
ICAO ENVIRONMENTAL REPORT 201030
AVIATION OUTLOOK
Mass emissions, measured in units such as total tonnes ofNOx or total tonnes of PM, from airport sources are only ametric for comparison purposes. To understand the influ-ence on ambient air quality, airport mass emissions mustbe converted to ambient concentrations, measured in unitssuch as micrograms per cubic meter ( µg/m3 ) or parts permillion ( PPM ). The incremental contribution in ambient pollu-tant concentrations from airport emissions decreases thefurther one travels away from the airport. Each airport’scontribution is unique, subject to the surrounding urbaniza-tion/industrialization and meteorological conditions within thevicinity of the airport. ICAO’s Airport Air Quality GuidanceManual ( ICAO Doc 9889 ), provides detailed information onthis subject.
Conclusions and Next StepsStandards set by ICAO, coupled with investments in tech-nology and improved operational procedures have resultedin the near elimination of some pollutants from aircraftengine exhaust and are allowing aviation’s local air qualityemissions footprint to grow at a rate slower than thedemand for air travel. The emissions Standards and meas-urement methods incorporated in the original and still appli-cable certification scheme in Annex 16, Volume II, havestood the test of time quite well and remain relevant to itspurpose.
Looking forward, some changes may be necessary toaccount for new findings. In particular, CAEP is focused onbetter understanding the formation of non-volatile PM andhas targeted the development of a certification requirementby CAEP/9, and a certification Standard by CAEP/10. n
More information about aviation’s effects on local air quality is available in Chapter 3 of the 2007 ICAO Environmental Report.
Adapted from United States EPA, Evaluation of Air Pollutant Emissions from Subsonic Commercial Jet Aircraft.
1
2
References

AVIATION OUTLOOK
Around the world, people, nations, and industries havebecome increasingly concerned with their contribution toglobal climate change. Aircraft are powered by the combus-tion of jet fuel and aviation gasoline, the result of which areemissions that are comprised of approximately 70% carbondioxide (CO2), slightly less than 30% water vapour, and lessthan 1% of a number of other emissions. CO2 and watervapour are greenhouse gases (GHG). The effects of theseemissions last for vastly different lengths of time with CO2
being a very long lived gas in the atmosphere, and watervapour having a relatively short term effect. This brief outlookprovides you an initial introduction to the discussion on avia-tion and climate change, to which this 2010 environmentalreport is entirely dedicated.
Scientific UnderstandingICAO’s cooperation with other United Nations bodies, inparticular the Intergovernmental Panel on Climate Change( IPCC), is essential in obtaining a better scientific under-standing of aviation’s impact on the global climate. Mainfinding related to aviation emissions in IPCC Fourth Assess-ment Report (AR4) published in 2007 are shown in theinset box as follows.
l Total aviation CO2 emissions (domestic andinternational ) are approximately 2% of the world’s anthropogenic (human-made) CO2 emissions(Figure1);
l International flights are responsible for approximately62% of these emissions;
l The amount of CO2 emissions from aviation is projected to grow around 3% to 4% per year; and
l Medium-term mitigation for CO2 emissions from theaviation sector can potentially come from improved fuel efficiency. However, such improvements are expected to only partially offset the growth of aviation CO2 emissions.
The IPCC has initiated the preparation of its Fifth AssessmentReport (AR5), which is scheduled to be completed in 2014.ICAO is participating in the IPCC process to ensure thatissues related to aviation and climate change are covered inthe AR5. ICAO requested that the AR5 further explore theeffects of non-CO2 aviation emissions, update the trends ofaviation CO2 emissions, include the latest ICAO work on miti-gation measures, and address the life-cycle analysis of the
Climate Change OutlookBy ICAO Secretariat
Global Co2 emissions per transport (%)
Global GHG by Section, 2004 (IPCC)
Part of Aviation Global Co2 Emissions
Figure 1: Aviation’s contribution to global CO2 emissions. Source: IPCC, 4th Assessment Report, 2007, WGIII, Technical Summary and IPCC Special Report on Aviation and the Global Atmosphere (1999).
AVIATION AND CLIMATE CHANGE 31

ICAO ENVIRONMENTAL REPORT 201032
AVIATION OUTLOOK
environmental benefits on the use of alternative fuels foraviation taking into account cross-sectoral issues.
Fuel Burn / Fuel Efficiency TrendsCAEP has conducted a detailed assessment of environ-mental trends. Based on the unconstrained CAEP centralforecast and without accounting for the lifecycle emissionsreduction potential of sustainable alternative fuels (seeChapter 5 of this report), CO2 emissions from aircraft willcontinue to increase even under the assumption of opti-mistic technological and operational advances. However,technological and operational advances will allow aviationsystem efficiency to continue to improve.
Figure 2 provides results for global full-flight fuel burn for2006, 2016, 2026, 2036 and 2050. These results are forboth domestic and international traffic combined. As shownin Figure 3, the 2006 baseline value is 187 Mt of fuel, withdomestic traffic representing approximately 38% of thistotal and international traffic representing 62%.
The baseline value of 187 Mt in 2006 only includes fuel burnfrom the main aircraft engines of Instrument Flight Rules (IFR).It does not include fuel burn from auxiliary power units, from
aviation-related operations ( e.g., ground support equip-ment ) or from visual flight rules ( VFR ) flights. Non-sched-uled flights in regions for which radar data are not availablewere also not accounted for. Fuel burn from aviation-relatedoperations, VFR flights, and non-scheduled flights maytogether amount to approximately 10% to 12% additionalfuel burn.
The global fuel consumption is expected to grow from abaseline of 187 Mt in 2006 to between 461Mt and 541 Mtin 2036. Without considering the effects of alternative fuels,
Mt = millions of metric tonnes* Values are rounded to nearest Mt and per cent
2006 International and Domestic Global Aircraft Fuel Burn
International Traffic
116Mt*(62%)
Domestic Traffic72Mt*(38%)
Figure 3: International aviation represented approximately 62% of global aviation fuel consumption in 2006.
Figure 2: Total Global Aircraft Fuel Burn 2006 to 2050.
2006 2016 2026 2036 2050
Legend1200
1000
800
600
400
200
0
Year
S1
S2S3S4S5
Global Aircraft Fuel Burn (International and Domestic Traffic Combined )
Total A
ircraft Fuel Burn
(Millions of Metric Tonnes
)
S1: (Sensitivity case) maintain current operational efficiencyand no new aircraft technology
S2: AC: Low, OI: Moderate
S3: AC: Moderate, OI: Moderate
S4: AC: Advanced, OI: Advanced
S5: AC: Optimistic, OI: Advanced
S: ScenarioAC: Aircraft technologyOI: Operational
improvement
Note: Results were modelled for 2006, 2016 2026 and 2036, then extrapolated to 2050.

AVIATION AND CLIMATE CHANGE 33
AVIATION OUTLOOK
assuming that 3.16 kg CO2 is produced for every kg of fuelburnt gives a baseline value of 591 Mt CO2 in 2006 tobetween 1,450 and 1,710 Mt CO2 in 2036. This representsan absolute growth of between 2.5 and 2.9 times over theperiod or an annual average growth rate of between 3 and3.5 per cent, which is far less than the assumed growth inair traffic demand. For the 2050 results, a 2.9 per cent to3.4 per cent annual average growth rate is predicted.
Figure 4 presents the global fuel efficiency trends for theyears 2006, 2016, 2026 and 2036, using the CAEP-approvedCommercial Aircraft System Fuel Efficiency (CASFE) metric.The 2006 baseline value is 0.32 kg/tonne-km. In 2036,global CASFE ranges from about 0.25 kg/tonne-km (withScenario 2 ) to about 0.21kg/tonne-km (with Scenario 5 ).Lower CASFE values represent more efficient operations.Also depicted in Figure 4, by a dashed line, is an approxi-mation of the effects of the global goal of 2% annual fuelefficiency improvement agreed by the Group on Interna-tional Aviation and Climate Change ( GIACC) and the High-level Meeting on International Aviation and Climate Changein October 2009.
On a per flight basis, fuel efficiency is expected to improveover the period. However in absolute terms an emissions“gap” could exist relative to 2006 or earlier that would requirea form of intervention in order to achieve sustainability.
CO2 Emissions Reduction Target for AviationThe ultimate objective of the United Nations FrameworkConvention on Climate Change ( UNFCCC) is to achieve stabi-lization of greenhouse gas concentrations in the atmosphereat a level that would prevent an irreversible change in theglobal climate system. In this regard all activities, inde-pendent of their share of the contribution, must pursue themeans necessary to address their part of responsibility inthe global picture.
Within the share of the global CO2 emissions attributed tothe aviation sector ( approximately 2% ), a substantial partrepresents domestic aviation emissions, which follow thesame treatment agreed under the UNFCCC and Kyoto Protocolas other emissions of a domestic nature. Approximately62% of aviation emissions are attributed to internationalaviation operations. However, as mentioned above, thisamount is projected to grow at around 3% to 3.5% peryear, and ICAO has been actively developing a comprehen-sive mitigation strategy to limit or reduce GHG emissionsfrom international aviation.
Fuel Burn /Fuel Efficiency Scenarios● Scenario 1 is the sensitivity case that assumes theoperational improvements necessary to maintain currentoperational efficiency levels, including the planned introduction of NextGen and SESAR, but does not includeany aircraft technology improvements beyond those available in current ( 2006 ) production aircraft. SinceScenario 1 is not considered a likely outcome, it ispurposely depicted with no line connecting the modelledresults in 2006, 2016, 2026, 2036 and 2050.
● Scenario 2 is the low aircraft technology andmoderate operational improvement case that, in addition toincluding the improvements associated with the migrationto the latest operational initiatives, e.g. those planned inNextGen and SESAR (Scenario1), includes fuel burnimprovements of 0.96% per annum for all aircraft enteringthe fleet after 2006 and prior to 2015, and 0.57 percentper annum for all aircraft entering the fleet beginning in2015 out to 2036. It also includes additional fleet-widemoderate operational improvements by region.
● Scenario 3 is the moderate aircraft technology andoperational improvement case that, in addition to includingthe improvements associated with the migration to thelatest operational initiatives, e.g. those planned in NextGenand SESAR (Scenario1), includes fuel burn improvementsof 0.96% per annum for all aircraft entering the fleet after2006 out to 2036, and additional fleet-wide moderateoperational improvements by region.
● Scenario 4 is the advanced aircraft technology andoperational improvement case that, in addition to includingthe improvements associated with the migration to thelatest operational initiatives, e.g. those planned in NextGenand SESAR (Scenario1), includes fuel burn improvementsof 1.16% per annum for all aircraft entering the fleet after2006 out to 2036, and additional fleet-wide advancedoperational improvements by region.
● Scenario 5 is the optimistic aircraft technology andadvanced operational improvement case that, in additionto including the improvements associated with the migra-tion to the latest operational initiatives, e.g. those plannedin NextGen and SESAR (Scenario1), includes an optimisticfuel burn improvement of 1.5% per annum for all aircraftentering the fleet after 2006 out to 2036, and additionalfleet-wide advanced operational improvements by region. This scenario goes beyond industry-based recommenda-tions for potential improvements.

ICAO ENVIRONMENTAL REPORT 201034
AVIATION OUTLOOK
A milestone in this strategy was achieved by the High-levelMeeting on International Aviation and Climate Change inOctober 2009. The meeting agreed on a set of comprehen-sive measures known as the ICAO Programme of Action onInternational Aviation and Climate Change. It includes theagreement on a global goal of 2% annual improvement infuel efficiency until the year 2050. It is the first and onlyglobally-harmonized agreement from a sector on a goal toaddress its CO2 emissions.
At the same time, the High-level Meeting “noted the scien-tific view that the increase in global average temperatureabove pre-industrial levels ought not to exceed 2°C ” ( 9thpreambular clause of the Declaration ), and “recognized thatthe aspirational goal of 2% annual fuel efficiency improve-ment is unlikely to deliver the level of reduction necessaryto stabilize and then reduce aviation’s absolute emissions,and that goals of more ambition will need to be consideredto deliver a sustainable path for aviation”. ICAO and itsmember States consequently declared to undertake furtherwork to explore the feasibility of more ambitious goals,
including carbon-neutral growth of the sector and long-term emissions reduction ( see inset box from excerpt fromthe Declaration ).
Despite ICAO’s success no binding agreement on globalemissions reduction targets was reached in COP15. TheCopenhagen Accord that was “noted” by the UNFCCCClimate Change Conference in Copenhagen (COP15) inDecember 2009 recognized that deep cuts in global emis-sions are required, as documented by the IPCC AR4, with aview to reducing global emissions so as to limit the increasein global temperature below 2°C.
As illustrated in Table 1, according to the IPCC AR4, in orderfor the global average temperature to not exceed 2°C,global CO2 emissions must peak between 2000 and 2015,and be reduced in 2050 by between 50 and 85 percentcompared to the 2000 level.
Figure 4: Commercial Aircraft System Fuel Efficiency (CASFE) Full-Flight Results.
Global Commercial Aircraft System Fuel Efficiency (CASFE ) Full-Flight Results
CASF
E (k
g/t
onne
-km
)
0.5
0.4
0.3
0.2
0.1
0.02006 2016 2026 2036 2050 Year
LegendS1: (Sensitivity case) maintain current operational efficiency and no new aircraft technologyS2: AC: Low, OI: ModerateS3: AC: Moderate, OI: ModerateS4: AC: Advanced, OI: AdvancedS5: AC: Optimistic, OI: AdvancedICAO CO2 Aspirational Goal
S: ScenarioAC: Aircraft technologyOI: Operational improvement
S1
S2 S3S4
S5
Goal
Note: Lower CASFE values = more efficient operations

AVIATION AND CLIMATE CHANGE 35
AVIATION OUTLOOK
ConclusionsWith the solid basis of the Programme of Action on Interna-tional Aviation and Climate Change, ICAO continues topursue even more ambitious goals to address aviation’scontribution to climate change. The Organization and theindustry are working aggressively toward a sustainablefuture for international aviation. More information on ICAOefforts to unite aviation on climate change is available fromwww.icao.int/Act_Global. n
2. In pursuing the implementation of the ICAOProgramme of Action on International Aviation andClimate Change, States and relevant organizations willwork through ICAO to achieve a global annual averagefuel efficiency improvement of 2 per cent over themedium term until 2020 and an aspirational globalfuel efficiency improvement rate of 2 per cent perannum in the long term from 2021 to 2050, calcu-lated on the basis of volume of fuel used per revenuetonne kilometre performed;
3. Taking into account the relevant outcomes of the15th Conference of the Parties to the United NationsFramework Convention on Climate Change, and recog-nizing that this declaration shall not prejudge the
outcome of those negotiations, ICAO and its MemberStates, with relevant organizations will also keep working together in undertaking further work onmedium and long-term goals, including exploring thefeasibility of goals of more ambition including carbon-neutral growth and emissions reductions, taking intoaccount the collective commitments announced byACI, CANSO, IATA and ICCAIA on behalf of the interna-tional air transport industry, the special circumstancesand respective capabilities of developing countries andthe sustainable growth of the international aviationindustry, for consideration by the 37th Session of the ICAO Assembly;
Category
IIIIIIIVVVI
Additional radiativeforcing(W/m2)
2.5-3.03.0-3.53.5-4.04.0-5.05.0-6.06.0-7.5
CO2concentration (ppm )
350-400400-440440-485485-570570-660660-790
CO2-eq concentration (ppm )
445-490490-535535-590590-710710-855855-1130
Global mean temperature increase above pre-industrial at equilibrium, using“best estimate” climate sensitivity (°C )
2.0-2.42.4-2.82.8-3.23.2-4.04.0-4.94.6-6.1
Peaking year for CO2emissions
2000-20152000-20202010-20302020-20602050-20802060-2090
Change in global CO2emissions in 2050 (% of 2000 emissions )
-85 to -50-60 to -30-30 to +5+10 to +60+25 to +85+90 to +140
Table 1: Classification of IPCC AR4 stabilization scenarios according to different stabilization targets and alternative stabilization metrics. Source: IPCC, 4th Assessment Report, 2007, WGIII.
Excerpt from High-level Meeting Declaration (October 2009)


