Environmental and social footprints of international trade Dr Tommy Wiedmann Associate Professor of Sustainability Research School of Civil and Environmental Engineering UNSW Sydney, NSW 2052, Australia http://www.sustainabilityresearch.unsw.edu.au 25 th International Input-Output Conference, 20-23 June 2017. Atlantic City, New Jersey, USA.
Transcript
Environmental and social footprints of international trade
Dr Tommy WiedmannAssociate Professor of Sustainability Research
School of Civil and Environmental EngineeringUNSW Sydney, NSW 2052, Australia
http://www.sustainabilityresearch.unsw.edu.au
25th International Input-Output Conference, 20-23 June 2017. Atlantic City, New Jersey, USA.
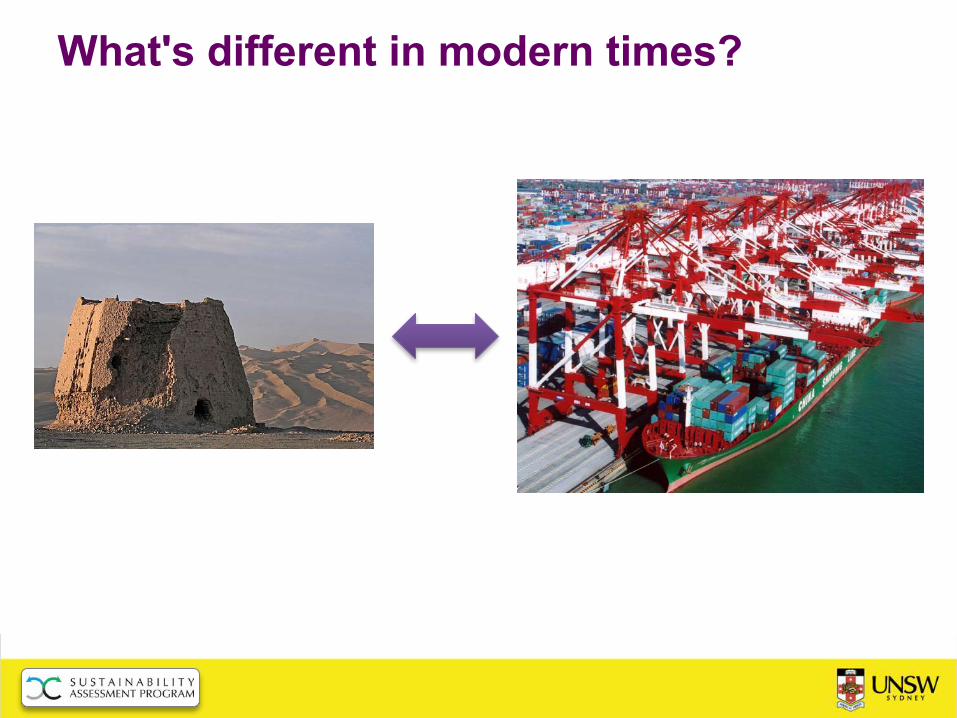
The Silk RoadHan Dynasty
206 BC - 220 AD
What's different in modern times?
Growth
Murray & Lenzen, Eds. (2013) The Sustainability Practitioner's Guide to MRIOA.Common Ground Publishing.
World Export-to-GDP
ratio
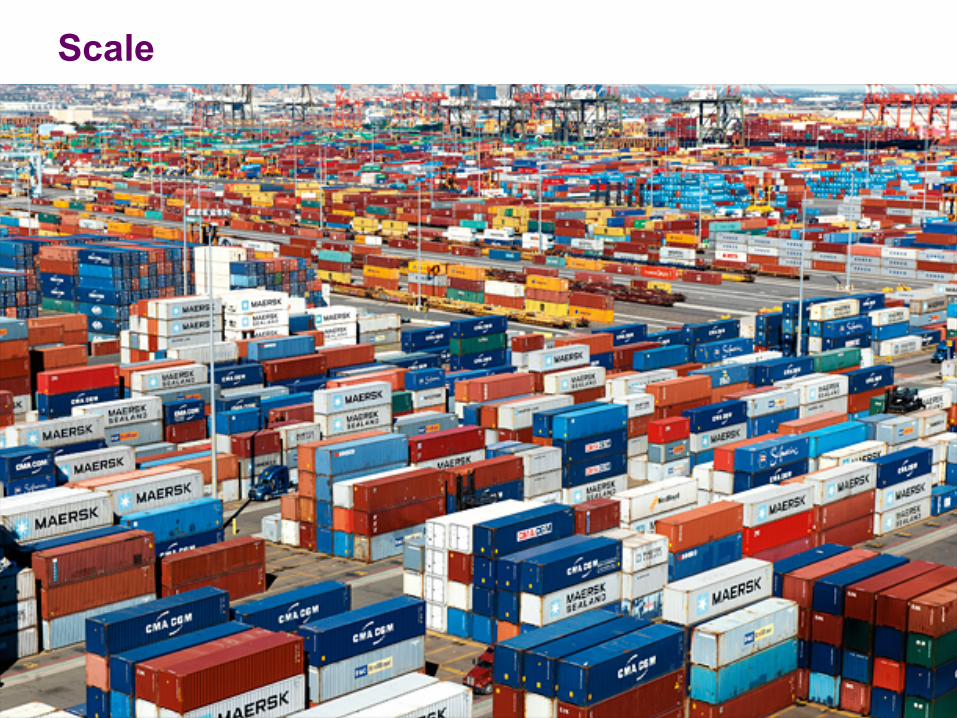
Scale
Complexity and Fragmentation
Complexity and Fragmentation
Kelly & La Cava (2013) Value-added Trade (TiVA) and the Australian Economy. Reserve Bank of Australia Bulletin.
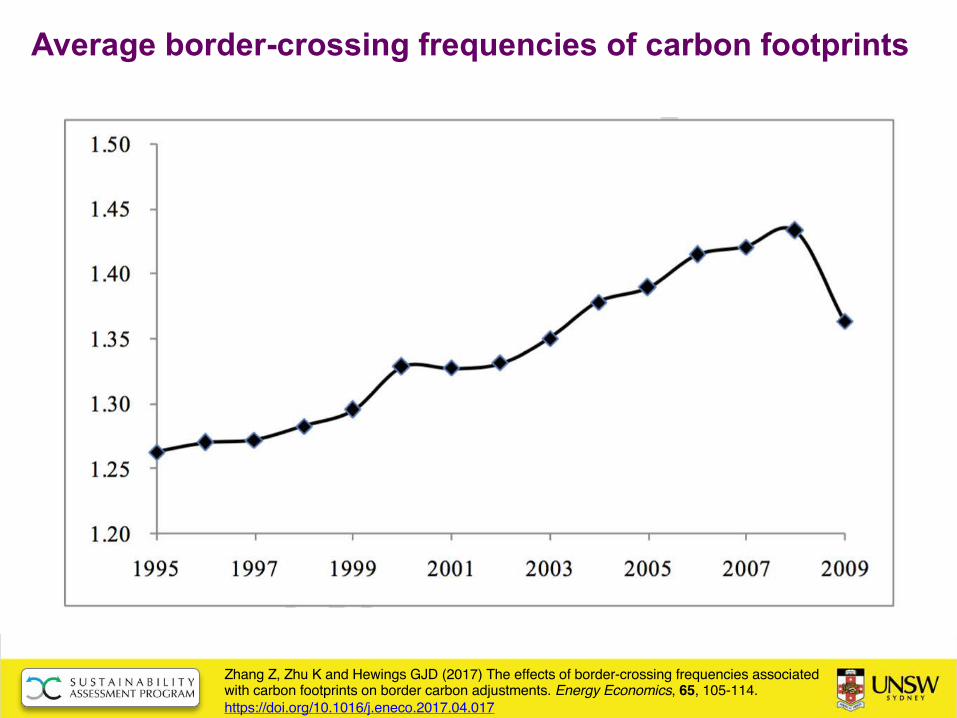
Average border-crossing frequencies of carbon footprints
Zhang Z, Zhu K and Hewings GJD (2017) The effects of border-crossing frequencies associated with carbon footprints on border carbon adjustments. Energy Economics, 65, 105-114. https://doi.org/10.1016/j.eneco.2017.04.017
Interconnectivity
Kagawa S, Suh S, Hubacek K et al (2015) CO2 emission clusters within global supply chain networks: Implications for climate change mitigation. Global Environmental Change, 35, 486-496. http://dx.doi.org/10.1016/j.gloenvcha.2015.04.003
58% é / year
GHG emissions cluster in China induced by US demand in construction
Electricity
Mining
Metals
Chemicals
Burden shifting
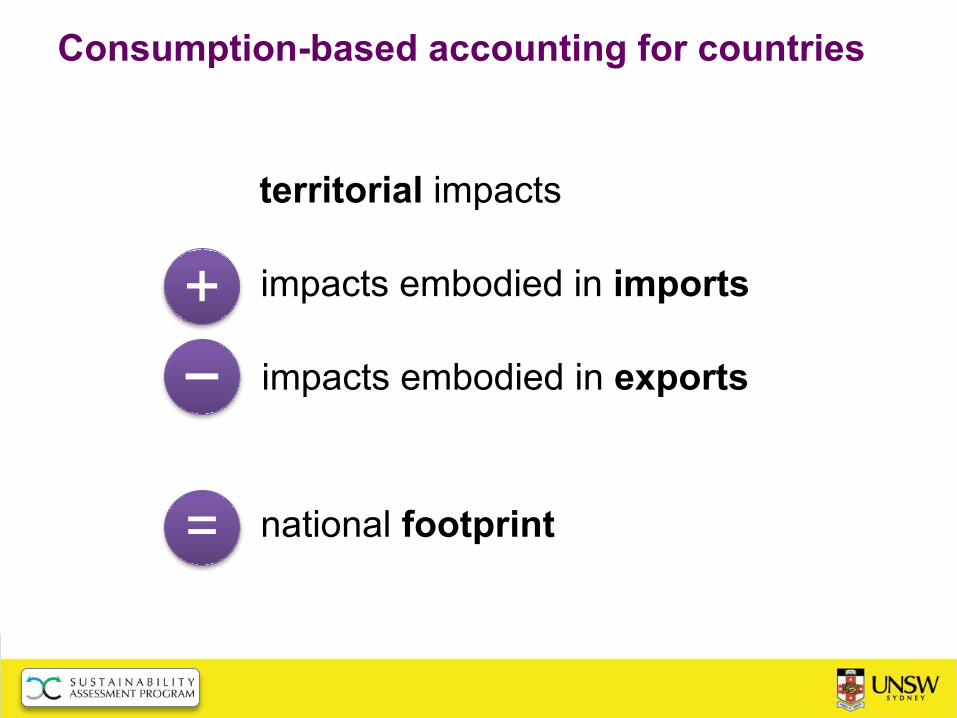
Consumption-based accounting for countries
territorial impacts
+ impacts embodied in imports
- impacts embodied in exports
= national footprint
+–
=
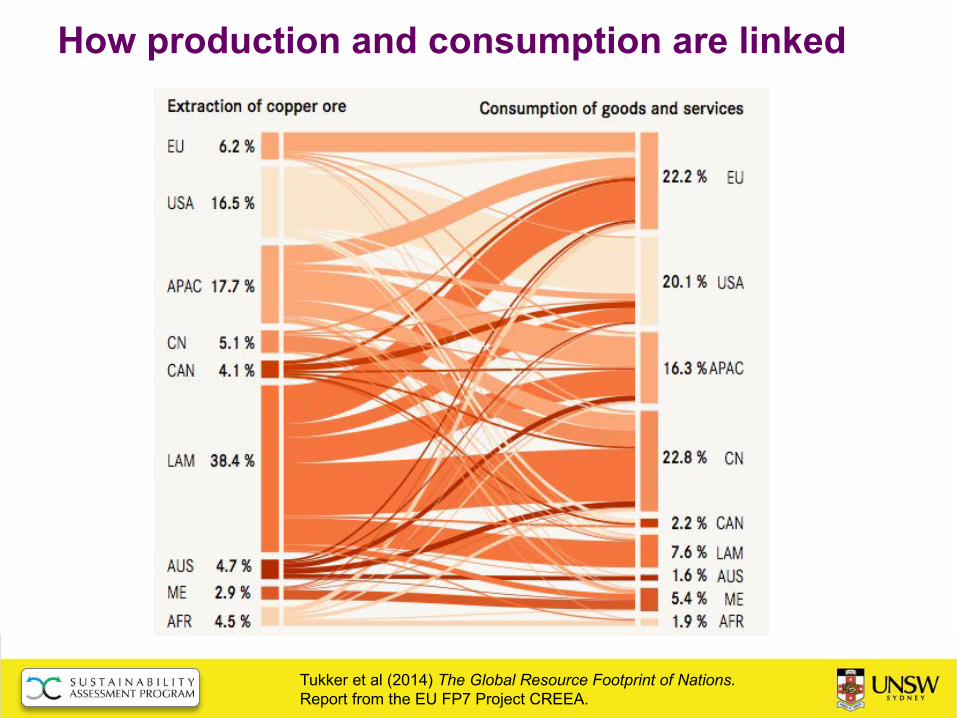
How production and consumption are linked
Tukker et al (2014) The Global Resource Footprint of Nations. Report from the EU FP7 Project CREEA.
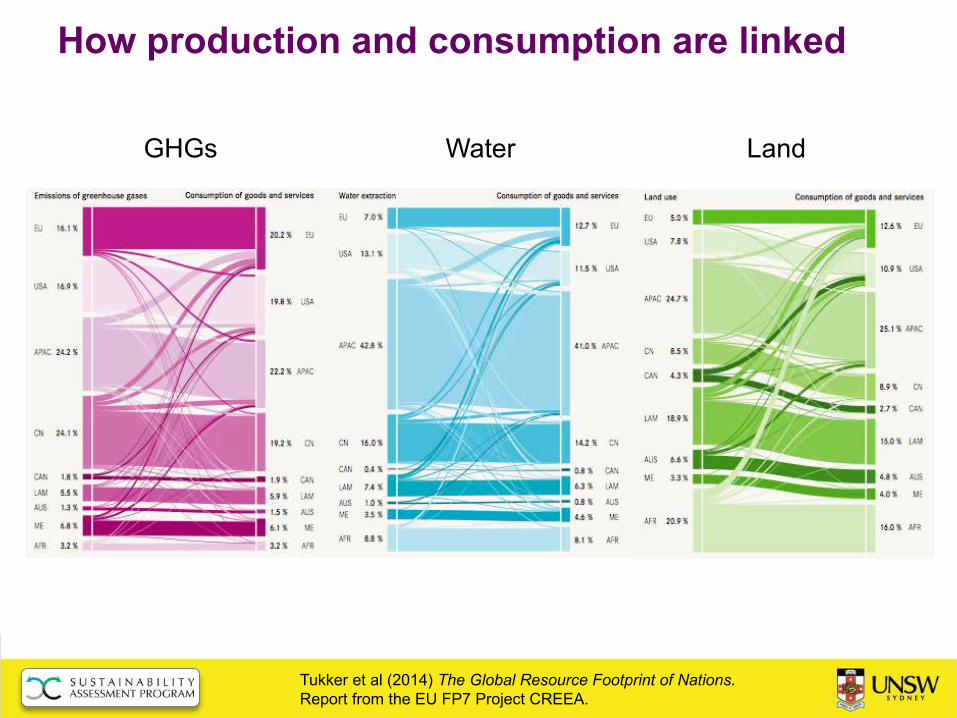
How production and consumption are linked
GHGs Water Land
Tukker et al (2014) The Global Resource Footprint of Nations. Report from the EU FP7 Project CREEA.
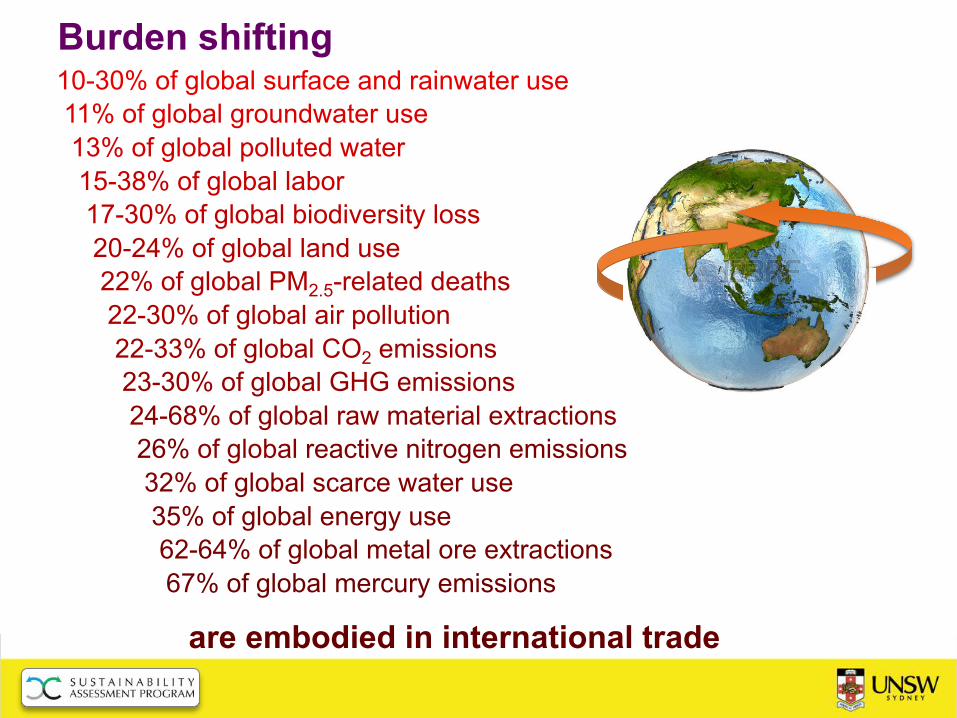
Burden shifting10-30% of global surface and rainwater use11% of global groundwater use13% of global polluted water15-38% of global labor17-30% of global biodiversity loss20-24% of global land use22% of global PM2.5-related deaths22-30% of global air pollution22-33% of global CO2 emissions23-30% of global GHG emissions24-68% of global raw material extractions26% of global reactive nitrogen emissions 32% of global scarce water use35% of global energy use62-64% of global metal ore extractions67% of global mercury emissions
are embodied in international trade
Indicators studied
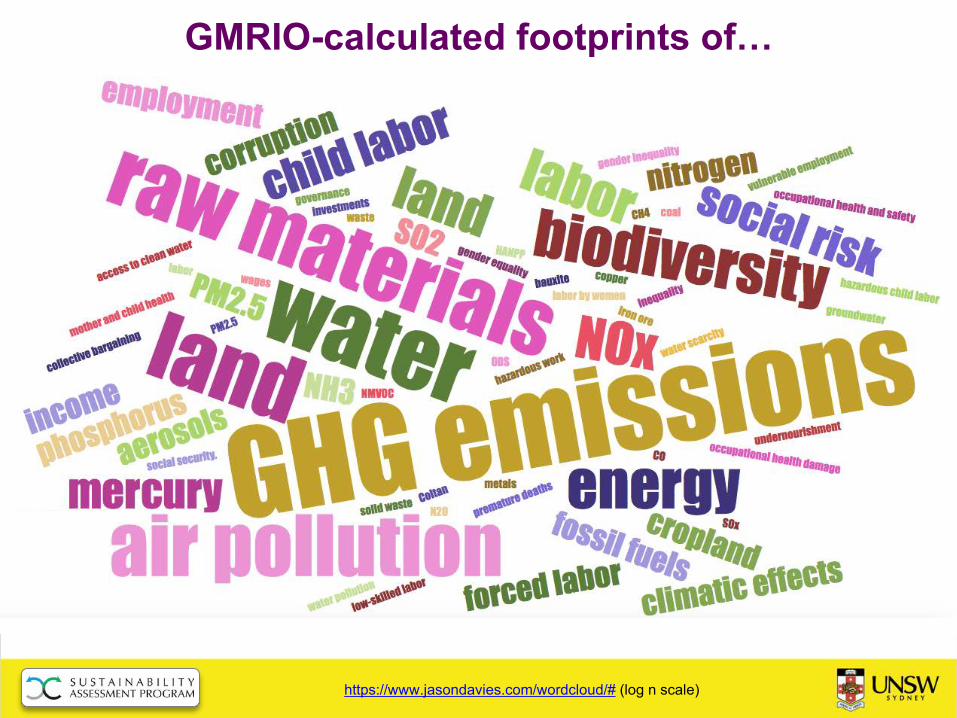
https://www.jasondavies.com/wordcloud/# (log n scale)
GMRIO-calculated footprints of…
Red socks footprint?
NEW –
noticed the last 24-36 months?
Main scientific advances in recent years
New indicators Ø many more environmental and social indicatorsØ pressure > impact > damage
Coupling of modelsØ physical/chemical process/transport modelsØ exposure / fate / life-cycle impact coupled with GMRIO
Spatial resolutionØ spatial mapping and sub-national analysis linked to /
nested in GMRIO
CollaborationØ virtual (G)MRIO laboratories
Shifting air pollution through trade
Lin J, Pan D, Davis SJ et al (2014) China’s international trade and air pollution in the United States. Proceedings of the National Academy of Sciences, 111(5), 1736-1741. http://www.pnas.org/content/111/5/1736.abstract
Total NOx Emissions (Tg)
Air pollution embodied in trade: ask China
Meng J, Liu J, Xu Y, Guan D et al (2016) Globalization and pollution: tele-connecting local primary PM2.5 emissions to global consumption. Proceedings of the Royal Society A, 472(2195). http://dx.doi.org/10.1098/rspa.2016.0380
PM2.5
emissions
China
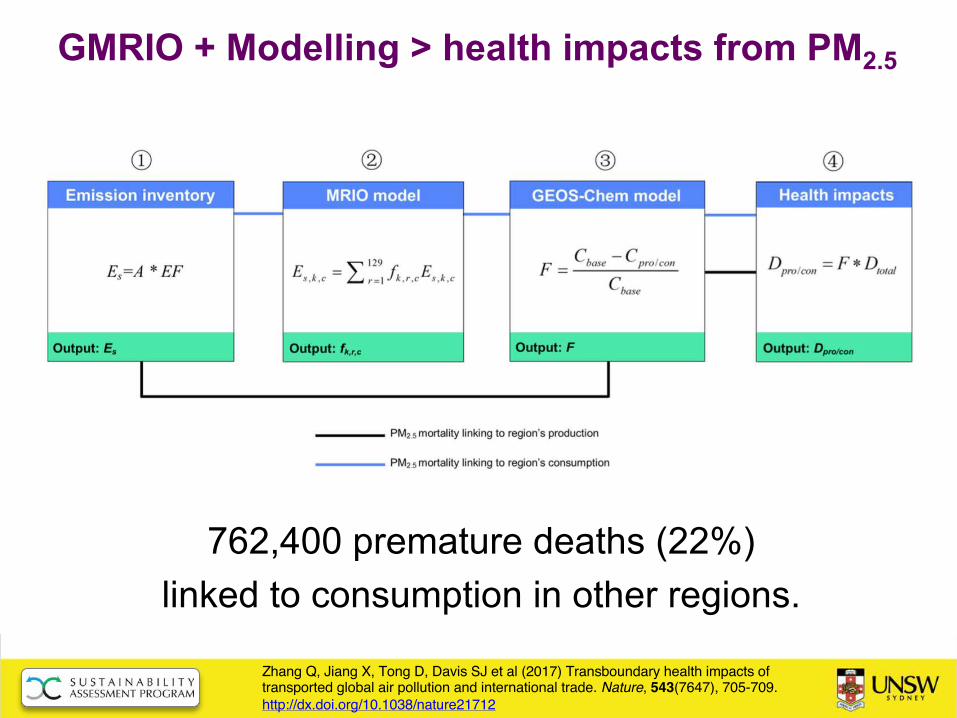
GMRIO + Modelling > health impacts from PM2.5
Zhang Q, Jiang X, Tong D, Davis SJ et al (2017) Transboundary health impacts of transported global air pollution and international trade. Nature, 543(7647), 705-709. http://dx.doi.org/10.1038/nature21712
762,400 premature deaths (22%) linked to consumption in other regions.
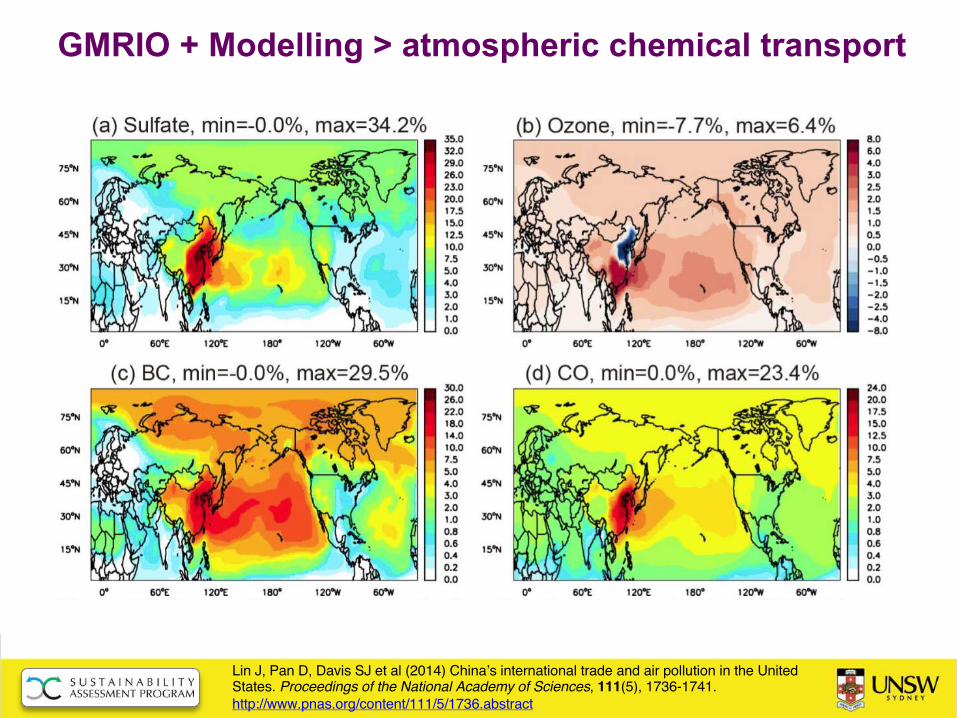
GMRIO + Modelling > atmospheric chemical transport
Lin J, Pan D, Davis SJ et al (2014) China’s international trade and air pollution in the United States. Proceedings of the National Academy of Sciences, 111(5), 1736-1741. http://www.pnas.org/content/111/5/1736.abstract
Shifting trade patterns have a
stronger influence on the
location of impacts from air pollution
than atmospheric transport alone!
Blue water footprint of EU27 by watershed
Lutter S, Pfister S, Giljum S et al (2016) Spatially explicit assessment of water embodied in European trade. Global Environmental Change, 38, 171-182. http://dx.doi.org/10.1016/j.gloenvcha.2016.03.001
Groundwater extraction embodied in trade
Groundwater embodied in trade of cropcommodities
USA
Pakistan
India
Mexico
Dalin, C., Wada, Y., Kastner, T. and Puma, M. J. (2017) Groundwater depletion embedded in international food trade. Nature, 543(7647), 700-704. http://dx.doi.org/10.1038/nature21403
Social burdens shifted as well
16% of all global employment
17% of forced labor
18% of occupational health damage
19% of child labor
19% of vulnerable employment
20% of hazardous child labor
38% of labor by women
are embodied in international trade
Simas, M., Golsteijn, L., Huijbregts, M., Wood, R. and Hertwich, E. (2014) The “Bad Labor” Footprint: Quantifying the Social Impacts of Globalization. Sustainability, 6(11), 7514-7540. http://www.mdpi.com/2071-1050/6/11/7514
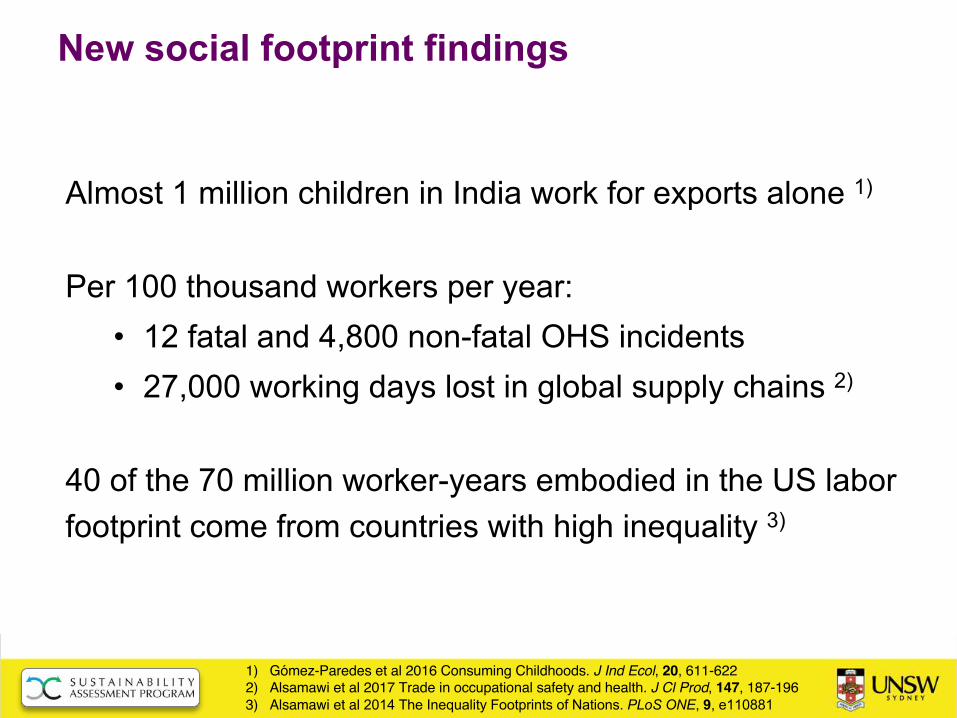
New social footprint findings
Almost 1 million children in India work for exports alone 1)
Per 100 thousand workers per year:• 12 fatal and 4,800 non-fatal OHS incidents• 27,000 working days lost in global supply chains 2)
40 of the 70 million worker-years embodied in the US labor footprint come from countries with high inequality 3)
1) Gómez-Paredes et al 2016 Consuming Childhoods. J Ind Ecol, 20, 611-6222) Alsamawi et al 2017 Trade in occupational safety and health. J Cl Prod, 147, 187-1963) Alsamawi et al 2014 The Inequality Footprints of Nations. PLoS ONE, 9, e110881
Social risk footprints – Corruption
Xiao, Y., Lenzen, M., Benoît-Norris, C., Norris, G. A., Murray, J. and Malik, A. (2017) The Corruption Footprints of Nations. Journal of Industrial Ecology.http://dx.doi.org/10.1111/jiec.12537
Developments in Methodologies
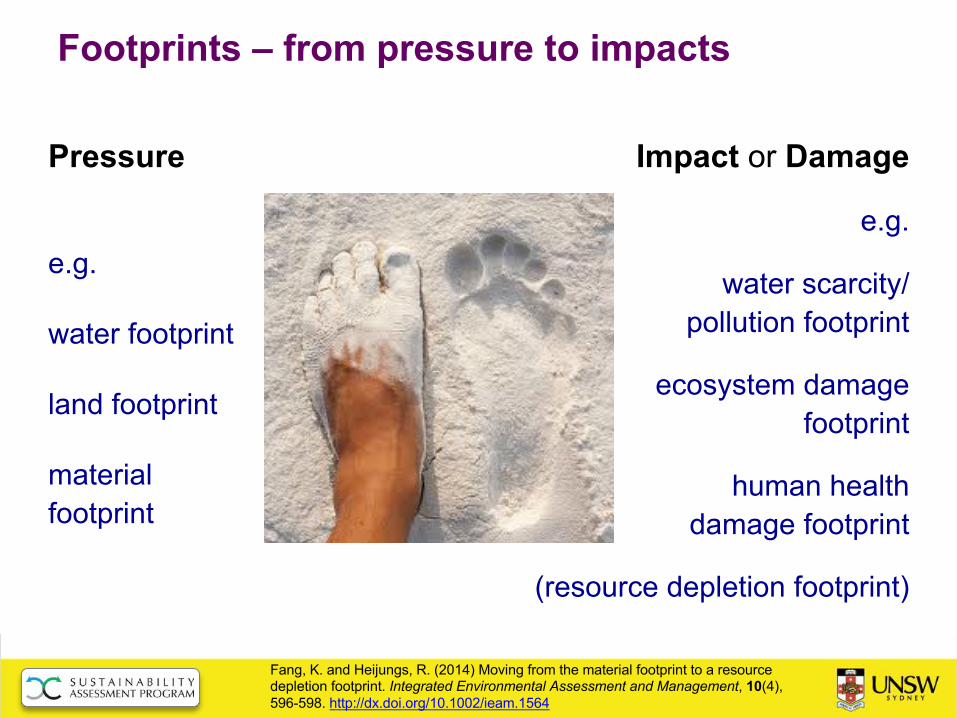
Footprints – from pressure to impacts
Pressure
e.g.
water footprint
land footprint
material footprint
Fang, K. and Heijungs, R. (2014) Moving from the material footprint to a resource depletion footprint. Integrated Environmental Assessment and Management, 10(4), 596-598. http://dx.doi.org/10.1002/ieam.1564
Impact or Damage
e.g.
water scarcity/pollution footprint
ecosystem damagefootprint
human healthdamage footprint
(resource depletion footprint)
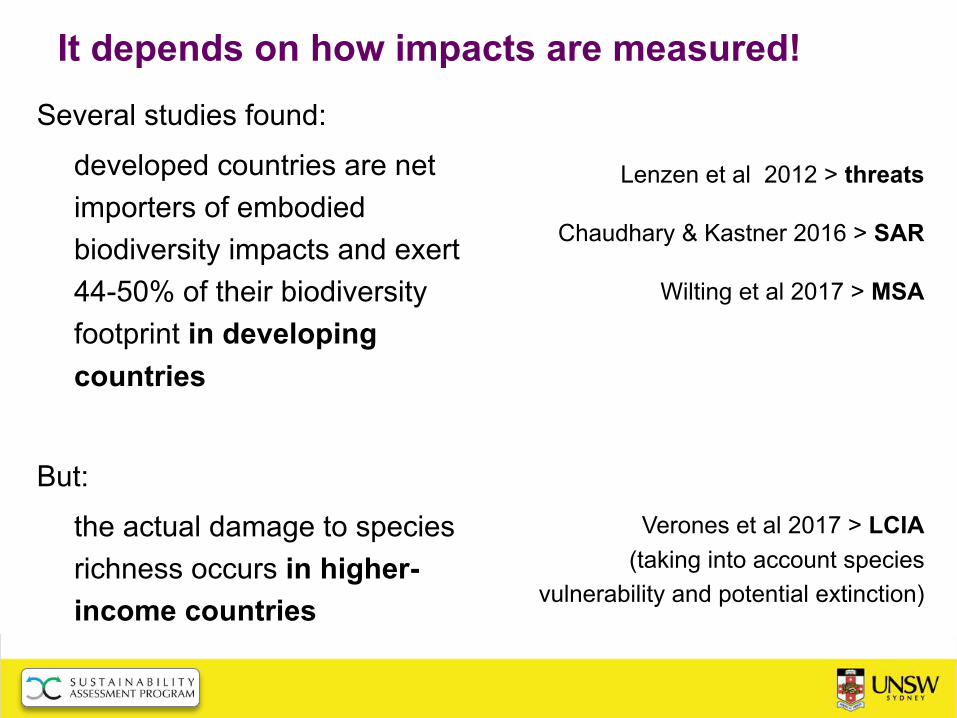
It depends on how impacts are measured!Several studies found:
developed countries are net importers of embodied biodiversity impacts and exert 44-50% of their biodiversity footprint in developing countries
But:
the actual damage to species richness occurs in higher-income countries
Lenzen et al 2012 > threats
Chaudhary & Kastner 2016 > SAR
Wilting et al 2017 > MSA
Verones et al 2017 > LCIA(taking into account species
vulnerability and potential extinction)
All biodiversity footprint studies confirm that food consumption is the ultimate
and most important driver of biodiversity loss globally.
Land use causes twice as much biodiversity loss as GHG emissions*
*) Wilting, H. C., Schipper, A. M., Bakkenes, M., Meijer, J. R. and Huijbregts, M. A. J. (2017) Quantifying Biodiversity Losses Due to Human Consumption: A Global-Scale Footprint Analysis. Environmental Science & Technology. http://dx.doi.org/10.1021/acs.est.6b05296
Our tools…
Understanding uncertainty in MRIO modelling
Owen, A., Steen-Olsen, K., Barrett, J., Wiedmann, T. and Lenzen, M. (2014) A Structural Decomposition Approach to Comparing MRIO Databases. Economic Systems Research, 26(3), 262-283. http://dx.doi.org/10.1080/09535314.2014.935299
UK carbon footprint –Breakdown of the variation between Eora and WIOD
⎯ basket of products
⎯ imports
⎯ final demand
⎯ Leontief matrix
⎯ total output
⎯ sector emissions
⎯ country emissions
⎯ global emissions
Range
WIOD
Eora
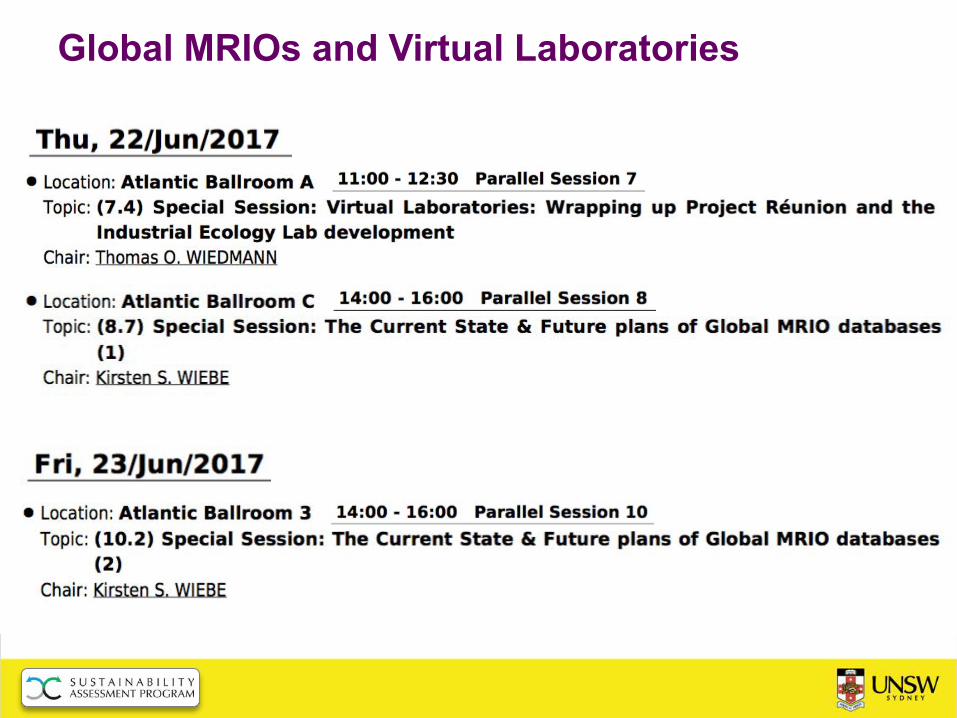
Collaborative Virtual Laboratories
Global MRIOs and Virtual Laboratories
So What? .What Next?
–Three Thoughts
Consumption-based footprint indicators confirm that there is little or no decoupling
of impacts from economic growth
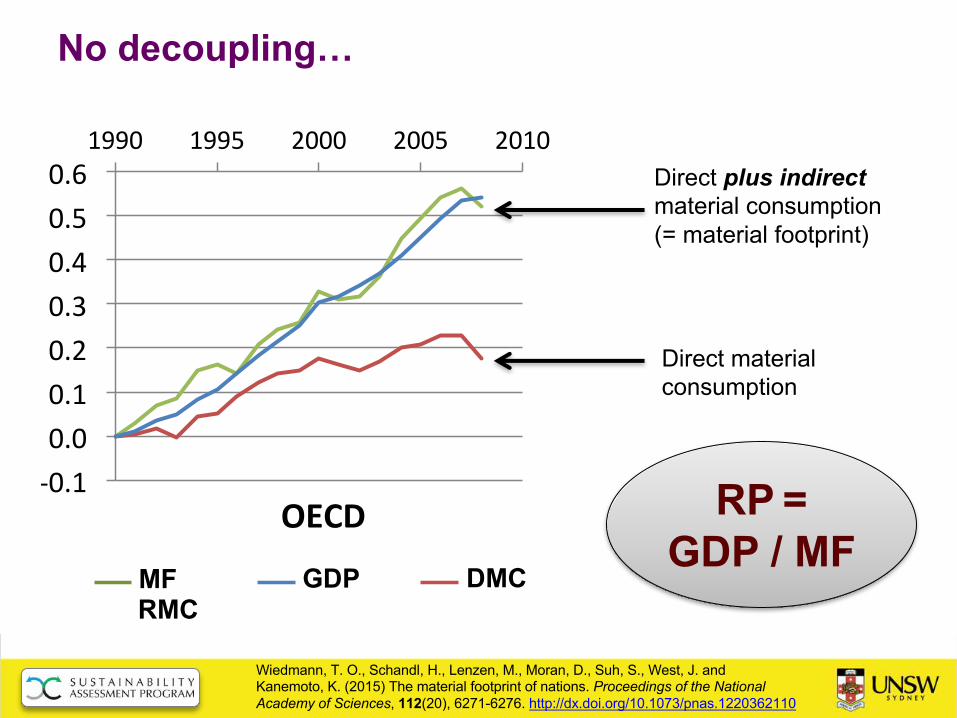
No decoupling…
!0.1%0.0%0.1%0.2%0.3%0.4%0.5%0.6%
1990% 1995% 2000% 2005% 2010%
OECD%
Wiedmann, T. O., Schandl, H., Lenzen, M., Moran, D., Suh, S., West, J. and Kanemoto, K. (2015) The material footprint of nations. Proceedings of the National Academy of Sciences, 112(20), 6271-6276. http://dx.doi.org/10.1073/pnas.1220362110
Direct material consumption
Direct plus indirectmaterial consumption(= material footprint)
RP = GDP / MF
MF GDP DMCRMC
… or little decoupling Simas et al 2017 Correlation between production and consumption-based environmental indicators. Ecological Indicators, 76, 317-323.
http://dx.doi.org/10.1016/j.ecolind.2017.01.026
Production ⎮ Footprint ⎮GDP
Hoekstra, A. Y. and Wiedmann, T. O. (2014) Humanity’s unsustainable environmental footprint. Science, 344(6188), 1114-1117. http://dx.doi.org/10.1126/science.1248365
Ecological footprint18.2 vs. 12 billion global hectares
Green water footprint6700billion m3/year
Blue water footprint1000-1700 vs.1100-4500 billion m3/year
Carbon footprint46-55 vs. 18-25Gt CO2-eq./year
Material footprint70 Gt/year (10.5 t/cap) vs. 8 t/cap
Gray water footprint1400 billion m3/year
sustainableMaximum
footprint
?
?
1) Quantify footprint thresholds & set targets
2) Global supply chains of companies and products
Australia 1,015 Poland 528 Indonesia 511 Apple 510 Belgium 504 Switzerland 492 Sweden 479 Saudi Arabia 469 Norway 452 Exxon Mobil 438
Austria 414 Thailand 272 Ireland 268 Wal-Mart Stores 257 Colombia 244 Portugal 243 Royal Dutch Shell 243 IBM 242 Malaysia 222 Czech Republic 215
GDP or Market Value (US$bn)
3) Machine Learning for GMRIO compilation?SUTstrade
GMRIOs
Answers??!
⁉
Thank You
Don't worry about the world coming to an end today –