Page 1
1
ENVIRONMENTAL AND SOCIAL
IMPACT ASSESSMENT (ESIA)
For the Commercial Agriculture Development Projects at the IKORODU
FISH FARM ESTATE, Odogunyan, Ikorodu, Lagos (Final Report)
April, 2013
TABLE OF CONTENTS
TABLE OF CONTENTS ............................................................................................................. 1
LIST OF FIGURES ...................................................................................................................... 6
LIST OF TABLES ........................................................................................................................ 7
LIST OF ACRONYMS ..................................................................................................................... 9
EXECUTIVE SUMMARY ........................................................................................................ 11
CHAPTER ONE ......................................................................................................................... 16
INTRODUCTION....................................................................................................................... 16
1.0 Background .................................................................................................................... 16
1.1 Tasks of the Consultant .............................................................................................. 20
1.2 Objectives of the Study .................................................................................................. 18
1.3 Scope of the Study.......................................................................................................... 19
CHAPTER TWO ........................................................................................................................ 20
LAGOS STATE COMMERCIAL AGRICULTURE PROJECT .......................................... 20
2.1 Background .................................................................................................................... 20
2.2 Development Objective and Approach in Lagos ........................................................... 21
2.3 Project Justification and Design Principles .................................................................... 21
2.3.1 Key Performance Indicators ................................................................................... 21
Pub
lic D
iscl
osur
e A
utho
rized
Pub
lic D
iscl
osur
e A
utho
rized
Pub
lic D
iscl
osur
e A
utho
rized
Pub
lic D
iscl
osur
e A
utho
rized
Pub
lic D
iscl
osur
e A
utho
rized
Pub
lic D
iscl
osur
e A
utho
rized
Pub
lic D
iscl
osur
e A
utho
rized
Pub
lic D
iscl
osur
e A
utho
rized
wb371432
Typewritten Text
E1789 V7
Page 2
2
2.3.2 Project Components ................................................................................................ 21
2.3.2.1 Agricultural Production and Commercialization ................................................ 22
2.3.2.1 Rural Infrastructure ............................................................................................. 22
CHAPTER THREE .................................................................................................................... 23
POLICY, LEGAL AND ADMINISTRATIVE FRAMEWORK............................................ 23
3.1 Introduction ......................................................................................................................... 23
3.2 Federal and Lagos State Environmental Regulatory Bodies .......................................... 24
3.3 Sectoral EIA Guidelines ................................................................................................. 24
3.4 World Bank Safeguard Policies ..................................................................................... 28
3.4.1 Environmental Assessment (OP 4.0.1) ................................................................... 28
3.4.2 OP 4.04 - Natural Habitats ....................................... Error! Bookmark not defined.
3.4.3 OP 4.09 - Pest Management..................................... Error! Bookmark not defined.
3.4.4 OP 4.12 - Involuntary Resettlement......................... Error! Bookmark not defined.
3.5 International Guidelines and Conventions ..................................................................... 29
CHAPTER FOUR ....................................................................................................................... 34
GENERAL METHODOLOGY ................................................................................................. 34
4.1 Introduction .................................................................................................................... 34
4.2 ESIA Requirements ........................................................................................................ 35
4.2.1 Screening................................................................................................................. 35
4.2.2 Scoping ................................................................................................................... 35
4.3 ESIA Process .................................................................................................................. 36
4.4 Baseline Study Methodology ......................................................................................... 36
4.8 Existing Conditions ........................................................................................................ 36
4.5 Mapping of the Project Area .......................................................................................... 37
4.6 Socio-economic Survey.................................................................................................. 37
4.6.1 Impact Significance Assessment............................................................................ 40
4.6.2 Method for Determining Event Magnitude............................................................. 40
4.6.3 Method for Determining Receptor Sensitivity ........................................................ 39
4.7 Trans-boundary and Cumulative Impacts ...................................................................... 40
4.8 Mitigation and Monitoring ............................................................................................. 40
CHAPTER FIVE ........................................................................................................................ 41
ENVIRONMENTAL AND SOCIAL BASELINE CONDITION .......................................... 41
5.1 Description of Project Area ............................................................................................ 41
5.1.1 Physical Environment ................................................................................................. 42
5.1.1.1 Climate and meteorology .................................................................................... 42
5.1.1.2 Topography ......................................................................................................... 43
5.1.1.3 Geology ............................................................................................................... 43
5.1.1.4 Soil ...................................................................................................................... 43
Page 3
3
5.1.1.5 Surface and Ground water Hydrology ................................................................ 44
5.1.2 Biological Environment .............................................................................................. 44
5.1.2.1 Ecosystem............................................................................................................ 44
5.1.2.2 Land Use Pattern ................................................................................................. 44
5.1.2.3 Vegetation ......................................................................................................... 457
5.1.2.4 Fauna and wildlife resources ............................................................................... 45
5.1.3 Socio-cultural Environment ........................................................................................ 45
5.1.3.1 Population and Administration............................................................................ 45
5.1.3.2 Socio economic Facilities.................................................................................... 46
5.1.3.3 Industries ............................................................................................................. 46
5.1.3.4 Ethnic groups....................................................................................................... 46
5.1.3.5 Education ............................................................................................................. 46
5.1.3.5 Transport and Transportation .............................................................................. 47
5.2 Environmental Quality Survey ....................................................................................... 47
5.2.1 Air Quality and Noise ............................................................................................. 47
5.2.1.1 Air Quality of the Study Area ............................................................................. 47
5.2.2 Ground Water Quality.................................................................................................. 50
5.2.2.1 Groundwater Sampling ....................................................................................... 50
5.2.2.2 Physico-chemical Characteristics of Ground Water Samples ............................. 51
5.2.2.3 Microbial Characteristics of Ground Water Samples ............................................... 52
5.2.3 Soil Quality ............................................................................................................. 53
5.2.3.1 Soil Sampling ...................................................................................................... 53
5.2.3.2 Physico-Chemical Properties of Soil Samples .......................................................... 54
CHAPTER SIX ........................................................................................................................... 60
SOCIO-ECONOMIC ASSESSMENT ...................................................................................... 60
6.0 Introduction .................................................................................................................... 60
6.1 Methodology .................................................................................................................. 59
6.1.1 Data Collection Sampling Methodology ................................................................ 59
6.2 Description of LGA and Host Community .................................................................... 60
6.2.1 Traditional Ruler ..................................................................................................... 60
6.3 Results and Discussions ................................................................................................. 61
6.3.1 Demographic Characteristics .................................................................................. 61
6.3.2 Population Size ....................................................................................................... 61
6.3.3 Age Profile .............................................................................................................. 63
6.3.4 Sex Profile ............................................................................................................... 64
6.3.5 Families and Households ........................................................................................ 65
6.3.5.1 Marital Status ...................................................................................................... 65
6.3.5.2 Family Types ............................................................................................................ 66
6.3.6 Residential Status of Respondents .......................................................................... 67
6.3.6.1 Duration of Living in the Estate .......................................................................... 70
Page 4
4
6.3.7 Educational Status of Respondents ......................................................................... 70
6.3.8 Employment Status of Respondents ....................................................................... 69
6.3.9 Income Level .......................................................................................................... 70
6.3.10 Housing Characteristics .......................................................................................... 71
6.3.11 Health Records ........................................................................................................ 72
6.3.12 Social and Health Infrastructure ............................................................................. 73
6.3.13 Sources of Domestic water ..................................................................................... 74
6.3.14 Environmental Issues .............................................................................................. 75
6.3.15 Social Impacts ......................................................................................................... 76
6.3.16 Environmental degradation ..................................................................................... 78
6.3.17 Contribution of the CADP to development ............................................................ 78
6.4 Conclusion ...................................................................................................................... 78
CHAPTER SEVEN ..................................................................................................................... 80
POTENTIAL ENVIRONMENTAL AND SOCIAL IMPACTS AND SIGNIFICANCE .... 80
7.1 Methodology for Impact Identification .......................................................................... 80
7.2 LSCADP and Associated Activities ............................................................................... 80
7.3 Project activities and potential environmental and social impacts ................................. 80
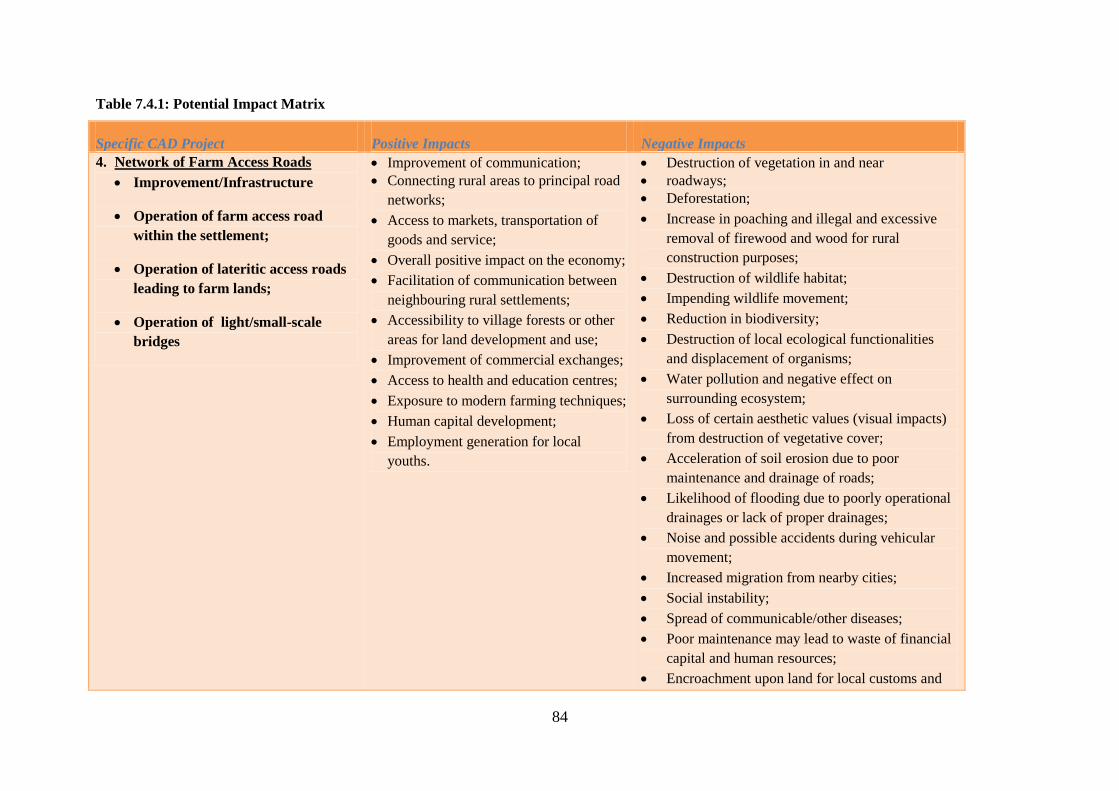
7.3.1 Positive Impacts of the Project on the Agricultural Sector ..................................... 80
7.3.2 Negative environmental and socio-economic impacts ........................................... 82
7.3.7 Impacts Associated with Fish Farming Development and Commercialisation ...... 83
7.3.8 Cumulative Impacts of the Project .......................................................................... 83
CHAPTER EIGHT ..................................................................................................................... 90
PROJECT IMPACT MITIGATION MEASURES ................................................................. 90
8.0 Introduction .................................................................................................................... 90
8.1 Best Available Control Technology ............................................................................... 87
8.2 Operations and Maintenance of Farm Access Roads ..................................................... 87
8.2.1 Air quality and noise ............................................................................................... 87
8.2.2 Water quality ........................................................................................................... 88
8.2.3 Ecology and biodiversity ........................................................................................ 88
8.2.4 Wildlife and forestry ............................................................................................... 89
8.2.5 Socioeconomic and community health ................................................................... 89
8.3 Operations and maintenance of Rural Energy .................................................................... 90
8.3.1 Socioeconomic and community health ................................................................... 90
8.3.2 Ecology and biodiversity ........................................................................................ 91
8.4 Operations and maintenance of other intervention projects ........................................... 92
CHAPTER NINE ........................................................................................................................ 95
ENVIRONMENTAL AND SOCIAL MANAGEMENT PLAN (ESMP) .............................. 95
9.1 Environmental and Social Management Plan ................................................................ 95
Page 5
5
9.2 Organizational Responsibility ......................................... Error! Bookmark not defined.
9.3 Implementation Schedule ............................................................................................. 102
CHAPTER TEN ........................................................................................................................ 105
CONCLUSION AND RECOMMENDATIONS .................................................................... 105
REFERENCES .......................................................................................................................... 108
APPENDICES ........................................................................................................................... 111
Page 6
6
LIST OF FIGURES
Figure 4.1: The ESIA Process ………………………………………….………………………36
Figure 5.1.1: Ikorodu Fish Farm Estate with specific CADPs i.e. Farm Access
Roads and Rural Energy …………………………………………………..……..44
Figure 6.3.2.1: Population Estimation and Projection of Lagos State …….…………….65
Figure 6.3.2.2 Population Estimation and Projection of Ikorodu LGA …………………..65
Figure 6.3.3.1: Age Profile of Respondents …………………………………………..……..66
Figure 6.3.4.1: Sex Profile of Respondents ………………………………………….....……67
Figure 6.3.5.1.1: Marital Status …………………………………………………..….….68
Figure 6.3.5.2: Size of Households …………………………………………..……..………69
Figure 6.3.10.1: Health Status of Sampled Individuals and Households …….……….……75
Figure 6.3.14.1: Community Environmental Issues ………………………………….….……77
Page 7
7
LIST OF TABLES
Table 3.2.4.1: Summary of World Bank Safeguard Policies ………………………………....…35
Table 5.1: Air quality and noise sampling locations ……………………………..…..…50
Table 5.2: List of air quality equipment used on-site for measurement ……………..……..50
Table 5.3: Concentration of ambient air quality parameters in and
around the project site …………………………………………………………….…..…51
Table 5.4: Ground water sampling locations ……………………………………..….….52
Table 5.5: Physico-chemical characteristics of groundwater samples
from the study area …………………………………………………………….……..53
Table 5.6: Microbial characteristics of ground water samples from
the study area …………………………………………………………………….……..55
Table 5.7: Physico-chemical properties of top soils from the study area ………...….56
Table 5.8: Physico-chemical properties of sub soils from the study area …………....……..56
Table 5.9: Concentrations of cations in top soils from the study area ……………..……....58
Table 5.10: Concentrations of cations in sub soils from the study area ………..…….…….58
Table 5.11: Heavy metals concentrations in top soils from the study area ………....…59
Table 5.12: Heavy metals concentrations in sub soils from the study area ………..…..59
Table 6.3.6.1: Residential Status of Respondents …………………………..…………..……69
Table 6.3.6.1.1: Duration of Living in the Estate ………………..…………………………..70
Table 6.3.7.1: Level of Education of Respondents ………………………………..……..……71
Table 6.3.8.1: Main Occupation of Respondents …………………………………..………..71
Table 6.3.9.1: Income Status ………………………………………………………….……..…72
Table 6.3.10.1: Type of building ……………………….…………………………..……….73
Page 8
8
Table 6.3.13.1: Sources of Domestic Water ………………………..…………………………..76
Table 7.4.2: Potential Impact Matrix……….…….……………………….……………………..88
Table 8.3.1.1: Mitigation/Best Management practices for rural energy power …………....……95
Table 8.4.1: Mitigation/Best Management practices for other intervention projects ……...……96
Table 9.1.1: Environmental and Social Management Plan (ESMP) for
Farm Access Roads ……………………………………………………………….….100
Table 9.1.2: Environmental and Social Management Plan (ESMP) for Rural Energy ………...102
Table 9.1.3: Environmental and Social Management Plan (ESMP) for
other intervention projects ………………………………………………………..…103
Table 9.1.4: Cost Analysis of ESMP Measures ………………………………………..…105
Table 9.5.1: Tentative ESMP Development Schedule ……………………………..……106
Page 9
9
LIST OF ACRONYMS
AAS - Atomic Absorption Spectrophotometer
BOD - Biochemical Oxygen Demand
CAD - Commercial Agricultural Development
CADP - Commercial Agricultural Development Project
LSCADP - Lagos State Commercial Agricultural Development Projects
cfu - colony forming units
COD - Chemical Oxygen Demand
CV. - Coefficient of Variation
dB - decibel
DO - Dissolved Oxygen
EIA - Environmental Impact Assessment
ESIA - Environmental and Social Impact Assessment
ESMP - Environmental and Social Management Plan
FEPA - Federal Environmental Protection Agency
FMAWR - Federal Ministry of Agriculture and Water Resources
FMEnv - Federal Ministry of Environment
g - gram
GPS - Global Positioning System
Ha - Hectare
hr/h - hour
H2S - Hydrogen sulphide
ISO - International Standard Organisation
kg - kilogramme
km - kilometer
L - litre
LASEPA - Lagos State Environmental Protection Agency
LGA - Local Government Area
m - metre
max - maximum
mg - milligram
Page 10
10
min - minimum
mm - millimeter
N - North
NOx - Nitrogen Oxides
NTU - Nephelometric Turbidity Unit
oC - Degree Celcius
% - per cent
ppm - parts per million
PPP - Public Private Partnership
Pt-Co - Platinum Cobalt
SS - Suspended Solids
TDS - Total Dissolved Solids
THB - Total Heterotrophic Bacteria
THF - Total Heterotrophic Fungi
TOC - Total Organic Carbon
TSP - Total Suspended Particulate
TSS - Total Suspended Solids
WHO - World Health Organization
> - greater than
< - less than
μm - micrometer
Page 11
11
EXECUTIVE SUMMARY
Lagos State Government has received an advance on the proceeds of a credit through the World
Bank Assisted Commercial Agricultural Development Project to finance the State Commercial
Agriculture Project. Under the auspices of Lagos State Ministry of Agriculture and Cooperatives,
the projects were developed as infrastructure support towards enhancement of agriculture
productivity, expansion and exposure of the rural areas to modern techniques of agriculture. In
particular, the project objective is to improve the investment avenue for agri-business and
establish all-encompassing PPPs aimed at enhancing farm productivity and value addition in the
selected value chains (poultry, rice and aquaculture). These initiatives cover two sub-components
namely networks of farm access roads and rural energy.
Description of Project Activities
ESIA of CADPs at Odogunyan Farm settlement concerned with the assessment of the
environmental and socio-economic impacts of the World Bank financed proposed projects
activities for the development of Catfish production (aquaculture). The intervention projects
will assist to close the infrastructure gaps and enhance agricultural commercialization. This
component covers two sub-components namely networks of farm access roads and rural energy.
Other aspects of the project include: water support for general agricultural practices; farm input
such fingerlings for aquaculture; and provision of drainage system.
Safeguard Instruments and Rationale for the ESIA
ESMF, PMP and RPF are the existing safeguard instruments that address the triggered policies
of environmental assessment, pest management and involuntary resettlement. ESIA is identified
as all-encompassing EA for any proposed development project. It addressed the adverse
environmental impact of the LSCADP proposed intervention projects with a view to enhance
project benefits and introduce standards of good environmental practice for agricultural
development in the state.
Policy, Legal and Administrative Framework
The requirement for an Environmental Assessment is in compliance with the Federal Republic of
Nigeria‟s (FRN) laws and WB policies geared towards achieving sustainable development goals
through proper and adequate care for the environment, health and social well-being of her
Page 12
12
citizens. The project impacts covered small scale and site-specific infrastructure investment
projects associated with category B projects of the World Bank. This report was prepared in
accordance with provision of ESMF, RPF and IPMP. The relevant WB safeguards policies
triggered by the LSCADP intervention projects include: OP/BP 4.01 - Environmental
Assessment, OP/BP 4.04 - Natural Habitats and OP/BP 4.09 – Pest Management. It worth to
know that, Nigeria EIA laws are similar to World Bank safeguard policies, However, in the event
of conflict between the two, World Bank Safeguard Policies shall supersede. Also, the Federal
laws overrule the Lagos state laws in case of discrepancy.
Biophysical Environment
The assessment of biophysical environment of the study area covered general climate and
meteorology, air quality and noise level, topography, regional hydrology, water and soil quality,
geology, ecosystem, vegetation, plant physiognomy, inventory of economic crops, and fauna and
wildlife resources. In this regard, most parameters measured were in conformity with local and
international standards and mitigation measures were provided where environment will be
affected.
Policy, Legal and Administrative Framework
The requirement for an Environmental Assessment is in compliance with the Federal Republic of
Nigeria‟s (FRN) laws and policies geared towards achieving sustainable development goals
through proper and adequate care for the environment, health and social well-being of her
citizens. The project impacts covered small scale and site specific infrastructure investment
projects associated with category B projects of the World Bank. The World Bank is guided by
policies/procedures to ensure the safe development of its funding projects. The relevant WB
safeguards policies triggered by the LSCADP intervention projects include: OP/BP 4.01 -
Environmental Assessment, OP/BP 4.04 - Natural Habitats and OP/BP 4.09 – Pest
Management. The World Bank safeguard policies overrule the Nigeria and the Lagos State
policies should there be discrepancy.
Socio-economic Characteristics
The population of fish farmers in the Ikorodu fish farm estate is characterized by: a high
proportion (75%) of farmers aged 50 years and above; a high proportion of households and
Page 13
13
individual comprising couples with children (2-4); the adult population who are supposed to be
the labour force are less 20%; and proportion of male to female was 55% to 45%.
Consultation with Stakeholders
Public consultations were held with the local communities and all other interested/affected
parties including the project donees. These consultations identified the key issues and concerns
of all parties and addressed them with reference to the proposed sub-projects activities. The
consultations included vulnerable groups within the community, specifically the poorest of the
poor, elderly, widows and widowers, and women. Besides, the local governments and the
Commercial Agriculture Development Association (CADA) provided all relevant materials and
information regarding the proposed projects prior to the consultation.
Potential Environmental and Socio-economic Impact Mitigation
All identifiable components of the environment and social sphere were considered with respect
to the projects implemented at the Ikorodu Fish Farm Estate in order to streamline the adverse
impacts on the stakeholders. With respect to all the intervention projects, the best available
control technology was stated as the principal mitigation measure while there are others stated
for the specific impact. Proper waste disposal systems, planting of fire-resistant trees, speed limit
indications and speed breaker, controlled chemical application, integrated vegetation
management, engagement of the community on health, safety and environment, amongst others
were stated as mitigation measures.
Risk Mitigation Measures
Risks Risk Mitigation Measures Risk Rating
with
Mitigation
To project development
objective
Lack of sustainability of
sub-projects after the
project has closed and/or
the grant is ended, and
lack of maintenance of
infrastructure provided
under the project.
Attention to economic viability of the sub-projects and
maintenance of infrastructure . Creation of innovative
products through linking commercial farms with financial
institutions (i.e. supply chain financing, future markets,
crops as collateral and graduation of the commercial
farmers from the Matching Grant Scheme).
M
Government commitment
to the project falters due to
change in policy and
orientation towards
agriculture
Investment in public information, stakeholders awareness
raising and communication about the approaches and
results of the Project.
M
Page 14
14
commercialization.
Counterpart contributions
not paid on time, or are
irregular.
Federal Government and States agreed to counterpart
contributions and this will be closely monitored during
implementation.
H
Collusion and/lack of
transparency and
accountability in the
management of funds at
the beneficiary level.
Random audits ex-post will be conducted by CADA in
addition to the financial statement audit with focus on the
utilization of the matching grant that funds spent on
intended purpose and beneficiaries will receive value for
their money. Details of these are documented in the FPM
under community participation. The TOR for the audit is
included in the PIM.
M
Procurement Risks.
Insufficient
knowledge and experience
with Bank procurement
may cause delays in
project implementation
Random audits ex-post and spot-checks of accounts by
CADAs to confirm grants are used for the intended
purpose. (i) Procurement and implementation training
will be provided to key staff during project
implementation; (ii) experienced Procurement Specialist
will be hired to assist and coordinate the states‟
procurement functions and provide on-the-job training to
the state officials; (iii) intensive supervision of the
agencies‟ staff by the Bank field office Procurement
Specialist.
M
Overall Risk Rating M
Environmental and Social Management Plan (ESMP) for Farm Access Roads
S/N Environmental and
social impact
Mitigation measures Monitoring Responsibility
1. The potential air
quality and noise
impact will include:
Increased noise
level and dusts
due to vehicular
movement
Gaseous
emissions from
vehicles plying
the roads;
Health and
safety issues of
both the
residents and
the road users
due to vehicular
speed and
introduction of
harmful gaseous
Speed breaks should be
introduced at specific
junctions and wetting of
land surface must be
done
Trees should be planted
with 5 metres distance
between road and
residential areas in order
to reduce noise.
Road signs indicating
the speed limit should
be erected at particular
sections of the road;
The use of rickety
vehicle should not be
allowed
Regular check for
adherence to safety
concerns;
Ensure that all
areas have trees
planted along the
road corridors;
Ensure that road
signs are placed
along the road
corridors;
Ensure that speed
limits are strictly
adhere to;
Ensure that
vehicles are in
good condition so
as not to pollute
the environment
when driven along
the roads.
ESMO,
RIO,
Facilitator
Road,
CADA,
CIGs
Page 15
15
The environmental and social management plan prepared for this study is project-based. The
ESMP highlighted the impacts vis-à-vis the mitigation, the monitoring approach and the agency
responsible for apt follow-up of the provisions. A cost estimate of t ($13000) was provided as the
cost implication for the application of the proposed measures. Further, a coherent
implementation schedule was provided which is a technique for implementing the provisions of
the ESMP with designed period of implementation.Detailed ESMP is found in chapter 9
Conclusion and Recommendations.
The identified impacts are minor, the recommended mitigations are able to address the
issues resulting in minimal or no effect on the environment.
It is evident that, the proposed project by LSCADP was a step in the right direction as this will
enhance the productivity and living standard of the fish farmers. In this regard, more are still
expecting from the LSCADP to further enhance agricultural productivity of the farmers
particularly in the following area: health centre/clinic; waste management facilities; loan and
credit facilities to farmers; waste processing factory for effluents and recycling of waste water
from fish pond; and processing facilities for harvested fish preservation.
Page 16
16
CHAPTER ONE
INTRODUCTION
1.0 Background
Agricultural development considered to be the dominant theme of Lagos agricultural policy
under the new Public Private Partnership (PPP) programme. This particularly placed the private
investor in a strong role of transforming agriculture from a low-productivity subsistence-based
sector to one characterized by high-productivity, integrated value chains, and extensive value
addition in order to enhance food security in the Lagos state.
In this regard, the Lagos State Government has received an advance on the proceeds of a credit
through the World Bank Assisted Commercial Agricultural Development Project to finance the
State Commercial Agriculture Project. This project is under the responsibility of the Lagos
Ministry of Agriculture and Cooperatives. The project objective is to improve the investment
avenue for agri-business and establish all-encompassing PPPs aimed at enhancing farm
productivity and value addition in the selected value chains (Poultry, Rice and Aquaculture).
The project interventions and activities prompted the environmental assessment policy
(OP.4.01). The impacts covered small scale and site specific infrastructure investment projects
associated with category B projects of the World Bank as well as generated sections of the
Environmental Assessment Regulations of the Lagos State Environmental Protection Agency
(LASEPA). It therefore necessitates the Environmental and Social Impact Assessment (ESIA).
The ESIA takes into consideration the range of the project activities and institutional
arrangements for project implementation to safeguard the Environment. As a result of the
anticipated impacts of operational stage of the intervention, LSCADP engaged the service of an
independent consultant to investigate the impacts of her micro projects intervention.
In general, the intervention project which in this sense concerned rural infrastructure will assist
to close the infrastructure gaps and enhance agricultural commercialization. This component
covers two sub-components namely networks of farm access roads and rural energy. The former
Page 17
17
will link feeder roads to State and Federal roads through Outputs and Performance Based Road
Contracts while the latter will finance the rehabilitation and maintenance of rural energy,
including provision of transformers and extension of lines from the main transmission lines to
commercial farmers and agro-processing facilities in collaboration with the Power Sector
Reform Project. Other aspects of the project include:
1. Farm Access Roads;
Improvement/Infrastructure
Operation of farm access road within the settlement;
Operation of lateritic access roads leading to farm lands
Operation of light/small-scale bridges
2. Power Supply Infrastructure;
Transformers equipped with facilities such as up-risers, HT poles;
Replacement of damaged/faulty transformers
Development and rehabilitation of damaged/faulty HT poles;
Maintenance of power supply infrastructure
Rural electrification projects
Expansion and rehabilitation of power facilities, etc.
3. Aquaculture Inputs;
Farm input such fingerlings for aquaculture.
Provision of drainage system.
Provision of smoking kiln.
Regarding agricultural development, poultry, rice and aquaculture are in the value chain being
supported by the Commercial Agriculture Development Project in the State.
1.1 Tasks of the Consultant
Environmental and Social Impacts Assessment (ESIA) is a key aspect of many agricultural
development applications recommended under the Lagos State Commercial Agricultural
Development Project. This technique is meant to assist in understanding the potential
environmental and social impacts, positive and negative, on the environment, the affected
farmers and farm settlements, and the beneficiary. The tasks of this ESIA study are to:
Page 18
18
Thoroughly document ecological baseline conditions (existing environmental conditions)
of the study area and the socio-economic conditions of the affected communities and
farmers including beneficiaries.
Place the ecological baseline conditions of the sites in the context of the surrounding
region.
Inform, obtain and address contributions from stakeholders including relevant authorities
and the public.
Assess in detail, the environmental and social impacts resulted from the project
Identify mitigation measures that would reduce the significance negative impacts or
enhanced benefits of LSCADPs.
Meet the requirements of the environmental regulatory agencies in Nigeria and Lagos
state in particular as well as international best practice (WB, EPA) for project of this
nature.
Identify and assess potential environmental and socials impacts of the projects.
Identify all potential significant adverse environmental and social impacts, of the projects
and recommend measures for mitigation.
Review and develop an Environmental and Social Management Plan (ESMP).
Prepare an Environmental and Social Impact Assessment report compliant to the relevant
authorities (WB, EPA, FMEnv., LASEPA etc.) and detailing findings and
recommendations.
1.2 Objectives of the Study
The ESIA for the LSCADP interventions will help address the adverse environmental impact of
the project implemented, enhance project benefits, and introduce standards of good
environmental practice in the existing and proposed intervention projects for agricultural
development in the state. The primary objectives of the ESIA are to:
Identify the significant adverse environmental and social impacts resulting from the
LSCADP interventions;
Facilitate the implementation of the mitigation measures identified by providing the
technical details of each impact , and providing implementation schedule;
Page 19
19
Define the responsibilities of project proponents, contractors and other role players, and
effectively communicate environmental and social safeguards issues among them;
Define a monitoring mechanism and identify monitoring parameters to ensure that all
mitigation measures are completely and effectively implemented; and
Identify training requirements at various levels and provide a plan for implementation.
1.3 Scope of the Study
The ESIA scope of work covers the assessment of the impacts of LSCADP interventions at
Ikorodu Fish Farm Estate in Ikorodu Local Government Area. The intervention at the Ikorodu
Fish Farm Estate intended to enhance Catfish production and to improve standard of living of the
fish farmers for sustainable catfish production in Lagos State.
The environmental and social issues that have been specifically considered within this ESIA
include:
the state of rehabilitated farm access roads and it impacts on physical and human
environment;
the impacts of energy intervention on livelihood and productivity of the faamers
the impacts of interventions on physical and human environment, and socio-economic
activities of the beneficiaries, project affected farmers and communities;
Solid and liquid waste management and minimization;
Noise level;
Human and vehicular movement; and
Traffic/vibration management.
Page 20
20
CHAPTER TWO
LAGOS STATE COMMERCIAL AGRICULTURE PROJECT
2.1 Background
Lagos State Commercial Agriculture Development Association (LSCADA) has implemented
some projects intended to boost agricultural productivity and living standard of her farmers. In
order to achieve one of the Millennium Development Goals (that is, to eradicate extreme poverty
and hunger) and increase agricultural output in the state, the association has decided to
implemented some germane intervention projects in this regard. The approach adopted is based
on examination of similar drives in some parts of the country with philosophy that increased
agricultural production translates to greater food production and ensuring national food security
for the nation.
In line with this, Lagos State Government is adopting a new approach of public-private
partnerships (PPPs) in which complementary and targeted public support serves to facilitate
private investment in the agriculture sector. A major thrust of the new approach centres on
enhancing the role of commercial agriculture and strengthening agricultural value chains. Under
the programme, the Government is seeking to broaden and deepen private sector investment in
agriculture. Note that the programme is already occurring but can be augmented in many ways.
Innovative institutional arrangements between large scale investors and small-holders can
generate mutual benefits and provide effective mechanisms for bolstering small-holder
productivity. For instance, out-grower schemes provide linkages between vertically integrated
plantations and surrounding small-holders. Contract farming arrangements can provide benefits
for input and output dealers and small-holder farmers.
To this end, the Government is keen to develop agriculture through public private partnership
and provide support to encourage the development of nucleus investment arrangements for the
benefit of local smallholder farmers.
Page 21
21
2.2 Development Objective and Approach in Lagos
CADP is a comprehensive five-year project developed by the Federal Ministry of Agriculture
and Water Resources (FMAWR) in collaboration with the World Bank and other stakeholders.
This is to help participating small and medium scale commercial farmers to access improved
technology, infrastructure, finance and output markets. The project interest is on commercial
agriculture development in Nigeria.
The project development objective is to improve the investment climate for agri-business and
establish inclusive PPPs aimed at increasing on-farm productivity and value addition in the
selected value chains (Poultry, Aquaculture, and Rice) which was based on comparative
advantage and the contribution to agricultural growth. The main outcome of the project would be
an improved investment climate that delivers high productivity and food security in Lagos
agricultural setting.
2.3 Project Justification and Design Principles
The basic strategy of this project is to improve the business environment for agriculture to
become more successful by gradually shifting from subsistence to commercial agriculture. The
Project will strive to sustainably boost the incomes of target beneficiaries, through the value
chain approach with strong emphasis on stakeholder participation.
2.3.1 Key Performance Indicators
The key performance indicators for Lagos CADP are:
i. 25% Increase in total production and processing of the targeted value chains (rice, poultry
and aquaculture) among participating small and medium scale commercial farmers.
ii. 30% Increase in total sales of agricultural products under the targeted value chains (rice,
poultry and aquaculture) among participating small and medium scale commercial
farmers.
2.3.2 Project Components
The project has two components namely:
Page 22
22
2.3.2.1 Agricultural Production and Commercialization
The objective of this component is to improve the adoption of existing and new agricultural
technologies by commercial farmers and processors along the selected value chains. The
component has four sub-components:
i. Technology Demonstration and Adoption
ii. Support to Staple Crop Production Systems
iii. Market Facilitation and
iv. Capacity Building
2.3.2.1 Rural Infrastructure
The project will assist to close the infrastructure gaps to enhance agricultural commercialization
by providing resources for the construction, rehabilitation and maintenance of network of
selected farm access roads using the Output and Performance Based Road Contracts (OPRC)
concept and connecting commercial farms to rural electrification. This component covers two
sub-components:
(i) Network of Farm Access Roads and
(ii) (ii) Rural Energy.
Page 23
23
CHAPTER THREE
POLICY, LEGAL AND ADMINISTRATIVE FRAMEWORK
3.1 Introduction
The environment has emerged as one of the most topical issues of contemporary times. This is in
realization of the ever-increasing negative environmental impacts of rapid industrial and
infrastructural development. As natural resources are being exploited at rates unprecedented in
human history, the quality of the environment deteriorates and many of the development projects
become unsustainable. This has therefore necessitated the enforcement of relevant environmental
protection laws in order to protect and restore the Nigerian environment.
The requirement for an Environmental Assessment is in compliance with the Federal Republic of
Nigeria‟s (FRN) laws and WB policies geared towards achieving sustainable development goals
through proper and adequate care for the environment, health and social well-being of her
citizens. This report was prepared in accordance with provision of ESMF, RPF and IPMP that
were prepared and disclosed by CADP in Nigeria.
The Constitution of the Federal Republic of Nigeria (CFRN) of 1999 provides the general thrust
of the nation‟s environmental policy through S. 20 that provides: “The State shall protect and
improve the environment and safeguard the water, air and land, forest and wild life of Nigeria.”
Consequently, subsidiary laws and regulations have been made and international conventions
and other instruments entered into pursuant to the constitution‟s set objectives.
These include:
Laws and regulations, standards, policies, codes and recommended practices relating to
the Infrastructural Development by the Nigerian Government and its Agencies such as
the Federal Ministry of Environment and the Lagos State Ministry of Physical Planning.
International guidelines and conventions to which Nigeria is a signatory.
National Policy on Environment (1989) and as reviewed in 1999
Page 24
24
3.2 Federal and Lagos State Environmental Regulatory Bodies
The bodies responsible for environmental regulation at Federal and state levels include:
Federal Ministry of Environment (1999 Presidential Directive; and
The National Environmental Standards and Regulations Enforcement Agency (NESREA)
Act No 25 of 2007.
With regard to sewage and domestic effluent control there are Federal Regulations and State
Sanitation Laws. Some of these regulations include:
The National Guidelines and Standards for Environmental Pollution control in
Nigeria (March, 1991), which is the basic instrument for monitoring and controlling
industrial and urban pollution;
The National Environmental Protection (Effluent Limitation) Regulations S.I.8 of
1991, which makes it mandatory for industrial facilities to install anti-pollution
equipment, makes provision for effluent treatment.
The National Environmental Protection (Pollution Abatement in Industries and
Facilities Generating Wastes) Regulations S.I.9 of 1991, which imposes restrictions on
the release of toxic substances and stipulates requirements for monitoring of pollution, it
also makes it mandatory for existing industries and facilities to conduct an environmental
audit;
The National Environmental Protection (Waste Management) Regulations S.I.15 of
1991, which regulates the collection, treatment and disposal of solid and hazardous
wastes from municipal and industrial source.
Environmental Impact Assessment (EIA) Act Cap 131 LFN 1991.
3.3 Sectoral EIA Guidelines
In September 1995, FEPA (now Federal Ministry of Environment) published Sectoral EIA
Guidelines for Infrastructural Projects. The Guidelines are for any project that involves:
Coastal Development Project;
Port and Harbour Development Project;
Railways;
Page 25
25
Roads and Highways;
Airports;
Urban development project;
Domestic water supply and sanitation project; and
Electrification projects.
Statutory Limits for Effluents and Gaseous Emissions: The Guidelines and Standards for
Environmental Pollution Control in Nigeria (FEPA, 1991) provides interim permissible limits as
protective measures against indiscriminate discharge of particulate matter and untreated
industrial effluents into lakes, rivers, estuaries, lagoons and coastal waters.
Air Quality Standards: There are ambient air quality limitations and standards in Nigeria
enforced by the FMENV, NESREA and LASEPA.
Laws:
Harmful Waste (Special Criminal Provisions etc.) Act. Cap 165, LFN 1990 seeks to
prevent the authorized dumping or depositing of harmful waste on water or land and
criminalizes the act of transporting, dumping and depositing harmful waste on land or
water. The Decree‟s provisions make it clear that management of a corporate body may
be liable for the offence.
Criminal Code Act Cap 77 LFN 1990. The Act specifies that fouling of water bodies is
a criminal offence.
Land Use Act Cap 202 LFN 1990. This legislation put an end to absolute ownership of
land by the individual and community and vests “all land comprised in the territory of
each state (except land vested in the Federal Government or its agencies) solely in the
Governor of the State, who would hold such land in trust for the people.”
Lagos State Ministry of Environment and Lagos State Commercial Agriculture
Development Project (LSCADP) Edicts
All the States in Nigeria have power to make laws with respect to the environment under the
Constitution. This is because the subjects relating to the environment are contained in the
concurrent legislative list.
Page 26
26
Lagos State established the State Environmental Protection Agency (LASEPA) in 1996. The
edict spells out clearly the functions and authority of the agency, and also imposed restrictions on
the release of toxic materials into the environment as well as responsibilities of industries whose
operations are likely to negatively impact the environment.
Specific functions of the agency include:
monitoring and controlling of disposal of wastes generated within the State;
monitoring and controlling of all forms of environmental degradation from agricultural,
industrial and government operations;
monitoring of surface, underground and potable water, air, land and soils within the State
to determine the pollution level as well as collect baseline data;
Co-operating with federal, state and local governments on matter and facilities relating to
environmental protection
The Agency is empowered to apply enforcement measures to make regulations to control water,
air, soil and noise pollution; effluent discharge standard and waste management. The edict also
empowers the Agency to combat environmental degradations in manufacturing premises and
government operations; analyses samples of any substance found in any premises searched, etc.
Lagos Waste Disposal Board Edict
The Waste Disposal Board was established in 1977 by vide Edict No.9 of April, 1977 to
coordinate refuse disposal activities in Lagos State. Initially it was mandated to take charge of
general environmental sanitation and the collection, disposal, and management of domestic
refuse.
Subsequently, it was assigned the responsibility of cleaning primary and secondary drains,
collection and disposal of industrial wastes, flood relief activities, and the collection and disposal
of scrap and derelict vehicles.
Lagos Urban & Regional Board and Town Planning Authority Edict
To control and regulate indiscriminate development in the state, the LASG established the Urban
& Regional Board and Town Planning Authority in 1997. Specific functions of the board
include:
Page 27
27
Formulate state policies for urban and regional planning and development, including
spatial location of infrastructural facilities.
Advise state government, initiation of and prepare regional and sub-regional plans for the
state;
Outline development plans and other physical development plans and schemes embracing
spatial distribution of major roads, location of industrial, commercial, residential as well
as recreational facilities.
The establishment and operation of an effective development control organ on state lands
The provision of technical assistance to the local government;
The edict also emphasize that each Local Government Area are to establish planning authorities
which shall be responsible for preparing town, rural and local plans and control development
activities within its area of jurisdiction.
The edict further stipulates that developers shall submit an environmental impact assessment
report in respect of applications for residential land in excess of half an hectare and/or
development in excess of 4 floors; factory building; commercial buildings; places of worship and
petrol service stations.
Lagos State Environmental Law, 1994
Lagos State Sanitation Edict, 2004
The Lagos State Town and Country (Building Plan) Regulations of 1986
Lagos State Urban and Development Regional Planning and Development Law of 2005
Other Statutory Regulations, Legislations and Guidelines related to infrastructural Development
activities in Nigeria include:
Nigerian Urban and Regional Planning Law No 88 of 1992,
National Guidelines for Environmental Audit in Nigeria, 2011,
Guidelines and Standards for Environmental Pollution Control 1991,
Guidelines on Hazardous Chemicals Management 1998,
Guidelines on Safe and Effective Use of Pesticides 2001,
National Guidelines on Environmental Management Systems, and
Page 28
28
Blueprint on Environmental Enforcement: A Citizens Guide.
3.4 World Bank Safeguard Policies
World Bank Safeguards Policies provide a platform for the participation of stakeholders in
project design and have been an important instrument for building a sense of ownership among
local populations. The World Bank‟s Environmental and Social Safeguard Policies are
cornerstones of its support to sustainable poverty reduction and therefore ensure that
Environmental and Social issues are evaluated in decision making towards reducing and
management of project/programme risk. The process inherently provides mechanisms for
Consultations and Disclosure of Information to the public and relevant stakeholders.
The CADP has been categorized as B implying that the expected environmental impacts are
largely site-specific, that few if any of the impacts are irreversible, and that mitigation measures
can be designed relatively readily. The environmental assessment for a Category B project,
• examines the project‟s potential negative and positive environmental impacts,
• recommends measures to prevent, minimize, mitigate, or compensate for adverse
impacts, and
• recommends measures to improve environmental performance
The World Bank has 10 Environmental and Social Safeguard Policies to reduce or eliminate the
adverse effects of development projects, and improve decision making. These operational
policies include:
• OP/BP 4.01: Environmental Assessment
• OP/BP 4.04: Natural Habitats
• OP 4.09: Pest Management
• OP/BP 4.12: Involuntary Resettlement
• OD 4.20: Indigenous Peoples
• OPN 11.03: Cultural Property
• OP 4.36: Forests
• OP/BP 4.37: Safety of Dams
• OP/BP 7.50: Projects on International Waters
• OP/BP 7.60: Projects in Disputed Areas
Page 29
29
The LSCADP proposed intervention project activities triggered the Bank Policy OP 4.01 on
Environmental Assessment (EA). A screening exercise was carried out by the LSCADP to
determine whether the World Bank OP 4.12 would be triggered by her intervention initiatives
through the deployment of some impact indicators and it was concluded that the Bank‟s OP 4.12
on Involuntary Resettlement had not been triggered by the project. In essence the need to
conduct an Abbreviated Resettlement Action Plan (ARAP) or Resettlement Action Plan (RAP)
study is not necessary. ESMF, PMP and RPF are the instruments used to address the triggered
policies of environmental assessment, pest management and involuntary resettlement. The report
is prepared in accordance with provision of ESMF disclosed and prepared by CADP.
3.4.1 Environmental Assessment (OP 4.0.1)
OP 4.01is triggered by the LSCADPs‟ proposed project activities which allows the use of
Environmental and Social Management Framework (ESMF) as EA safeguard instrument. This
becomes pertinent when “a project consists of a programme and/or series of sub-projects, which
impact(s) can be determined and identified” before project appraisal. In this regard LSCADA
projects fall within these categories and therefore triggered by the WB policy. Lagos State
Commercial Agriculture development Projects are dominated by the expansion of the farm
access roads and rural electrification, the facilitation of and improvements in the selected value
chain (aquaculture, poultry farming and rice production) in the ever expanding Lagos state.
The OP 4.01 requires among others that screening for impacts is carried early, in order to
determine the level of EA to assess and mitigate potential adverse impacts. The Bank‟s project
screening criteria group projects into three categories.
Category A - Detailed Environmental Assessment;
Category B - Initial Environmental Examination and
Category C - Environmental Friendly
The EA ensures that appropriate levels of environmental and social assessment are carried out as
part of project design, including public consultation process, especially for Category A and
Category B projects. The OP 4.01 is applicable to all components of Bank financed projects,
even for co-financed components. However, the LSCADPs classified within the Category B of
the OP 4.01.
Page 30
30
The World Bank and Nigeria‟s EA requirements and operational procedures were harmonized
early on the CAD projects with the development of the ESMF which sets out requirements &
responsibilities for sub-project-specific. Going by this, ESMP has been developed and
incorporated at the point of implementation of subproject in response to the objectives of good
practice, particularly, in the following respects.
An early consideration of the environmental and social issues (starting at the screening
stage);
Identification and early consultation with stakeholders;
Prevention of adverse impacts through the consideration of feasible alternatives; and
Incorporation of mitigation measures into planning and (engineering) design.
The main levels of environmental Assessment following screening and scoping under the
Nigerian Regulations are that:
Environmental Impact Assessment (EIA) required;
Partial/ Preliminary Environmental Assessment Required;
No Further Environmental Assessment required
This corresponds in principle to the World Bank‟s Environmental Assessment
requirements of Category B.
3.4.2 OP 4.04 - Natural Habitats
The conservation of natural habitats, like other measures that protect and enhance the
environment, is essential for long-term sustainable development. The Bank therefore supports
the protection, maintenance, and rehabilitation of natural habitats and their functions in its
economic and sector work, project financing, and policy dialogue. The Bank supports, and
expects LSCADP to apply, a precautionary approach to natural resource management to ensure
opportunities for environmentally sustainable development.
The OP 4.04 (Natural Habitats) issue includes identification of (a) natural habitat issues and
special needs for natural habitat conservation, including the degree of threat to identified natural
habitats (particularly critical natural habitats), and (b) measures for protecting such areas in the
context of the country's development strategy. The major natural habitat issues include
identification of important natural habitat sites, the ecological functions they perform, the degree
Page 31
31
of threat likely to impose by proposed activities, priorities for conservation, and associated
recurrent-funding and capacity-building needs.
It also expects to take into account the views, roles, and rights of groups, including local
nongovernmental organizations and local communities, affected by Bank-financed projects. Also
part of the issue is to involve affect people in planning, designing, implementing, monitoring,
and evaluating such proposed projects. Involvement may include identifying appropriate
conservation measures, managing protected areas and other natural habitats, and monitoring and
evaluating specific projects. The Bank encourages governments to provide such people with
appropriate information and incentives to protect natural habitats.
3.4.3 OP 4.09 - Pest Management
To manage pests that affect either agriculture or public health, the World Bank supports a
strategy that promotes the use of biological or environmental control methods and reduces
reliance on synthetic chemical pesticides. In Bank-financed projects, the LSCADP addresses
pest management issues in the context of the project‟s environmental assessment.
This involves the use of various means to assess pest management in the country and support
integrated pest management (IPM) and the safe use of agricultural pesticides: economic and
sector work, sectoral or project-specific environmental assessments, participatory IPM
assessments, and investment projects and components aimed at supporting the adoption and use
of IPM.
Under the World Bank policies, pest populations are normally controlled through IPM
approaches, such as biological control, cultural practices and the development, and use of crop
varieties that are resistant or tolerant to the pest. The World Bank may finance the purchase of
pesticides when their use is justified under an IPM approach.
In this regard, the World Bank supports controlling pests primarily through environmental
friendly methods. Where environmental methods alone are not effective, the World Bank may
finance the use of pesticides for control of disease vectors. This is based on an assessment of the
nature and degree of associated risks, taking into account the proposed use and the intended
users. The following criteria apply to the selection and use of pesticides in Bank-financed
projects:
Page 32
32
(a) They must have negligible adverse human health effects.
(b) They must be shown to be effective against the target species.
(c) They must have minimal effect on non-target species and the natural environment
(d) Their use must take into account the need to prevent the development of resistance in pests.
3.4.4 OP 4.12 - Involuntary Resettlement
Involuntary resettlement may cause severe long-term hardship, impoverishment, and
environmental damage unless appropriate measures are carefully planned and carried out. For
these reasons, the overall objectives of the World Bank‟s policy on involuntary resettlement are
the following:
Involuntary resettlement should be avoided where feasible, or minimized, exploring all
viable alternative project designs.
Where it is not feasible to avoid resettlement, resettlement activities should be conceived
and executed as sustainable development programs, providing sufficient investment
resources to enable the persons displaced by the proposed project to share in project
benefits.
Displaced persons should be assisted in their efforts to improve their livelihoods and
standards of living or at least to restore them, in real terms, to pre-displacement levels or to
levels prevailing prior to the beginning of project implementation, whichever is higher.
As it was established, the Lagos State Commercial Agriculture Development Projects including
the proposed intervention projects did not trigger involuntary resettlement. The summary of
World Bank safeguard policies triggered by the proposed project activities is shown in Table
3.4.2.1 below.
Table 3.2.4.2: Summary of World Bank Safeguard Policies
Policy Summary of core requirements Triggered
OP 4.01 -
Environmental
Assessment
Screen early for potential impacts and select appropriate
instrument to assess, minimise and mitigate potentially
adverse impacts
Yes
OP 4.04 –
Natural Habitats
Do not finance projects that degrade or convert critical
habitats. Support projects that affect non- critical habitats
Yes
Page 33
33
only if no alternatives are available and if acceptable
mitigation measures are in place
OP 4.09-
Pest Management
Support integrated approaches to pest management.
Identify pesticides that may be financed under the project
and develop appropriate pest management plan to address
risks
Yes
OP 4.12-
Involuntary
Resettlement
Assist displaced persons in their effort to improve or at
least restore their standards of living. Avoid resettlement
where feasible or minimise. Displaced persons should
share in project profits
No
3.5 International Guidelines and Conventions
Nigeria is a signatory to several international conventions and treaties that promote the
maintenance of a viable environment and achieving sustainable development. The Federal
Ministry of Environment is the Focal Point and Designated National Authority for the
implementation of a number of the international conventions. The ones relevant to the project at
hand are:
Kyoto Protocol to the United Nations Convention on Climate Change, 1997
Framework Convention on Climate Change, 1992
Montreal Protocol on substances that Deplete the Ozone Layer 1987 (Ratified 1991).
It worth to know that, Nigeria EIA laws are similar to World Bank safeguard policies,
However, in the event of conflict between the two, World Bank Safeguard Policies shall
supersede. Also, the Federal laws overrule the Lagos state laws in case of discrepancy.
Page 34
34
CHAPTER FOUR
GENERAL METHODOLOGY
4.1 Introduction
This chapter presents a description of the Environmental and Socio-Economic Impact
Assessment (ESIA) process adopted for the Commercial Agricultural Development Projects
(CADPs). The procedure used is represented in the flow chart below. (Figure 4.1)
Figure 4.1: The ESIA Process
Source: Adapted from ESIA Approach and Methodology (TAP, 2012)
Page 35
35
4.2 ESIA Requirements
The integration of environmental and social considerations into the operational stage of
LSCADP is an essential part to understand the environmental and socio-economic impacts of the
interventions and its contribution towards sustainable agricultural development. Environmental
and Social Impact Assessment (ESIA) is internationally accepted as being effective way of
achieving this integration in a method that is efficient and also meets the requirements of
regulators, project financing institutions, civil society and project affected communities, i.e. the
stakeholders.
4.2.1 Screening
Screening is the first step in the ESIA process. It confirms the need (or otherwise) for an ESIA
by appraising the type of project and its associated activities throughout its lifecycle in the
context of its biophysical, socio-economic, policy and regulatory environments. Given the
location, scale and planned activities associated with CADP, it has been concluded that the
project should be subject to an ESIA under the Category “B”, and the ESIA should take account
of applicable national and international legislation, which was addressed in Policy, Regulatory
and Administrative Framework Chapter.
4.2.2 Scoping
Scoping is a high level assessment of anticipated “interactions” between project activities and
environment „receptors‟. Its purpose is to focus the ESIA on key issues and eliminate certain
activities from the full impact assessment process based on their limited potential to result in
discernable impacts. To arrive at a conclusion to “scope out” an activity/event, a mixture of
expert scientific judgement based on prior experience of similar activities and events and, in
some instances, scoping level quantification/numerical analysis (e.g. emission and discharge
inventories and generic modelling) is used.
Based on the findings and results of these reviews, investigations and consultations, the COP
ESIA Team identified:
• Potential project related environmental and socio-economic impacts relationships
between Lagos CADP activities and environment; and
Page 36
36
• where the extent, depth and/or quality of environmental, socio-economic and/or technical
data is insufficient for the ESIA process, thus identifying additional work to complete the
ESIA.
4.3 ESIA Process
Since the assessment was based on proposed projects aiming at boosting the agricultural output,
the study focused on the construction and operational characteristics and the potential impacts on
the environment and socio-economic activities of the affected persons. The key steps taking for
the ESIA include:
Pre-study activities: This stage establishes the environmental, social and cultural
considerations in advance of detailed studies. This study also involves collation of
relevant secondary data for the ESIA.
The ESIA study: This stage concerns with the field survey. It involves site visit to gather
environmental and socio-economic data on project affected communities and their
surroundings. Integral to this study is the development of measures to mitigate and reduce
ion or remove adverse impacts.
The post-study stage: This stage concerns with the preparation of ESIA report. It
involves the analysis, presentation and interpretation of primary and secondary data
acquired, and the production of ESIA report.
4.4 Baseline Study Methodology
For the impact assessment of the CADP, a wide range of methodologies were employed. This
section provides an overview of all methodologies utilised for each of the environmental and
socio-economic impacts assessment as well as providing criteria from which the current quality
and importance of features were evaluated. A good understanding of the baseline is important to
understanding the nature and importance of the project impacts.
4.8 Existing Conditions In order to identify potential impacts, an understanding of the existing conditions was established
regarding the LSCADP and the proposed project activities. This was based on primary data
acquisition by the employed experts and consultants. Base on the empirical study, the projects
Page 37
37
have mainly impacted positively. However, the LSCADP would likely affect the following
receptor groups: Biological/Ecological; and Socio-Economic/Human.
4.5 Mapping of the Project Area
Mapping of the study area and the intervention projects by the LSCADP was implemented using
archival satellite images and in situ GPS data collection. Essentially, data used for capturing
spatial details of the project area were based on location of the project area cum identification of
specific intervention projects. Garmin GPS with high level of accuracy was used to collected in
situ data particularly on projects such as Farm Access Roads, Rural Electrification projects
(including high tension lines, and location of electric transformers), location of automatic battery
cages amongst others.
ArcGIS 10.1 was used as the mapping software as well as for image preparation and processing
for mapping. The images used were extracted from spatially-enabled Google Earth Pro which is
a high spatial resolution image archive. The final maps produced are image maps detailing the
building and environmental details of the project area as well as the captured intervention
projects
4.6 Socio-economic Survey
Both qualitative and quantitative data were collected and analysed in order to understand the
anticipated impacts of the intervention. The qualitative data collection involves the use of Focus
Group Discussion (FGD) and in-depth interview with key informants in the study site. The FGD
was used as a tool to obtain information from people of similar or near similar age group.
A total of 100 questionnaires were administered to capture individual farmer (PAP) perception
on the impacts of the project. This method provides a non-formal method of obtaining
information about events in an area. It was used to elicit opinions about the possible impacts of
the project interventions on the socio-economic and livelihood condition of the affected people.
Quantitative data collection on the other hand entails the use of structured questionnaire to
collect relevant socio-economic data on the baseline characteristics of the environment around
the project site. The questionnaire was structured in such a way that information on awareness of
the LSCADP, ethnic composition, socio-cultural and economic characteristics of the
neighbourhoods was captured. Purposive random sampling approach was used in the
Page 38
38
administration of the questionnaire to the informants. Informal interviews were conducted to
compliment the information obtained from the questionnaire survey and those obtained from
existing records. Such interviews were held with individual trading or living in this area. The
results obtained from the questionnaire administration and analyses are presented inform of
charts and tables.
4.6.1 Impact Significance Assessment
An impact is defined as “Any change to the environment, whether adverse or beneficial, wholly
or partially resulting from an organisation’s environmental aspects (activities, products or
services)” (EMS, ISO14001:2004). Where project activity and environmental receptor
interactions occur, an impact is defined. The ESIA assesses impacts according to their
“significance” determined by considering project activity “event magnitude” and “receptor
sensitivity”. Determining event magnitude requires the identification and quantification (as far as
practical) of the sources of potential environmental and social effects from routine and non-
routine project activities. Determining receptor sensitivity requires an understanding of the
biophysical environment.
4.6.2 Method for Determining Event Magnitude
• Extent / Scale: Events range from those affecting an area of up to 500m from the
source; to those affecting an area greater than 500m and up to 1km from the source;
and to those affecting an area of greater than 1km from the source.
• Frequency: Events range from those occurring once; to those occurring up to 50
times; and to those occurring more than 50 times or continuously.
• Duration: Events range from those occurring for less than 24 hours; to those
occurring for more than 24 hours and up to one week; and to those occurring for
periods longer than one week.
• Intensity: Concentration of an emission or discharge with respect to standards of
acceptability that include applicable legislation and international guidance, its toxicity
or potential for bioaccumulation, and its likely persistence in the environment. This
ranges from a low intensity event, to a moderate intensity event, and to a high
intensity event.
Page 39
39
4.6.3 Method for Determining Receptor Sensitivity
(i) Biological/Ecological Receptors
• Resilience (to the identified stressor): This ranges from species or community unaffected
or marginally affected, to probability of species undergoing moderate but sustainable
change which stabilises under constant presence of impact source, with ecological
functionality maintained; and to probability for substantial loss of ecological functionality
(e.g. loss of species in key groups, substantially lower abundance and diversity).
• Presence: Routine, regular or reliably predictable presence of any species which is, in
reverse order, a unique, threatened or protected species, to regionally rare or largely
confined to CADP area or sensitive to disturbances; and to a species which is none of the
above and is therefore assessed at the community level only.
(ii) Human Receptor
• Presence: This ranges from people being uncommon in the study area of anticipated
impact; to people being present some of the time (e.g. commercial property); to people
being permanently present (e.g. residential property) in the area of anticipated impact.
• Resilience (to the identified stressor): This ranges from people being least vulnerable to
change or disturbance (i.e. ambient conditions (air quality, noise)) are well below
applicable legislation and international guidance); to quite vulnerable to change or
disturbance (i.e. ambient conditions (air quality, noise) are below adopted standards));
and to the most vulnerable groups (i.e. ambient conditions (air quality, noise) are at or
above adopted standards)).
Impact significance, as a function of event magnitude and receptor sensitivity was subsequently
ranked as “Negligible”, “Minor”, “Moderate” or “Major”. Any impact classified as “major” is
considered to be significant and where the impact is negative, requires additional mitigation.
Impacts of negligible, minor or moderate significance are considered as being mitigated as far as
practicable and necessary, and therefore, do not warrants further mitigation.
Page 40
40
4.7 Trans-boundary and Cumulative Impacts
Trans-boundary impacts were impacts that occur outside the jurisdictional borders of a project‟s
host vicinity. Potential trans-boundary impacts considered include:
• Social and economic issues surrounding the sourcing of labour, goods and services;
• GHG emissions to air; and
• Discharges to the marine environment.
Cumulative impacts arise from:
• Interactions between separate project-related residual impacts; and
• Interactions between project-related residual impacts in combination with impacts from
other projects and their associated activities.
For the LSCADP ESIA, potential cumulative impacts were therefore considered to include:
• Physical presence of improper solid waste management;
• Cumulative discharges of waste water, and farm waste including effluent discharge; and
• Cumulative emissions from farm activities
4.8 Mitigation and Monitoring
A wide range of different measures to mitigate impacts have been identified in the ESIA Report.
These have been brought together in an impact summary table. In addition an Environmental and
Social Management Plan (ESMP) for these projects were designed based on each projects. Thus,
specific impact and monitoring approaches were suggested based on the project-specific method.
A cost analysis table was also prepared in order to take up the nature and extent of expenditure
required to mitigate the impacts that are related to each of the projects implemented in the project
area.
Page 41
41
CHAPTER FIVE
ENVIRONMENTAL AND SOCIAL BASELINE CONDITION
This chapter examines a description of the existing environment, including the bio-physical and
socio-economic conditions of the project area.
The description of baseline information relevant to the project covers:
The Project Area;
Land Use Categories;
Land Acquisition and Tenure System;
Socio-Economic;
Cultural Resources;
Health;
Natural Resources;
Wildlife and Biodiversity;
Climate;
Air Quality;
Hydrology of the Area; and
Physical Environment.
5.1 Description of Project Area
The project area is located within Odogunyan, a rural settlement within Ikorodu town of Ikorodu
Local Government Area of Lagos State. It is bounded in the north by Ogun State with access
provided by Sagamu – Ikorodu Expressway. It is bounded in the south by Lagos Lagoon, in the
east and west by Epe and Kosofe Local Government Areas of Lagos State respectively. The
locality map of the project area is pictorially displayed in Figure 5.1.1 below.
Page 42
42
Figure 5.1.1: Ikorodu Fish Farm Estate with specific CADPs i.e. Farm Access Roads and Rural Energy
5.1.1 Physical Environment
5.1.1.1 Climate and meteorology
Climatic elements in terms of changes, fluctuations and variations have considerable influence
on human activities. Also, human activities tend to exert a level of alteration on the micro-
climatic parameters of a particular area. With respect to the project site, climatic parameters must
be considered paramount for any agricultural activities since most of these are rain-dependent
and generally on a small scale. Fish farming relies considerably on existing weather and climate
and other meteorological parameters of the area where such activity is being practised. Thus, this
section will examine the details of essential climatic variable that are central to the proper
functionality of the Ikorodu Fish Farm Estate.
The climate of the project area is identical to the overall climate of Ikorodu municipality. The
study area falls within the semi-hot equatorial zone of the tropical climate area of Nigeria. The
prevailing wind directions are the south and southwest winds and a wind speed of 8–9 knots
Page 43
43
around March, July and August and in October to December The average temperature is 27° C
throughout the year and an average monthly rainfall of about 160 mm. Relative humidity (58%
to 74%) is usually slightly lower in the evenings than in the morning hours and. exhibits an
inverse annual pattern with temperature.
5.1.1.2 Topography
The project area is situated on a sloppy terrain. The altitude of the area ranges between 23 metres
above sea level on the swampy end of the eastern part to 43 meters above sea level proximate to
the Lagos–Sagamu Expressway. Phsiographically and topographically, the area depict a gentle
slope landform along the main Farm Access Road, thereby making travelling along the road a lot
easy when descending and thorny when ascending the slope. However, at the upper extreme a
slightly flat topography is noticed which suggest the possibility of a hilly geomorphic structure
along the roadway.
Based on observation, the land configuration depict a base of medium elevated lateritic rock
observed along the outskirts of Ikorodu towards Epe where mining activities takes place. The
ground slope therefore vary from gentle to somewhat flat and present the possibility of flooding
and likelihood of soil erosion based on the lateritic nature of the soil observed in the area.
5.1.1.3 Geology
Precambrian Basement Complex and the Sedimentary basins with the Basement complex areas
account for approximately 60% and 40% of the entire landmass of Nigeria respectively. Specifically,
the fundamental geologic structure of the project area dates back to pre-Cambrian geologic timescale
and it essentially consist of combination of alluvial deposits of sedimentary deposits resulting from
the nearby streams. There are interlocking and interspersing medium elevation outcrop rocks of
sedimentary origin with observed valleys. The depth to weathered rock varies considerably over the
area but generally ranges between 1 to 10 meters.
5.1.1.4 Soil
The soil in the project area is very deep and moderately well drained. They have grayish-brown,
loamy-sand surface underlain by dark yellowish brown to very pale brown loamy sand subsoils.
Additional edaphic characteristics of the soil based on existing literature also shows that the soil
reaction in the top soil ranges between neutral to slightly alkaline. The exchangeable cations are
moderate for Ca, Mg and Na but low for K. The soil is young, sandy tropical and of low fertility.
Page 44
44
5.1.1.5 Surface and Ground water Hydrology
The project area has no definite rivers or streams but well identified swamps and wetland
particularly along its eastern area. This environmental condition therefore aids the ease of
connecting to the water table after digging for a few meters when compared to an area of higher
elevation and a distance away from water-bearing geographic features. The land configuration of
the project area coupled with the soil typology presents a water flow challenge at the eastern end
of the project area.
Based on examination satellite image of the project area, it shows that the area is situated within
a sub-basin of the Ikosi basin which ends into the Lagos Lagoon through Ikosi Town. However,
the changing ecological structure of the area which manifests in the outgrowth of new
secondary/riparian forest across the swamp zone of the eastern part of the area suggests shallow
water end; thus making the surface water brackish and swampy in appearance. There are traces
of hydrophytes and mangroves which suggest the presence of water or a wet area particularly
towards the eastern end of the project area.
5.1.2 Biological Environment
5.1.2.1 Ecosystem
The Ikorodu municipality is an emerging urbanized ecosystem with a marked aquatic and semi-
aquatic ecosystem. The review of literature and interviews suggest that the initial ecosystem of
the project area is light forest with maze of mangrove swamps across the swampy zone. During
the field survey, it was observed that wildlife and birds could have either migrated or might have
been hunted during traditional hunting in the recent past years. Therefore decimated forest
ecosystems of the project have developed secondary regrowth in some parts while in most parts
the area has been completely deforested.
Thus, the current landscape ecology suggests a new urban/peri-urban ecosystem with buildings
which have altered the initial forest cum wet landscape. The project area is particularly made up
of agricultural landuse with small-scale farmlands, piggery and the fishing farm zone.
5.1.2.2 Land Use Pattern
Land in Ikorodu is used mostly for residential, industrial, commercial and agricultural purposes.
Odogunyan, a traditionally rural community in the local government area hosts the PZ and the Lucky
Fibre factories in one of the largest industrial estates, the fish farm and the Compost project. The
Page 45
45
Odogunyan area is a designated farm settlement with houses for the farmers; vegetable farms and a
piggery among other farming activities.
Since the turn of the century, the area has changed from a traditional rural area to an emerging
urban centre; it hosts the Ikorodu Campus of the Lagos State Polytechnic which is the principal
educational centre in the area. Also, there are series of churches and mosques being used by the
residents and the Lagos-Sagamu Expressway provide great access for mobility in and out of the
area. There are pockets of banks, and other small-scale commercial activities in the area.
5.1.2.3 Vegetation
Most of the project area has been severely deforested owing to expansion of built environment and
farmland areas. However, the existing vegetation around the project area is light tropical forest
identifiable within an area proximate to water body or swamp areas. Plant lives observed in the area
include medium height grasses, shrubs and some bush regrowth. Others such as palms, bamboos,
plantain and bananas are traceable in the wet/swampy parts of the project area.
5.1.2.4 Fauna and wildlife resources
The wildlife of the study area has been severely depleted through a combination of deforestation and
intense hunting. About 17 types of mammals are reportedly present in the area. There was an
abundance of species commonly associated with gardens, farmlands, fallows and secondary growth
while the reptilian fauna is made of tortoises, snakes and lizards. However, there are footprints of
animals such as frogs, toads, crabs, and brackish water catfish amongst others. During the field
survey birds were also observed in the area.
5.1.3 Socio-cultural Environment
5.1.3.1 Population and Administration
Administratively the project area falls within Ikorodu Local Government Area of Lagos State,
southwestern Nigeria. Ikorodu Local Government Area is one of the twenty local government area
recognized by the constitution of the Federal Government Nigeria. The people of Ikorodu migrated
from Ijebu Remo. Odogunyan has a Baale as the head of the community under the prescriptive
authority of the Ayangburen of Ikorodu who is the overall traditional head of the Ikorodu
administrative area.
Page 46
46
According to the 2006 National Population and Housing Census conducted by the National
Population Commission, Ikorodu local Government has a population of 689,045. This value is
projected increase to 795,847 in 2011 and by 2050, it is expected the population of Ikorodu
would have increased to about 1,109,331. Out of this, about 4% of Ikorodu LGA population is
said to be resident in Odogunyan.
5.1.3.2 Socio economic Facilities
Odogunyan town is situated in a growing area when compared to Ikorodu town which is
gradually progressing to an urban centre. The area is predominantly and traditionally agrarian
with spots of small-scale commercial and industrial activities. It main populations are engaged in
urban farming, commerce and civil service. The community has one primary health centre and a
maternity centre. The major environmental problems were flooding and erosion.
5.1.3.3 Industries
The industry sector of the project area to date is still improving albeit there are spots of industrial
investment in the area. These industrial set up include the Patterson Zochonis (PZ) Industries
Limited, Luck Fibre Factories, and the Lagos State Compost Centre for waste to fertilizer
operations. The first two industrial set up are essentially industrial points for the manufacturing
of household products with a high level of local labour usage. The state corporation is basically
one that is involved in waste transformation to essential commodities such as fertilizers which
are useful for agricultural activities proximate to the project area.
5.1.3.4 Ethnic groups
The project area is populated by the people of different ethnic groups although the original
ethnicity group is of the Yoruba race of southwestern Nigeria. Due to urban expansion,
residential and employment purposes, other tribes such as the Hausas/Fulanis, Ibos, Itshekiris,
Ijaw, and others from the country have migrated to the area. In addition, foreign nationals have
also migrated to the area to establish industries.
5.1.3.5 Education
There are few educational facilities, government, religious, and privately owned. Such facilities
include primary and secondary schools, and one tertiary institution – Lagos State polytechnic
Ikorodu Campus.
Page 47
47
5.1.3.5 Transport and Transportation
Mobility in the project area is predominantly land-based. The Lagos–Sagamu Expressway is the
most important link road to the wider world in the project area. It connects to mainland Lagos via
the Ikorodu Road and to Sagamu in Ogun State at the other end of the road. Although the wider
Ikorodu area provides proximity for local waterway travel from one part of Lagos State to
another through the use of jetties, the location of the project area does not permit a direct utility
of this transportation infrastructure. Therefore the unimodal nature of transportation in the area
therefore constraints in transport development
5.2 Environmental Quality Survey
5.2.1 Air Quality and Noise
5.2.1.1 Air Quality of the Study Area
The aim of air quality baseline study is to obtain the spatial coverage of the current atmospheric
pollutants in the study area as may be needed in establishing the potential impact of the project
on the local air quality.
Measurements of the chemical constituents of atmospheric pollutants such as Sulphur (iv) Oxide,
Nitrogen (iv) Oxide, Carbon Monoxide, Hydrogen Sulphide, Volatile Organic Compounds, and
Particulates were carried out at twelve (12) locations; eight (8) within the project site, and four
(4) at buffer/control points within 1km radius of the project site. The geographical coordinates of
the air sampling points are presented in Table 5.1. Air quality measurements were conducted
with the use of digital hand-held monitoring equipment presented in Table 5.2. Ambient noise
levels were measured using an Extech Integrated Sound Level Meter at a height of
approximately 2 m above ground level. The response time was set to slow and read on the „A‟
frequency weighting scale in decibels. The results of the air quality investigations carried out in
and around the project site are provided in Table 5.3.
Page 48
48
Table 5.1: Air quality and noise sampling locations
Sampling Location Geographical Coordinate
Latitude (N) Longitude (E)
A1 06° 39' 18.789" 003° 31' 6.019"
A2 06° 38' 31.925" 003° 31' 49.533"
A3 06° 38' 24.617" 003° 32' 10.437"
A4 06° 38' 21.653" 003° 32' 24.421"
A5 06° 38' 32.378" 003° 32' 18.725"
A6 06° 38' 54.195" 003° 32' 28.315"
A7 06° 39' 3.730" 003° 31' 55.970"
A8 06° 39' 11.435" 003° 31' 34.082"
A9 06° 39' 17.897" 003° 31' 5.962"
A10 06° 39' 29.125" 003° 31' 38.099"
Source: Fieldwork, April, 2013
Table 5.2: List of air quality equipment used on-site for measurement
Parameter Equipment Measuring Range
CO Multi Gas Detector MultiRAE IR, (Model No:
PGM-54): CO Sensor 0-500ppm
CO2 Multi Gas Detector MultiRAE IR, (Model No:
PGM-54): CO2 Sensor 0-20000ppm
O2 Multi Gas Detector MultiRAE IR, (Model No:
PGM-54): O2 Sensor 0-30%
VOC Multi Gas Detector MultiRAE IR, (Model No:
PGM-54): VOC Sensor 0-200ppm
SO2 Multi Gas Detector MultiRAE IR, (Model No:
PGM-54): SO2 Semsor 0-20ppm
NH3 Multi Gas Detector MultiRAE IR, (Model No:
PGM-54): NH3 Sensor 0-50ppm
H2S Multi Gas Detector MultiRAE IR, (Model No:
PGM-54): H2S Sensor 0-20ppm
NO2 Multi Gas Detector MultiRAE IR, (Model No:
PGM-54): H2S Sensor 0-20ppm
TSP Casella Aerosol Monitoring 0µg/m3 to 25mg/m
3
Noise Level Extech Integrated Sound Level. Model No:
407780
0-130dB
Page 49
49
Table 5.3: Concentration of ambient air quality parameters in and around the project site
Sampling
Location
TSP
(mg/m3)
Noise
Level
(dBA)
NO2
(ppm)
SO2
(ppm)
VOC
(ppm)
CO
(ppm)
CO2
(ppm)
A1 0.090 62 0.0 0.0 0.0 1.0 700
A2 0.101 58.3 0.0 0.0 0.2 1.0 290
A3 0.110 65.7 0.0 0.0 0.0 1.0 480
A4 0.157 59.9 0.0 0.0 0.1 2.0 250
A5 0.228 69.3 0.0 0.1 0.1 2.0 740
A6 0.147 70.2 0.0 0.0 0.1 1.0 250
A7 0.132 56.8 0.0 0.0 0.0 0.0 370
A8 0.212 55.5 0.0 0.0 0.1 0.0 250
A9 0.085 54.0 0.0 0.0 0.0 0.0 440
A10 0.116 61.2 0.0 0.0 0.0 1.0 250
Min 0.085 54 - 0.0 0.0 0.0 250
Max 0.228 70.2 - 0.1 0.2 2 740
Mean 0.1378 61.29 - 0.01 0.06 0.9 402
FMEnv
Limits
250 90 0.04-
0.06
0.1 NS 10 NS
ND=Not Detected NS= Not Stated
Carbon Monoxide (CO): The results of air quality measurements conducted in and around the
project site showed that CO concentrations ranged from 0.0ppm to 2.0ppm with a mean value of
0.9ppm. The CO concentrations at all locations were within the FMEnv permissible limit of
10ppm.
Sulphur (IV) Oxide (SO2): As shown in Table 5.2.1.3, the range of ambient air concentrations of
SO2 measured in and around the project site ranged from <0.1ppm to 0.1ppm with a mean value
of 0.01ppm. The SO2 concentrations fall within the FMEnv limit of 0.1ppm.
Nitrogen (IV) Oxide: The concentrations of NO2 measured in the study area were below the
detection limit (<0.1ppm) of the measuring meter.
Volatile Organic Compounds (VOC): The VOC concentrations recorded in the study area ranged
from <0.1ppm to 0.2ppm with a mean value of 0.06ppm.
Carbon (IV) Oxide (CO2): The concentrations of CO2 measured in and around the project site
ranged between 250ppm (0.025%) and 740ppm (0.074%) with a mean value of approximately
402ppm (0.0402%).
Page 50
50
Total Suspended Particulate: Total Suspended Particulate (TSP) had a range of 0.085mg/m3 to
0.228mg/m3 with a mean value of approximately 0.1378mg/m
3 as shown in Table 5.2.1.3. The
measured TSP values in the study area were within the FMEnv permissible limit of 250mg/m3.
Ambient Noise Levels: The ambient noise levels measurement conducted at the study area ranged
from 54.0dBA to 70.2dBA with an average of 61.29dBA. The noise levels obtained fall within
the FMEnv permissible limit of 90 dB (A).
5.2.2 Ground Water Quality
5.2.2.1 Groundwater Sampling
Ground water samples were collected from five (5) existing boreholes in the study area. Table
5.4 shows the coordinates of the ground water sampling points and sampling map respectively.
At each location, water samples were collected into 2-litre polyethylene bottles for general
physico-chemical analysis, while samples for hydrocarbon determination were collected in 1litre
glass bottles and preserved with concentrated sulphuric acid. Samples for heavy metals were
collected separately and fixed with concentrated nitric acid. Similarly, pre-sterilized 50 ml
McCartney bottles were used for samples meant for microbial analysis. In-situ measurements for
parameters like pH, Conductivity, Total Dissolved Solids (TDS), Temperature, and Dissolved
Oxygen (DO) were taken at each location using freshly calibrated water meters: Extech Digital
DO700 meter and Extech Oyster Meter (Model 341350A). All samples collected were well
preserved with ice chest and transported to the laboratory for further analysis.
Table 5.4: Ground water sampling locations
Codes Geographical Coordinates
Latitude (N) Longitude (E)
GW 1 06° 38' 36.318" 003° 32' 6.737"
GW 2 06° 38' 38.883" 003° 32' 15.163"
GW 3 06° 38' 32.827" 003° 32' 2.029"
GW 4 06° 38' 27.347" 003° 32' 14.289"
GW 5 06° 39' 0.999" 003° 32' 8.539"
Source: Fieldwork, April, 2013
Page 51
51
5.2.2.2 Physico-chemical Characteristics of Ground Water Samples
Table 5.5 shows the results of physico-chemical analysis conducted on groundwater samples
collected from the study area. The pH of the water which is a measure of the degree of acidity
and alkalinity, ranged from 6.00 to 6.5 while the in-situ water temperature ranged between
29.80C and 31.0
0C. Electrical conductivity ranged from 315µS/cm to 518µS/cm. The
conductivity values obtained in the ground water samples were within the WHO limit of 1000
µS/cm. Similarly, the TDS values (range= 183ppm to 280ppm) obtained in the water samples
were within the WHO and FMEnv limits of 500ppm for potable water. Both conductivity and
TDS are indicators of how much ions are dissolved in the water samples. The values indicate that
the ground water samples contain fairly dissolved substances which are within the FMEnv and
WHO permissible limits. Salinity of the ground water samples was very low (below 1ppt)
indicating a fresh water environment.
The concentrations of Biological Oxygen Demand (BOD), an indicator of organic pollutant, in
the ground water sample ranged from 1.0mg/l to 2.4mg/l. Heavy metals in the groundwater
samples were either recorded in low concentrations or below the detection limits of Atomic
Absorption Spectrophotometer (AAS) used for analysis. Iron (Fe), Zinc (Pb), Nickel (Ni) and
Vanadium (V) were detected in low concentrations while Chromium (Cr), Lead (Pb), Copper
(Cu), and Mercury (Hg) were below the detection limits of 0.001mg/l. The concentrations of
analysed heavy metals in the ground water with the samples were generally within the FMEnv
and WHO standards. No elevated concentrations of heavy metals were recorded in the samples.
Similarly, the concentrations of Total Hydrocarbon Compounds (THC) and Oil & Grease in the
groundwater samples were below the detection limit of the analytical instrument. This suggests
that the ground water resource is not polluted with hydrocarbon compounds.
Page 52
52
Table 5.5: Physico-chemical characteristics of groundwater samples from the study area
Parameter /
Unit
GW1
GW2
GW3
GW4
GW5
WHO LIMITS FMEn
v
Limits Highest
Desirable
Level
Max.
Permissible
Level
pH 6.5 6.3 6.02 6.04 6.00 7.0-8.5 6.5-9.2 6.5-8.5
Conductivity,
µS/cm
315 408 502 518 353 NS 1000 -
Turbidity (NTU) <1.0 <1.0 <1.0 <1.0 <1.0 NS NS 1.0
Hardness, mg/l 85 115 122 130 100 100 500 200
Alkalinity, mg/l 126 117 85 140 76 NS NS NS
Temperature, 0
C 30.0 29.8 30.5 29.1 31.0 NS NS <40
Total Dissolved
Solids, mg/l
212 220 178 280 183 200 500 500
Salinity, ppt 0.15 0.12 0.36 0.30 0.17 NS NS NS
DO, mg/l 4.60 4.8 4.5 5.0 4.3 NS NS 7.5
COD, mg/l 10.2 8.60 10.50 12.0 11.5 NS NS NS
BOD, mg/l 1.3 1.8 2.4 1.0 2.0 NS NS 0
Chloride, mg/l 7.6 12.9 22.6 15.9 20.7 200 600 250
Nitrate, mg/l 3.56 17.7 14.1 4.00 6.15 NS NS 10.0
Sulphate, mg/l 16.0 15.30 20.18 23.0 19.3 200 400 500
Phosphate, mg/l 2.0 0.04 0.01 1.07 1.00 NS NS 5.0
Sodium, mg/l 33.8 21.95 26.51 40.0 32.0 NS NS 200
Calcium, mg/l 10.0 0.52 0.29 13.0 5.60 75 200 -
Magnesium, mg/l 0.67 0.47 0.51 0.67 0.60 30 75 -
Potassium, mg/l 0.75 1.69 11.93 1.30 0.90 NS NS NS
Oil and Grease,
mg/l
ND ND ND ND ND NS NS 0.05
THC, mg/l ND ND ND ND ND 0.01 0.3
Iron, mg/l <0.001 <0.001 <0.001 <0.001 <0.001 0.1 1.0 1.0
Zinc, mg/l <0.001 <0.001 <0.001 <0.001 <0.001 5.0 15.0 5.0
Lead, mg/l <0.001 <0.001 <0.001 <0.001 <0.001 NS NS 0.05
Mercury, mg/l <0.001 <0.001 <0.001 <0.001 <0.001 NS NS NS
Copper, mg/l <0.001 <0.001 <0.001 <0.001 <0.001 0.05 1.5 1.0
Chromium, mg/l <0.001 <0.001 <0.001 <0.001 <0.001 NS NS 0.05
Cadmium, mg/l <0.001 <0.001 <0.001 <0.001 <0.001 NS NS 0.01
Nickel, mg/l <0.001 <0.001 <0.001 <0.001 <0.001 NS NS 0.05 ND=Not Detected NS= Not Specified
5.2.2.3 Microbial Characteristics of Ground Water Samples
The population of microorganisms recorded in the groundwater samples are provided in Table
5.6. Total Heterotrophic Bacteria (THB) count ranged from 1.0 x 10³cfu/ml to 1.60 x 10
3 cfu/ml
while Total Heterotrophic Fungi population varied between 1.0 x 101
cfu/ml and 4.0 x 101cfu/ml.
The microorganisms in the ground water were probably introduced from the soil of the area since
microorganisms are important components of soil. No coliform bacteria were recorded in the
Page 53
53
groundwater samples, thus suggesting the absence of human faecal contamination. Along with
pathogen, organisms of coliform group like streptococci and clostridium welchii are present in
large numbers in human intestine. Therefore, the presence of coliform group of organisms in
water indicates the probability that it may have been in contact with organism of the enteric
group.
Table 5.6: Microbial characteristics of ground water samples from the study area
Sampling
Code
Total
Heterotrophi
c Bacteria
(cfu/ml)
Total
Heterotrophi
c Fungi
(cfu/ml)
Total
Coliform
(cfu/ml)
Hydrocarb
on Utilizing
Bacteria
(cfu/ml)
Predominant Species
of Microorganism
Isolated
GW1 1.50 x 10³ 1.0 x 10
1 0.0 1.0 x 101 Bacillus spp;
Staphylococcus
aureus;
Mucor spp
GW2 1.0 x 10³ 3.0 x 10
1 0.0 0.0 Bacillus spp;
Lactobacillus spp;
Aspergillus niger
GW3 1.20 x 10³ 4.0 x 10
1 0.0 0.0 Bacillus spp;
Pseudomonas
aeruginosa;
Rhizopus Mucor spp
GW4 1.60 x 10³ 2.0 x 10
1 0.0 0.0 Bacillus spp;
Pseudomonas
aeruginosa;
Rhizopus Mucor spp
GW5 1.30 x 10³ 2.0 x 10
1 0.0 0.0 Bacillus spp;
Lactobacillus spp;
Pseudomonas
aeruginosa;
Rhizopus Mucor spp
5.2.3 Soil Quality
5.2.3.1 Soil Sampling
Soil samples (top and sub) were collected from six (6) different locations within the study area
including buffer points using a stainless steel auger. The composite soil samples collected were
homogenized in plastic bucket lined with aluminum foil sheet, and from the homogenized soil
samples, sub samples were taken for microbial and physico-chemical analysis. Sub samples for
microbial analysis were wrapped up using aluminum foil sheets.
Page 54
54
5.2.3.2 Physico-Chemical Properties of Soil Samples
The laboratory results of soil samples collected from the study area are presented in Tables
5.7and 5.8 for topsoil (0 -15 cm) and subsoil (15 – 30 cm) respectively.
Table 5.7: Physico-chemical properties of top soils from the study area
Sample
Code
pH Moisture
(%) Conducti
vity
(µS/cm)
TOC (%) SO42-
NO3-
PO43-
Cl-
(mg/kg)
S1 7.80 12.80 116.00 0.10 15.30 13.00 0.50 47. 50
S2 7.80 11.40 123.00 0.30 10.20 18.70 0.90 53.10
S3 7.70 16.00 103.50 0.20 23.21 17.50 0.88 51.80
S4 7.60 15.70 114.8 1.10 12.00 7.39 1.00 53.20
S5 7.90 23.00 118.00 1.26 23.40 18.51 1.03 48.98
S6 7.50 18.40 120.00 1.00 15.30 16.5 0.58 42.80
Min 7.50 11.40 103.50 0.10 10.20 7.39 0.50 42.80
Max 7.90 23.00 123.00 1.26 23.40 18.70 1.03 53.20
Mean 7.71 16.46 115.23 0.67 16.62 14.71 0.80 49.41
*Limits 4.8-
9.5
NS NS NS NS 15-20 15-20 NS
NS- Not Specified ND-Not Detected *Source: Ojo-Afere et al., 1990 Fieldwork, April 2013
Table 5.8: Physico-chemical properties of sub soils from the study area
Sample
Code
pH Moisture
(%) Conductiv
ity
(µS/cm)
TOC
(%)
SO42-
NO3-
PO43-
Cl-
(mg/kg)
S1 7.50 11.00 138.00 0.07 23.50 4.00 0.50 50.30
S2 8.60 10.50 55.00 0.20 12.12 3.50 1.90 22.70
S3 7.20 12.00 48.00 0.14 8.00 7.00 0.88 35.00
S4 7.90 11.70 85.00 1.00 6.50 6.40 1.00 34.56
S5 7.70 19.00 95.70 1.00 25.28 14.30 1.63 35.70
S6 7.50 13.80 78.20 1.07 24.80 15.80 0.90 26.60
Min. 7.20 10.50 48.00 0.07 6.50 3.50 0.50 22.70
Max. 8.60 19.00 138.00 1.07 25.28 15.80 1.90 50.30
Mean 7.66 12.64 78.27 0.51 15.24 7.79 1.04 32.51
*Limits 4.8-
9.5
NS NS NS NS 15-20 15-20 NS
Fieldwork, April 2013 NS-Not Specified ND-Not Detected *Source: Ojo-Afere et al., 1990
Soil pH (Reaction)
The pH values recorded for top soil (0-15 cm) collected within and around the study area ranged
from 7.5 to 7.9 with a mean of 7.71 while sub soils within and around the study area recorded
Page 55
55
values ranging from 7.20 to 8.60 with an average of 7.66. The pH values fall within the optimal
limits for plant.
Electrical Conductivity (EC)
The electrical conductivity of soil expresses its total ionic strength (both cations and anions).
Low total ionic strength indicates low dissolved salt content and vice versa. The mean values of
electrical conductivity for the top and sub soils from the study area were 115.23µS/cm and
78.27µS/cm respectively. Electrical conductivity was higher in top soils than sub soils.
Moisture Content
The amount of moisture in soil depends on many factors which include soil type, soil organisms,
soil organic matter, climatic conditions etc. The moisture contents of soil samples in the study
area ranged from 11.4% to 23.0% (mean= 16.46%) in the top soils and from 10.50% to 19.0%
(mean= 12.64%) in the sub soil.
Total Organic Carbon (TOC)
Total Organic Carbon values of the soil samples collected from the study area is low, indicating
low fertility. The mean values for the top soils and sub soils were 0.67% and 0.51% respectively.
When the level of organic carbon is below 2.5%, nutrient elements are usually in the amounts
that cannot support the growth of the primary producers.
Soil Anions
Soil anions include chloride, sulphate, nitrate and phosphate. Among the anions, chloride
recorded the highest concentrations in top and sub soil with a range of 42.80mg/kg to
53.20mg/kg (mean=49.41mg/kg) and 22.70mg/kg and 50.30mg/kg (mean=32.51mg/kg)
respectively. This was followed by sulphate and then nitrate. Phosphate recorded the least
concentrations with mean values of 0.80mg/kg and 1.04mg/kg in the top and sub soil
respectively.
Exchangeable Cations
The exchangeable bases are important nutrient components of soils and its fertility. Calcium ion
had the highest concentration with the mean values of 1064.99mg/kg in top soil and
1104.35mg/kg in sub soil. This was followed by sodium ions with mean values of 182.95mg/kg
and 180.65mg/kg in top (Table 5.9) and sub soils (Table 5.10) respectively. Magnesium ions
Page 56
56
recorded the least concentrations of 47.31mg/kg and 48.61mg/kg in top soils and sub soils
respectively.
Table 5.9: Concentrations of cations in top soils from the study area
Samples Code Na+ Ca
2+ Mg
2+ K
+
mg/kg
S1 213.84 1073.67 48.35 86.90
S2 143.03 1164.31 50.89 51.78
S3 165.49 1006.71 48.34 115.90
S4 203.74 1023.67 42.35 87.70
S5 153,03 1054.01 46.89 67.65
S6 150.40 1026.51 48.30 95.90
Min. 150.40 1006.71 42.35 51.78
Max. 213.84 1164.31 50.89 115.90
Mean 182.95 1064.99 47.31 84.19 Source: Fieldwork, April, 2013
Table 5.10: Concentrations of cations in sub soils from the study area
Samples Code Na+ Ca
2+ Mg
2+ K
+
mg/kg
S1 201.45 1364.96 46.52 77.15
S2 157.53 802.40 47.22 32.77
S3 184.12 1166.37 51.59 142.01
S4 201.45 1364.96 46.52 77.15
S5 157.53 802.40 47.22 32.77
S6 184.12 1166.37 51.59 142.01
Min. 157.53 802.40 46.52 32.77
Max. 201.45 1364.96 51.59 142.01
Mean 180.65 1104.353 48.61 84.83 Source: Fieldwork, April, 2013
The results of heavy metal profile investigated in the soil samples are presented in Tables 5.11 to
5.12. The most prominent metal detected was Fe, with a mean concentration of 1817.38mg/kg
for the top soil and 1857.80mg/kg for the subsoil. Iron is one of the dominant heavy metals in the
earth crust. Cu, Cr, Cd and Ni concentrations were below the detection limit. The mean
concentration of Zn was 2.03mg/kg for the sub soil and 2.42mg/kg for the topsoil. In general, the
concentrations of heavy metals in the soil samples were within the limits for naturally occurring
Page 57
57
heavy metals in soil as stated by Allen et al. (1974) and Alloway (1991). This suggests that the
soil environment of the project site is not polluted.
Table 5.11: Heavy metals concentrations in top soils from the study area
Sampl
e
Codes
Cu Fe Pb Ni Cr Cd Hg Zn
mg/kg
S1 <0.001 2117.9
5
10.29 <0.001 <0.001 <0.001 <0.001 2.10
S2 <0.001 1847.3
4
<0.001 <0.001 <0.001 <0.001 <0.001 1.32
S3 <0.001 1255.9
5
<0.001 <0.001 <0.001 <0.001 <0.001 1.20
S4 <0.001 1732.6
0
<0.001 <0.001 <0.001 <0.001 <0.001 2.01
S5 <0.001 2255.9
5
15.60 <0.001 <0.001 <0.001 <0.001 3.20
S6 <0.001 2546.0
7
<0.001 <0.001 <0.001 <0.001 <0.001 2.08
Min. - 1255.9
5
10.29 - - - - 1.20
Max. - 2255.9
5
15.60 - - - - 3.20
Mean - 1817.3
8
12.95 - - - - 2.03
Limits
*
50-100 NS 2-20 5-500 10-200 0.03-0.3 NS 10-50
*Concentrations of naturally occurring heavy metals in soils (Allen, 1974) NS- Not specified
Table 5.12: Heavy metals concentrations in sub soils from the study area
Sample
Codes
Cu Fe Pb Ni Cr Cd Hg Zn
mg/kg
S1 <0.001 2036.35 <0.001 <0.001 <0.001 <0.001 <0.001 3.00
S2 <0.001 1951.67 <0.001 <0.001 <0.001 <0.001 <0.001 1.56
S3 <0.001 2043.11 <0.001 <0.001 <0.001 <0.001 <0.001 1.82
S4 <0.001 1070.40 <0.001 <0.001 <0.001 <0.001 <0.001 2.20
S5 <0.001 2255.95 12.68 <0.001 <0.001 <0.001 <0.001 3.46
S6 <0.001 2178.58 <0.001 <0.001 <0.001 <0.001 <0.001 2.31
Min. - 1070.40 12.68 - - - - 1.56
Max. - 2255.95 12.68 - - - - 3.46
Mean - 1857.80 12.68 - - - - 2.42
Limits* 50-100 NS 2-20 5-500 10-200 0.03-0.3 NS 10-50
*Concentrations of naturally occurring heavy metals in soils (Allen, 1974) NS- Not specified
Page 58
58
CHAPTER SIX
SOCIO-ECONOMIC ASSESSMENT
6.0 Introduction
Environmental and Social Impact Assessment (ESIA) deals with an assessment plan to evaluate
the effects (positive and negative) of a proposed or existing development on lives of current and
future residents of an area where a particular project is about to take place or already exists. It is
a crucial assessment due to several reasons. Generally, it is used to alert the stakeholders
(community, including residents and local officials), of the impact and magnitude of the
proposed and existing development project on the affected community‟s environmental and
beyond, social and economic wellbeing. The assessment helps avoid creating inequities among
community groups as well as encourage the positive impacts associated with the development
project.
This study provides estimates of expected changes in demographics, housing, public services,
and even the aesthetic quality of the affected people and settlements that will be resulted from
the development. The study similarly gives an opportunity for diverse community values to be
integrated into the decision-making process. Together, the component of this assessment
provides a foundation on how positive impacts of projects‟ interventions of Lagos State
Commercial Agriculture can be enhanced in a sustainable manner. This impact assessment report
has been prepared regarding the all-encompassing impacts of Government project interventions
aiming at enhancing farm out and living standard of Lagos farmers under the stipulated value
chain (Rice production, Poultry and fishery). The study area and geographical scope of the social
baseline covers Ikorodu fish farm estate with a view to assess the impacts of agricultural project
interventions in the areas listed as follows:
Construction and rehabilitation of farm access roads
Rural Power generation through provision of transformers in installation devices
Water Provision inform of water tanks
High quality Fingerlings
Drainage system
Page 59
59
6.1 Methodology
This study was designed to assess from an external and independent point of view, the scale and
range of the social and environmental impacts of the proposed agricultural project interventions
at fish farm estate in Ikorodu Local Government Area (LGA) of Lagos State. In undertaking the
assessment on 6th
and 7th
April 2013 a combination of research methods were used to collect
socio-economic data, including the following:
Review of historical/existing data for population characteristics and hospital records of
the LGA
Reconnaissance survey to identify all stakeholders that are directly or indirectly impacted
In-depth interview with community Commodity Investment Group (CIG) and leaders of
the identified communities (traditional leaders, women leaders, religious leaders and
youth leaders); this provides a vertical in-depth knowledge on the likely socio-economic
impacts of the project
Focus Group Discussion (FGD) with project affected fish farmers (CIGs)
Personal field observation by the field interviewers
Structured questionnaire to collect baseline information and fish farmer‟s perception of
the intervention.
Simple random sampling was used for the administration of the questionnaire and enumeration
of the combination of the basic socio-economic characteristics. Population estimation was based
on the combinations of questionnaire survey and projection from 1991/2006 census figures by
the National Population Commission (NPC). In all, a total number of 100 questionnaires
administered were returned and analysed.
6.1.1 Data Collection Sampling Methodology
Sampling of stakeholders for engagement and data collection was based on the following
criteria:
Adequate representation from the relevant social groups in the study location
Inclusion of groups and individuals with different population characteristics/socio-
economic status
Participation of those with access to relevant information;
Page 60
60
Evidence of different type of livelihood activities; and
Inclusion of males and females where possible
6.2 Description of LGA and Host Community
Ikorodu is a city and Local Government Area in Lagos State, Nigeria. Located along the Lagos
Lagoon, it shares boundary with Ogun State. As of the 2006 Census Ikorodu had an enumerated
population of 535,619. Ikorodu was founded by Yorubas who settled in the area. The name
Ikorodu is a form of Oko Odu, which means "odu (an edible herb) farm". During the 19th
century Ikorodu was an important trading post for the Remo kingdom, it achieved this by being
situated along the trade route between Lagos and Ibadan. The LGA is susceptible to flooding, for
instance, in August 2007, floods killed six people in Ikorodu and forced the evacuation of more.
6.2.1 Traditional Ruler
Since its founding, Ikorodu has been ruled by the Rademo and Lasunwon royal families.
Following is the list of past kings (Obas) of Ikorodu:
Lasunwon
Rademo
Lugbekan (Lasunwon)
Dotelu (Lasunwon)
Kaalu (Lasunwon)
Oguntade I (Rademo)
Petu (Rademo)
Kuyinu (Rademo)
Ireshe (Lasunwon)
Idowu Alagbo (Rademo)
Odesanya (Lasunwon)
Orelaja (Rademo)
Ogunlaru (Lasunwon)
Aina Odubote (Rademo)
Odunjumo Araba (Lasunwon)
Tundie (Lasunwon)
Page 61
61
Ajayi Owujebe (Lasunwon)
Adenaike Alagbe (Lasunwon)
Samuel O. Ladega (Lasunwon)
Salawu Oyefusi, incumbent (Rademo)
The LGA host the following Schools
Government College Ikorodu
Shams-el Deen Grammar School
Ikorodu High School
Government Technical College
Civil Service Model College Igbogbo
United High School and many more.
Private basic and secondary established schools are numerous in Ikorodu and its environs
Lagos State Polytechnic Ikorodu was founded in 1977
Caleb University Imota, Ikorodu (A private own University)
Lagos State University, Ikorodu Study Centre
Winners' Chapel Ikorodu, Faith Avenue, Ikorodu
6.3 Results and Discussions
6.3.1 Demographic Characteristics
The farm estate located in Odogunyan and the settlement must likely to be impacted on by the
activities of the fish farm estate positively and or negatively. The demographic profile of this
settlement was examined in the context of the profile of the Local Government Area (LGA), it
belongs to (Ikorodu LGA). Data used for the profile analysis were therefore drawn from all the
relevant document of the LGA and the feedback forms (questionnaires) as noted at the beginning
of this report.
6.3.2 Population Size
Since the communities of interest does not have a specific population record of its own, because
it constitutes part of the overall population of the LGA in which it is sited, its population size
was estimated using the population of Ikorodu LGA of the state. Figures. 6.3.2.1and 6.3.2.2
show the 1991 and 2006population estimates National Bureau of Statistics (NBS) and Lagos
Page 62
62
State Bureau of Statistics (LSBS) for Lagos State and Ikorodu LGA. With 3.2 % annual growth
rate, as presented in the Figures, the population of the State and the LGA was project for 2015,
expecting to be 23, 305, 971 and 914,882 respectively. The LGA has seriously influenced by
influx of people from Lagos core urban centres due to high rate of urbanization and cost of
living.
0
5,000,000
10,000,000
15,000,000
20,000,000
25,000,000
Male Female Total Male Female Total Male Female Total
1991 2006 2015
3,01
0,60
4
2,71
4,51
2
5,72
5,11
6
4,7
19
,12
5
4,3
94,
480
9,11
3,60
5
12
,07
2,4
93
11,2
33,4
78
23,
305
,97
1
Figure.6.3.2.1: Population Estimation and Projection of Lagos State
Source: NBS and LSBS
Page 63
63
0
200,000
400,000
600,000
800,000
1,000,000
Male Female Total Male Female Total Male Female Total
1991 2006 2015
94
,38
3
90
,29
1 18
4,6
74
26
8,4
68
25
9,4
54
52
7,9
22
46
5,6
75
44
9,2
07
91
4,8
82
Figure. 6.3.2.2 Population Estimation and Projection of Ikorodu LGA
Source: NBS and LSBS
6.3.3 Age Profile
Age distribution of a given locational population concerns with the description of the age
structure of such population. The knowledge of the age structure of a population is vital to the
planning and organization of welfare programmes in the society. The age distribution of
respondents is shown in Figure. 6.3.3.1 below.
Page 64
64
Below 18 yrs, 2
18-45 yrs, 20
46-65 yrs, 45
Above 65 yrs, 32
Figure.6.3.3.1: Age Profile of Respondents
Source: Field Survey, 2013
The age distribution presented above has a lot of implication for planning. There is highest
proportion (45.5%) of the respondents within the age range of 46-65 years and this was followed
by the respondents with age range of 65 year and above. This means that most of in-sampled
individuals fall within the aged population. This may be attributed to the complex procedure and
high cost of land acquisition which make it unattractive to young people. Besides, youth needed
to be enlightened and even be given preferential treatment in this line of development in order to
be actively involved. Also, the proportion of respondents within the range of 18-45 years which
was considered as the active and experience age range records 20.3%.
6.3.4 Sex Profile
The age profile of the population in any area can be defined as the relative proportion of males
and females within it. This can also be referred to as the sex ratio or distribution. The sex
composition of the respondents is presented in Figure. 6.3.4.1
Page 65
65
Female34%
Male66%
Female
Male
Figure.6.3.4.1: Sex Profile of Respondents
Source: Field Survey, 2013
The result presented above shows that there are more males respondents than females. The high
proportion of males may serve as advantage to the farm settlement since men are mostly needed
in farming activities.
6.3.5 Families and Households
There are various categories of families and households identified in the neighbouring
communities. For ease of understanding these categories will be discussed under two sub-
categories, namely; Marital and family type.
6.3.5.1 Marital Status
Marital status of a sample respondent describes the type of relationship that exists between adults
(male and female) within that particular population. It shows the number of individuals of
marriage age that are actually married and those that are not. Figure 6.3.5.1.1 shows the marital
status of respondents.
The chart indicates that the most involved in the sample frame are married. This has inferences
for which there is a potential population increase. This high proportion also determines the
household type, the consumption power and the infrastructure needs of the resident of the area.
Since marriage in a way can describe level of responsibility as well as influence the amount of
Page 66
66
risk an individual can take, it may in some way checkmate issues relating to destructive violence
by youth.
10%
73%
11%
6%
0
10
20
30
40
50
60
70
80
Single Married Divorsed/Separated Widowed
Figure 6.3.5.1.1: Marital Status
Source: Field Survey, 2013
6.3.5.2 Family Types
This has to do with the description of the nature of the family type that exists within the
population. It examines and differentiates the present family types in sample frame. As shown in
Figure 6.3.5.2 below, the families with dependants of 2-4 under 18 years recorded the proportion
among the inhabitants of the farmstead.
Page 67
67
0%
10%
20%
30%
40%
0 Dpt1-2 Dpts
2-4 Dpts4-8 Dpts
Above 8 Dpts
5%
22%
40%
23%
10%
Figure 6.3.5.2: Size of Households
Source: Field Survey, 2013
6.3.6 Residential Status of Respondents
Residential status of the respondents is presented in Table 6.3.6.1 below. As shown in the table,
47% of the total sampled individuals and households reside in the study area permanently. This
is followed by the returnees (Back Home residents) with an estimated value of 35% of the in-
scope individuals and households. A detailed result is presented in the Table 6.3.6.1 below.
Table 6.3.6.1: Residential Status of Respondents
Variables Frequency Percentage
Permanent Resident 35 35%
Back Home Resident
(Returnee) 47 47%
Non Resident, Visiting 18 18%
Total 100 100%
Source: Field Survey, 2013
Page 68
68
6.3.6.1 Duration of Living in the Estate
Taking in to account, the number of years the inhabitants of the Farm Estate has spent in the
area, the highest proportion (65%) of the respondents lives more than four years in the study
areas. This is presented in Table 6.3.6.1.1.
The length of time of residency of respondents has implications for the study. Generally, it
shows the validity of the data collected since the respondents have seen it all having lived in the
area for quite a reasonable number of years.
Table 6.3.6.1.1: Duration of Living in the Estate
Variable Frequency Percentage
0-1 year 23 13%
2-4 years 55 22%
Above 4 years 22 65%
Total 100 100%
Source: Field Survey, 2013
6.3.7 Educational Status of Respondents
Educational status of the respondents was used to measure the literacy level of the sampled
individual and households in the study area. The educational status of the respondents is
presented in Table 6.3.7.1.
The result presented below shows a high proportion of respondents having tertiary qualification.
This translates into a high literacy level of the area. It also points to the possibility of a cordial
relationship among the project affected people and the communities. Another advantage of this is
that it will enhance peaceful and intelligent resolution of conflicts among the people when they
interact. This can translate to supply of high quality manpower that is needed for efficient
functioning of the activities and the productivity of the farmers in the study area.
Page 69
69
Table 6.3.7.1: level of Education of Respondents
Variable Frequency Percentage
None 2 2.0
Primary School 5 5.0
Secondary School 23 23.0
Tertiary (Excluding
University 26 26.0
University Graduate 37 37.0
University Post Graduate 7 7.0
Total 100 100.0
Source: Field Survey, 2013
6.3.8 Employment Status of Respondents
The employment status of a particular population indicates the major source of income for the
household members of that population. It also describes the potential source of labour. It
indicates what the inhabitants do to make ends meet.
The result of analysed data indicates that majority of the respondents are engaged in farming
activities particularly fish farming. The high proportion of respondents engaged in primary
activities says a lot about the economic status of the respondent. It also gives an insight into what
is needed to improve the living standard of the residents of their area. It was also realized that,
very few of the sample individuals constituted by students. A detailed finding is illustrated in
Table 6.3.8.1below.
Page 70
70
Table 6.3.8.1: Main Occupation of Respondents
Variable Frequency Percentage
Agriculture 5 5.0
Livestock 15 15.0
Student 2 2.0
Trading and Shop Keeping 9 9.0
Artisans 7 7.0
Employed (Salary) 21 21.0
Remittances 11 11.0
Aquaculture 30 30.0
Social Support 0 0.0
Total 100 100.0
Source: Field Survey, 2013
6.3.9 Income Level
This refers to the average income a respondent expects to get at the end of the month, either
working personally or for someone else. It shows the economic status of a particular population.
The Table 6.3.9.1 shows the monthly income of the respondents. This result shows that a very
high proportion of respondents belong to the income range of above N100,000 (45.5%). Most of
the respondents within the group are fish farmers but have other means of income aside farming
activities. The focused group discussion carried out explains the reason behind this. The
respondents within the income range of N50,001-N100,000 had an estimated figure of 33.0% of
the total responses. The main monthly income group which falls below N10,000 recorded the
lowest with an estimated figure of 5.0%. A detailed finding is shown in the Table 6.3.9.1below.
Page 71
71
Table 6.3.9.1: Income Status
Variable Frequency Percentage
Below N10,000 5 5.0
N10,001-N30,000 6 6.0
N30,001-N50,000 11 11.0
N50,001-N100,000 33 33.0
Above N100,000 45 45.0
Total 100 100.0
Source: Field Survey, 2013
6.3.10 Housing Characteristics
The housing profile of the sample individuals and households describes the distribution of
different building types present in the fish farm estate and surrounding. It differentiates the
desirable from the non-desirable buildings. It also indicates the economic status of the sample
frame.
As illustrated in Table 6.3.10.1 the most common type of buildings found in the study area is flat
with corrugated roofing and cement block wall. This is particularly found in within the Fish farm
estate. The thatched roofs with plank wall are totally absent in the communities. Virtually all of
residential houses were outstanding. Some respondents identified poor drainage system as a main
threat to their community residential buildings. This assumption probably was based on their
experience within the area.
Table 6.3.10.1: Type of building
Building Parts Value Label Frequency Percentage
Construction
Material (Wall)
Plastered Mud 0 0.0
Mud 0 0.0
Cement Block 100 100.0
Total 100 100.0
Construction Asbestos Slate 32 32.0
Page 72
72
Material
(Roofing)
Corrugated Aluminum zinc sheets 35 35.0
Aluminum 33 33.0
Thatched roof 0 0.0
Total 100 100.0
Construction
Material (Floor)
Earthen 0 0.0
Cement 75 75.0
Tiles 25 25.0
Other 0 0.0
Total 100 100.0
Toilet Facility Pit latrine 0 0.0
Water borne system 100 100.0
Toilet facility outside dwelling 0 0.0
None 0 0.0
Other 0 0.0
Total 100 100.0
Tenure of
Housing
Owned 93 93.0
Rented 7 7.0
Occupied rent free 0 0.0
Other 0 0.0
Total 100 100.0
Source: Field Survey, 2013
6.3.11 Health Records
When asked about their state of health, all respondents indicated that they are healthy (100%),
this is expected. They also listed the health facilities frequently visited for treatment of illnesses
within the area as hospital/clinic (71.0%), chemist (24.0%) and traditional medicine (5.0%). It
can therefore be inferred that the majority of the people in all of the communities visit
confessional hospital. As was stipulated, the major ailments/diseases sparingly occurred among
affected people and communities are malaria and typhoid.
Page 73
73
Figure 6.3.10.1: Health Status of Sampled Individuals and Households
Source: Field Survey, 2013
However, efforts were made to visit nearby general hospital in the LGA in order to acquire the
information on most prominent ailments among the patients. As was reported, the dominant ailments
were: Typhoid fever, Malaria, Pile, Rashes, Ringworm, Rheumatism, Dysentery, Diarrhea, Whooping
Cough, and Eye pains.
6.3.12 Social and Health Infrastructure
This section looks at how the different solid waste generated by residents of the community are
collected or stored and eventually disposed. This determines the vulnerability of the community
to diseases and epidemics. Table 6.3.12.1 shows the refuse collection methods by the farmers
and the residents in the area.
The refuse collection technique used by most residents is the open dustbin method, while the
most prevalent disposal method as shown in the Table 6.3.12.1 is through the waste collector
(PSP). All the identified methods encourage the spread of diseases by vectors. In addition, liquid
waste from fish was channelled into nearby swampy area.
Page 74
74
Table 6.3.12.1: Refuse Disposal
Variable Frequency Percentage
Dumping at backyard 0 0.0
Dumping in Water Body 13 13.0
Community Dedicated Dumpsite 5 5.0
Burning after Gathering 2 2.0
Waster Collector (PSP) 75 75.0
Other 5 5.0
Total 100 100.0
Source: Field Survey, 2012
6.3.13 Sources of Domestic water
The residents of the study area (Fish Farm Estate) and surroundings have two main sources of
water for domestic water supply which include hand-dug well, borehole. The major sources of
domestic and portable water supply to the households (farmers) in the area are presented in Table
6.3.13.1. For domestic water supply, 63.0% of the total sampled households/farmers depend on
borehole for domestic water supply. This is next to hand-dug well with 25.0% of the total
respondents. Other sources such as tap water, rain harvest, surface water etc are not considered
as a major source.
With respect to portable water supply, 45.0% of the respondents depend on pure water while
38.0% depend on borehole water. Also, few of sampled farmers depend on bottled water.
However, income status reflects on source of portable water to households. A detailed analysis is
illustrated in Table 6.3.13.1.
Page 75
75
Table 6.3.13.1: Sources of Domestic Water
Value Label
Domestic Water Supply Portable Water Supply
Frequency Percentage Frequency Percentage
Rain Harvest 0 0.0 0 0.0
Surface Water (Stream, River,
etc.)
0 0.0 0 0.0
Hand-dug well system 25 25.5 0 0.0
Bore hole 63 63.0 38 38.0
Tap water 12 12.0 5 5.0
Pure water 0 0.0 45 45.0
Bottle water 0 0.0 12 12.0
Total Response 100 100.0 100 100.0
Source: Field Survey, 2013
6.3.14 Environmental Issues
All communities all over the world have natural resources which they value and try to protect.
Our community of interest is not different because they placed high premium on the forest and
water resources. Thus, despite their welcoming of project interventions by farmers, some
respondents indicated that they have issues with the implemented projects particularly with road
rehabilitation and construction and drainage systems. Environment issues observed in the Estate
include air pollution, flooding, surface and ground water contamination and so on. Bad road was
the most indicated environmental issue (45%) and this is displayed in Plate 6.3.14.1 below.
Page 76
76
0.0 5.0 10.0 15.0 20.0 25.0 30.0 35.0 40.0 45.0
Bad Road
Poor Drainage System
Surface and Ground Water Pollution
Flooding
Erosion
Environmental Degration
45.0
25.0
12.0
8.0
5.0
5.0
Figure 6.3.14.1: Community Environmental Issues
Also, other issues stated include poor drainage system (25%) and waste management as part of
environmental degradation. These are displayed in Plates 6.3.14.2 and 6.3.14.3 respectively.
6.3.15 Social Impacts
Available data analysis indicates that the expected social impacts of the project implemented are
highly positive. About 81.3% of the respondents noted that the intervention will encourage high
productivity and human capital developments of the people. At the FGDs and in-depth interview,
the concerns of the farmers are bad state of the farm access roads, shallowness of existing
drainage system, shortage power supply, high cost of farm inputs and so on. However, most of
the participants support the fact that, the projects under LSCADP have positive impacts on the
productivity and living standard of the recipients.
Page 78
78
6.3.16 Environmental degradation
The data that emanated from administered questionnaire, focused group discussions and
interviews revealed certain environmental problems that are presently affecting the
community. The problems indicated include flooding, improper waste management resulting
to environmental degradation. About 82% of the respondents agreed that flooding might be
triggered by shallowness of existing drainage system.
6.3.17 Contribution of the CADP to development
The acquired data shows that high proportion of the respondents and farmers agree that the
project implemented by LSCADP was a step in the right direction as this has definitely
enhanced the productivity and living standard of fish farmers. The LSCADP contributions to
the agricultural development can be itemized as follows:
Improved access roads for effective movement of the farm input and output
Provision of fingerling to boost catfish production
Improved power supply for domestic and agricultural usage
Water supply for domestic and agricultural usage (activities of fishery)
Job creation through requirement for extension workers and services, farm input and
output (distribution) etc.
6.4 Conclusion
In summary, the population of farmers in the Ikorodu fish farm estate and its environment is
characterized by:
A high proportion of farmers comprising people aged 50 years above made up fish
farmers
A high proportion of households and individual comprising couples with children (2-
4);
The adult population who are supposed to be the labour force are less 25%
These features are consistent with the profile of aged population, which is not good for
agricultural productivity of the state. In terms of amenities, the people in the community lack
certain basic amenities such as hygienic water supply; good solid and liquid waste disposal
system and public water supply.
Further characteristics suggestive of social disadvantage include:
Page 79
79
Lack of hospital/clinic and health facilities in the estate to take of farmers,
Unavailability of schools within the estate (primary and secondary school for
children)
Lack of credit facilities to effectively boost agricultural output
Lack of processing facilities for harvested fish preservation
Lack of storage facilities for farmers‟ output
Inadequate social amenities development
Waste management plant for recycling of waste water from fish pond
The simple fact that will benefit the fish farmers is the influx of different categories of people
into the study area and surroundings as this will boost the market for farm output. However,
this influx will eventually increase the population of the entire community, which will
subsequently put more pressure on the available social amenities if not improve on. The
population has been experiencing constant growth and change for many years not only as a
result of natural growth but also to the influx of people from Lagos urban centres due to high
cost of living and urbanization in the state. In terms of health impact, many of the residents
deviated from the fact that the LSCADP activities brought about any major negative impact
on their health. Some however intensified that the major concern is an increase price of fish
farming inputs especially feed while the price of farm output (fish) is decreasing. Majority of
the respondents dismissed the possibility of contacting diseases as a result of bad odour since
they are accustomed to leaving in the situation and no major disease outbreak has ever
occurred in the past.
Page 80
80
CHAPTER SEVEN
POTENTIAL ENVIRONMENTAL AND SOCIAL IMPACTS AND
SIGNIFICANCE
7.1 Methodology for Impact Identification
The potential environmental and social impacts likely to arise as a result of the Lagos State
Commercial Agriculture Development Project (LSCADP) were assessed by harmonizing the
project components with the surrounding environmental and social and cultural resources.
This chapter presents observed impacts resulting from the intervention projects. Information
regarding the social, cultural, natural and coastal resources, etc, was sourced from related
literature, visits to the project site and consultation with relevant stakeholders. Stakeholders
were involved in the identification of the potential impacts of the LSCADP.
7.2 LSCADP and Associated Activities
The potential interactions between various intervention project activities and environmental
and social receptors were identified for analysis. At the project phase (operational phase),
these were evaluated against site-specific conditions using information gathered from existing
baseline conditions and site observations. The interactions/project phase activities were
„screened out‟ if the potential for impact did not exist or is negligible.
7.3 Project activities and potential environmental and social impacts
Specifically, under Component 2 of the CAD project, the menu of subprojects will include:
(a) rehabilitation and/or construction of feeder and/or farm access roads, culverts and small
bridges; and (b) rehabilitation and maintenance of rural energy, including provision of
transformers and transmission lines. These sub-projects will have both positive and negative
environmental and social impacts. The following section identifies the potential
environmental and social impacts associated with the interventions as relates to the
agricultural sector, commercial farming, agribusinesses as well as the impacts that might have
resulted from feeder/farm access road operation.
7.3.1 Positive Impacts of the Project on the Agricultural Sector
(a) Direct income increase
Page 81
81
The project has generated direct benefits to commercial farmers who are already participating
in organized supply chains through increased production and farm-gate prices due to quality
improvement. The smallholder and commercial farmers has intensified and increased their
production as well as their return on labour, as a result of improved extension programmes
and improved access to financing for on-farm investments and inputs provided by agro-
businesses. In addition, smallholders and local rural communities in general has benefited
from feeder road rehabilitation and better organizational arrangements within the supply
chains.
(b) Employment and labour productivity
Improvement of agricultural productivity under the value chain has resulted in increased
labour productivity. Diversification of farm production activities has increased labour
demand (i.e. spot labour). It is also expected that the development of marketing services
available to farmers will generate additional employment opportunities in the medium and
long-term. The project has also created new employment in the out grower schemes and in
the trade and agro-processing sector and development of new investment opportunities. The
project has also had a positive impact on employment in the formal sector through job
creation within the supply chain.
(c) Food security and risk reduction
Intensification of commercial agricultural production systems has had a positive impact on food
security. Combined with improved access to markets, has helped commercial farmers to make better
production decisions that has reduced farmers‟ income variability.
(d) Impacts Associated with Rehabilitation of Road
This component of the proposed Project involved upgrading/rehabilitating or widen farm access roads
and adding drainage structures. Though, the existing alignment shall be followed but an improvement
to the vertical and horizontal alignments of isolated sections to enhance the safety of road users
should equally be made. Since the Earthworks will be limited to the shoulders and drainage repairs,
then the potential impacts equally are minimal.
Since the assessment was on operational phase of the intervention, socio-economic benefits
provided by road operation includes all-weather road reliability, reduced transportation costs,
increased access to markets for local produce and products, better access to health care and
Page 82
82
other social services. In the long term, this will have more positive benefits to local economic
development. These positive impacts are already manifesting.
7.3.2 Negative environmental and socio-economic impacts
The nagative impacts of the operational phase of the rehabilitated farm access roads include:
• Manifestation of flooding incidence due to shallowness of drainage system especially
towards the edge of wetland where construction development is currently ongoing
• Incidence of series of pot holes could hinder the vehicular movement
• Flooding is hazard to ecology and communities and act as disease vectors cause by
stagnant water;
• Accumulation of stone aggregate, construction material and shell left over may hinder
vegetation growth and vehicular movement;
• Impacts on air quality arising from increased vehicular traffic flows;
• Loose soils on cleared areas may cause dust particulate.
Fish farming operations have the potential to harm the environment through the use of
chemicals, and due to inappropriate land and water management. Fish farming that uses
fertilizers and other farm chemicals can have significant impacts which need to be addressed
through appropriate mitigation measures.
Specific issues associated with the fish farming include:
(a) Airborne pollution
All processing fish operations that have heating systems or food smoking processes will
produce smoke. All dry processing of fish products will produce pollutants. Though the
impacts are insignificant but require smoke and air filtration to improve the air quality.
(b) Effluents and Waste water treatment
Fish production and management require liquid wastewater treatment to bring the effluent
strength down to national standards before discharge or properly be re-used. The liquid
effluent generated at Ikorodu fish farm was being discharged into already stressed swampy
section in the estate which eventually ended in Lagos Lagoon finally into the atlantic ocean.
Page 83
83
(d) Noise pollution
All processing and services equipment produce various levels of noise and will have to meet
national and World Bank standards to be acceptable. This has insignificant impact on
environment and communities
7.3.7 Impacts Associated with Fish Farming Development and Commercialisation
Investment in commercial fish farming through infrastructural development and farm input
has involved strengthening or extending existing practices, and could give rise to the
following activities:
• land clearing and preparation, perhaps of marginal lands
• introduction of land/ changes to fertilizing the fish pond
• introduction of unfamiliar/exotic fingerlings
• water supply and management systems
7.3.8 Cumulative Impacts of the Project
On a long term scale, the Project has the potential to result in a number of cumulative
impacts, such as:
Groundwater degradation owing to the development and operarion of numerous
boreholes and wells
Waste production due to multiple waste and dumping sites from uncoordinated waste
management.
These can be mitigated through careful design of the project, implementing the required
mitigation measures for different types of investments, and ensuring through monitoring that
activities and their outputs meet permissible limits (e.g. air emissions, chemical use, effluent
treatment) under national law and international best practice.
Some of the major site specific potential environmental issues/impacts and adopted
mitigation measures, which are detailed explained under project mitigation measures and
Environmental and Social Management Plan , arising from an individual agriculture
intervention project activity at this operational phase are listed in the Table 7.4.1.2 below.
Page 84
84
Table 7.4.1: Potential Impact Matrix
Specific CAD Project Positive Impacts Negative Impacts
4. Network of Farm Access Roads
Improvement/Infrastructure
Operation of farm access road
within the settlement;
Operation of lateritic access roads
leading to farm lands;
Operation of light/small-scale
bridges
Improvement of communication;
Connecting rural areas to principal road
networks;
Access to markets, transportation of
goods and service;
Overall positive impact on the economy;
Facilitation of communication between
neighbouring rural settlements;
Accessibility to village forests or other
areas for land development and use;
Improvement of commercial exchanges;
Access to health and education centres;
Exposure to modern farming techniques;
Human capital development;
Employment generation for local
youths.
Destruction of vegetation in and near
roadways;
Deforestation;
Increase in poaching and illegal and excessive
removal of firewood and wood for rural
construction purposes;
Destruction of wildlife habitat;
Impending wildlife movement;
Reduction in biodiversity;
Destruction of local ecological functionalities
and displacement of organisms;
Water pollution and negative effect on
surrounding ecosystem;
Loss of certain aesthetic values (visual impacts)
from destruction of vegetative cover;
Acceleration of soil erosion due to poor
maintenance and drainage of roads;
Likelihood of flooding due to poorly operational
drainages or lack of proper drainages;
Noise and possible accidents during vehicular
movement;
Increased migration from nearby cities;
Social instability;
Spread of communicable/other diseases;
Poor maintenance may lead to waste of financial
capital and human resources;
Encroachment upon land for local customs and
Page 85
85
traditions.
5. Rural Energy
Transformers equipped with
facilities such as up-risers, HT
poles;
Replacement of damaged/faulty
transformers
Development and rehabilitation of
damaged/faulty HT poles;
Maintenance of power supply
infrastructure
Rural electrification projects
Expansion and rehabilitation of
power facilities, etc.
Electricity supply for various uses
Improvement of communication and
information interchange;
Overall positive impact on the economy;
Availability of power for farm and
operations and agricultural operations;
Social and economic benefits;
Reduction in the usage of generators and
burning of fuels to generate power;
Provision of power for lighting;
Power availability for domestic and
personal needs;
Improvement in overall wellbeing;
Development of infrastructural facilities
that require power supply;
Employment of labour;
Improvement and enhancement of
agricultural activities;
Development of rural infrastructure;
Availability of power to aid water
supply provision particularly through
power aided boreholes.
Partial or total destruction of vegetation along the
pole lines;
Destruction of wildlife habitat;
Decline in biodiversity;
Destruction of local ecological functionalities
and displacement of organisms;
Loss of certain aesthetic values (visual impacts)
from destruction of vegetative cover;
Exposure to danger resulting from electrical
faults such as destruction of properties;
Readjustment of social life towards usage of
electronic equipment;
High cost of living for urban dwellers owing to
maintenance of electrical installations;
Lack of constant power supply may lead to loss
of capital invested in agriculture
Exposure of human life to destructive effects of
electrical installation;
Exposure to harmful electrical installation;
Electrical installation that were located in
inaccessible areas do trigger forest fires due to
poor maintenance
Page 86
86
CHAPTER EIGHT
PROJECT IMPACT MITIGATION MEASURES
8.0 Introduction
This chapter describes the various mitigation measures that have been constructed and
integrated into the design or that need to be adopted to minimise the occurrence and/or effects
of the potential impacts. Mitigation measures aims to remedy or compensate for the predicted
adverse impacts of the project (proposed or existing) on site. Sequel to impact evaluation,
mitigation options for this study is developed with the ARRC framework i.e. Avoid–Reduce–
Remedy–Compensate approach which follows the best practices for mitigation procedures.
The necessity of mitigation has been integrated into the study as a critical part of the
methodology. This was stated in the ESIA methodological framework as an element of the
scoping stage.
The approach adopted is centred on consideration of all identified environmental and social
variables that are connected to the agriculture development projects and prepare suitable
mitigation measures. It should be stated that the measures stated in this chapter are based on
the need to streamline the adverse impacts of the agriculture development projects in the
study area as positive impacts require no mitigation. Thus, each of the environmental and
social was scrutinised and respective mitigation measures provide with respect to
fundamental elements of the former and latter. In general, there are two fundamental
intervention projects which were designed for the development of rural infrastructure
particularly for the enhancement of agricultural productivity. These are networks of farm
access roads and rural energy provision. For the study area, these have been provided in
conjunction with others such as provision of seedlings, fingerlings, credit support schemes
and extension services.
Since the commercial agriculture development projects have been developed and are
currently being operated, the stated mitigation measures are therefore developed as project
specific. Each of the project concerned with the IKORODU FISH FARM ESTATE are stated
in the follows.
Page 87
87
8.1 Best Available Control Technology
In order to ensure that the impacts emanating from the CADP intervention projects activities
are mitigated, time-tested standard designs, employing new technology with bias for
environmental safety and economics will be adopted. Regular and consistent maintenance is
also part of this proposal for the best available technology.
The measures that will mitigate the impacts identified with the respective intervention
projects with associated activities are stated in the following sections and subsections.
8.2 Operations and Maintenance of Farm Access Roads
Several activities will characterise the landscape during the operation of this intervention
project. Generally, roads are essential connecting and mobility modes from place to place
which is related to interaction and socioeconomic development. Therefore any issue
connecting the road development tends to cut across several aspect of the environment. Issues
such as air quality and noise, water quality, soil quality, ecology, wild life and forestry,
socioeconomics and health are amongst several other areas that will be impacted during the
operation stage of this intervention project.
8.2.1 Air quality and noise
During operation, noise level from vehicles plying the road might likely increase owing to
movement of vehicles across the road and likely generation of traffic. In addition, vehicular
emissions will definitely impair the quality of air. This is based on the introduction of
gaseous emissions from vehicles plying the road thereby reducing the pristine status of air
and the eventual introduction of a new local scale air quality issues. Health and safety issues
emanating from dusts and other gaseous emissions inhalation by either road users or the
community inhabitants is another instance of air quality issue that is connected to operation
and maintenance of farm access roads in the study areas. Mitigation action to be taken to curb
the impact of air quality and noise will include:
Speed breaks should be introduced at specific junctions to reduce the travel speed of
motorist in order to curb dust and particulate matter.
Trees should be planted with 5 metres distance between road and residential areas in
order to reduce noise.
Road signs indicating the speed limit should be erected at particular sections of the road.
Wetting of the surface land is also encouraged at the construction phase
Page 88
88
Road users should be encouraged to utilise environmentally-safe vehicles via proper
maintenance of vehicles.
8.2.2 Water quality
Small quantities of sediment and dripping oil and grease from the road surface may be
washed out and discharged to nearby surface water bodies as runoff during the rainy season.
Such chemical compounds could also see further down the surface layers to pollute
groundwater. This impact during the rainy season might be relatively small as the rivers will
be flowing at the peak values, however the impact on the long term will be different when
considering the physiographic nature of the study area which is a the depositional stage of
river. Due to the fact the river systems tend to deposit their load interprets that local seepage
and movement of liquid waste might not travel as far as envisaged. Also, effluent generated
from in-washing or mixture of water with chemical lubricants might contain COD and SS
which will impact adversely on the water quality of the area as the effluents will be
discharged into the surrounding wetlands and other connecting waterbodies.
Particular mitigation measures to be taken concerning water quality will include:
Chemical wastes from vehicles should be handled carefully and dumped properly;
Motorists should be educated on the dangers of indiscriminate dumping of chemical
waste close to farmlands or places of farming interests will have adverse impact on
the generality of the project area;
Motorists and road users should use approved mechanic villages for repair of faulty
vehicles and not roadsides.
8.2.3 Ecology and biodiversity
Contamination of surface water and groundwater which will arise from chemical effluents,
solid waste disposal and discarded lubricants or any other solid waste along the roadway
could impair the ecology of the project area. Apart from impairment of water quality and
stimulating water pollution, aquatic ecological lives are not spared of the risk posed by these
chemicals.
Mitigation measures shall include:
Trees should be planted in the open farm access roads (For instance in Odogunyan
Farm Settlement such could be designed in form of boulevard along the farm access
road connecting the administrative block to the residential areas).
Page 89
89
Official waste dump sites should be established and waste management operators
should be contacted on the prompt clearing of waste deposited.
The landscape should be permitted to regrow based on application of some control
mechanism to prevent wildlife intrusion into residential and administrative quarters.
Residents should be advised to use appropriate waste dump sites and to stop
indiscriminate waste dumping.
8.2.4 Wildlife and forestry
Fauna tends to react to changes in surrounding land uses. Macrofauna constituents of an area
are sensitive to noise from vehicles. As such they migrate from their previous habitats to a
new one which provides almost similar environmental condition to their former abode.
Therefore, as trees are being decimated the associated wildlife tends to migrate. Similarly,
microfuna resource could be impaired due to the level of road construction embarked upon.
Mitigation actions on wildlife and forestry will include;
1. Road signs indicating the design speed which should be consistent with
environmental safety should be erected along the farm access road corridor.
2. Proper cleaning and clearing of petroleum products used after repairs of faulty
vehicles along the farm access roads
3. Speed breaks should be introduced at specific point to curb noise related to over
speeding motorists.
4. The community should be engaged on the need to keep to all environmental and
safety regulations.
8.2.5 Socioeconomic and community health
Socioeconomic life of the community is at the centre of any development–oriented project.
The farm access roads have both positive and negative impacts. As it is already stated,
positive impacts require no mitigation, the mitigation provided in this section will involve
such issues that have had adverse effect on the socioeconomic life and community health.
Increased traffic tends to have higher risk to health and safety on the people of the area. There
is also the case of discomforting operational noise to the immediate communities. This
scenario is usually connected to local road users particular pedestrians and cyclists.
Public/environmental nuisance issues associated with dust and exhaust fumes can arise and
may have a significant effect on neighbouring settlements and locations.
Mitigation actions to be taken should take the following;
Page 90
90
Road signs and symbols indicating design speed should be erected along the road
corridor to guide all motorists;
Introduction of speed breakers at specific junctions particularly places that could
developed to accident black spots or places where children do cross the road;
Proper cleaning and clearing of petroleum products;
The community should be engaged on the importance of observing the movement of
vehicles before crossing the road.
8.3 Operations and maintenance of Rural Energy
Apart from the provision of farm access road, the second rural infrastructure intervention project is
the provision of rural energy. This entails the provision of power transmission lines and electrical
transformer to rural areas particularly for the stimulation of commercial agriculture activities. Within
the study area, this has been provided to provide areas without such facilities with electricity to
stimulate increased agricultural production. However, there are probable issues that require mitigation
measures in order to ensure sustainability of the environmental and social component of the project
area. Particularly aspect of the study area that has been impact in different dimension include human
exposure to accidents especially electrocution, human exposure of the electromagnetic effect of
electricity, loss of ecology, in some places farmers have been displaced from their respective farm
plots. It should be noted that specific aspects of the environment and social concerns will be examined
with respect to mitigation.
8.3.1 Socioeconomic and community health
The nature composition of man is sensitive to electrical works irrespective of the scale and
magnitude of such project. It therefore follows that essential steps must be taken to reduce the
adverse impact on the environment. Comprehensive details of the potential impacts and the
associated mitigation measures are stated in Table 8.3.1.1 below.
1. Risk of accidents through electric shocks, electrocution and even death. The
respective mitigation measure will involve the following;
a. PHCN to provide protective shields for electrical installations from causing
danger to residents
b. Proper safety measures must be taken during electrical fittings
c. PHCN officials must use safety gadgets such as safety gloves, safety shoes,
safety belts, non-metallic ladders amongst other health and safety measures.
2. Health risk for the immediate community owing to electromagnetic radiation effect
from high tension lines, transformer, etc.
Page 91
91
a. The community members should be sensitized on the dangers of getting close
to electrical gadgets;
b. Protective fencing/cover should be used to secure transformers in case of
explosion to reduce risk and exposure;
8.3.2 Ecology and biodiversity
Road construction generally impairs the pristine ecology of an area. As regard the study area likely
impacts on the ecology will include the forest fires due to poor or lack of maintenance of facilities,
disturbance to communities due to exposure to electromagnetic radiation from the electrical facilities.
Table 8.3.1.1 enlists the potential impacts as well as mitigation.
Table 8.3.1.1: Mitigation/Best Management practices for rural energy power
Activities Potential impact Mitigation Area/Best management
practices
Operations and
maintenance would
include:
energizing the high
tension line;
maintenance and
site
visits/inspections;
vegetation control
in along electricity
lines;
pole repairs;
foundation repairs;
repair of damaged /
downed wires.
The potential impact
include;
emissions of CO,
NOx, SO2, etc.;
forest fires due to lack
of maintenance of HT
poles and
accumulation of
underlying growth
along the HT lines;
impacts on flora,
wildlife and habitat;
avian collisions and
electrocutions;
disturbances to
communities exposure
to EMR by workers;
loss of crops and farm
land due to forest fire
associated with HT
line;
loss of livestock; and
harm to humans due
to accidents.
implement regular checks and
assessment of electrical installations;
remove invasive plant species,
whenever possible, and cultivate native
plant species within a good distance so
as not to trigger forest fire;
implement an integrated vegetation
management approach (IVM): the
selective removal of tall-growing tree
species and the encouragement of low-
growing grasses and shrubs;
where clearing in shrubs and forested
areas, the ground should be tilled and
seeded with native grass species
immediately after clearing activities
are complete;
plant and manage fire resistant vegetal
species (e.g. hardwoods) within the
area of influence of the HT lines;
mark overhead lines with bird
deflectors/diverters to reduce collision
risk;
communicate with local communities
in advance of activities to inform them
of the duration, type and degree of
disturbances, including contact
information for Stakeholder Liaison
Officer;
provide guideline information on
health and safety of community and the
Page 92
92
farming activities;
delineate areas of potential danger with
signs in local languages to enable
farmers and other community members
to avoid potential accidents;
brief workers on culturally appropriate
interaction behaviours in local
communities; and
compensate farmers for loss of
farmland/crops.
8.4 Operations and maintenance of other intervention projects
As earlier stated, there are two fundamental intervention projects in Lagos State which are
farm access road and rural energy. Meanwhile there are situations in which additional
projects were added in order to support the specific agricultural productivity at the particular
beneficiary CIG. These projects included;
i. Fingerling provision for aquaculture productivity;
ii. Free-flowing drainage;
iii. Supply of water through water tankers;
Each of these projects has impacts which require specific mitigation measures. These
measures will be based on the extent of the usage and the impact on the CIG which such
intervention project(s) have been implemented. These impacts are stated in Table 8.4.1.
Table 8.4.1: Mitigation/Best Management practices for other intervention projects
Activities Potential impact Mitigation Area/Best management
practices
1. Operations and
maintenance of
fingerling provision:
Supply of
fingerlings for
aquaculture;
Maintenance of
fingerling and fish
productivity;
Support-
programmes for
sustaining
fingerling
The potential impact
include;
Generation of effluent
waste from fish
production;
Impact of fish
productivity
Impact of fertilizer
application to fish pond
and fish productivity;
Eutrophication issues
could lead to
uncontrollable plant
Implement regular checks and
assessment of fingerlings status;
Ensure consistent cleaning and
clearing of fish pond surfaces clear of
invasive plant life.
Secchi disc should be used for the
measurement of appropriate fertilizer
quantity to be used as against
likelihood of over-fertilization issues;
Ensure best practices for fertilizer
management with respect to pond
characteristics with respect to
quantity of fish, examination of fish
Page 93
93
production and
fishery
productivity.
incursion into the fish
pond;
Pond over-fertilization
challenges.
production cycle, level of water
quantity, fish behaviour, status/type
of fish pond, the nature of fish being
farmed, ;
Periodic pond fertilization
approaches should be adopted in an
effective manner.
2. Operations and
maintenance of
drainages:
Provision of
concrete drainages;
Provision of
lateritic drains
Flooding leading to
disruption of farming
and other associated
socioeconomic
activities;
Destruction of
properties and likely
deaths;
Erosion of top soil in
areas where lateritic
drainages were
constructed;
Improper construction
issues;
Destruction of roads
and road infrastructure
owing to improper flow
of water.
Review the nature of existing
drainages;
Ensure that drains were cleared
consistently;
Prepare drainage monitoring plan to
assess the functionality and status of
constructed drains;
Allow community participation in
facility provision, construction and
maintenance;
3. Operations and
maintenance of water
supply:
Water supply
through mobile
water tankers
Social and economic
disruptions to existing
community water
management practices;
Conflicting demands
on water supply;
Farming activities
could be disrupted
owing to lack of water;
Human health through
the pollution of water
sources from
aquaculture waste;
Water quality
deterioration resulting
from aquaculture waste
and wastewater.
Avoid conflicting water use through
proper segmentation of water
availability through the use of
dedicated storages for fish farming
purposes;
Develop means of storing rainwater
through proper rainwater harvesting
modes;
Pipe-borne water should be provided
in the long term to all fish farmers;
Release pond wastewater into nearby
wastewater drains with adequate
dilution and dispersal capability
Use shorter retention time in water
ponds – i.e. more frequent exchange
and flushing of pond water;
Keep fish densities at moderate levels
to curb disease risk and need for
antibiotics;
Pump air through the water to speed
up decomposition;
Page 94
94
Dilute pond water prior to release;
Consider using pond bottom sludge
as agricultural fertilizer if properly
decomposed and non-toxic.
Table 8.4.2 Risk Mitigation Measures
Risks Risk Mitigation Measures Risk
Rating
with
Mitigation
To project development
objective
Lack of sustainability of
sub-projects after the
project has closed and/or
the grant is ended, and
lack of maintenance of
infrastructure provided
under the project.
Attention to economic viability of the sub-projects and
maintenance of infrastructure .Creation of innovative
products through linking commercial farms with
financial institutions (i.e. supply chain financing, future
markets, crops as collateral and graduation of the
commercial farmers from the Matching Grant Scheme).
M
Government commitment
to the project falters due
to change in policy and
orientation towards
agriculture
commercialization.
Investment in public information, stakeholders awareness
raising and communication about the approaches and
results of the Project.
M
Counterpart contributions
not paid on time, or are
irregular.
Federal Government and States agreed to counterpart
contributions and this will be closely monitored during
implementation.
H
Collusion and/lack of
transparency and
accountability in the
management of funds at
the beneficiary level.
Random audits ex-post will be conducted by CADA in
addition to the financial statement audit with focus on the
utilization of the matching grant that funds spent on
intended purpose and beneficiaries will receive value for
their money. Details of these are documented in the FPM
under community participation. The TOR for the audit is
included in the PIM.
M
Procurement Risks.
Insufficient
knowledge and experience
with Bank procurement
may cause delays in
project implementation
Random audits ex-post and spot-checks of accounts by
CADAs to confirm grants are used for the intended
purpose. (i) Procurement and implementation training
will be provided to key staff during project
implementation; (ii) experienced Procurement Specialist
will be hired to assist and coordinate the states‟
procurement functions and provide on-the-job training to
the state officials; (iii) intensive supervision of the
agencies‟ staff by the Bank field office Procurement
Specialist.
M
Overall Risk Rating M
Note: Implementation of some of the risk mitigation measures have started particularly on awareness of the
project at the federal and state levels through television, radio and information leaflets, provision of counterpart
funds in the state budgets, and training on procurement.
Page 95
95
CHAPTER NINE
ENVIRONMENTAL AND SOCIAL MANAGEMENT PLAN (ESMP)
9.1 Environmental and Social Management Plan
The chapter examines the possible preventive, remedial or compensatory measures for each
of the adverse impacts evaluated as significant in Chapter Seven. The implementation of the
mitigation measures will be ensured through the Environmental and Social Management Plan
(ESMP), as outlined in this chapter.
The objective of the ESMP (sometimes called the Environmental and Social Action Plan) is
to outline the arrangements relating to:
the identification of environmental and social impacts arising from LSCADP
intervention projects such as road construction, installation of transformers and other
power installation facilities, farm input (fertilizer) etc.
proposed mitigation measures corresponding to each of the impacts identified, and the
implementation of such mitigation measures;
the programme to monitor proposed mitigation measures; and
the budgetary allocations for the implementation
The ESMP is conceived to ensure that the impact mitigation measures proposed in the ESIA
are effectively implemented and that the proposed measures are not just a statement of good
intensions made by LSCADP. This ESMP contains descriptions of the mitigation and
monitoring measures to be adopted by LSCADP, which must be integrated into the CADP‟s
budget and implementation plan. As presented in Tables 9.1.1 to 9.1.3, for Farm Access
Roads, Rural Energy and other CADPs respectively. It shows the specific impact, the
respective mitigation, the monitoring approach and the agency (government/farmers‟) to
supervise the mitigation procedures and actions. For the effective management of these
provisions, cost estimate for apt implementation of these provisions is presented in Table
9.1.4. this shows a consice documentation of all identified mitigation measures and the cost
estimate for each. A sum of three hundred and forty-six thousand dollars (i.e. $346,000) have
been proposed for Ikorodu Fish Farm Estate.
Page 96
96
Table 9.1.1: Environmental and Social Management Plan (ESMP) for Farm Access Roads
S/N Environmental and
social impact
Mitigation measures Monitoring Responsibility
1. The potential air
quality and noise
impact will include:
Increased noise
level due to
vehicular
movement and
dust due to
construction
work
Gaseous
emissions from
vehicles plying
the roads;
Health and
safety issues of
both the
residents and
the road users
due to vehicular
speed and
introduction of
harmful gaseous
Speed breaks should be
introduced at specific
junctions and wetting of
land surface must be
done
Trees should be planted
with 5 metres distance
between road and
residential areas in order
to reduce noise.
Road signs indicating
the speed limit should
be erected at particular
sections of the road;
The use of rickety
vehicle should not be
allowed
Regular check for
adherence to safety
concerns;
Ensure that all
areas have trees
planted along the
road corridors;
Ensure that road
signs are placed
along the road
corridors;
Ensure that speed
limits are strictly
adhere to;
Ensure that
vehicles are in
good condition so
as not to pollute
the environment
when driven along
the roads.
ESMO,
RIO,
Facilitator
Road,
CADA,
CIGs
2. Water quality
impact will include:
Oil and grease
droplets might
pollute surface
and groundwater;
Effluent
generated from
mixture of water
with chemical
lubricants might
contain COD and
SS which will
impact adversely
on the water
quality of the area
Chemical wastes from
vehicles should be
handled carefully and
dumped properly;
Motorists should be
educated on the dangers
of indiscriminate
dumping of chemical
waste close to farmlands;
Motorists and road users
should use approved
mechanic villages for
vehicular repairs.
Ensure that proper
waste management
practices are
adhere to;
Adherence to the
principles of safe
and clean
environment
should be taken
paramount;
Road users should
be made to observe
the mitigation
measures.
ESMO,
RIO,
Facilitator
Road,
CADA,
CIGs
3. Ecology and
biodiversity impact
will include:
Contamination of
Trees should be planted
in the open farm access
roads;
Official waste dump
Regular
environmental
assessment with
interest on the
ESMO,
RIO,
Facilitator
Road,
Page 97
97
surface water and
groundwater from
chemical
effluents;
Poor and untidy
environment;
Risk and
impairment of the
ecosystem.
sites should be
established and waste
management operators
should be contacted on
the prompt clearing of
waste deposited.
The landscape should be
permitted to regrow
based on application of
some control mechanism
to prevent wildlife
intrusion into residential
and administrative
quarters.
Residents should be
advised to use
appropriate waste dump
sites and to stop
indiscriminate waste
dumping.
ecological life
forms;
Consistent checks
on the management
of waste
CADA,
CIGs
4. Wildlife and
forestry impact will
include:
Migration to a
new habitat where
it is possible to
adapt
Loss of original
forest cover
Evolvement of
invasive plant life
Reduction in the
population of
microfauna
Road signs and symbols
indicating design speed
should be erected;
Introduction of speed
breakers;
Proper cleaning and
clearing of petroleum
products;
The community should
be engaged on the need
to keep to all
environmental and safety
regulations.
Consistent checks
on the adherence to
safety regulation;
Regular cleaning
and clearing of the
environment.
ESMO,
RIO,
Facilitator
Road,
CADA,
CIGs
5. Socioeconomic and
community health
impact will include:
Exposure to
danger in form of
road accidents
Adverse
adjustment to
vehicular traffic
and noise
Health
implication to
Road signs and symbols
indicating design speed
should be erected;
Introduction of speed
breakers;
Proper cleaning and
clearing of petroleum
products;
The community should
be engaged on the
importance of the
movement of vehicles
Consistent checks
on the adherence to
safety regulation;
Regular check on
the adherence to
traffic regulations
by road users.
ESMO,
RIO,
Facilitator
Road,
CADA,
CIGs
Page 98
98
children before crossing the road.
Table 9.1.2: Environmental and Social Management Plan (ESMP) for Rural Energy
Environmental
and social impact
Mitigation measures Monitoring Responsibility
The potential
impact include;
emissions of CO,
NOx, SO2, etc.;
forest fires due to
lack of
maintenance of
HT poles and
accumulation of
underlying
growth along the
HT lines;
impacts on flora,
wildlife and
habitat; avian
collisions and
electrocutions;
disturbances to
communities
exposure to EMR
by workers;
loss of crops and
farm land due to
forest fire
associated with
HT line;
loss of livestock;
and
harm to humans
due to accidents.
implement regular
checks and assessment
of electrical
installations;
remove invasive plant
species, whenever
possible, and cultivate
native plant species
within a good distance
so as not to trigger
forest fire;
implement an
integrated vegetation
management approach
(IVM): the selective
removal of tall-
growing tree species
and the encouragement
of low-growing
grasses and shrubs;
plant and manage fire
resistant vegetal
species (e.g.
hardwoods) within the
area of influence of the
HT lines;
mark overhead lines
with bird
deflectors/diverters to
reduce collision risk;
communicate with
local communities in
advance of activities to
inform them of the
duration, type and
degree of disturbances,
including contact
information for
Stakeholder Liaison
Regular check
for waste
Ensure that
proper cleaning
and clearing for
invasive plants
are carried out
Ensure that
IVM are fully
implemented
ensure proper
compliance of
mitigation
action with
respect to
environmental
and social
issues
proper
compensation
in case of
electrocution
and destruction
of properties
check the
environment for
probable
harmful
emissions
ESMO,
RIO,
Facilitator
Road,
CADA,
CIGs
Page 99
99
Officer;
Table 9.1.3: Environmental and Social Management Plan (ESMP) for other intervention projects
S/N Environmental and
Social Impact
Mitigation Measures Monitoring Responsibility
1. The potential impact
include;
Generation of
effluent waste from
fish production;
Impact of fish
productivity
Impact of fertilizer
application to fish
pond and fish
productivity;
Eutrophication
issues could lead to
uncontrollable plant
incursion into the
fish pond;
Pond over-
fertilization
challenges.
Implement regular
checks and
assessment of
fingerlings status;
Ensure consistent
cleaning and clearing
of fish pond surfaces
clear of invasive
plant life.
Secchi disc should be
used for the
measurement of
appropriate fertilizer
quantity to be used as
against likelihood of
over-fertilization
issues;
Ensure best practices
for fertilizer
management with
respect to pond
characteristics with
respect to quantity of
fish, examination of
fish production cycle,
level of water
quantity, fish
behaviour, status/type
of fish pond, the
nature of fish being
farmed, ;
Periodic pond
fertilization
approaches should be
adopted in an
effective manner.
Consistent and
regularity of
fish/fingerlings
status
Check the
environmental
and physical
conditions of
fish ponds;
Fertilization
methods should
be coordinated
in an
environmentally
-friendly
manner;
ESMO,
RIO,
Facilitator
fingerling
provision,
CADA,
CIGs
2. Flooding leading to
disruption of
farming and other
associated
socioeconomic
activities;
Destruction of
properties and likely
deaths;
Erosion of top soil in
areas where lateritic
drainages were
constructed;
Review the nature of
existing drainages;
Ensure that drains
were cleared
consistently;
Ensure that
construction methods
and construction
materials follows the
plan for drainage
erection;
Prepare drainage
monitoring plan to
Check the
environment for
the status of the
drainages;
Ensure that
prepared plan is
strictly adhere
to.
ESMO,
RIO,
Facilitator
Drainage,
CADA,
CIGs
Page 100
100
Improper
construction issues;
Destruction of roads
and road
infrastructure owing
to improper flow of
water.
assess the
functionality and
status of constructed
drains;
Allow community
participation in
facility provision,
construction and
maintenance;
3. Social and economic
disruptions to
existing community
water management
practices;
Conflicting demands
on water supply;
Farming activities
could be disrupted
owing to lack of
water;
Human health
through the pollution
of water sources
from aquaculture
waste;
Water quality
deterioration
resulting from
aquaculture waste
and wastewater.
Avoid conflicting
water use through
proper segmentation
of water availability
through the use of
dedicated storages for
fish farming
purposes;
Develop means of
storing rainwater
through proper
rainwater harvesting
modes;
Pipe-borne water
should be provided in
the long term to all
fish farmers;
Release pond
wastewater into
nearby wastewater
drains with adequate
dilution and dispersal
capability
Use shorter retention
time in water ponds –
i.e. more frequent
exchange and
flushing of pond
water;
Keep fish densities at
moderate levels to
curb disease risk and
need for antibiotics;
Pump air through the
water to speed up
decomposition;
Dilute pond water
prior to release;
Consider using pond
bottom sludge as
agricultural fertilizer
if properly
decomposed and non-
toxic.
Ensure that
water supply
meets the need
of targeted
farmer/CIGs;
Provide support
for rainwater
harvesting
Ensure that
waste
management
techniques are
strictly
maintained and
sustained;
Ensure that
wastewater are
properly let of
using the
environmental-
friendly
approach
ESMO,
RIO,
Facilitator
Water
Provision,
CADA,
CIGs
Page 101
101
Table 9.1.4: Cost Analysis of ESMP Measures
S/N Activities Cost Estimate ($)
1 Capacity building on environmental improvements
including safety standards, assessment procedures
and screening
1000
2 Tree planting, ecological enhancements 1500
3 Best practices capacity building on aquaculture
including waste management procedures and farm
upkeep
1000
4 Coordination of waste management practices and
taking of appropriate steps for waste collection and
disposal
1500
5 Traffic and transportation management with
provision of relevant road infrastructure elements
such as road signs, speed breaks, etc.
2000
6 Quality control/standards 1000
7 Awareness-raising campaigns for farmers, local
communities and other stakeholders on
environmental protection, safety and health
1000
8 Environmental monitoring (internal and external)
with respect to air quality and noise, water quality,
and ecological issues.
2000
9 Institutional support (procedures manuals on
mainstreaming environmental and social aspects into
network of farm access road monitoring from
Ministry of Health, LASEPA, Ministry of
Agriculture & Cooperatives)
2000
TOTAL 13,000
Page 102
102
9.2 Institutional Arrangement for Implementing the ESMP LSCADP retains ultimate responsibility for development and implementation of the ESMPs
for the Commercial Agriculture Development Project in Lagos. LSCADP will assign this
responsibility to its LSCADO Environmental Specialists (Managers), who will report directly
to the General Manager.
9.2.1The World Bank
The World Bank has oversight function. In addition, will be responsible for the final review
and clearance of EMPs and or ESIAs; as well as review and give “no objection” to the
ESIA/EMPs‟ TORs. The responsibility for preparing the TORs for ESIAs/EMPs resides with
the SCADO.
9.2.2 Federal Ministry of Environment, Housing and Urban Development
The role of the FMEH & UD in this project will be that of monitoring. Although the staffing
levels at the EIA division of the FMEH and the Impact Mitigation and Monitoring (IMM)
Branch of the EIA division are sufficient with adequate experience to carry out these roles,
there is a need for further capacity strengthening.
9.2.3 State Commercial Agriculture Development Office
All technical assistance, institutional building, and productive investment sub-projects will be
managed and supervised by the SCADO. The SCADO will be headed by a State Coordinator
who will manage an inter-disciplinary staff that will also include an environmental officer.
The designated environment specialist will be responsible for day to day monitoring and
reporting feedback throughout the life of the project, specifically (i) ensuring that the
subprojects were screened using the environmental and social screening mechanism
contained in this ESMF; (ii) overseeing the implementation of the EMPs/ESIA and RAPs (if
applicable); and (iii) monitoring of environmental issues during operations.
9.2.4 State Environmental Protection Agencies/Authorities (SEPAs).
The SEPAs will perform the following key roles in this project:
• Reviews terms of reference (TOR) for EMPs or ESIAs
• Ensure adherence to EMP/ESIA requirements
• Ensure implementation of EMPs/ESIAs in communities
• Monitor compliance of EMPs for micro-projects
• Enforce state laws.
• Report to the FMEH & UD
Page 103
103
Table 9.1.3 Summary Table of Institutional Framework for Environmental and
Social Management Plan (ESMP)
Institution Tasks/Activities
National Coordinating Desk (NCD) Project Coordination, Implementation and Oversight;
reporting to IDA
State Commercial Agriculture Development
Office
(SCADO)
Preparation of TORs for EMPs/ESIAs; monitoring
activities of EMPs.
Federal Ministry of Environment, Housing and
Urban Development (FMEH & UD) Monitoring State Environment Ministries/Agencies
and
reporting to NCD
State Environment Ministries/Agencies Review, approve and clearance of ESMPs; Monitoring
SCADOs and reporting to FMEH & UD and State
Commercial Agriculture Development Technical
Steering Committee (SCADTSC)
9.3 Implementation Schedule
Detailed ESMPs for the relevant aspects of work will be developed based on the above-
described frameworks starting before further development of project interventions (e.g.
Vegetation Clearing and Biomass Management Plan) and continuing to commissioning of the
rice mills and the specific worker health and safety issues associated with the mills. Also, the
IPMP prepared and disclosed by the project would be implemented in this regard. The
tentative schedule for this development is included in the below Table 9.5.1.
Table 9.5.1: Tentative ESMP Development Schedule
Plan Name Duration
Flora and Fauna Management
Plan
One month before the start of clearing for the plantation
Waste Management Plan One month before the start of clearing for the plantation for
clearing activities
Erosion and Sedimentation
Management Plan
One month before the start of clearing for the plantation
Employment, Training and
Awareness
One month before the start of clearing for the plantation
Water Management Plan Immediately for nursery activities and one month prior to any
well development
Chemical Management Plan Immediately for nursery activities and one month prior to any
well development
Air Quality Management Plan One month before clearing activities
Vegetation Clearing and Biomass One month before clearing activities
Page 104
104
Management Plan
Emergency Response and
Incidence Management
Immediately for nursery activities and one month before clearing
activities
Cultural Heritage Management
Plan
One month before clearing activities
Traffic and Vehicle Management
Plan
One month before clearing activities
Social Investment Plan Within six months of the start of plantation development
Health, Safety, and Security
Management Plan
One month before clearing activities
Community Health and Safety
Plan
One month before the start of clearing activities
Stakeholder engagement Plan On-going updates
Resettlement Action Plan At least three months prior to any resettlement
Conceptual Closure and
Reclamation Plan
Within one year of the start of clearing activities
Page 105
105
CHAPTER TEN
CONCLUSION AND RECOMMENDATIONS
LSCADP will maintain the highest standards in sustainable practices, worker welfare, social
benefit and environmental impact throughout the Project development and operations
interventions. A significant additional benefit of the Project includes its ability to mitigate
Lagos as focus and Nigeria in general.
With its proven track record, the LSCADP management team is well-positioned to develop a
large-scale sustainable agricultural project through appropriate interventions which will result
in significant employment generation and production of a local food staple. The Lagos State
and the Project Area in particular, is an ideal location for the development of the value chain
(Rice, Poultry and Fish Farming) due to soil and climate conditions. Furthermore, there is a
need in the state for income generating activities, social infrastructure, and basic health and
educational services which would receive significant investment from the development and
operation of the Project.
ESIA of CADPs at Odogunyan Farm settlement concerned with the assessment of the
environmental and socio-economic impacts of the World Bank financed proposed projects
activities for the development of Catfish production (aquaculture). The intervention projects
will assist to close the infrastructure gaps and enhance agricultural commercialization. This
component covers two sub-components namely networks of farm access roads and rural
energy. Other aspects of the project include: water support for general agricultural practices;
farm input such fingerlings for aquaculture; and provision of drainage system.
ESMF, PMP and RPF are the existing safeguard instruments that address the triggered
policies of environmental assessment, pest management and involuntary resettlement. ESIA
is identified as all-encompassing EA for any proposed development project. It addressed the
adverse environmental impact of the LSCADP proposed intervention projects with a view to
enhance project benefits and introduce standards of good environmental practice for
agricultural development in the state.
The requirement for an Environmental Assessment is in compliance with the Federal
Republic of Nigeria‟s (FRN) laws and WB policies geared towards achieving sustainable
Page 106
106
development goals through proper and adequate care for the environment, health and social
well-being of her citizens. The project impacts covered small scale and site-specific
infrastructure investment projects associated with category B projects of the World Bank.
This report was prepared in accordance with provision of ESMF, RPF and IPMP. The
relevant WB safeguards policies triggered by the LSCADP intervention projects include:
OP/BP 4.01 - Environmental Assessment, OP/BP 4.04 - Natural Habitats and OP/BP
4.09 – Pest Management. It worth to know that, Nigeria EIA laws are similar to World Bank
safeguard policies, However, in the event of conflict between the two, World Bank Safeguard
Policies shall supersede. Also, the Federal laws overrule the Lagos state laws in case of
discrepancy.
The assessment of biophysical environment of the study area covered general climate and
meteorology, air quality and noise level, topography, regional hydrology, water and soil
quality, geology, ecosystem, vegetation, plant physiognomy, inventory of economic crops,
and fauna and wildlife resources. In this regard, most parameters measured were in
conformity with local and international standards and mitigation measures were provided
where environment will be affected.
The requirement for an Environmental Assessment is in compliance with the Federal
Republic of Nigeria‟s (FRN) laws and policies geared towards achieving sustainable
development goals through proper and adequate care for the environment, health and social
well-being of her citizens. The project impacts covered small scale and site specific
infrastructure investment projects associated with category B projects of the World Bank.
The World Bank is guided by policies/procedures to ensure the safe development of its
funding projects. The relevant WB safeguards policies triggered by the LSCADP intervention
projects include: OP/BP 4.01 - Environmental Assessment, OP/BP 4.04 - Natural
Habitats and OP/BP 4.09 – Pest Management. The World Bank safeguard policies
overrule the Nigeria and the Lagos State policies should there be discrepancy.
Socio-economic Characteristics
The population of fish farmers in the Ikorodu fish farm estate is characterized by: a high
proportion (75%) of farmers aged 50 years and above; a high proportion of households and
individual comprising couples with children (2-4); the adult population who are supposed to
be the labour force are less 20%; and proportion of male to female was 55% to 45%.
Public consultations were held with the local communities and all other interested/affected
parties including the project donors. These consultations identified the key issues and
Page 107
107
concerns of all parties and addressed them with reference to the proposed sub-projects
activities. The consultations included vulnerable groups within the community, specifically
the poorest of the poor, elderly, widows and widowers, and women. Besides, the local
governments and the Commercial Agriculture Development Association (CADA) provided
all relevant materials and information regarding the proposed projects prior to the
consultation.
All identifiable components of the environment and social sphere were considered with
respect to the projects implemented at the Ikorodu Fish Farm Estate in order to streamline the
adverse impacts on the stakeholders. With respect to all the intervention projects, the best
available control technology was stated as the principal mitigation measure while there are
others stated for the specific impact. Proper waste disposal systems, planting of fire-resistant
trees, speed limit indications and speed breaker, controlled chemical application, integrated
vegetation management, engagement of the community on health, safety and environment,
amongst others were stated as mitigation measures.
Page 108
108
REFERENCES
Adamson, P. 2004. “Vitamin and Mineral Deficiency: A Global Progress Report.” The
Micronutrient Initiative and UNICEF.
Adato, M., and R. Meinzen-Dick. 2007. Agricultural Research, Livelihoods, and Poverty.
Studies of Economic and Social Impacts in Six Countries. Baltimore, MD: The Johns
Hopkins University Press for IFPRI (International Food Policy Research Institute).
Adegoke, O.S., 1969. Eocene stratigraphy of southern Nigeria. Bull. Geol. Mem. No 60,
pg.23-48.
Adighije, C., 1981. A gravity interpretation of the Benue trough, Nigeria Tectonophysics,
Vol. 79 pg. 126-136.
Agagu, O.K., 1985. A geological guide to Bituminous sediments in southwestern Nigeria.
Unpublished Report. Department of Geology, University of Ibadan, 24pp.
Akintola J. O. (1986): Rainfall distribution in Nigeria 1892 – 1983. Impact Publishers (Nig.)
Ltd. Ibadan.
Alden, P., Estes, R., Schlitter, D. & McBride, B. (1995). Guide to African Wildlife. Happer
Collins. London
Alpha (2005), Preliminary Impact Assessment for Proposed Alpha Independent ower Project
at Snake Island, Apapa, Prepared by Global Impact Environmental Consulting Ltd.
American Public health Association (1995): Standard methods for the examination of water
and wastewater 19th ed.
Awosika, L. F., and Ibe, A. C., (1994). Geomorphic features of the Gulf of Guinea shelf and
littoral drift dynamics. In Proc. International symposium on the results of the first
IOCEA cruise in the Gulf of Guinea, 17-20 May 1994.
Awosika, L. F., Ibe, A. C. and Ibe, C. E. (1993). Anthropogenic Activities affecting sediment
load balance along the West Africa Coastline. In Coastlines of Western Africa,
Coastlines of the world series. Pub. Americans Society of Civil Engineers N.Y., 1993,
pp 26-35.
Billman, H.G., 1976. Offshore stratigraphy and palaentology of Dahomey Embayment. West
Africa Proceedings, African Micropalaentology iv. Bosser, I. D and Compeau, G. C.,
(1995): Cleanup of petroleum hydrocarbon contamination in soil, pp 77 – 126. In L.
Y. Young and C. E. Cerniglia (ed). Microbial transformation and Degradation of
Toxic organic chemicals. Wiley – Liss, Inc., New York.
Page 109
109
Coode Blizard Limited, Rofe Kennard and Lapworth & Akute Georesources Limited 1997.
Hydrogeological investigation of Lagos state. In final report submitted to the Lagos
state Water corporation: pg. 4.1-5.6
Dessauvagie, T.F.J., 1972. Geological history of the Benue valley and adjacent areas. In:
T.F.J. Dessauvagie and A.J. Whiteman (eds.) African Geology, University of Ibadan
Press, pg. 187-206
Department of Petroleum Resources, DPR (2002): Environmental Guidelines and Standards
for Petroleum Industry in Nigeria. DPR, Lagos
Egborge, A.B.M (1988): Water hyacinth – a biological museum. Proceeding International
Workshop on Water Hyacinth. Oke, S.O., Imevbore A.M.A. and Farri, T.A. (eds.)
Elgood, J. H., Heigham, J. B., Moore, A. M., Nason, A. M., Sharland, R. E. & Skinner, N. J.
(1994). The Birds of Nigeria: An annotated checklist. B.O.U., Tring, Herts. 2nd ed.
FEPA (1991): National Environmental Protection (effluent Limitation) Regulations. Federal
Environmental Protection Agency, Nigeria.
GCAP, 2011, Environmental and Social Management Framework (ESMF)
Gilbert D. A. E . (1969): A map book of West Africa. Macmillan and Co. (Nig.) Ltd.
Hayman, P., Marchant, J. & Prater, T. (1986). Shorebirds: An Identification Guide to Waders
of the World. Helm, London.
IITA (1979): Methods of Soils and Plant Tissue Analysis (International Institute for Tropical
Agriculture (IITA), Ibadan, 1979).
Jefferson, A. T., Leatherwood, S. and Webber, M. A. (1993). Marine Mammals of the World.
FAO Species Identification Guide. FAO Rome.
Jones, H.A. and Hockey, R.D., 1964. The geology of the southwestern Nigeria. Geol. Surv. of
Nig. Bull. No. 31, pg. 101.
Mackworth-Praed, C.W., & Grant, C.H.B. (1970-1973). African Handbook of Bird Series,
Series III. Birds of West Central and Western Africa. 2 Vols. Longman, London.
Nason, A. (1992). Discovering Birds: An introduction to the birds of Nigeria. Pisces,
Newbury.
Nur, M.A., Onuoha, K.M. and Ofoegbu, C.O., 1994. Spectral analysis of aeromagnetic data
over the middle Benue trough, Nigeria. Journal of Mining and Geology vol. 30, No. 2,
pg. 211-217.
Ofoegbu, C.O., 1984. Interpretation of aeromagnetic anomalies over the lower and middle
Benue trough, Nigeria. Journal of Mining and Geology vol. 30 No. 2 pg. 211-217.
Page 110
110
Olaniyan, C. I. O. (1975): An introduction to West Africa Animal Ecology. 2nd ed.
Heinemann Educational Books Ltd. London and Ibadan
Omatsola, M.E. and Adegoke, O.S., 1981. The tectonic evolution of cretaceous stratigraphy
of the Dahomey basin. Journal Min. Geol. Vol. 18 pg. 130-137.
Oyewo, E. O., Ajao, E. A. and Orekoya, T (1982): Seasonal variation in surface temperature
and salinity around Lagos Harbour, Nigeria. NIOMR Tech. Paper No.10: 20pp.
Papadakis, J. (1965): Crop ecologic survey in West Africa (Liberia, Ivory Coast,
Ghana,Togo, Dahomey, Nigeria) Vol. II – Atlas, FAO
Serle, W., Morel, G. J. & Hartwig, W. (1977). A Field Guide to the Birds of West Africa.
Collins, London.
Schneider, W (1990): Field guide to the commercial marine resources of the Gulf of Guinea.
FAO species identification sheets for fishery purposes.
SG Sustainable Oils Cameroon LTD., 2011, Environmental & Social Impact Assessment
Soboyejo, A. B. O. (1975): Extreme winds in West Africa. Journal of the West Africa Science
Association Vol.20 (no1) pp.: 53-74
Thompson, B. W. (1975): Africa; The climatic background – Studies in the development of
African resources. Oxford University Press. Ibadan
United States Department of Agriculture and National Resources Conservation Services
(1998): Keys to Soil Taxonomy. 7th
Edition. United States Government printing
Office, Washington D.C.
Page 111
111
APPENDICES
Appendix A
FOCUS GROUP REPORT ON ENVIRONMENTAL AND SOCIAL IMPACT EVALUATION OF COMMERCIAL AGRICULTURE DEVELOPMENT PROJECTS
Introduction Focus Group Discussion henceforth referred to as FGD was conducted to obtain scientific report of the environmental and social impact of the Commercial Agriculture Development projects at the Ikorodu Fish Farm situated at Odogunyan, Ikorodu, Lagos State. Series of agriculture-support projects have been completed with international intervention from the World Bank to assist the development of commercial agriculture in Lagos State. These include road construction, provision of electricity, drainages, water supply among others. However, the need to examine the status and the environmental cum social impacts of these projects particularly from the perspectives of the beneficiaries becomes inevitable. It is in this line that the FDG on these series of project was conducted on the project area. The FGD was conducted with relevant authorities of the institute particularly top officials and student representatives with a series of well-structure questions that concerns the nature of the fish farming and the impacts of the already provided infrastructures in the agricultural practice. Information from the FGD is used as important input to the preparation of a comprehensive environmental and social impact assessment for the project area. The discussion was designed to gather information from the fish farmers group in regard to the following probable outcomes: 1. To understand the nature of the agriculture land use of the project area. 2. To examine the nature of the available physical and social infrastructure available in the
area. 3. To assess the nature and status of the proposed commercial agriculture development
(CAD) projects in the project area. 4. To understand the sensitivity of the proposed commercial agricultural development
(CAD) to environmental issues. 5. To understand if there are resource management, land conflicts and other resource–
related issues that is connected. 6. To understand if there are social and gender issues tied to the proposed commercial
agriculture development (CAD) projects.
Participant Demographics Five participants took part in the focus group:
Four men All present had their age ranging between 40 – 50 years.
All of the participants have had tertiary education up to the University level.
They are all married and living with respective family members.
All are members of the Fish Farmers Association and fully engaged in fish farming.
There are other socio-economic variables which differentiates the participants of the focus group discussion in terms of other source of income.
Name of Participants
S/N Name Phone No
1 Mr. Segun Lakanu 08166615144
2 Mr. Oladapo Olasunkanmi 08057150381
3 Mr. Peter Okoh 08023849283
4 Mr. Jude 08108521957
Page 112
112
Outcome Analysis Outcome 1: General Assessment The name of the organization is “Ikorodu Fish Farm Estate, Odogunyan, Ikorodu Lagos”. It is an organization under the Lagos State Ministry of Agriculture and Cooperatives with the commissioner as the overall head while the association of the fish farmers is under the leadership of the association chairman. The total population of the fish farmers both individual and corporate organization are about 250 in number. Fish farming is the only occupation. Although there are other farming activities such as crop production, the fish farmers are restricted to their particular activities. Examination and assessment of the existing social and physical infrastructures in the fish farm estate revealed a lot of lacunas. There are no existing primary or secondary school within the estate. Young children will have to travel out of the area and cover few miles before getting a place for proper elementary education. Health facilities are also not available in the estate. Farm machineries are also not provided; the argument on this aspect was based on the nature of the fish farming in the estate which is more of individual and a little of cooperative which require less machineries for operations. Storage facilities are also not available. This scenario often leads to loss particularly during the big harvest and slow market response. Portable water is also another challenge being faced in the estate. However, extension services that entail the training of farmers on the latest techniques of fish farming techniques and farm maintenance are available but laced with challenges. The issues here concerns poor linkage with the fish farmers association in the estate. During the field survey, the office of the extension service officers was noted as the Estate Management Office. The availability of an office to monitor the development of agricultural activities and to train farmers in the area should stimulate productivity, maximize profits and curtain loss but this according to the fish farmers is not the case. There is no instance of any form of training to the fish farmers from the extension officers. Farm access road is available and functioning but fraught with some drawbacks. Issues regarding poor maintenance and management of this infrastructure are a huge challenge currently being faced in the estate. Some of the roads are in deplorable state with series of potholes, poor drainage and some do not have proper drainages. It was also noted that this issue also stimulate the event of flooding during the wet season of the year; thereby making access to the farm a herculean task. Even though there is a case of a drainage constructed at the swampy end of the estate; the drains are poorly constructed and do not convey water with the expected velocity. The level of awareness of the programme of the fish farm estate particularly to the members of the public is high. Customers sometimes have to contact the fish farmers directly to ask for available stock. Credit facility is available and effective; it is based on the 60:40 ratio in which the farmer is expected to provide 40% and the government will support with 60% concerning any agric-related project. Outcome 2: Nature of the proposed Commercial Agriculture Development (CAD) project(s) There are two proposed CAD projects in the estate; Power Intervention Programme and the Farm Access Roads provided with support from the World Bank. On the Power Intervention Programme, about 10 electric poles with 200KVA transformers were provided to support a section of the estate particularly in those places with power issues. These were provided with the purpose of providing energy for lighting for proper farming activities. The Farm Access Road was constructed mainly to provide easy access to the farmlands and for the ease of movement of commodities in and out of the farm. Since, the aim of agriculture is to provide food for the teeming population of any country; the CAD projects are germane to ensure food security and to make life easy for the farmers in the area. In addition, the provision of these CAD project stimulates productivity of the agricultural sector of the economy through the provision of agriculture-support projects such as the Farm Access Roads. This has helped to promote agricultural productivity of the farmers. These proposed CAD projects have really helped for the increase in local production of fish and curtail over-dependence on importation of fishes. If the efforts of the farmers are being complemented with better and more inclusive agricultural policies, it will help to increase food security in the country. Critical areas such as the development of a Fish Processing Centre within the estate should be added to the current effort so that the local demands will be met and even efforts can be geared further towards international trade. Currently, all efforts are still tailored towards improving local production and meeting the local demands.
Page 113
113
Open market drives such as market forces of demand and supply is affecting the level of profitability. Market forces of direct liberal policies is therefore not helping the fish farming business due to high cost of operation and glut of fish in the market is reducing the extent of profit projected for the business. Outcome 3: Environmental issues connected to CAD projects The requirement of fish farming within ambit of catfish production in the estate has little environmental issues attached to it albeit some of the CAD projects have contributed to manifestation of some environmental issues in the estate. Flooding is the most critical environmental issue coupled with slight erosion during the rainy season of the year. Although the provision of drainages that were designed along with the farm access roads were meant to curtail the flooding challenges inherent in the area due to topography and physiography of the area, this is not the case. The main entrance of the estate had only one side of the road drained leaving the other side of the road exposed to flooding and some part of the road being washed away by water action. Also some parts of the drained area were being washed away due to the speed of the water running downslope. Also, some of the farmers who had their structures proximate to the swampy areas are having flooding challenges due to the poorly constructed drainage at the end of the estate. Environmental degradation issues are not directly related to the fish farming unit the other crop production farmers and the piggery unit of the estate with respect to waste management. PSP operators are not operating well-enough in the estate to deal with the issue of proper solid waste management. Effluent waste and wastewater treatment are also some of the issues in the estate. Some of these solid wastes are dump on the road thereby making the area to look dirty and unkempt. There are no issues tied to soil pollution/soil contamination, water pollution and destruction of ecological life. Outcome 4: Resource management, land conflicts and other resource-related issues There are no issues concerning communal clashes with respect to the land. However, there are issues with cattle rearers. Outcome 5: Social Aspects and Gender Issues On the consideration of the ages of those engaged in catfish farming in the Ikorodu Fish Farm Estate, it is a source of activity for provision of retired-support activities for retired civil servants and interested individuals who are able to afford to pay for the portion of land designed for the fishing. Thus, it is a source of employment and a job-support venture. Some of these farmers migrated to the site Odogunyan to practice the fish farming and not a full residence of the area. When the need arises, farmers such as fish harvesters are employed on a part-time basis. There are instances of employment of assistant-farmer to help in the management of the farm. The gender balance is well-maintained in the estate; there is no restriction for female participation. 45% of the farmers are female and 55% male. Thus, men and women have equal and unrestricted access to the proposed CAD projects and no any barrier set against any particular. Outcome 6: Opportunities created since the initiation of the CAD projects There are series of socio-economic merits that have been enjoyed in the farming although some of the initial promises made by the government are not yet fulfilled based on the intensity of the pledges. Fish farming is inherently a business that provides the farmer the modalities for the management of agric-business. Provision of road is the best of all because of the accessibility and ease of movement of agricultural products within and out of the estate. Meanwhile, provision of water to farmers is still a challenge and one that the farmers are expecting the intervention of the government. Outcome 6: Other issues of concern Other critical issues that the government should help involves proper marketing controls and subsidizing the cost of fish feeds and other inputs that are very expensive in the market. A processing centre is also much needed in the estate for the preservation and processing of fishes in terms of huge harvest. The drainages need to be revisited to reduce the challenges of flooding and erosion currently being faced in the estate. Proper waste management techniques are also required to tackle issues of effluent, waste water treatment, and for the PSP operators to be allocated to estate for proper solid waste management as there is none in the estate.
Page 114
114
Appendix B
COMMUNITY/INSTITUTION-BASED QUESTIONNAIRE FOR FOCUS GROUP DISCUSSION (FGD) Environmental and Social Impact Evaluation of Commercial Agriculture Development Project (CADP)
FGD OR KEY INFORMANTS QUESTIONNAIRE – COMMUNITY DIAGNOSTICS
Name of institution/community: ……………………………………………..……………………………. Institution/community identification number: ……………………………………….……………………. LGA/State: ………………………………………………………………………………………………….. Interviewers: ………………………………………………………………………….……………………. Number of participating respondents: ……………………………….….……..………………………… Association/Group: …………………………………………………………………………………………. A. GENERAL ASSESSMENT
1. What is the highest traditional institution in this community? /What is the overall head of this institution referred to? ……………………………………………………………………………………………………………. 2. What is the approximate population of this community/institution? …………………………………………. 3. What is the major occupation/major course of study in this institution? ……………………………………. 4. What are the other occupations? Or associated course of study in the institute? …………………………………………………………………………………………………………………………. 5. Please examine the following physical and social infrastructure in your community/institute, what is the nature of these in your area generally irrespective of the consideration for the CAD projects
Available / Not available (number) Level of functionality
Primary school(s)/High School(s)
Health facilities
Extension services
Supply of farm inputs e.g. chemicals, fertilizers
Provision of farm machines at subsidized rate
Storage facilities
Rural access to road
Provision of water
Public enlightenment about on-going works and farming activities
Credit facility
B. ASSESSMENT OF proposed CAD PROJECT(S) 1. Is there any CAD project(s) in this community/institution? ………………….………………………………. 2. If yes, how many and what are their particular names (a) ……………………………………………………………………………………………………….……. (b) …………………………………………………….……………………………………………..……….. (c) …………………………………………………..…………………………………………………….….. 3. What are the specific goals of this /these projects?
(a) ……………………………………………..……..…………………………………………….………. (b) ………………………………………………..………………………………………..……………….. (c) ………………………………………………………………………………………………………….. 4. How do you think they are linked to the overall agricultural sector of the country? ………………………………………………………………………….………………………………..……...…… ………………………………………………………………………….………………………………...…..……… 5. Are you aware if there is any effort to expand the operations of these project(s) towards international trade? …………………………………………………………………………………………………………………………. 6. Are there any efforts focused on promoting local productive farming for local needs, thus, working to ensure food security? ……………………………………………………………………………………………………………..…………… 7. How do the liberal/open market policies affect the small scale Nigerian farmers (The agri-business owners)? ……………………………………………………………………………………….…………………………………. 8 Do the funded projects impose specific inputs on the farmer, i.e. seeds? ………………………………………………………………………………………………………………………….. 9. Are there any new ideologies and models for farming that have been introduced through this/these project(s)? ………………………………………………………………………………………………………………………….. 10. Are there any efforts to support the preservation of local seeds and biodiversity? ………………………………………………………………………………………………...………………………... 11. What other associated projects/efforts aimed to support the small scale Nigerian farmers?
Page 115
115
…………………………………………………………………………………………………..……………………… 12. Are there any other issue(s) of concerned as regards the CADP in your community/institution? ………………………………………………………………………………………………….………………………. C. ENVIRONMENTAL ISSUES CONNECTED TO CAD PROJECTS How are these environmental issues connected to the proposed CAD projects in your community/institute? Intensity Footprints/level of impact(s)
Air quality deterioration
Flooding
Environmental degradation/ landscape alterations
Soil pollution/soil contamination
Water pollution
Noise/vibration (sonic factors)
Deforestation issues
Destruction of ecological life
D. RESOURCE MANAGEMENT, LAND CONFLICTS & RELATED ISSUES 1. Are there communal clashes with regards to parcels of land committed to CAD projects in your area? If Yes, please state with examples …………………………………………………………………………………. ………………………………………………………………………………………………………………………... 2. Are the resultant cases handled locally through the heads or through the legal agencies? ……………………………………………………………………………………………………………………… 3. What is the nature of the resource conflict? Is it directly or indirectly related to the CAD project? Please explain …………………………………………………………………………………………………………………. 4. What in your own opinion is going to be the likely impact of this development on the CAD project? ………………………………………………………………………………………………………………………… E. SOCIAL ASPECT & GENDER ISSUES 1. What form of employment has the project contributed to the residents/students community/institute? ………………………………………………………………………………………………………………………….. 2. Is there any form of sub-contracting services outsourced to other local farmers from the CAD projects? …………………………………………………………………………………………………………………………. 3. Are women involved in CAD project with respect to agriculture? …………………………………………… 4. If Yes, What percentage? ……………………………………………………………………………………….. 5. Do women have equal access to the CAD projects and associated facilities compared to men? ……….. 6. Are there barriers to women benefitting from the CAD project and how can they overcome it without creating tension within the community? ………………………………………………………………………………………………………………………….. 7. Are there necessary frameworks that will support the involvement of women if the extent of involvement is low? …………………………………………………………………………………………………………………………. 8. Has the CAD project created further opportunities in the following areas? To what extent Number of beneficiaries
Learning agri-business
Higher education
Provision of facilities
Provision water
Provision roads
9. Any other social/economic issues regarding the CAD projects in your community/institution? …………………………………………………………………………………………………………………………..
Page 116
116
Appendix C
QUESTIONNAIRE ON ENVRIONMENTAL AND SOCIAL IMPACT EVALAUTION OF COMMERCIAL AGRICULTURE INTERVENTION PROJECTS
Dear Agricultural Landowner, Thank you for taking the time to complete the following survey! The purpose of this survey is to gain valuable insight from the agricultural communities and agricultural landowners on the Environmental and Social Impacts Evaluation of Commercial Agriculture Intervention Projects, the use of best management practices on the farm and participation in government funded cost share programmes. This is your chance to tell us what you think! If you are not a farmer, or if you do not own land that is farmed, please disregard this survey. NOTE:
Please read each question carefully. Your answers are completely confidential and will be included only in summaries where individual answers cannot be identified. Unless otherwise instructed, please tick appropriate answer category that best describes your opinion. It will take approximately 20 minutes to complete this questionnaire. Settlement/Community/Activity: ……………………………….. L.G.A: …….………………………………………….….. Name of Interviewer: ……..…………….……………………….. Date: ……………..………………………………………. Survey Location: (a) Major Urban (b) Other Urban (c) Rural SECTION A: Household data 1. Gender of Respondent: (a) Male (b) Female 2. Age: (a) Below 18 yrs (b) 18-45 yrs (c) 46-65 yrs (d) Above 66 yrs 3. Marital Status: (a) Single (b) married (d) Divorced/Separated (e) Widowed 4. Residential Status: (a) Permanent Resident (b) Back Home (Returnee) (c) Non Resident, Visiting 5. Ethnic Group: (a) Yoruba (b) Igbo (c) Hausa/Fulani (d) Other, specify …………………………. 6. Religion: (a) Muslim (b) Christian (c) Traditional 7. Education: (a) None (b) Primary School (c) Secondary School (d) Tertiary (Excluding University) (e) University Graduate (f) University Post Graduate 8. Relationship to HH: (a) Self (b) Spouse (c) Child (d) Parent (e) Other, specify…………………. .. 9. Type of HH (a) Normal (b) Woman (c) Child 10. Size of the HH ……………………………
No. of Adults (Above 18) I HH: Men Women
No. of Children (below 18) in HH: Boys Girls
11. Main income source: (a) Agriculture (b) Livestock (c) Daily Labour (d) Trading & Shop Keeping (e) Artisans (f) Employed (salaried) (g) Remittances (h) Fishing (i) Social Support (j) Other 12. How long have you been living in this area? (a) 0-1 yr (b) 2-4 yrs (c) Above 4 yrs 13. If non-resident, please tell me where you come from: ……………………………………………………. (Location/LGA) Education
B1.1 Does anyone in the household
currently attend school (If no, skip to D2)
A Yes b No
B1.2. Where do the children go to school? a Primary
Page 117
117
(Place name) B Junior High
c Senior High/ Tech/ Voc
d Post-Secondary
B1.3. How long does it take to get to
school?
(Note response to each school accessed)
a <5 mins
b 5-15 mins
c 15-30 mins
d 30-60 mins
e 60+ mins
B1.4. What method of transport is used to
get to school?
(Note response to each school accessed)
a Foot
b Bicycle
c Mini bus
d Taxi
e Private Car
f Okada
g Tri-cycle
SECTION B: LAND & AGRCIULTURAL ACTIVITIES B1. General Land Characteristics
Land Available for cropping …………Acres
Acquired Land: Own Land ……… Acres Rented ……………Acres cost ………………
Borrowed for free ……… Acres Shared Cropping …………… Acres, ……………. % Harvest
Garden with Vegetable Yes No
Do you have debt: Yes / No Cost ……………… NGN
B2. Agriculture
B2.1 Do you grow your own food a Yes b No
B2.2 Is anyone in your household engaged in farming
(if no, skip to D3)
a Yes b No
B2.3 If yes, what crops do you cultivate in the
rainy/wet season
a cassava b Plantain
c coconut d Sugarcane
e Rice f Maize/corn
g Yam h Vegetables
If other please specify
i Other
B2.4 If yes, what crops do you cultivate in the dry
season (please circle all that apply)
a cassava b Plantain
c coconut d Sugarcane
e Rice f Maize/corn
g Yam h Vegetables
If other please specify
i Other
B2.5 Is the land cultivated: a Owned by you b Rented
Page 118
118
If other please specify
c Sharecropped d Paid by annual donation
o e Other
What percentage of your crops are a. for subsistence b. for sale
Check section (B2.3)
Check section (B2.4)
B2.10 How much income does your household get
from your crops that you sell
a. in a good month b. in a bad month
Naira
Naira
B3. Plantation / Trees
B3.1 Is anyone in your household engaged in plantations or tree cropping (If no, skip to D4)
1 Yes 2 No
B3.2 If Yes, Please Specify
B3.3 Is the plantation land cultivated a Owned by you b Rented
If other please specify
c Sharecropped d Paid for by an annual donation to the chief
e Other
B3.4 How much income does your household get from the tree crops that you sell
a. in a good season b. in a bad season
Naira Naira
B4. Livestock
B4.1 Does your household own any livestock
a Yes B No
If yes a. How many In the past, year, what percentage of these animals were
b. for your own consumption c. for sale?
(a) Cow
(b) Sheep
(c) Goats
(d) Pigs
(e) Poultry
(f) Other (specify)
Household income from selling meat?
a. in a good month Naira
b. in a bad month Naira
B5. Fish Farming 1. How many members are in the group for fish farming? …………………………………………………………………… 2. How have you select the member? ……...……………………………………………….…………………………………… 3. Did you get training on fish pond construction? (a) Yes (b) No 4. If Yes, for how many days in total? …………………………………………………. days 5. Did you get support/advice/technical guidance during the fish pond construction? (a) Yes (b) No 6. If yes, by who? ……………………………………………………………………………………………………..…………. 7. Which points did you take into account for choosing the site for the construction of the fish pond? (a) …………………………… (b) ……………………………….. (c) ………………………………………….. (d) …………………………… 8. What is the size of your pond? …………………………. m
2
9. Who was involved in the fish pond construction?
Page 119
119
Group members Yes No
Family members Yes No
Daily Labour Yes No
Workers paid by NGO Yes No
Other, specify:
10. How many days did it take to construct the fish pond? ……………………………. 11. Mention four main constraints/problems you faced during the fish pond construction? (a)…………………………………………………………….. (b) …………………………………………………………….. (c) ……………………………………………………………… (d) ………………………………………………………………. 12. Do you have some expenditure during pond construction? (a) Yes (b) No 13. What type of water sources do you have? (a) Spring (b) Rain (c) River (d) Water Catchment Dam (e) Other, specify 14. Who is the owner of the land where the fish pond is placed? (a) Private Owned (b) Family (c) Cooperative society (d) Partnership (e) Public company (f) Government enterprise (g) Public corporation (i) Other, specify 15. What steps did you do to get a fish harvest?
(a) ……………………………………………. (b) ……………………………………………. (c) ……………………………………………. (d) …………………………………………….
16. How do you dispose waste water from fish pond? ……………………… 17. From where did you get the fingerlings? …………….. 18. How many fingerlings did you get? ………………….. 19. Are you feeding the fish? (a) Yes (b) No 20. If yes, what are you giving? (a) Sunflower cake (b) Cotton cake (c) Maize/rice bran (d) Other, specify 21. Fish pond management strategies (feeding) QQ in kg Daily Weekly Monthly
What quantity of manure are you applying?
What quantity of sunflower cake are you applying?
What quantity of cotton cake are you applying?
What quantity of maize/rice bran are you applying?
Other, specify: 1
2
3
4
22. Fish pond management strategies (maintenance) Daily Weekly Monthly
How often do you weed around the fish pond?
How often do you check water level?
How often do you sample the fish for their size?
How often do you check the flow of water?
How often do you check for predators?
How often do you check for leaking of the fish pond?
23. What type of harvest did you do? (a) Partial (b) Total 24. On average, how much did you harvest? ……………………kg/basket/basin 25. Distribution of fish harvested
How did you use the harvest? %
Distributed to members
Page 120
120
Eaten
Sold
Other, specify ……………………..
26. Cash income from sell: ………………………….. NGN 27. Where did you sell the fish?
Yes No
Pond site
In the village
At market place in the village
in town
To businessmen/women
Other, specify
28. Did you process some of the harvest? (a) Yes (b) No 29. If yes, what type of processing did you use? (a) Sun dried (b) Smoked (c) Salted (d) Frozen (e) Other, specify ……………………… 30. Please, give four problems you faced during the management period?
(a) ……………………………………………. (b) ……………………………………………. (c) ……………………………………………. (d) …………………………………………….
SECTION C: HEALTH 1. Is your present state of health affected in any way by the farming activities? (a) Yes (b) No 2. If yes, in what way? (a) Cause skin diseases (b) Cough (c) Catarrh (d) Other , Specify……………………….. 3. How do you manage your health conditions when sick? (a) Attend hospital/clinic (b) Buys drugs from nearby chemist (c) Traditional medicine (d) None 4. If you do attend hospital/clinic, when last did you visit one? (a) last six months (b) last one year (c) last five years (d) more than five years ago (e) Never visited one.
5. Please tick one or more of the under-mentioned ailment/sickness, you suffer from most accordingly? Degree Ailment Always Sparingly Seldom Never Degree Ailment Always Sparingly Seldom Never
Whooping Cough Rheumatism
Tuberculosis Rashes
Asthma Eczema
Dysentery Ringworm
Diarrhoea Eye pains
Cholera Cataract
Pile Glaucoma
Hypertension Typhoid fever
Congestive health
problem Malaria
Pneumonia Sickle cell
anaemia
Sexually
transmitted
diseases
Epilepsy
Page 121
121
6. Do you think your ailment/sickness is directly or indirectly linked to the farm activities? (a) Yes (b) No 7. If yes, how? (a) Contamination of ground water (b) Contamination of surface water (c) Provide breading site for disease vectors (d) Others, specify:…………………………………… SECTION E. STANDARD OF LIVING E1. Assets
E1.1 Do you have any of the following items
Quantity Quantity
a. radio / tape recorder
k. beds
b. television
l. furniture set
c. DVD player
m. fan
d. telephone (land line)
n. computer
e. mobile phone o. generator
f. stove
p. mosquito nets
g. fridge
q. insect screens
h. fishing traps
r. hunting trap
i. fishing nets s. other hunting equipment
j. fishing hooks t. other (specify)
E1.2 What sort of transport does your family own
Quantity Quantity
a. bicycle
f. car
b. motorcycle/okada
g. truck
c. canoe
h. taxi
d. boat i. bus
e. tri-cycle/ keke NAPE j. other (specify)
E1.3 What sort of housing does your household live in?
a. Construction material - Walls
1 Plastered mud d. Number of rooms
1 1-2
2 Cement blocks 2 3-4
9 Other (specify) 9 Other (specify)
b. Construction material - roofing
1 Corrugated roofing e. Other structures on plot
1 Animal Pen
2 Tile 2 Granary
9 Other (specify) 9 Other (specify)
c. Construction material - floor
1 Earthen
2 Cement blocks
9 Other (specify)
E1.4 Toilet Facility 1 Pit latrine
2 Water borne system
3 Toilet facility outside dwelling
4 Pier latrine
5 None
9 Other (specify)
E1.5 Tenure of housing 1 Owned
2 Rented
3 Occupied rent free
9 Other
Tenure of land 1 Owned
Page 122
122
2 Rented
3 Occupied rent free
4 Lease hold
9 Other
E2. Household Services Indicate predominantly source of lighting for the household? (a) PHCN (b)
Generator (c) Lantern
(d) Candle
(e) Palm Oil Lamp
(f) Torchlight Battery
(g) Wood
(h) Kerosene
(i) Gas
Indicate major source of energy for cooking?
(a) Fire Wood (b) Coal (c) Kerosene (d) Eletric (e) Animal dropping (f) Gas (g) Crop Residue/saw dust Others
E3Sources of Water
for drinking for cooking for bathing and washing a. Lagoon
Yes No Yes No Yes No
b. Well
Yes No Yes No Yes No
c. Borehole
Yes No Yes No Yes No
d. Water pump Yes No Yes No Yes No
e. Community tap Yes No Yes No Yes No
f. Piped water outside dwelling Yes No Yes No Yes No
g. River Yes No Yes No Yes No
h. Rain harvesting Yes No Yes No Yes No
i. Water vendor Yes No Yes No Yes No
j. Tanked water Yes No Yes No Yes No
k. Other (specify)
Yes No Yes No Yes No
E4 Remittances E4.1 Does anyone in the family who lives elsewhere send money to you? 1 Yes 2 No
E4.2 If yes, how much (per month) Naira
E5 Other Income E5.1 Do you have other income streams 1 Yes 2 No
E5.2 If yes, please specify?
E5.3 If yes, how much (per month) Naira
E6 Total Income E6.1 What is the total household monthly income (all activities)? Naira
SECTION F: RESOURCES/ CULTURAL PROPERTY 1. Please indicate the environmental problems which your settlement/community experiences and whose cause can be linked to the CAD projects?. (a) Soil infertility (b) Poor drainage system (c) Bad road (d) Low visibility (e) Erosion Problems (f) Flooding (g) environmental degradation (g) Others (specify) ………………………….. 2. Do you think the LSCADP activities affect any valued resource/cultural/archaeological property in your area? (a) Yes (b) No 3. If yes, how? (a) Displacement of such valued cultural properties (b) Desecration of sacred items/locations (c) Possible theft of sacred/archaeological items (d) Others, specify:…………………………… 4. Indicate household refuse disposal for solid waste including farm waste? (Multiple options)
Page 123
123
(a) Depositing refuse at backyard of the house (b) Dumping in water body (c) Dumping in community refuse/garbage pit/dumpsite (d) Burning after gathering together (e) Waste collector (f) Other specify 5. In your opinion, how has the standard of living of your household changed over the previous three years?
a. Same b. Better c. Worse
SECTION F: Impact Evaluation Assessment 1. Please, identify the areas in which CAD Projects have really impacted on you? ……………………………………………………………………………………………………………………….. (e.g. infrastructural development, agricultural productivity, Loan, agricultural input etc) 2. Please identify the projects implemented by CADP in your organization and the environment (Multiple options)? (a) Road Construction (b) Power supply (Electricity) (c) Water tanker (d) Fingerling (e) Drainage system (f) Seedling (g) Other specify 3. How has the project impacted on you?
Positive impact Negative impact
(a)
(b)
(c)
(d)
(e)
(f)
4. Are there any other issue(s) of concerned as regards the CAD projects in your area, please state clearly? ………………………………………………………………………………………………….……………………….
Page 124
124
Appendix D
Nigerian Ambient Air Quality Standards (NAAQS)
Pollutants Time of Average Limits
Particulates Daily average of daily values 1hour 250µg/m3
600 µg/m3
Sulphur oxide (Sulphur dioxide)
Daily average of hourly values 1 hour
0.01ppm 0.1ppm
Non-methane hydrocarbon Daily average of 3- hourly values
160µg/m3
Carbon monoxide Daily average of hourly values 8-hour average
10ppm 20ppm
Nitrogen oxides (Nitrogen dioxide)
Daily average of hourly values (range)
0.04- 0.06ppm
Photochemical Oxidant Hourly values 0.06ppm
Source: Guidelines and Standards for Environmental Pollution Control in Nigeria (FEPA, 1991) Noise Exposure Limits for Nigeria
Duration per Day, Hour Permissible Exposure Limit dB(A)
8 90
6 92
4 95
3 97
2 100
1.5 102
1 105
0.5 110
0.25 115
Source: Guidelines and Standards for Environmental Pollution Noise Level Guidelines
Receptor One Hour LAeq (dBA)
Day time (07:00 -22:00) 22:00 – 07:00
Residential; Institutional; educations 55 45
Industrial; commercial 70 70
Source: World Bank Group 2007: General EHS Guidelines Groundwater Samples
Parameters GW1 GW2 GW3 GW4 GW5 GW6 WHO LIMITS FMEnv Limit
Highest Desirable Level
Max. Permissible Level
pH 7.0-8.5 6.5-9.2 6.5-8.5
Conductivity, µS/cm
NS 1000
-
Temperature, 0C NS NS <40
Turbidity, NTU NS NS 1.0
Total Dissolved Solids, mg/l
200 500
500
Salinity, ppt NS NS
Hardness, mg/l CaCO3
100 500 200
Alkalinity, mg/l NS NS
-
Dissolved Oxygen, mg/l
NS NS
7.5
BOD5, mg/l NS NS 0
COD, mg/l NS NS -
Page 125
125
Parameters GW1 GW2 GW3 GW4 GW5 GW6 WHO LIMITS FMEnv Limit
Highest Desirable Level
Max. Permissible Level
Chloride, mg/l 200 600 250
Nitrate, mg/l - - 10
Sulphate, mg/l 200 400 500
Phosphate, mg/l NS NS 5
Sodium, mg/l NS NS 200
Calcium, mg/I 75 200 -
Magnesium, mg/l
30 75 -
Potassium, mg/l NS NS -
THC, mg/l 0.01 0.3 -
Oil and Grease - - 0.05
Heavy Metals
Iron, mg/l 0.1 1.0 1.0
Zinc, mg/l 5.0 15.0 5.0
Lead, mg/l NS NS 0.05
Mercury, mg/l NS NS 0.01
Copper, mg/l 0.05 1.5 0.05
Chromium, mg/l NS NS 0.01
Cadmium, mg/l NS NS 0.03
Nickel, mg/l NS NS -
Arsenic, mg/l NS NS -