Environmental and taxonomic controls of carbon and oxygenstable isotope composition in Sphagnum across broad climaticand geographic rangesGustaf Granath1, Håkan Rydin1, Jennifer L. Baltzer2, Fia Bengtsson1, Nicholas Boncek3, Luca Bragazza4,5,6,Zhao-Jun Bu7,8, Simon J. M. Caporn9, Ellen Dorrepaal10, Olga Galanina11,39, Mariusz Gałka12, Anna Ganeva13,David P. Gillikin14, Irina Goia15, Nadezhda Goncharova16, Michal Hájek17, Akira Haraguchi18, Lorna I. Harris19,Elyn Humphreys20, Martin Jiroušek17,21, Katarzyna Kajukało12, Edgar Karofeld22, Natalia G. Koronatova23,Natalia P. Kosykh23, Mariusz Lamentowicz12, Elena Lapshina24, Juul Limpens25, Maiju Linkosalmi26, Jin-Ze Ma7,8,Marguerite Mauritz27, Tariq M. Munir28,29, Susan M. Natali30, Rayna Natcheva13, Maria Noskova39,†,Richard J. Payne31,32, Kyle Pilkington3, Sean Robinson33, Bjorn J. M. Robroek34, Line Rochefort35, David Singer36,40,Hans K. Stenøien37, Eeva-Stiina Tuittila38, Kai Vellak22, Anouk Verheyden14, James Michael Waddington41, andSteven K. Rice3
1Department Ecology and Genetics, Uppsala University, Norbyvägen 18D, Uppsala, Sweden2Biology Department, Wilfrid Laurier University, 75 University Ave. W., Waterloo, ON N2L 3C5, Canada3Department of Biological Sciences, Union College, Schenectady, NY, USA4Department of Life Science and Biotechnologies, University of Ferrara, Corso Ercole I d’Este 32,44121 Ferrara, Italy5Swiss Federal Institute for Forest, Snow and Landscape Research, WSL Site Lausanne, Station 2,1015 Lausanne, Switzerland6Ecole Polytechnique Fédérale de Lausanne EPFL, School of Architecture, Civil and Environmental Engineering ENAC,Laboratory of ecological systems ECOS, Station 2, 1015 Lausanne, Switzerland7Institute for Peat and Mire Research, Northeast Normal University, State Environmental Protection Key Laboratory ofWetland Ecology and Vegetation Restoration, 5268 Renmin St., Changchun 130024, China8Jilin Provincial Key Laboratory for Wetland Ecological Processes and Environmental Change in the Changbai Mountains,5268 Renmin St., Changchun 130024, China9School of Science and the Environment, Division of Biology and Conservation Ecology,Manchester Metropolitan University, Manchester, M1 5GD, UK10Climate Impacts Research Centre, Dept. of Ecology and Environmental Science, Umeå University, 98107 Abisko, Sweden11Institute of Earth Sciences, St. Petersburg State University, Universitetskaya nab., 7–9, Russia, 199034,St. Petersburg, Russia12Laboratory of Wetland Ecology and Monitoring & Department of Biogeography and Paleoecology, Adam MickiewiczUniversity in Poznan, Bogumiła Krygowskiego 10, 61-680 Poznan, Polen13Institute of Biodiversity and Ecosystem Research, Bulgarian Academy of Sciences, 2 Yurii Gagarin Str.,1113 Sofia, Bulgaria14Department of Geology, Union College, Schenectady, NY, USA15Babes-Bolyai University, Faculty of Biology and Geology, Department of Taxonomy and Ecology, 42 Republicii Street,400015, Cluj Napoca, Romania16Institute of Biology of Komi Scientific Centre of the Ural Branch of the Russian Academy of Science, Syktyvkar, Russia17Department of Botany and Zoology, Faculty of Science, Masaryk University, Kotlarska 2, 61137, Brno, Czech Republic18Department of Biology, The University of Kitakyushu, Kitakyushu 8080135, Japan19Department of Geography, McGill University, 805 Sherbrooke Street West, Montreal, QC H3A 0B9, Canada20Department of Geography and Environmental Studies, Carleton University, Ottawa, Canada
Published by Copernicus Publications on behalf of the European Geosciences Union.
5190 G. Granath et al.: Environmental and taxonomic controls of carbon and oxygen stable isotope composition
21Department of Plant Biology, Faculty of AgriSciences, Mendel University in Brno, Zemedelska 1, 61300,Brno, Czech Republic22University of Tartu, Institute of Ecology and Earth Sciences, Lai st 40, Tartu 51005, Estonia23Laboratory of Biogeocenology, Institute of Soil Science and Agrochemistry, Siberian Branch of Russian Academy ofSciences, Ak. Lavrent’ev ave., 8/2, Novosibirsk, 630090, Russia24Yugra State University, Chekhova str, 16, Khanty-Mansiysk, 628012, Russia25Plant Ecology and Nature conservation group, Wageningen University, Droevendaalse steeg 3a,6708 PD Wageningen, the Netherlands26Finnish Meteorological Institute, Erik Palménin aukio 1, 00560 Helsinki, Finland27Center for Ecosystem Science and Society (Ecoss), Department of Biological Sciences, Northern Arizona University,P.O. Box 5620, Flagstaff, AZ 86011, USA28Department of Geography, University of Calgary, 2500 University Dr. NW, Calgary, AB T2N 1N4, Canada29Department of Geology, St. Mary’s University, Calgary, AB T2X 1Z4, Canada30Woods Hole Research Center, 149 Woods Hole Road, Falmouth, MA 02540, USA31Environment, University of York, York YO105DD, UK32Penza State University, Krasnaya str., 40, 440026 Penza, Russia33Department of Biology, SUNY-Oneonta, Oneonta, NY, USA34Biological Sciences, University of Southampton, Southampton SO17 1BJ, UK35Department of Plant Science and Center for Northern Studies, Laval University, Québec, QC, Canada36Laboratory of Soil Biodiversity, Institute of Biology, University of Neuchâtel, Rue Emile-Argand 11,2000 Neuchâtel, Switzerland37NTNU University Museum, Norwegian University of Science and Technology, 7491 Trondheim, Norway38Peatland and soil ecology group, School of Forest Sciences, University of Eastern Finland, B.O. Box 111,80110 Joensuu, Finland39Komarov Botanical Institute Russian Academy of Sciences, Professor Popov st. 2, 197376, St. Petersburg, Russia40Department of Zoology, Institute of Biosciences, University of São Paulo, 05508-090, São Paulo, Brazil41School of Geography and Earth Sciences, McMaster University, 1280 Main Street West, Hamilton, ON L8S 4K1, Canada†deceased, 27 August 2017
Received: 7 March 2018 – Discussion started: 28 March 2018Revised: 25 July 2018 – Accepted: 7 August 2018 – Published: 29 August 2018
Abstract. Rain-fed peatlands are dominated by peat mosses(Sphagnum sp.), which for their growth depend on nutrients,water and CO2 uptake from the atmosphere. As the isotopiccomposition of carbon (12,13C) and oxygen (16,18O) of theseSphagnum mosses are affected by environmental conditions,Sphagnum tissue accumulated in peat constitutes a potentiallong-term archive that can be used for climate reconstruction.However, there is inadequate understanding of how isotopevalues are influenced by environmental conditions, which re-stricts their current use as environmental and palaeoenviron-mental indicators. Here we tested (i) to what extent C andO isotopic variation in living tissue of Sphagnum is species-specific and associated with local hydrological gradients, cli-matic gradients (evapotranspiration, temperature, precipita-tion) and elevation; (ii) whether the C isotopic signature canbe a proxy for net primary productivity (NPP) of Sphagnum;and (iii) to what extent Sphagnum tissue δ18O tracks the δ18Oisotope signature of precipitation. In total, we analysed 337samples from 93 sites across North America and Eurasia us-
ing two important peat-forming Sphagnum species (S. mag-ellanicum, S. fuscum) common to the Holarctic realm. Therewere differences in δ13C values between species. For S. mag-ellanicum δ13C decreased with increasing height above thewater table (HWT, R2
= 17 %) and was positively correlatedto productivity (R2
= 7 %). Together these two variables ex-plained 46 % of the between-site variation in δ13C values.For S. fuscum, productivity was the only significant predictorof δ13C but had low explanatory power (total R2
= 6 %). Forδ18O values, approximately 90 % of the variation was foundbetween sites. Globally modelled annual δ18O values in pre-cipitation explained 69 % of the between-site variation in tis-sue δ18O. S. magellanicum showed lower δ18O enrichmentthan S. fuscum (−0.83 ‰ lower). Elevation and climatic vari-ables were weak predictors of tissue δ18O values after con-trolling for δ18O values of the precipitation. To summarize,our study provides evidence for (a) good predictability of tis-sue δ18O values from modelled annual δ18O values in precip-itation, and (b) the possibility of relating tissue δ13C values
G. Granath et al.: Environmental and taxonomic controls of carbon and oxygen stable isotope composition 5191
to HWT and NPP, but this appears to be species-dependent.These results suggest that isotope composition can be usedon a large scale for climatic reconstructions but that suchmodels should be species-specific.
1 Introduction
Peatlands in temperate, boreal and arctic regions form largereservoirs of carbon, which are vulnerable to release underexpected changes in global climate and land management(Rydin and Jeglum, 2013; Loisel et al., 2014). Because peatdecomposes slowly and gradually accumulates, it preservesinformation on past peatland ecosystem dynamics and re-sponses to allogenic and autogenic forcings. Palaeoenviron-mental studies of peat may, therefore, help to anticipate thefuture responses of these globally important ecosystems toclimate change (Loader et al., 2016). Past climate and lo-cal hydrology can be estimated using a variety of biotic andbiogeochemical proxies, including the δ13C and δ18O valuesof organic material (e.g. van der Knaap, 2011; Royles et al.,2016; Lamentowicz et al., 2015). However, the environmen-tal (e.g. climate) and biotic (e.g. species identity) controlsof isotope differentiation in peatland-dwelling plants are stillpoorly understood and current assumptions regarding thesecontrolling factors are yet to be tested on larger spatial scales.
Sphagnum mosses are the most dominant peat-formingplant group in acidic peatlands. The composition of stableisotopes of carbon and oxygen in their tissues is affected bydifferent environmental conditions, operating through theirimpact on fractionation processes. When not submerged, car-bon isotope signals in bulk tissues or components such ascellulose depend mainly on the concentration and isotopiccomposition of CO2 in the chloroplast, which alters isotopediscrimination during biochemical fixation of CO2 (Farquharet al., 1989; O’Leary, 1988). In mosses, the CO2 concentra-tion in the chloroplast, [CO2]c, is determined by temperature,light availability, CO2 partial pressure and, most importantly,plant water status (Finsinger et al., 2013; van der Knaap et al.,2011; Ménot and Burns, 2001; Ménot-Combes et al., 2004;Royles et al., 2014; Skrzypek et al., 2007a; Kaislahti Tillmanet al., 2013). When wet, external water films on leaf surfacesimpede diffusion and [CO2]c is lowered (Rice and Giles,1996; Rice, 2000; Williams and Flanagan, 1996); conse-quently, the proportion of fixed 13C increases due to internaldrawdown of the preferred isotope 12C. When submerged,assimilation of respired or methane-derived CO2 can alter[CO2] and also the isotopic composition of C in Sphagnum(Raghoebarsing et al., 2005). Even when not submerged, res-piratory carbon can be refixed by Sphagnum (Turetsky andWieder, 1999; Limpens et al., 2008). Given that respired CO2is isotopically lighter than that in the atmosphere, it mayalso contribute to variation in tissue isotope values. Despitemany detailed studies, there remains uncertainty about how
the multiple controls on 13C isotope values combine to deter-mine isotopic composition, and how universal the proposedmechanisms are on a global scale. This uncertainty currentlyrestricts the utility of C isotope signals as palaeoclimatic orpalaeoenvironmental indicators in peatlands (Loader et al.,2016).
Oxygen isotope values in moss tissues depend on the iso-topic composition of the water sources, enrichment associ-ated with evaporation from the moss surface and biochemicalfractionation (Dawson et al., 2002). Once on the plant, 18Opresent in water equilibrates with that in atmospheric CO2prior to fixation as well as being incorporated directly duringhydrolysis reactions, especially during the initial stages ofcarbon fixation (Gessler et al., 2014; Sternberg et al., 2006).Hence, variation in tissue oxygen isotopes reflect environ-mental conditions that control source water (rainfall, snow-fall, groundwater) as well as fractionation caused by evapo-ration prior to fixation, which is controlled by micrometeoro-logical conditions (mainly temperature, relative humidity andincident energy) (Daley et al., 2010; Moschen et al., 2009;Royles et al., 2013; Kaislahti Tillman et al., 2010). Oxygenisotope composition has, therefore, been used to reconstructclimatic conditions and to infer the dominant water source inpeatlands (Aravena and Warner, 1992; Ellis and Rochefort,2006; van der Knaap et al., 2011). Ongoing measurementsof oxygen isotopes in precipitation across the globe (Bowen,2010; IAEA/WMO, 2015) have generated models that pre-dict spatial patterns in oxygen isotope composition of pre-cipitation based on temperature, elevation, atmospheric resi-dence time and circulation patterns (e.g. Bowen, 2010). Onceisotopic composition of the source water is accounted for,variation in moss tissue isotopic values should be largely de-termined by fractionation that accompanies evaporation fromthe surface of plants. How well oxygen isotopes in Sphag-num tissues reflect atmospheric water or plant surface wa-ter depends on local weather conditions such as precipita-tion, air temperature and humidity. For example, Bilali etal. (2013) suggest that oxygen isotopes in Sphagnum mossesfrom maritime bogs will track variation in precipitation pat-terns whereas isotopic values in continental habitats will bemore dependent on summer temperature, as temperature andhumidity are more variable in those regions. On local scales,oxygen isotope values also vary as a function of temperatureand humidity. Aravena and Warner (1992) found differencesthat correspond with changes in microtopography. Elevatedmicrosites (hummocks) were enriched in 18O, which they as-cribed to higher evaporation compared to that of neighbour-ing wet depressions (hollows). However, as with 13C, thereremains uncertainty in how 18O signatures relate to environ-mental factors and species identity and to what extent global18O patterns in precipitation dominate over local processes.
Stable isotopes can also serve as indicators of net pri-mary productivity (NPP) (Rice and Giles, 1996; Williamsand Flanagan, 1996; Rice, 2000). However, few studies haveexplored these relationships in the field. In a multispecies
5192 G. Granath et al.: Environmental and taxonomic controls of carbon and oxygen stable isotope composition
comparison of peat mosses, Rice (2000) found that plantswith higher relative growth rates had lower discriminationagainst 13C and therefore were more enriched in 13C. Thiswas attributed to the local environment, with fast-growingplants of wetter microhabitats having thicker water films thatinhibit CO2 diffusion into the plant and to species-specificdifferences in maximum rates of photosynthesis. Both fac-tors would reduce internal [CO2] and thereby lower discrim-ination. In line with this, a warming experiment by Deane-Coe et al. (2015) reported a positive relationship betweenmoss net NPP and δ13C values for tundra mosses (Dicranum,Pleurozium, Sphagnum). Clearly, carbon isotope values showpromise as indicators of peat moss contemporary growth andpotentially as an NPP proxy in palaeoecological studies. Thiscould be particularly valuable to differentiate productivityand decomposition controls in long-term carbon accumula-tion studies. To date, we are not aware of attempts to ex-plore the robustness of these relationships across large spatialscales.
Together, tissue carbon and oxygen isotope compositionsare controlled both by environmental factors at micro- andmacro-scales, and by species-specific differences that re-late to water balance and carbon dynamics in peat mosses.Palaeoecological studies rely on such environment–isotoperelationships for environmental reconstructions (Ellis andRochefort, 2006; van der Knaap et al., 2011). The underlyingmechanisms are, however, rarely fully explored using knownenvironmental gradients (but see Ménot and Burns, 2001 foran example) or only tested across narrow bands of environ-mental variation, often with sets of correlated environmentalfactors (Loader et al., 2016). Moreover, interactions with bi-otic factors such as species identity have received little atten-tion despite the large variations in Sphagnum species domi-nance commonly observed down peat cores (e.g. Ménot andBurns, 2001). Here we aim to provide a robust, cross-scaleevaluation of how environmental factors and species identityinfluence the C and O isotope compositions of Sphagnum us-ing two common and widely distributed peat-forming species(S. magellanicum and S. fuscum) that are primarily rain-fed.To achieve this, we performed an unprecedented large sam-pling campaign across the Holarctic realm.
Specifically, we (i) investigated relationships between Cand O isotope values and factors known to influence plantwater availability (height above the water table – HWT,temperature, evaporation and precipitation) and CO2 partialpressure (elevation), and tested whether their effects weremodified by species identity; (ii) tested the prediction thatSphagnum tissue δ13C values are associated with NPP; and(iii) tested whether tissue δ18O in rain-fed Sphagna is pre-dicted by the δ18O isotope signature in precipitation but mod-ified by negative relationships with precipitation and positiveones with temperature/evaporation. Across these objectiveswe examined how C and O isotope values varied with scale(within-peatland versus between-peatlands) and to what ex-
tent HWT and NPP could explain variation within and be-tween peatlands.
2 Materials and methods
2.1 Study species and collection sites
Our study focused on two common peat-forming Sphagnumspecies, S. fuscum (Schimp.) H. Klinggr. (circumpolar dis-tribution) and S. magellanicum Brid. (cosmopolitan distri-bution). In general, these species are confined to primarilyrain-fed peatlands (bogs) and described as hummock (S. fus-cum) and lawn (S. magellanicum) species. However, S. mag-ellanicum is a species with a very broad niche and foundin a range of habitats with varying degrees of groundwaterinfluence (Flatberg, 2013). These species are easy to iden-tify, but recent research has shown that the dark Europeanmorph of S. fuscum is conspecific to the North American S.beothuk (Kyrkjeeide et al., 2015), and S. magellanicum hasbeen shown to consist of two genetically diverged morpho-types (Kyrkjeeide et al., 2016) that recently were separatedat the species level (Hassel et al., 2018). Unpublished ge-netic data suggest that samples collected in our study consistof both S. magellanicum morphs (approximately 50/50) andpossibly one or two samples of S. beothuk (Narjes Yousefi,personal communication, 2018). Hence, we here treat ourspecies as aggregates (i.e. species collectiva), S. fuscum coll.and S. magellanicum coll.
The two species were sampled across the Holarctic regionat a total of 93 sites (Fig. 1; Table S1 in the Supplement)at the end of the growing season. To make comparisons be-tween species and between sites possible, we focused onhabitats where both species can be found and have low in-fluence of surrounding groundwater. Thus, we only sampledbogs (including a few poor fens with ombrotrophic charac-ter) and open (no tree canopy) habitats. Sampling was con-ducted mainly during 2013, but a few sites were sampled at asimilar time of year in 2014. At each site two patches (min-imum 10 m apart) for each species were sampled (except for11 sites that contained only one patch for one species). Ateach sampling patch we recorded moss growth, HWT andGPS coordinates, and collected a moss sample (78 cm2 and5 cm deep) at the end of the growing season (September toNovember depending on location and generally coincidedwith when there was a risk of the first snowfall to occur).Moss samples were dried (24 h at 60–65 ◦C) within 72 h orimmediately frozen and later thawed and dried. The apicalpart (the capitula, top 1 cm) of the dried plant shoots wasused for isotope analysis, while the stem section was usedfor bulk density estimation to calculate moss NPP.
2.2 Isotope determination
Ten capitula from each patch were selected and finelychopped with a single-edge razor by hand and mixed. Ca-
G. Granath et al.: Environmental and taxonomic controls of carbon and oxygen stable isotope composition 5193
45 W °
30 ° N
60 ° N
45 ° E
90 ° E90 W °
SpeciesS. fuscum
S.magellanicumS. fuscum & S. magellanicum
Figure 1. Map illustrating sample sites for the investigated species.At some sites only one of the two Sphagnum species was sampled,indicated by red triangles or black circles. Otherwise sites containedboth species (blue crosses). The map is centred on the North Poleand has an orthographic projection. Geographical ranges: latitude41.6–69.1 N, elevation 2 – 1829 m a.s.l. See Table S1 for details.
pitula were chosen as they reflect the most recently fixed or-ganic matter and should relate better to recent growing sea-son conditions. In Sphagnum, δ13C from the capitulum issimilar to that of branches within the top 15 cm of plants butis approximately 1–2 ‰ less negative than stems (Loader etal., 2007). For δ18O, the offset between branches and stemsis around 1 ‰ (Moschen et al., 2009). Standard deviationsof repeated samples were 0.6 ‰ and 0.7 ‰ for δ13C andδ18O, respectively. Approximately 0.5 mg of dry sample waspacked in tin cups for δ13C analyses, and ∼ 0.2 mg in sil-ver cups for δ18O analyses. Samples were analysed at UnionCollege (Schenectady, NY, USA) using a Thermo Delta Ad-vantage mass spectrometer in continuous flow mode con-nected (via a ConFlo IV) to a Costech Elemental Analyzerfor δ13C analysis or a Thermo TC/EA for δ18O analyses. Iso-tope values are presented as 1000× (Rsample/Rstandard− 1),where Rsample and Rstandard are the ratios of heavy to lightisotopes (e.g. 13C / 12C) and are referenced to VPDB andVSMOW for C and O, respectively. Carbon isotope datawere corrected using sucrose (IAEA-CH-6, −10.449 ‰),acetanilide (in house, −37.07 ‰) and caffeine (IAEA-600,−27.771 ‰). Oxygen isotope data were corrected using su-crose (IAEA-CH-6, 36.4 ‰), cellulose (IAEA-C3, 31.9 ‰)and caffeine (IAEA-600, −3.5 ‰) with values from Hun-singer et al. (2010). Oxygen isotope standardization was fur-ther checked with the whole wood standards USGS54 and
USGS56. The combined instrument uncertainty for δ13C(VPDB) is < 0.1 ‰ based on the in-house acetanilide stan-dard and< 0.5 ‰ for δ18O (VSMOW) based on the cellulosestandard (IAEA-C3).
We performed isotope analyses on whole-plant tissuerather than on cellulose extracts. In living Sphagnum sam-ples, there is a strong linear relationship between the iso-topic composition of these two components for both δ13C(R2 values 0.89–0.96; Kaislahti Tillman et al., 2010; Ménotand Burns, 2001; Skrzypek et al., 2007b) and for δ18O (R2
values 0.53–0.69; Kaislahti Tillman et al., 2010; Jones et al.,2014). Focussing on whole-plant tissue allowed us to analysea higher number of samples for this study, allowing largernumbers of sites and more replication.
2.3 Environmental variables
The modelled δ18O signal in meteoric water (precipitation)(Bowen and Wilkinson, 2002) was obtained from http://www.waterisotopes.org (last access: 2 October 2017) as an-nual and monthly isotope ratio estimates at 10 arcmin reso-lution. These global estimates have shown to be highly ac-curate (R2
= 0.76 for mean annual δ18O in precipitation)and are based on absolute latitude and elevation and ac-count for regional effects on atmospheric circulation patterns(for details see Bowen, 2010, 2017; IAEA/WMO, 2015).To test which temporal period of δ18O values in precipi-tation showed the highest correlation with tissue δ18O val-ues, we calculated annual (January–December), growing sea-son (May–October) and winter–spring (January–April) meanisotope ratio. We calculated both unweighted and weightedmeans against precipitation for each month. Monthly pre-cipitation (PRECTOTCORR), land evapotranspiration (EV-LAND) and surface air temperature (TLML) for each siteand year of sampling (2013 or 2014) were retrieved from theNASA GESDISC data archive, land surface and flux diag-nostics products (M2T1NXLND, M2TMNXFLX; resolutionlongitude 0.667◦, latitude 0.5◦; Global Modeling and Assim-ilation Office, 2015a, b). Total precipitation and evapotran-spiration (ET), and mean temperature, from April to Octo-ber were used as predictors in the statistical models. As ETcan be compensated for by precipitation, we used the ET/Pquotient as a predictor for the effect of water loss. A highvalue (> 1) indicates a net loss of water to the atmosphere.Site altitude was retrieved from a global database using theR package elevatr (ver 0.1-2, Hollister and Shah, 2017).
The distance from the moss surface to the water table(HWT) was measured using water wells (commonly a PVCpipe, 2–5 cm in diameter and slotted or perforated along thesides) with a “plumper” (a cylinder on a string that makes a“plump” sound when it hits the water surface) or a “bubbler”(a narrow tube that makes bubbles when it hits the water sur-face while the user blows into it). HWT was measured in thespring and in the autumn and there was a strong correlationbetween the two time points (r = 0.74). As growth mainly
5194 G. Granath et al.: Environmental and taxonomic controls of carbon and oxygen stable isotope composition
Table 1. Sample sizes, standard variation and overall partitioning of measured variation for each species and response (δ13C and δ18O).Nsiteis the number of sites and Nobs the total sample size. Standard deviation of the responses is given for within and between sites, together withthe proportion of total variance measured between sites and within sites.
Species Nsite Nobs Within site Between sites
SD Proportion of SD Proportion ofvariance (%) variance (%)
occurs in late summer to autumn in temperate and boreal re-gions, we used HWT at the end of the season as the proxy ofrelative HWT between sites.
2.4 Moss growth
Moss growth (or productivity, NPP) was measured with amodified version of the cranked wire method (see Clymo,1970; Rydin and Jeglum, 2013 for details), with bristles froma paint brush spirally attached to a wire. These “brush wires”were inserted in the moss layer with the end of the wireprotruding above the surface. Height increment (i.e. verticalgrowth) was measured over the growing season as the changein distance (to nearest millimetres) between the moss layerand the top of the wire. A minimum of three wires were in-serted within a 1×1 m uniform area (same microhabitat, veg-etation and general structure). To determine moss bulk den-sity (kg m−3), we dried (24 h at 60–65 ◦C) the top 30 mm ofthe stems (area 78 cm2) in our collected core (see Sect. 2.1).Biomass growth on an area basis (g m−2 yr−1) was calculatedas height increment× bulk density.
2.5 Statistical analyses
To test and quantify the influence of environmental variablesand species identity on isotope composition, we used linearmixed models in R (R core team, 2016), employing the Rpackage lme4 ver 1.1-12 (Bates et al., 2015). Site dependence(i.e. multiple samples from the same site) was accountedfor by adding site as a random factor. For tissue δ13C, wefirst fitted two separate models to test the independent ef-fects of HWT, NPP and species identity (S. fuscum and S.magellanicum), and whether the HWT or NPP effect var-ied between species by fitting a species interaction term. Totest the explanatory power of environmental variables (ET/P ,precipitation, temperature, elevation) we first constructed abase model with HWT and NPP, as they were identified asthe main predictors in literature. For simplicity we removednegligible interactions from this model. Each environmen-tal variable and its interaction with species was then testedagainst the base model. For tissue δ18O, we first explored
which temporal period of modelled δ18Oprecip (annual, grow-ing season, winter–spring) had the highest explanatory powerand whether the relationship varied between species. Theidentified best model was then used as the base model to sep-arately test each environmental variable (HWT, ET/P , pre-cipitation, temperature) and its interaction with the species.
The proportion of variance explained by the predictorswas calculated at the site level (Gelman and Hill, 2007) oras marginal R2 (Nakagawa and Schielzeth, 2013; R pack-age piecewiseSEM ver 1.1-4; Lefcheck, 2016). Although ourstudy focused on explained variance by predictors, we alsoperformed statistical tests of predictors and their interactionsusing type-2 (main effects tested after all the others in themodel but without the interaction term) F tests, applyingKenward–Roger adjustments to the degrees of freedom, asimplemented in the car package (ver. 2.1-3, Fox and Weis-berg, 2011). Standard model checking was performed (e.g.residual analyses and distribution of random effects) to en-sure compliance with model assumptions. Covariances be-tween predictors were small (r < 0.15) or moderate (r =0.40–0.50 between ET/P , precipitation and temperature) andthis multicollinearity had minor impact on model estimates.
3 Results
Data collection from a geographically broad area resulted inlarge variation of isotope values and explanatory variables(Table S2). Due to uncertainty in height increment measure-ment we recorded a few negative values resulting in negativeNPP. These values were kept in the analyses. The means andstandard deviations (in parenthesis) of height increment (HI,millimetres) were 14.3 (10.1) for S. fuscum and 19.5 (14.1)for S. magellanicum, and the means and standard deviationsof bulk density (BD, kg m−3) were 17.8 (9.9) for S. fuscumand 10.2 (7.6) for S. magellanicum.
G. Granath et al.: Environmental and taxonomic controls of carbon and oxygen stable isotope composition 5195
Table 2. Results from linear mixed models for δ13C values. Statistical tests are based on type-2 F test using Kenward–Roger-adjusteddegrees of freedom. The second model only included S. magellanicum. Elevation (m a.s.l.) and the three climatic variables (growing seasonsums and means: ET/P , P in millimetres, temperature in degrees Celcius) were tested one by one in the model including HWT (height abovethe water table in centimetres), species and NPP (g m−2 yr−1). For simplicity, the negligible HWT×NPP term was dropped from this model(P = 0.36). Estimated effects (±SEs) are only given for the main effects if interactions were considered negligible. These effects are slopesfor continuous variables (all variables except species) and for species (categorical) the difference between S. magellanicum and S. fuscum(i.e. S. fuscum being the reference level). In the presence of an interaction between HWT and species, the species effect was estimated atmean HWT. R2
site is explained between-site variance; R2marginal is explained total variance.
ET/P 0.2 1, 90 0.66 295(ET/P )× species S. fus: −0.33± 0.40 5.0 1, 266 0.03 −0.02 0.01
S. mag: 0.78± 0.44
P −0.00013± 0.0006 0.0 1, 80 0.83 295 −0.01 0.00P × species NS 1.2 1, 248 0.27
T 0.0 1, 91 0.97 295T × species S. fus: −0.051± 0.034 9.7 1, 273 < 0.01 −0.05 0.02
S. mag: 0.087± 0.041
∗ The effect of S. magellanicum compared to S. fuscum at HWT 28 cm.
3.1 δ13C signal
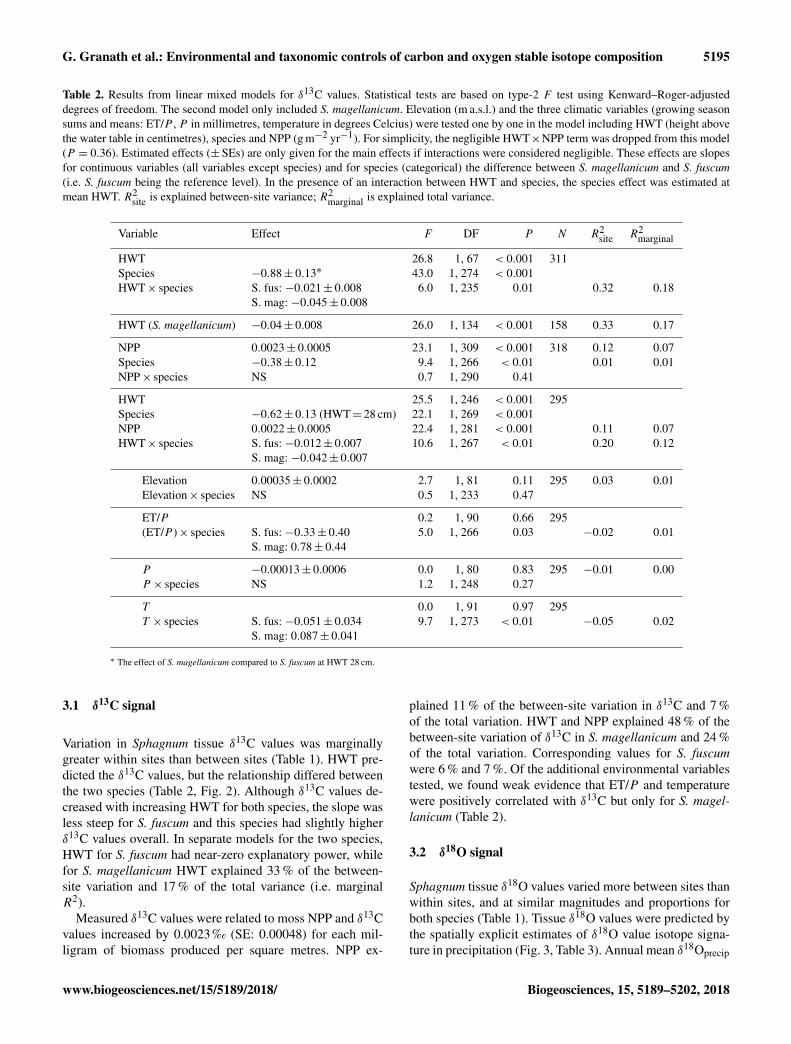
Variation in Sphagnum tissue δ13C values was marginallygreater within sites than between sites (Table 1). HWT pre-dicted the δ13C values, but the relationship differed betweenthe two species (Table 2, Fig. 2). Although δ13C values de-creased with increasing HWT for both species, the slope wasless steep for S. fuscum and this species had slightly higherδ13C values overall. In separate models for the two species,HWT for S. fuscum had near-zero explanatory power, whilefor S. magellanicum HWT explained 33 % of the between-site variation and 17 % of the total variance (i.e. marginalR2).
Measured δ13C values were related to moss NPP and δ13Cvalues increased by 0.0023 ‰ (SE: 0.00048) for each mil-ligram of biomass produced per square metres. NPP ex-
plained 11 % of the between-site variation in δ13C and 7 %of the total variation. HWT and NPP explained 48 % of thebetween-site variation of δ13C in S. magellanicum and 24 %of the total variation. Corresponding values for S. fuscumwere 6 % and 7 %. Of the additional environmental variablestested, we found weak evidence that ET/P and temperaturewere positively correlated with δ13C but only for S. magel-lanicum (Table 2).
3.2 δ18O signal
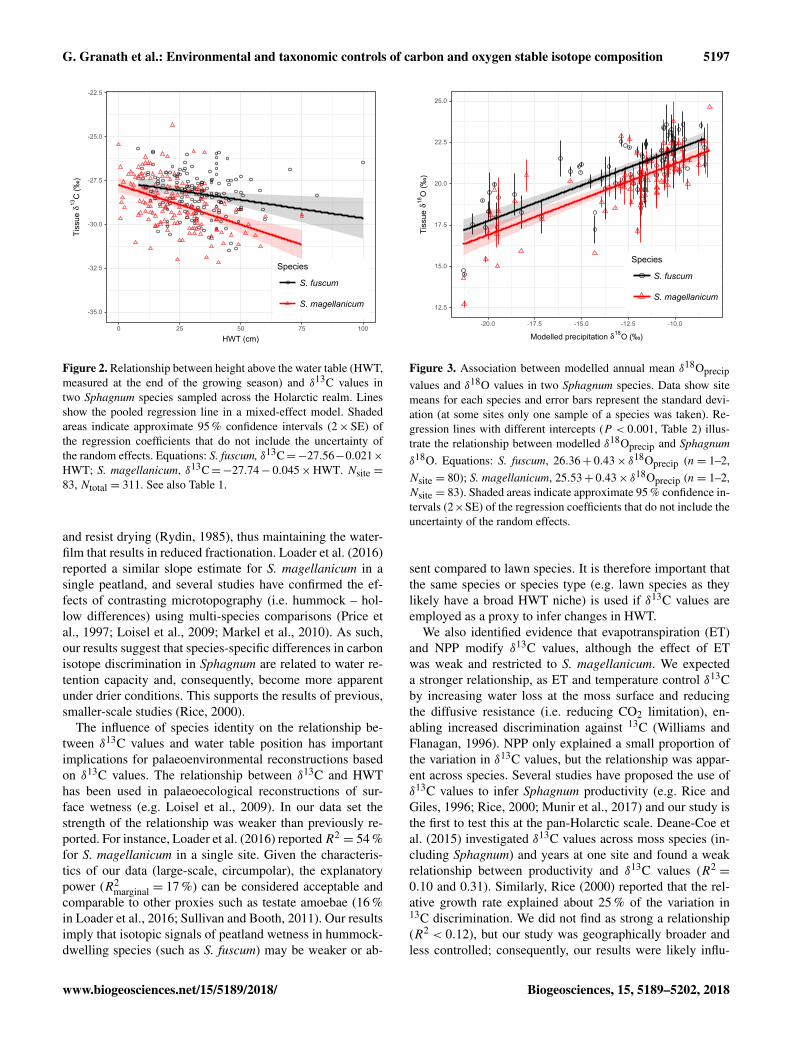
Sphagnum tissue δ18O values varied more between sites thanwithin sites, and at similar magnitudes and proportions forboth species (Table 1). Tissue δ18O values were predicted bythe spatially explicit estimates of δ18O value isotope signa-ture in precipitation (Fig. 3, Table 3). Annual mean δ18Oprecip
5196 G. Granath et al.: Environmental and taxonomic controls of carbon and oxygen stable isotope composition
Table 3. Results from linear mixed models for δ18O values. Statistical tests are based on type-2 F test using Kenward–Roger-adjusteddegrees of freedom. Three time periods for modelled δ18O values (‰) in precipitation were tested individually: annual mean, growingseason (April–September) and spring (January–April). The three climatic variables (growing season sums and mean: ET/P , P (mm), temp[◦C]) were tested one by one in a model including HWT (cm) and mean annual δ18O values). Estimated effects (±SEs) are only given forthe main effects if interactions were considered negligible. These effects are slopes for continuous variables (all variables except species) andfor species (categorical) the difference between S. magellanicum and S. fuscum (i.e. S. fuscum being the reference level). R2
explained 69 % of the variation in δ18Otissue between sites.This was similar to mean winter–spring (January–April)δ18Oprecip values (75 % explained) but higher than thegrowing season (April–September) δ18Oprecip (58 %). Us-ing precipitation-weighted δ18Oprecip values resulted in lowerpercentages of explained variance for all three time periods(R2
site: annual 52 %, January–April 65 %, April–September52 %). S. magellanicum had consistently lower δ18O valuesthan S. fuscum (−0.83 ‰), but both species had a similarrelationship between tissue δ18O and δ18Oprecip (Fig. 3, Ta-ble 3).
HWT at the end of the growing season was, on aver-age, 11 cm lower in S. magellanicum patches (wetter habitat)compared to S. fuscum (HWT= 33 cm) patches (F1,224 =
131.9, P < 0.0001). However, we found only very weak sup-port for the hypothesis that HWT predicts tissue δ18O values,as HWT explained < 1 % of the δ18O variation (Table 2).There was negligible influence of the additional environmen-tal variables on δ18O values (Table 2). ET/P was associatedwith higher δ18O values in S. magellanicum and lower in S.fuscum (but not different from the zero effect), while increas-ing temperature was weakly associated with overall lowerδ18O values.
4 Discussion
4.1 Stable carbon isotope discrimination in Sphagnum
Our data were consistent with the hypothesis that mossgrowing closer to the water table (low HWT) has reducedcarbon isotope fractionation, leading to greater fixation of13CO2 and more 13C-enriched tissue (Rice and Giles, 1996;Williams and Flanagan, 1996). Given that the water tableposition was measured in different places at different timesand all are one-time measurements, this result is remarkablyrobust. For example refixation of 12C-enriched substrate-derived CO2 in living Sphagna (Turetsky and Wieder, 1999;Raghoebarsing et al., 2005) can potentially contribute towithin-site variation in δ13C as it potentially affects both theambient concentration of CO2 as well as its isotopic com-position. Interestingly, the strength of the δ13C – HWT re-lationship differed in the two species, with S. magellanicumexhibiting a greater reduction in δ13C in response to drierconditions (high HWT) than S. fuscum. The weaker effect ofHWT on δ13C values in S. fuscum is likely a consequence oflimited fluctuation in tissue water content, as this species iswell known to store abundant water within capillary spaces
G. Granath et al.: Environmental and taxonomic controls of carbon and oxygen stable isotope composition 5197
-35.0
-32.5
-30.0
-27.5
-25.0
-22.5
0 25 50 75 100HWT (cm)
Tiss
ue δ
13C
(‰)
Species
S. fuscum
S. magellanicum
Figure 2. Relationship between height above the water table (HWT,measured at the end of the growing season) and δ13C values intwo Sphagnum species sampled across the Holarctic realm. Linesshow the pooled regression line in a mixed-effect model. Shadedareas indicate approximate 95 % confidence intervals (2×SE) ofthe regression coefficients that do not include the uncertainty ofthe random effects. Equations: S. fuscum, δ13C=−27.56−0.021×HWT; S. magellanicum, δ13C=−27.74− 0.045×HWT. Nsite =83, Ntotal = 311. See also Table 1.
and resist drying (Rydin, 1985), thus maintaining the water-film that results in reduced fractionation. Loader et al. (2016)reported a similar slope estimate for S. magellanicum in asingle peatland, and several studies have confirmed the ef-fects of contrasting microtopography (i.e. hummock – hol-low differences) using multi-species comparisons (Price etal., 1997; Loisel et al., 2009; Markel et al., 2010). As such,our results suggest that species-specific differences in carbonisotope discrimination in Sphagnum are related to water re-tention capacity and, consequently, become more apparentunder drier conditions. This supports the results of previous,smaller-scale studies (Rice, 2000).
The influence of species identity on the relationship be-tween δ13C values and water table position has importantimplications for palaeoenvironmental reconstructions basedon δ13C values. The relationship between δ13C and HWThas been used in palaeoecological reconstructions of sur-face wetness (e.g. Loisel et al., 2009). In our data set thestrength of the relationship was weaker than previously re-ported. For instance, Loader et al. (2016) reportedR2
= 54 %for S. magellanicum in a single site. Given the characteris-tics of our data (large-scale, circumpolar), the explanatorypower (R2
marginal = 17 %) can be considered acceptable andcomparable to other proxies such as testate amoebae (16 %in Loader et al., 2016; Sullivan and Booth, 2011). Our resultsimply that isotopic signals of peatland wetness in hummock-dwelling species (such as S. fuscum) may be weaker or ab-
12.5
15.0
17.5
20.0
22.5
25.0
-20.0 -17.5 -15.0 -12.5 -10.0
Modelled precipitation δ18O (‰)
Tiss
ue δ
18O
(‰)
Species
S. fuscum
S. magellanicum
Figure 3. Association between modelled annual mean δ18Oprecipvalues and δ18O values in two Sphagnum species. Data show sitemeans for each species and error bars represent the standard devi-ation (at some sites only one sample of a species was taken). Re-gression lines with different intercepts (P < 0.001, Table 2) illus-trate the relationship between modelled δ18Oprecip and Sphagnumδ18O. Equations: S. fuscum, 26.36+ 0.43× δ18Oprecip (n= 1–2,Nsite = 80); S. magellanicum, 25.53+ 0.43× δ18Oprecip (n= 1–2,Nsite = 83). Shaded areas indicate approximate 95 % confidence in-tervals (2×SE) of the regression coefficients that do not include theuncertainty of the random effects.
sent compared to lawn species. It is therefore important thatthe same species or species type (e.g. lawn species as theylikely have a broad HWT niche) is used if δ13C values areemployed as a proxy to infer changes in HWT.
We also identified evidence that evapotranspiration (ET)and NPP modify δ13C values, although the effect of ETwas weak and restricted to S. magellanicum. We expecteda stronger relationship, as ET and temperature control δ13Cby increasing water loss at the moss surface and reducingthe diffusive resistance (i.e. reducing CO2 limitation), en-abling increased discrimination against 13C (Williams andFlanagan, 1996). NPP only explained a small proportion ofthe variation in δ13C values, but the relationship was appar-ent across species. Several studies have proposed the use ofδ13C values to infer Sphagnum productivity (e.g. Rice andGiles, 1996; Rice, 2000; Munir et al., 2017) and our study isthe first to test this at the pan-Holarctic scale. Deane-Coe etal. (2015) investigated δ13C values across moss species (in-cluding Sphagnum) and years at one site and found a weakrelationship between productivity and δ13C values (R2
=
0.10 and 0.31). Similarly, Rice (2000) reported that the rel-ative growth rate explained about 25 % of the variation in13C discrimination. We did not find as strong a relationship(R2 < 0.12), but our study was geographically broader andless controlled; consequently, our results were likely influ-
5198 G. Granath et al.: Environmental and taxonomic controls of carbon and oxygen stable isotope composition
enced by more complex interactions among environmentalfactors that affect Sphagnum growth across our sites. Nev-ertheless, our results indicate independent effects of evapo-ration and productivity on δ13C values. The lack of a strongNPP pattern somewhat limits the ability to infer productivityof Sphagnum in palaeoecological studies.
4.2 Global patterns of δ18O values in Sphagnum
Modelled δ18O values in precipitation (Bowen, 2010) ex-plained much of the variation in δ18Otissue values betweensites (R2
= 68 % for annual mean δ18Oprecip). The percentvariance explained was even higher if the spring period formodelled 18Oprecip was used but was lower for the grow-ing season average. This result does not necessarily meanthat spring season water was utilized by the plants dur-ing the growing season. Between-site variation in 18Oprecipvalues are much larger in the winter (Fig. S1), more ef-fectively discriminating maritime and continental regions(Bowen, 2010). The better fit may simply be an effect of amore distinct separation of 18Oprecip in the winter data. Al-though the δ18Otissue−
18Oprecip relationship presented hereis robust, a few δ18O values are less well predicted by the re-gression model and they originate from Northwest Territories(Canada) and West Siberia (Russia). Likely, this suggests thatthe 18Oprecip model is less accurate in these interior regionswith fewer precipitation collection stations.
In contrast, the data did not support a negative correla-tion between precipitation amount and δ18Otissue values andδ18Otissue values were only weakly affected by predictorsassociated with water loss (ET/P and/or temperature) andspecies identity. The indication of 18O enrichment in S. mag-ellanicum due to ET/P was expected as the lighter isotope16O needs less energy to vaporize. However, the oppositetrend was suggested for S. fuscum, and surprisingly, highersurface temperatures decreased 18O enrichment. Hence weconclude that climatic variables associated with water losswere weak predictors after controlling for δ18Oprecip values.This result may not be too unexpected as laboratory experi-ments have so far failed to relate 18O enrichment in Sphag-num to differences in evaporation rates (Brader et al., 2010).
There have been few regional studies on moss δ18Otissuevalues that span gradients of δ18Oprecip values (Royles etal., 2016; Skrzypek et al., 2010) and most interpretations ofmoss δ18Otissue – climate relationships come from peat corestudies (e.g. van der Knaap et al., 2011). In Antarctic non-Sphagnum peat banks variation in δ18Ocellulose values trackedδ18O values in moss water across a latitudinal gradient (61–65◦ S) despite a lack of difference in δ18Oprecip. This resultled Royles et al. (2016) to suggest that moss water and tis-sue δ18O values are better temporal integrators of source wa-ter than point rainfall measurements. The authors interpretedsite-to-site differences as relating to differential evaporativeenrichment and other physio-chemical factors that affect 18Oexchange, fixation and biochemical synthesis. Skrzypek et
al. (2010) explored variation in Sphagnum δ18Otissue valuesacross a regional altitudinal gradient and found no consis-tent trend or significant relationship linking δ18Otissue valuesto altitude, where δ18O in source water is expected to differ.Although fractionation in source water caused by adiabaticcooling with altitude should lead to altitudinal effects, differ-ences in precipitation amount can confound this pattern (Gatet al., 2000). Unfortunately, there are limited regional stud-ies that have tested the effects of variation in source water onδ18Otissue values. The present study provides a much greaterrange of geographical and environmental variation and showsstrong support for Sphagnum strongly tracking source water.
Interestingly, the relationship between δ18Otissue andδ18Oprecip values detected here is very similar to that pro-posed some time ago by Epstein et al. (1977); δ18Ocellulose =
27.33+ 0.33× δ18Oprecip (note that Jones et al., 2014, showhigh correspondence between δ18Ocellulose and δ18Otissue val-ues). However, our data suggest a slightly steeper slopeand lower intercept, particularly for S. magellanicum. Thespecies effect on δ18O suggests a difference in the degreeof evaporation from the plant surface prior to the uptake ofwater. The lower δ18O values for S. magellanicum comparedto S. fuscum (−0.83 ‰) is comparable to the results frombogs in Canada for the same species (−2.2 ‰, Aravena andWarner, 1992) and between a hollow and a hummock speciesin the Netherlands (−2 ‰, Brenninkmeijer et al., 1982). Thissuggests that the absorbed water in S. magellanicum was sub-ject to less evaporation. In Sphagnum plants, surface wateris largely affected by capillarity, water storage and reducingconductance with compact morphology. Plant traits that en-hance these functions are more pronounced in species andindividuals found at high HWT as these characteristics main-tain high tissue water content (Hayward and Clymo, 1982;Laing et al., 2014; Waddington et al., 2015). Consequently,during droughts, Sphagnum species growing close to the wa-ter table will dry out quickly as the evaporative demand can-not be balanced, and simultaneously photosynthesis is shutdown. Sphagnum species higher above the water table wickwater from below and store water effectively, thereby re-maining photosynthetically active while water is lost due toevaporation. This mechanism would result in 18O enrich-ment being higher above the water table (Brenninkmeijer etal., 1982; Aravena and Warner, 1992) and explains the pos-itive relationship between HWT and δ18O in S. magellan-icum reported by Loader et al. (2016) along a 10 m transect.We found a weak positive relationship of δ18O with HWT,which suggests that HWT cannot entirely explain species-specific differences in 18O enrichment. Instead, this can beattributed to lower water retention (i.e. higher evaporation atthe same water deficit) in S. magellanicum compared to S.fuscum (Clymo, 1973; McCarter and Price, 2014). Althoughspecies differences in 18O have been reported (Aravena andWarner, 1992; Zanazzi and Mora, 2005; Bilali et al., 2013),our study suggests that the species-specific δ18O signals maynot simply be a consequence of growing at different HWT
G. Granath et al.: Environmental and taxonomic controls of carbon and oxygen stable isotope composition 5199
but can rather reflect distinct water retention capacity in thesespecies.
The strong influence of δ18Oprecip values and, to a muchlesser extent, environmental variables related to water loss,combined with a relatively small within-site variation inδ18Otissue values, suggest that macroclimatic drivers, suchas precipitation inputs, largely determine the δ18O value ofpeatland moss tissue. These results are promising for theuse of oxygen isotopes in large-scale palaeoecological re-constructions from peat cores (Ellis and Rochefort, 2006;Chambers et al., 2012; Daley et al., 2010), although a betterunderstanding of O isotope fractionation within tissue com-ponents and their decay relationships would improve theirutility. Moreover, the simple relationships presented here canpotentially be utilized to trace changes in δ18Oprecip valuesthat mirror climate variability.
5 Conclusions
Our study provides new insights into large-scale variationin Sphagnum tissue isotopic signature and suggests that iso-topic composition can be used for climatic reconstructions.We show a close link between precipitation and tissue δ18Ovalues and conclude that variation in δ18O values are mainlydriven by the macroclimate, but species differences exist. Incontrast, δ13C values were strongly related to local micro-topography, while the influence of macroclimate was neg-ligible. As suggested in earlier studies, δ13C values werealso weakly associated with NPP. These conclusions weremost strongly supported for the cosmopolitan S. magellan-icum complex and species identity should be accounted for infuture carbon isotope studies to avoid spurious conclusions.
Code and data availability. Data and R-script used to repro-duce results are available on Figshare, https://doi.org/10.6084/m9.figshare.6969497 (Granath et al., 2018).
The Supplement related to this article is available onlineat https://doi.org/10.5194/bg-15-5189-2018-supplement.
Author contributions. SKR, GG and HR initiated the study and for-mulated the research objectives. All authors were involved in datacollection and SKR, NB, KP, AV and DPG performed the isotopeanalyses. GG performed the statistical analyses and wrote the firstdraft with input from SKR and HR. All authors read and commentedon the manuscript and approved the final version.
Competing interests. The authors declare that they have no conflictof interest.
Acknowledgements. To the memory of coauthor and Sphagnumenthusiast Maria Noskova, who passed away tragically before thispaper was finished. We thank Union College and the US NationalScience Foundation for providing funding for Union isotope ratiomass spectrometer and peripherals (NSF-MRI #1229258) andSarah Katz for laboratory assistance. The project was supported bythe Swedish Research Council (2015-05174), the Russian ScienceFoundation (grant 14-14-00891), the Russian Foundation for BasicResearch (research projects nos. 14-05-00775, 15-44-00091 and16-55-16007), University of Ferrara (FAR 2013 and 2014), thePolish National Centre for Research and Development (within thePolish-Norwegian Research Programme: the project WETMAN(Central European Wetland Ecosystem Feedbacks to Changing Cli-mate Field Scale Manipulation) Project ID: 203258), the NationalScience Centre, Poland (ID: 2015/17/B/ST10/01656), institutionalresearch funds from the Estonian Ministry of Education andResearch (grant IUT34-7), the Natural Sciences and EngineeringResearch Council of Canada Discovery Grants program awarded toJennifer L. Baltzer, an NSERC Strategic Grant, and with generoussupport awarded to Lorna I. Harris from the W. Garfield WestonFoundation Fellowship for Northern Conservation, administeredby Wildlife Conservation Society (WCS) Canada, and NationalScience Foundation (NSF-1312402) to Susan M. Natali. Weacknowledge the Adirondack and Maine offices of The NatureConservancy, the Autonomous Province of Bolzano (Italy),Staatsbosbeheer and Landschap Overijssel (the Netherlands), theGreenwoods Conservancy, NY and the University of Maine foraccess to field sites.
Edited by: Marcel van der MeerReviewed by: Julie Loiesel and one anonymous referee
References
Aravena, R. and Warner, B. G.: Oxygen-18 composition of Sphag-num, and microenvironmental water relations, Bryologist, 95,445–448, 1992.
Bates, D., Mächler, M., Bolker, B., and Walker, S.: Fitting Lin-ear Mixed-Effects Models Using lme4, J. Stat. Softw., 67,https://doi.org/10.18637/jss.v067.i01, 2015.
Bilali, H. E., Patterson, R. T., and Prokoph, A.: A Holocene paleo-climate reconstruction for eastern Canada based on δ18O cellu-lose of Sphagnum mosses from Mer Bleue Bog, Holocene, 23,1260–1271, https://doi.org/10.1177/0959683613484617, 2013.
Bowen, G. J.: Isoscapes: spatial pattern in isotopic bio-geochemistry, Annu. Rev. Earth Pl. Sc., 38, 161–187,https://doi.org/10.1146/annurev-earth-040809-152429, 2010.
Bowen, G. J.: Gridded maps of the isotopic composition of meteoricwaters, available at: http://www.waterisotopes.org (last access:17 September 2017), 2017.
Bowen, G. J. and Wilkinson, B.: Spatial distribu-tion of δ18O in meteoric precipitation, Geol-ogy, 30, 315–318, https://doi.org/10.1130/0091-7613(2002)030<0315:SDOOIM>2.0.CO;2, 2002.
Brader, A. V., van Winden, J. F., Bohncke, S. J. P., Beets, C.J., Reichart, G.-J., and de Leeuw, J. W.: Fractionation of hy-drogen, oxygen and carbon isotopes in n-alkanes and cellulose
5200 G. Granath et al.: Environmental and taxonomic controls of carbon and oxygen stable isotope composition
of three Sphagnum species, Org. Geochem., 41, 1277–1284,https://doi.org/10.1016/j.orggeochem.2010.09.006, 2010.
Brenninkmeijer, C. A. M., van Geel, B., and Mook, W. G.: Vari-ations in the D /H and 18O / 16O ratios in cellulose extractedfrom a peat bog core, Earth Planet. Sc. Lett., 61, 283–290,https://doi.org/10.1016/0012-821X(82)90059-0, 1982.
Chambers, F. M., Booth, R. K., De Vleeschouwer, F., Lamen-towicz, M., Le Roux, G., Mauquoy, D., Nichols, J. E.,and van Geel, B.: Development and refinement of proxy-climate indicators from peats, Quaternary Int., 268, 21–33,https://doi.org/10.1016/j.quaint.2011.04.039, 2012.
Clymo, R. S.: The growth of Sphagnum?: Methods of measurement,J. Ecol., 58, 13–49, 1970.
Clymo, R. S.: The growth of Sphagnum?: Some effects of environ-ment, J. Ecol., 61, 849–869, 1973.
Daley, T. J., Barber, K. E., Street-Perrott, F. A., Loader,N. J., Marshall, J. D., Crowley, S. F., and Fisher, E.H.: Holocene climate variability revealed by oxygen iso-tope analysis of Sphagnum cellulose from Walton Moss,northern England, Quaternary Sci. Rev., 29, 1590–1601,https://doi.org/10.1016/j.quascirev.2009.09.017, 2010.
Dawson, T. E., Mambelli, S., Plamboeck, A. H., Tem-pler, P. H. and Tu, K. P.: Stable isotopes in plantecology, Annu. Rev. Ecol. Syst., 33, 507–559,https://doi.org/10.1146/annurev.ecolsys.33.020602.095451,2002.
Deane-Coe, K. K., Mauritz, M., Celis, G., Salmon, V., Crummer,K. G., Natali, S. M., and Schuur, E. A. G.: Experimental warm-ing alters productivity and isotopic signatures of tundra mosses,Ecosystems, 18, 1070–1082, https://doi.org/10.1007/s10021-015-9884-7, 2015.
Ellis, C. J. and Rochefort, L.: Long-term sensitivity of a High Arc-tic wetland to Holocene climate change, J. Ecol., 94, 441–454,https://doi.org/10.1111/j.1365-2745.2005.01085.x, 2006.
Epstein, S., Thompson, P., and Yapp, C. J.: Oxygen and hydro-gen isotopic ratios in plant cellulose, Science, 198, 1209–1215,https://doi.org/10.1126/science.198.4323.1209, 1977.
Farquhar, G. D., Ehleringer, J. R., and Hubick, K. T.: Carbon isotopediscrimination and photosynthesis, Annu. Rev. Plant Phys., 40,503–537, https://doi.org/10.1146/annurev.pp.40.060189.002443,1989.
Finsinger, W., Schoning, K., Hicks, S., Lücke, A., Goslar, T.,Wagner-cremer, F., and Hyyppä, H.: Climate change during thepast 1000 years: a high-temporal-resolution multiproxy recordfrom a mire in northern Finland, J. Quaternary Sci., 28, 152–164,https://doi.org/10.1002/jqs.2598, 2013.
Flatberg, K. I.: Norges torvmoser, Akad. Forl, Oslo, 2013.Fox, J. and Weisberg, S.: An R companion to applied regression,
2nd Edn., SAGE Publications, Thousand Oaks, Calif., 2011.Gat, J. R., Mook, W. G., and Meijer Harro, A. J.: Observed isotope
effects in precipitation. Environmental Isotopes in the Hydro-logical Cycle: Principles and Applications, International AtomicEnergy Agency and United Nations Educational, Scientific andCultural Organization, 2, 197–207, 2000.
Gelman, A. and Hill, J.: Data analysis using regression and mul-tilevel/hierarchical models, Cambridge University Press, Cam-bridge, New York, 2007.
Gessler, A., Ferrio, J. P., Hommel, R., Treydte, K., Werner, R. A.,and Monson, R. K.: Stable isotopes in tree rings: towards a mech-
anistic understanding of isotope fractionation and mixing pro-cesses from the leaves to the wood, Tree Physiol., 34, 796–818,https://doi.org/10.1093/treephys/tpu040, 2014.
Global Modeling and Assimilation Office (GMAO): MERRA2tavg1_2d_flx_Nx: 2d,1-Hourly,Time-Averaged,Single-Level,Assimilation,Surface Flux Diagnostics V5.12.4, NASAGoddard Earth Sciences Data and Information Services Center,Greenbelt, MD, USA, 2015a.
Global Modeling and Assimilation Office (GMAO): MERRA2tavg1_2d_lnd_Nx: 2d,1-Hourly,Time-Averaged,Single-Level,Assimilation,Land Surface Diagnostics V5.12.4, NASAGoddard Earth Sciences Data and Information Services Center,Greenbelt, MD, USA, 2015b.
Granath, G., Rydin, H., Baltzer, J. L., Bengtsson, F., Boncek, N.,Bragazza, L., Bu, Z.-J., Caporn, S. J. M., Dorrepaal, E., Galan-ina, O., Gałka, M., Ganeva, A., Gillikin, D. P., Goia, I., Gon-charova, N., Hájek, M., Haraguchi, A., Harris, L. I., Humphreys,E., Jiroušek, M., Kajukało, K., Karofeld, E., Koronatova, N.G., Kosykh, N. P., Lamentowicz, M., Lapshina, E., Limpens, J.,Linkosalmi, M., Ma, J.-Z., Mauritz, M., Munir, T. M., Natali, S.,Natcheva, R., Noskova, M., Payne, R. J., Pilkington, K., Robin-son, S., Robroek, B. J. M., Rochefort, L., Singer, D., Stenøien,H. K., Tuittila, E.-S., Vellak, K., Verheyden, A., Waddington,J. M., and Rice, S. K.: Data from: Environmental and taxo-nomic controls of carbon and oxygen stable isotope composi-tion in Sphagnum across broad climatic and geographic ranges,https://doi.org/10.6084/m9.figshare.6969497, 2018.
Hassel, K., Kyrkjeeide, M. O., Yousefi, N., Prestø, T., Stenøien,H. K., Shaw, A. J., and Flatberg, K. I.: Sphagnum di-vinum (sp. nov.) and S. medium Limpr. and their rela-tionship to S. magellanicum Brid., J. Bryol., 40, 197–222,https://doi.org/10.1080/03736687.2018.1474424, 2018.
Hayward, P. M. and Clymo, R. S.: Profiles of water content and poresize in Sphagnum and peat, and their relation to peat bog ecology,P. Roy. Soc. Lond. B Bio., 215, 299–325, 1982.
Hollister, J. W. and Shah, T.: Elevatr: Access elevation data fromvarious APIs, CRAN, version 0.1.4, available at: https://CRAN.R-project.org/package=elevatr (last access: 28 August 2018),2017.
Hunsinger, G. B., Hagopian, W. M., and Jahren, A. H.: Of-fline oxygen isotope analysis of organic compounds withhigh N : O, Rapid Commun. Mass Sp., 24, 3182–3186,https://doi.org/10.1002/rcm.4752, 2010.
IAEA/WMO: Global Network of Isotopes in Precipitation, TheGNIP Database, 2015.
Jones, M. C., Wooller, M., and Peteet, D. M.: A deglacialand Holocene record of climate variability in south-central Alaska from stable oxygen isotopes and plantmacrofossils in peat, Quaternary Sci. Rev., 87, 1–11,https://doi.org/10.1016/j.quascirev.2013.12.025, 2014.
Kaislahti Tillman, P., Holzkämper, S., Kuhry, P., Sannel, A. B. K.,Loader, N. J., and Robertson, I.: Stable carbon and oxygen iso-topes in Sphagnum fuscum peat from subarctic Canada: Impli-cations for palaeoclimate studies, Chem. Geol., 270, 216–226,https://doi.org/10.1016/j.chemgeo.2009.12.001, 2010.
Kaislahti Tillman, P., Holzkämper, S., Andersen, T. J., Hugelius,G., Kuhry, P., and Oksanen, P.: Stable isotopes in Sphag-num fuscum peat as late-Holocene climate proxies in
G. Granath et al.: Environmental and taxonomic controls of carbon and oxygen stable isotope composition 5201
northeastern European Russia, Holocene, 23, 1381–1390,https://doi.org/10.1177/0959683613489580, 2013.
Kyrkjeeide, M. O., Hassel, K., Stenøien, H. K., Prestø, T., Boström,E., Shaw, A. J., and Flatberg, K. I.: The dark morph of Sphag-num fuscum (Schimp.) H.Klinggr. in Europe is conspecificwith the North American S. beothuk, J. Bryol., 37, 251–266,https://doi.org/10.1179/1743282015Y.0000000020, 2015.
Kyrkjeeide, M. O., Hassel, K., Flatberg, K. I., Shaw, A. J.,Yousefi, N., and Stenøien, H. K.: Spatial genetic struc-ture of the abundant and widespread peatmoss Sphag-num magellanicum Brid., PLOS ONE, 11, e0148447,https://doi.org/10.1371/journal.pone.0148447, 2016.
Laing, C. G., Granath, G., Belyea, L. R., Allton, K. E., and Ry-din, H.: Tradeoffs and scaling of functional traits in Sphagnumas drivers of carbon cycling in peatlands, Oikos, 123, 817–828,https://doi.org/10.1111/oik.01061, 2014.
Lamentowicz, M., Gałka, M., Lamentowicz, Ł., Obremska, M.,Kühl, N., Lücke, A., and Jassey, V. E. J.: Reconstructing cli-mate change and ombrotrophic bog development during thelast 4000years in northern Poland using biotic proxies, stableisotopes and trait-based approach, Palaeogeogr. Palaeocl., 418,261–277, https://doi.org/10.1016/j.palaeo.2014.11.015, 2015.
Lefcheck, J. S.: piecewiseSEM: Piecewise structural equation mod-elling in R for ecology, evolution, and systematics, Meth-ods Ecol. Evol., 7, 573–579, https://doi.org/10.1111/2041-210X.12512, 2016.
Limpens, J., Robroek, B. J. M., Heijmans, M. M. P. D., andTomassen, H. B. M.: Mixing ratio and species affect the use ofsubstrate-derived CO2 by Sphagnum, J. Veg. Sci., 19, 841–848,https://doi.org/10.3170/2008-8-18456, 2008.
Loader, N. J., McCarroll, D., van der Knaap, W. O., Robertson,I., and Gagen, M.: Characterizing carbon isotopic variability inSphagnum, Holocene, 17, 403–410, 2007.
Loader, N. J., Street-Perrott, F. A., Mauquoy, D., Roland, T. P.,van Bellen, S., Daley, T. J., Davies, D., Hughes, P. D. M., Pan-cotto, V. O., Young, G. H. F., Amesbury, M. J., Charman, D. J.,Mallon, G., and Yu, Z. C.: Measurements of hydrogen, oxygenand carbon isotope variability in Sphagnum moss along a micro-topographical gradient in a southern Patagonian peatland, J.Quaternary Sci., 31, 426–435, https://doi.org/10.1002/jqs.2871,2016.
Loisel, J., Garneau, M., and Hélie, J.-F.: Modern Sphagnum δ13Csignatures follow a surface moisture gradient in two boreal peatbogs, James Bay lowlands, Québec, J. Quaternary Sci., 24, 209–214, https://doi.org/10.1002/jqs.1221, 2009.
Loisel, J., Yu, Z., Beilman, D. W., Camill, P., Alm, J., Ames-bury, M. J., Anderson, D., Andersson, S., Bochicchio, C., Bar-ber, K., Belyea, L. R., Bunbury, J., Chambers, F. M., Charman,D. J., De Vleeschouwer, F., Fia kiewicz-Kozie, B., Finkelstein,S. A., Gaka, M., Garneau, M., Hammarlund, D., Hinchcliffe,W., Holmquist, J., Hughes, P., Jones, M. C., Klein, E. S., Kok-felt, U., Korhola, A., Kuhry, P., Lamarre, A., Lamentowicz, M.,Large, D., Lavoie, M., MacDonald, G., Magnan, G., Makila, M.,Mallon, G., Mathijssen, P., Mauquoy, D., McCarroll, J., Moore,T. R., Nichols, J., O’Reilly, B., Oksanen, P., Packalen, M., Pe-teet, D., Richard, P. J., Robinson, S., Ronkainen, T., Rundgren,M., Sannel, A. B. K., Tarnocai, C., Thom, T., Tuittila, E.-S.,Turetsky, M., Valiranta, M., van der Linden, M., van Geel, B.,van Bellen, S., Vitt, D., Zhao, Y., and Zhou, W.: A database
and synthesis of northern peatland soil properties and Holocenecarbon and nitrogen accumulation, Holocene, 24, 1028–1042,https://doi.org/10.1177/0959683614538073, 2014.
Markel, E. R., Booth, R. K., and Qin, Y.: Testate amoe-bae and δ13C of Sphagnum as surface-moisture prox-ies in Alaskan peatlands, Holocene, 20, 463–475,https://doi.org/10.1177/0959683609354303, 2010.
McCarter, C. P. R. and Price, J. S.: Ecohydrology of Sphag-num moss hummocks: mechanisms of capitula water supplyand simulated effects of evaporation, Ecohydrology, 7, 33–44,https://doi.org/10.1002/eco.1313, 2014.
Ménot, G. and Burns, S. J.: Carbon isotopes in ombrogenic peatbog plants as climatic indicators: calibration from an altitu-dinal transect in Switzerland, Org. Geochem., 32, 233–245,https://doi.org/10.1016/S0146-6380(00)00170-4, 2001.
Menot-Combes, G., Combes, P.-P., and Burns, S. J.: Cli-matic information from δ13C in plants by combining sta-tistical and mechanistic approaches, Holocene, 14, 931–939,https://doi.org/10.1191/0959683604hl771rp, 2004.
Moschen, R., Kühl, N., Rehberger, I., and Lücke, A.: Stable carbonand oxygen isotopes in sub-fossil Sphagnum: Assessment of theirapplicability for palaeoclimatology, Chem. Geol., 259, 262–272,https://doi.org/10.1016/j.chemgeo.2008.11.009, 2009.
Munir, T. M., Khadka, B., Xu, B., and Strack, M.: Mineral nitro-gen and phosphorus pools affected by water table lowering andwarming in a boreal forested peatland, Ecohydrology, 10, e1893,https://doi.org/10.1002/eco.1893, 2017.
Nakagawa, S. and Schielzeth, H.: A general and simple methodfor obtaining R2 from generalized linear mixed-effects models,Methods Ecol. Evol., 4, 133–142, https://doi.org/10.1111/j.2041-210x.2012.00261.x, 2013.
O’Leary, M. H.: Carbon isotopes in photosynthesis, Bioscience, 38,328–336, 1988.
Price, G. D., McKenzie, J. E., Pilcher, J. R., andHoper, S. T.: Carbon-isotope variation in Sphagnumfrom hummock-hollow complexes: implications forHolocene climate reconstruction, Holocene, 7, 229–233,https://doi.org/10.1177/095968369700700211, 1997.
Raghoebarsing, A. A., Smolders, A. J. P., Schmid, M. C., Rijp-stra, W. I. C., Wolters-Arts, M., Derksen, J., Jetten, M. S. M.,Schouten, S., Damste, J. S. S., Lamers, L. P. M., Roelofs, J. G.M., den Camp, H., and Strous, M.: Methanotrophic symbiontsprovide carbon for photosynthesis in peat bogs, Nature, 436,1153–1156, 2005.
R core team: R: a language and environment for statistical com-puting, R Foundation for Statistical Computing, Vienna, Aus-tria, available at: https://www.R-project.org (last access: 28 Au-gust 2018), 2016.
Rice, S. K.: Variation in carbon isotope discrimination within andamong Sphagnum species in a temperate wetland, Oecologia,123, 1–8, 2000.
Rice, S. K. and Giles, L.: The influence of water content and leafanatomy on carbon isotope discrimination and photosynthesis inSphagnum, Plant Cell Environ., 19, 118–124, 1996.
Royles, J., Sime, L. C., Hodgson, D. A., Convey, P., and Griffiths,H.: Differing source water inputs, moderated by evaporative en-richment, determine the contrasting δ18OCELLULOSE signals inmaritime Antarctic moss peat banks, J. Geophys. Res.-Biogeo.,118, 184–194, https://doi.org/10.1002/jgrg.20021, 2013.
5202 G. Granath et al.: Environmental and taxonomic controls of carbon and oxygen stable isotope composition
Royles, J., Horwath, A. B., and Griffiths, H.: Interpreting bryophytestable carbon isotope composition: Plants as temporal and spatialclimate recorders, Geochem. Geophy. Geosy., 15, 1462–1475,https://doi.org/10.1002/2013GC005169, 2014.
Royles, J., Amesbury, M. J., Roland, T. P., Jones, G. D., Convey,P., Griffiths, H., Hodgson, D. A., and Charman, D. J.: Mossstable isotopes (carbon-13, oxygen-18) and testate amoebae re-flect environmental inputs and microclimate along a latitudinalgradient on the Antarctic Peninsula, Oecologia, 181, 931–945,https://doi.org/10.1007/s00442-016-3608-3, 2016.
Rydin, H.: Effect of water level on desiccation of Sphagnum in re-lation to surrounding Sphagna, Oikos, 45, 374–379, 1985.
Rydin, H. and Jeglum, J. K.: The Biology of Peatlands, 2nd Edn.,Oxford University Press Inc., New York, 2013.
Skrzypek, G., Jezierski, P., and Szynkiewicz, A.: Preserva-tion of primary stable isotope signatures of peat-formingplants during early decomposition – observation alongan altitudinal transect, Chem. Geol., 273, 238–249,https://doi.org/10.1016/j.chemgeo.2010.02.025, 2010.
Skrzypek, G., Kałuzny, A., and Jedrysek, M. O.: Carbon stable iso-tope analyses of mosses – Comparisons of bulk organic matterand extracted nitrocellulose, J. Am. Soc. Mass Spectr., 18, 1453–1458, https://doi.org/10.1016/j.jasms.2007.04.020, 2007a.
Skrzypek, G., Kałuzny, A., Wojtun, B., and Jedrysek, M.-O.:The carbon stable isotopic composition of mosses: A recordof temperature variation, Org. Geochem., 38, 1770–1781,https://doi.org/10.1016/j.orggeochem.2007.05.002, 2007b.
Sternberg, L., Pinzon, M. C., Anderson, W. T., and Jahren, A.H.: Variation in oxygen isotope fractionation during cellu-lose synthesis: intramolecular and biosynthetic effects, PlantCell Environ., 29, 1881–1889, https://doi.org/10.1111/j.1365-3040.2006.01564.x, 2006.
Sullivan, M. E. and Booth, R. K.: The potential influence of short-term environmental variability on the composition of testateamoeba communities in Sphagnum peatlands, Microbiol. Ecol.,62, 80–93, https://doi.org/10.1007/s00248-011-9875-y, 2011.
Turetsky, M. R. and Wieder, K.: Boreal bog Sphagnum refixes soil-produced and respired 14CO2, Écoscience, 6, 587–591, 1999.
van der Knaap, W. O., Lamentowicz, M., van Leeuwen, J. F.N., Hangartner, S., Leuenberger, M., Mauquoy, D., Goslar,T., Mitchell, E. A. D., Lamentowicz, Ł., and Kamenik, C.:A multi-proxy, high-resolution record of peatland develop-ment and its drivers during the last millennium from thesubalpine Swiss Alps, Quaternary Sci. Rev., 30, 3467–3480,https://doi.org/10.1016/j.quascirev.2011.06.017, 2011.
Waddington, J. M., Morris, P. J., Kettridge, N., Granath, G.,Thompson, D. K., and Moore, P. A.: Hydrological feed-backs in northern peatlands, Ecohydrology, 8, 113–127,https://doi.org/10.1002/eco.1493, 2015.
Williams, T. G. and Flanagan, L. B.: Effect of changes in water con-tent on photosynthesis, transpiration and discrimination against13CO2 and C18O16O in Pleurozium and Sphagnum, Oecologia,108, 38–46, 1996.
Zanazzi, A. and Mora, G.: Paleoclimatic implications of the rela-tionship between oxygen isotope ratios of moss cellulose andsource water in wetlands of Lake Superior, Chem. Geol., 222,281–291, https://doi.org/10.1016/j.chemgeo.2005.08.006, 2005.