Page 1
Waste Management of Canada Corporation
Environmental Assessment for a New Landfill Footprint at the West Carleton Environmental Centre
GEOLOGY AND HYDROGEOLOGY DETAILED IMPACT ASSESSMENT
Prepared by:
WESA Inc.
Project Number:
60242342
Date:
August, 2012
Page 2
Geology and Hydrogeology West Carleton Environmental Centre
T a b l e o f C o n t e n t s Page
1. Introduction ......................................................................................................... 1
1.1 Description of the Preferred Alternative Landfill Footprint ..................................... 3 1.2 Facilities Characteristics Report ........................................................................... 3 1.3 Other WCEC Facilities ......................................................................................... 4 1.4 Geology and Hydrogeology Study Team .............................................................. 4
2. Study Area........................................................................................................... 5
3. Methodology ....................................................................................................... 5
4. Additional Investigations ................................................................................... 7
5. Detailed Description of the Environment Potentially Affected ....................... 8
5.1 On-Site Study Area .............................................................................................. 8 5.1.1 Topography and Drainage ........................................................................ 8 5.1.2 Geology .................................................................................................... 8 5.1.3 Hydrogeology ........................................................................................... 9
5.2 Site-Vicinity Study Area........................................................................................ 9 5.2.1 Topography and Drainage ........................................................................ 9 5.2.2 Geology .................................................................................................. 10 5.2.3 Hydrogeology ......................................................................................... 11
5.3 Regional Study Area .......................................................................................... 12 5.3.1 Topography and Drainage ...................................................................... 12 5.3.2 Geology .................................................................................................. 12 5.3.3 Hydrogeology ......................................................................................... 13
6. Geology and Hydrogeology Net Effects ......................................................... 14
6.1 Potential Effects on Geology and Hydrogeology ................................................ 14 6.1.1 Future Baseline Conditions .................................................................... 14 6.1.2 Potential Effects from the Preferred Alternative Landfill Footprint ........... 19
6.2 Mitigation Measures ........................................................................................... 24 6.2.1 Purge Wells ............................................................................................ 26 6.2.2 Operational Controls on Stormwater Management Pond Effluent ........... 28
6.3 Net Effects ......................................................................................................... 29
7. Impact Analysis of Other WCEC Facilities ..................................................... 29
8. Monitoring and Commitments for the Undertaking ....................................... 31
8.1 Monitoring Strategy and Schedule ..................................................................... 31 8.1.1 Environmental Effects Monitoring ........................................................... 31 8.1.2 Development of an Environmental Management Plan ............................ 33
8.2 Commitments ..................................................................................................... 33
9. Hydrogeology Approvals Required for the Undertaking .............................. 34
10. References ........................................................................................................ 35
Page 3
Geology and Hydrogeology West Carleton Environmental Centre
List of Figures
Figure 1. Preferred Alternative Landfill Footprint ....................................................................... 2
Figure 2. Site Location and Study Area .................................................................................... 6
Figure 3. Modelled Groundwater Heads in the Regional Area, Future Baseline
Conditions ............................................................................................................... 17
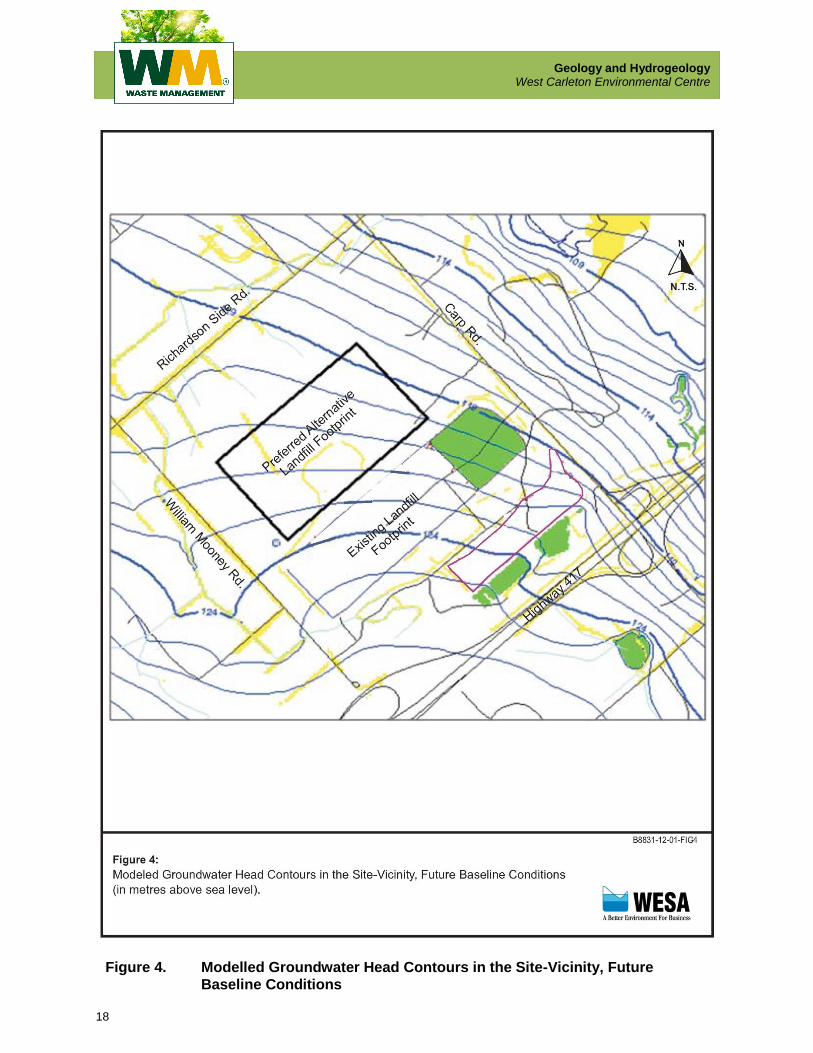
Figure 4. Modelled Groundwater Head Contours in the Site-Vicinity, Future Baseline
Conditions ............................................................................................................... 18
Figure 5. Predicted Chloride Concentrations under Future Baseline Conditions ..................... 20
Figure 6. Modelled Groundwater Head Contours in the Site-Vicinity, Assuming
Operation of the New Landfill Footprint and Stormwater Management Ponds ......... 22
Figure 7. Predicted Chloride Concentrations, Assuming Operation of the New Landfill
Footprint and Stormwater Management Ponds ........................................................ 25
Figure 8. Predicted Chloride Concentrations, Assuming Operation of the New Landfill
Footprint and Stormwater Management Ponds, and with Mitigation Measures
In-place .................................................................................................................... 27
List of Tables
Table 1. Potential Effects, Proposed Mitigation and Compensation Measures, and
Resulting Net Effects ............................................................................................... 15
Table 2. Infiltration Estimates from Unlined Stormwater Management Pond Stages .............. 21
Table 3. Proposed Monitoring Requirements ......................................................................... 32
Appendices
Appendix A. Groundwater Flow and Transport Modeling
Page 4
Geology and Hydrogeology West Carleton Environmental Centre
1
1. Introduction
This report documents the Geology and Hydrogeology impact assessment of the Preferred
Alternative Landfill Footprint for the Environmental Assessment (EA) for a new landfill footprint
at the West Carleton Environmental Centre (WCEC). In the preceding Alternative Methods
phase of the EA, a net effects analysis as well as a comparative evaluation of the four
alternative landfill footprint options were carried out in order to identify a Preferred Alternative
Landfill Footprint. The Preferred Alternative Landfill Footprint was determined to be Option #2 –
the North Footprint Option. The potential environmental effects, mitigation or compensation
measures to address the potential adverse environmental effects, and the remaining net effects
following the application of the mitigation or compensation measures were identified for the
Preferred Alternative Landfill Footprint.
The Preferred Alternative Landfill Footprint was refined based on stakeholder comments
received and in order to further avoid or mitigate potential adverse environmental effects, and is
illustrated in Figure 1.
A Facilities Characteristics Report (FCR) as well as a description of the ancillary facilities
associated with the WCEC have been prepared so that potential environmental effects and
mitigation or compensation measures identified for the Preferred Alternative Landfill Footprint
during the Alternative Methods phase of the EA could be more accurately defined, along with
enhancement opportunities and approval requirements.
The discipline-specific work plans developed during the ToR outlined how impacts associated
with the Preferred Alternative Landfill Footprint would be assessed. The results of these
assessments have been documented in the following 10 stand-alone Detailed Impact
Assessment Reports:
Atmospheric (Air Quality, Noise,
Odour, and Landfill Gas)
Geology and Hydrogeology
Surface Water
Biology
Archaeology
Cultural Heritage
Transportation
Land Use
Agriculture
Socio-Economic
(including Visual)
Despite being stand-alone documents, there are interrelationships between some of the reports,
where the information discussed overlaps between similar disciplines. Examples of this include
the following:
Geology and Hydrogeology, Surface Water, and Biology (Aquatic Environment);
and
Land Use, Agricultural, and Socio-Economic.
Page 5
Geology and Hydrogeology West Carleton Environmental Centre
2
Figure 1. Preferred Alternative Landfill Footprint
Page 6
Geology and Hydrogeology West Carleton Environmental Centre
3
1.1 Description of the Preferred Alternative Landfill Footprint
The southern half of the Preferred Alternative Landfill Footprint is on Waste Management (WM)
owned lands and the northern half is on lands that WM has options to purchase. A 100 m buffer
is maintained between the north limit of the Preferred Footprint and the private lands to the
north (e.g., lands which front onto Richardson Side Road) in accordance with Ontario
Regulation 232/98, and an approximate 350 m buffer is maintained between the east limit of the
footprint and Carp Road. A light industrial building (e.g., the Laurysen building) is situated in the
eastern portion of WM optioned lands, which WM anticipates using for equipment
storage/maintenance or waste diversion activities in the future. An approximate 45 to 50 m
buffer is maintained between the toe of slope of the existing and new landfill footprints, thus
allowing sufficient area for a new waste haul road to the new landfill footprint, and for
maintenance and monitoring access. The location of the west limit of the Preferred Alternative
Landfill Footprint was determined by maintaining the noted buffers and providing the required
6,500,000 m3 of disposal capacity, while maintaining landfill elevation below 158 mASL (as
reported in the CDR) and maintaining side slopes required by Ontario Regulation 232/98 (e.g.,
varying from 4H to 1V to 5%). This results in an approximate 146 m buffer between the west
limit of the Preferred Footprint and William Mooney Road. This buffer preserves a portion of the
existing woodlot within the west part of the WM-owned lands.
The final contours of the landfill are shown in Figure 1 and reflect a rectangular landform with a
maximum elevation (top of final cover) of 155.7 mASL. This elevation is approximately 30.7 m
above the surrounding existing grade. By comparison, the maximum elevation of the existing
Ottawa WMF landfill is approximately 172 mASL or approximately 47 m above the surrounding
existing grade. The contours reflect maximum side slopes of 4H to 1V, and a minimum slope of
5%. The total footprint area of the new landfill is 37.8 ha.
1.2 Facilities Characteristics Report
The FCR presents preliminary design and operations information for the Preferred Alternative
Landfill Footprint (Option #2) and provides information on all main aspects of landfill design and
operations including:
site layout design;
surface water management
leachate management;
gas management; and,
landfill development sequence and daily operations.
Page 7
Geology and Hydrogeology West Carleton Environmental Centre
4
The FCR also provides estimates of parameters relevant to the detailed impact assessment
including estimates of leachate generation, contaminant flux through the liner system, landfill
gas generation, and traffic levels associated with waste and construction materials haulage.
1.3 Other WCEC Facilities
In addition to the new landfill footprint, the WCEC will also include other facilities not subject to
EA approval. These include:
A material recycling facility
A construction and demolition material recycling facility
An organics processing facility
Residential diversion facility
Community lands for parks and recreation
A landfill-gas-to-energy facility
Greenhouses
Although these facilities do not require EA approval, it is important to consider environmental
impacts from all potential activities at the WCEC, not just the new landfill footprint. As such, the
synergistic impacts of these facilities in relation to the Preferred Alternative Landfill Footprint will
also be assessed in the EA.
1.4 Geology and Hydrogeology Study Team
The Geology and Hydrogeology study team consisted of WESA Inc. staff. The actual individuals
and their specific roles are provided as follows:
David Harding – Project Manager and Senior Engineer
Mr. Harding was responsible for undertaking the detailed impact assessment
in collaboration with the project team, and for preparing this report on the
results of the assessment.
Mike Melaney – Groundwater Modeller
Mr. Melaney was responsible for completing the groundwater flow and
transport modelling simulations, and for documenting the results of the
modelling program.
Francois Richard – Senior Hydrogeologist
Mr. Richard developed and supervised the groundwater modelling program
and reviewed the simulation results.
Page 8
Geology and Hydrogeology West Carleton Environmental Centre
5
2. Study Area
The specific On-Site, Site-Vicinity, and Regional study areas for the Preferred Alternative
Landfill Footprint at the WCEC are listed below, and are shown in Figure 2:
On-Site ............. the lands required for the Preferred Alternative Landfill
Footprint. In the Existing Conditions Report and Comparative
Evaluation Technical Report, this area is referred to as the
North Envelope. The North Envelope lies immediately north of
the existing landfill footprint and extends west to William
Mooney Road, east to Carp Road and north to the northern
boundary of lands under option to Waste Management;
Site-Vicinity ...... the lands in the vicinity of the Preferred Alternative Landfill
Footprint, extending about 500 metres in all directions,
including the licensed area of the existing WM Ottawa Landfill
and the Contaminant Attenuation Zones (CAZs); and,
Regional ........... the lands within natural hydrogeologic boundaries, including
Huntley Creek to the north, Feedmill Creek to the south, and
extending to Carp River in the east. The upgradient boundary
of the Regional Study Area coincides with the boundary of the
Site-Vicinity Study Area.
3. Methodology
The assessment of impacts associated with the Preferred Alternative Landfill Footprint was
undertaken through a series of steps that were based, in part, on a number of previously
prepared reports (Geology and Hydrogeology Existing Conditions Report, Geology and
Hydrogeology Comparative Evaluation Technical Report). The net effects associated with the
four Alternative Landfill Footprint Options identified during the Alternative Methods phase of the
EA were based on Conceptual Designs. These effects were reviewed within the context of the
preliminary design plans developed for the Preferred Alternative Landfill Footprint, as identified
in the FCR, to determine the type and extent of any additional investigations required to ensure
a comprehensive assessment of net effects. Additional investigations were then carried out,
where necessary, in order to augment the previous work undertaken.
With these additional investigations in mind, the potential impact on the Geology and
Hydrogeology environment of the Preferred Alternative Landfill Footprint was documented.
Page 9
Geology and Hydrogeology West Carleton Environmental Centre
6
Figure 2. Site Location and Study Area
Page 10
Geology and Hydrogeology West Carleton Environmental Centre
7
With a more detailed understanding of the potential impact from the preliminary landfill design on
the Geology and Hydrogeology environment, the previously identified potential effects and
recommended mitigation or compensation measures associated with the Preferred Alternative
Landfill Footprint (documented in the Geology and Hydrogeology Comparative Evaluation
Technical Report, September 2011) were reviewed to ensure their accuracy. Based on this
review, the potential effects, mitigation or compensation measures, and net effects associated
with the Preferred Alternative Landfill Footprint were confirmed and documented. In addition to
identifying mitigation or compensation measures, potential enhancement opportunities associated
with the preliminary design for the Preferred Alternative Landfill Footprint were also identified,
where possible.
Following this confirmatory exercise, the requirement for monitoring in relation to net effects was
identified, where appropriate. Finally, any Geology and Hydrogeology approvals required as part
of the implementation of the Preferred Alternative Landfill Footprint were identified.
4. Additional Investigations
Upon completion of the preliminary design for the Preferred Alternative Landfill Footprint as
documented in the FCR (AECOM, October 2011), the environmental characteristics of the
Study Area were reviewed to verify the accuracy of the assessment of net effects from the
Preferred Alternative Landfill Footprint. From this review, it was determined that the stormwater
management ponds identified in the preliminary design could have potential effects on
groundwater flow and contaminant transport within the On-Site and Site-Vicinity Study Area
components. Consequently, a detailed groundwater modelling investigation was conducted in
order to assess the potential effects on the Geology and Hydrogeology discipline from the
preliminary design.
The results from the initial modelling exercise into potential effects led to the development of
additional mitigative measures that are predicted to achieve acceptable net effects from the
Preferred Alternative Landfill Footprint.
The predicted potential effects, mitigation measures and net effects are described in Section 6
of this document.
Page 11
Geology and Hydrogeology West Carleton Environmental Centre
8
5. Detailed Description of the Environment Potentially Affected
In this section, a description of the Geology and Hydrogeology environment is presented. The
information is extracted from the Geology and Hydrogeology Existing Conditions Report, and a
more detailed description and list of reference sources can be found in that report.
5.1 On-Site Study Area
5.1.1 Topography and Drainage
The On-Site Study Area consists of well-drained sandy areas, representing the upland side of a
post-glacial beach ridge. The topography is flat-lying on the western half of the property with an
elevation of approximately 125 metres above sea level (mASL), and slopes downward toward
the eastern edge of the ridge, reaching approximately 120 mASL. The land surface has been
modified by former aggregate extraction activities and landfill operations on the south half of the
On-Site Study Area.
Surface drainage on the southern half of the On-Site Study Area is controlled by ditches and a
stormwater management pond. Surface flow is from the southwest to northeast across the
south half of the property, and the majority of surface water flow in this area collects in shallow
ponded areas. On the north half of the On-Site Study Area, surface water flow follows the land
contours and agricultural ditches in a northerly orientation. Surface drainage collects in Huntley
Creek, which ultimately flows into the Carp River.
5.1.2 Geology
Overburden deposits were found to be relatively homogeneous across the On-Site Study Area,
grading from sand-gravel in the eastern portion along the post-glacial beach ridge, to fine sand
further west, away from the edge of the ridge. The overburden thickness ranges from
approximately 4 to 16 metres. The bedrock surface slopes toward the north and northeast.
The bedrock consists of light to medium grey, fine to medium-grained fossiliferous limestone
with some shaly and sandy interbeds. The bedrock is classified as the Bobcaygeon Formation,
which is described regionally as a limestone with shaly partings and intermittent sandstone.
The bedrock is generally most fractured in the upper few metres, although at the western end of
the On-Site Study Area, relatively high fracture frequencies are observed for 5 to 10 metres
below the bedrock surface.
Page 12
Geology and Hydrogeology West Carleton Environmental Centre
9
5.1.3 Hydrogeology
Shallow groundwater flow on the On-Site Study Area generally follows the trend in bedrock
surface topography. Groundwater flows in a northerly orientation on the western half of the On-
Site Study Area, and gradually becomes northeasterly across the eastern portion. In the
northwest corner of the existing landfill, there is localized groundwater mounding which results
in a small component of flow to the northwest in the immediate vicinity of the landfill mound;
however, the natural hydraulic gradient, which is oriented north-northeast, controls the direction
of flow further away from the landfill mound.
The groundwater elevations in the deep bedrock are similar to the trend in overburden-shallow
bedrock, with the regional groundwater flow in the deep bedrock being toward the northeast.
With few exceptions, the water quality parameters from monitoring wells screened in the
overburden-shallow bedrock on the western side of the On-Site Study Area are within the
expected range of background concentrations.
The southern boundary of the On-Site Study Area lies along the northern edge of the existing
landfill. Groundwater monitoring completed as part of the regular environmental monitoring
program for the operating landfill site has shown that leachate-impacted groundwater is moving
northward away from the landfill, in a direction consistent with the local groundwater flow.
Elevated concentrations of dissolved parameters are also seen downgradient of the stormwater
management pond, in a former area of biosolids storage.
5.2 Site-Vicinity Study Area
5.2.1 Topography and Drainage
Within the Site-Vicinity Study Area, the natural topography, which has been modified by
extraction and waste disposal activities, ranges from an elevation of approximately 131 mASL
southwest of the landfill site to less than 110 mASL on the Huntley Quarry property, located east
of Carp Road.
North and west of the existing landfill site, surface drainage flows within the Huntley Creek
subwatershed. Tributaries of Huntley Creek generally flow northward to Richardson Sideroad,
and then eastward past Carp Road. Huntley Creek discharges to Carp River east of Huntmar
Road.
Page 13
Geology and Hydrogeology West Carleton Environmental Centre
10
From within the boundaries of the existing landfill property, there is minimal direct off-site
discharge of surface water. Surface water drainage is primarily contained within the landfill
property and is directed to on-site ponds. The exceptions to this are the external slopes of the
vegetated site perimeter berms along the east and south boundaries of the landfill property;
however, this amount of surface runoff is very minor and is not in contact with operational
activities at the landfill. Runoff from the vegetated berms flows into the Carp Road and Highway
417 drainage systems. There is also a small area of drainage from the extreme western end of
the site, north of the service entrance, which flows into the ditch along William Mooney Road,
and then northward into a tributary of Huntley Creek.
The Highway 417 drainage system controls surface water flow immediately south of the existing
landfill property. Surface water drainage south of the landfill property is controlled by ditches,
catch basins and culverts along Highway 417 and generally flows from west to east, eventually
reaching Feedmill Creek and ultimately Carp River.
Surface water drainage on the quarry property on the east side of Carp Road is influenced by a
series of excavated ponds that are used as a recirculation system for on-site aggregate washing
and dust control.
5.2.2 Geology
The surficial geology across the Site-Vicinity Study Area reflects the glacial history of the Ottawa
region. The unconsolidated deposits observed during subsurface investigations consist
principally of sand, silt, gravel and glacial till, and range in thickness from approximately 3 to 17
metres. The surficial deposits are interpreted to be ice-contact stratified drift sediments,
consisting of a mixture of poorly to well-sorted, stratified gravels and sands, interbedded with a
silty sand-gravel till. The deposits are interpreted to have been submerged during the
Champlain Sea encroachment, and therefore show indications of re-working in a subaqueous
environment.
The bedrock surface generally slopes toward the northeast across the Site-Vicinity Study Area,
ranging between elevations of 125 mASL and 108 mASL. The bedrock surface features two
apparent topographic highs: one located near the southwest extremity of the study area, and the
other in the western portion of the existing landfill site.
Bedrock consists of light to medium grey, fine to medium-grained fossiliferous limestone with
some shaly and sandy interbeds. The bedrock is classified as the Bobcaygeon Formation which is
described regionally as a limestone with shaly partings and intermittent sandstone. The bedrock
is generally most fractured in its upper few metres, while the frequency of fractures in the bedrock
decreases starting at depths of approximately 6 to 8 metres below the bedrock surface.
Page 14
Geology and Hydrogeology West Carleton Environmental Centre
11
5.2.3 Hydrogeology
In the higher topographic elevations along Carp Road, the water table in the unconsolidated
deposits (i.e., sand, silty sand and silty sand-gravel till) is generally found at over 10 metres
depth, indicating that the majority of the unconsolidated deposits are unsaturated. The
saturated thickness of these deposits, which represents the water table aquifer, is generally
limited to 5 metres or less. In areas where the bedrock is closer to the surface or where the
topographic elevations decline, the depth to the water table decreases, however, the saturated
thickness remains limited. Groundwater is also found in the weathered bedrock at the
overburden-bedrock interface. This part of the unit extends to a depth of approximately 6 to 8
metres below the bedrock surface.
Shallow groundwater flow within the Site-Vicinity Study Area generally follows the bedrock
topography, with a water table elevation varying from 128 to 129 mASL in the southwest portion
of the landfill property to less than 112 mASL east of Carp Road. The direction of groundwater
flow within the overburden-shallow bedrock in the southwest portion of the study area is towards
the north-northeast. In the northwest corner of the existing landfill site, the topographic high
present in the bedrock appears to influence shallow groundwater flow and induces an area of
localized northwesterly flow toward the northwest corner of the site. Across the majority of the
study area, the direction of groundwater flow in the overburden-shallow bedrock is towards the
northeast.
The regional direction of groundwater flow in the deep bedrock is interpreted to be toward the
northeast. Groundwater flow in the deep bedrock is interpreted to be influenced by isolated
fracture zones, which do not appear to be well-connected across most of the Site-Vicinity Study
Area. However, across the western portion of the Site-Vicinity Study Area, where the bedrock is
found at shallower depths, the hydraulic heads in the deep bedrock zone are generally more
consistent with those in the overburden-shallow bedrock zone than they are on the eastern
portion of the study area. This indicates that there may be more hydraulic connectivity between
the shallow and deep hydrostratigraphic units in this area.
The groundwater quality within the Site-Vicinity Study Area is highly variable due to influences
on natural groundwater quality from the existing landfill, major transportation corridors,
aggregate processing, and local agricultural/commercial/industrial practices. A detailed
discussion of groundwater quality in the Site-Vicinity Study Area is presented in the Existing
Conditions Report (the Detailed Study Area described in the Existing Conditions Report includes
the area designated as the Site-Vicinity in this document). In addition, historical groundwater
quality results and interpretations are available in the Annual Reports for the existing landfill.
Page 15
Geology and Hydrogeology West Carleton Environmental Centre
12
5.3 Regional Study Area
5.3.1 Topography and Drainage
The Regional Study Area consists of sandy upland areas in the northwest and west to poorly
drained swampy areas, clay plains and the Carp River floodplain toward the northeast. The
primary natural topographic feature in the area is a northwest-southeast trending sand and
gravel ridge, which has historically been exploited for aggregate extraction.
Within the area, the natural topography, which has been modified by extraction and waste
disposal activities, ranges from an elevation of approximately 131 mASL southwest of the
existing landfill site to less than 100 mASL along Carp River. The dominant man-made
topographic features in the study area are the WM Ottawa Landfill, which extends to an
elevation of approximately 172 mASL, and the Huntley Quarry, which has been mined to a floor
elevation of less than 75 mASL.
The Regional Study Area is situated within the Carp River watershed. The watershed drains
approximately 306 km2 of land in the northwestern portion of the City of Ottawa. Carp River is
located approximately four kilometres northeast of the existing landfill (see Figure 2), and
discharges to the Ottawa River at Fitzroy Harbour, approximately 20 km northwest of the landfill
property. Surface drainage within the Regional Study Area is controlled by the ground surface
topography and small tributaries of Carp River, as modified by the surrounding quarry and
landfill operations and the Highway 417 drainage system.
5.3.2 Geology
The surficial deposits in the Regional Study Area consist of glacial and related materials from
the late Wisconsian glaciation. During this glacial period, thick sequences of sand and gravel
were deposited along the Ottawa River valley, followed by deposits of silt and clay during
encroachment of the Champlain Sea.
The materials observed in the vicinity of the WM Ottawa Landfill are interpreted to be ice-
contact stratified drift sediments, consisting of a mixture of poorly to well-sorted, stratified
gravels and sands, interbedded with lenses of silty sand-gravel till. The deposits are interpreted
to have been submerged during the Champlain Sea encroachment, and therefore show
indications of re-working in a nearshore, subaqueous environment. Closer to Carp River, thick
deposits of silt, clay and organic materials (peat and muck) have been deposited in a lower
energy, offshore marine environment consistent with the deeper waters of the Champlain Sea.
Organic deposits are found on the southeastern portion of the quarry property, east of Carp
Road.
Page 16
Geology and Hydrogeology West Carleton Environmental Centre
13
The Regional Study Area is underlain by several carbonate rock-types. Throughout the majority
of the portion of the Regional Study Area that also encompasses the Site-Vicinity and On-Site,
bedrock consists of grey, fine to medium-grained fossiliferous limestone with some shaly or
sandy interbeds of the Bobcaygeon Formation, a member of the Middle Ordovician-aged
Ottawa Group. Within the Regional Study Area, the Bobcaygeon Formation is in contact with
interbedded silty dolostone, limestone, shale and sandstone of the underlying (older) Gull River
Formation and overlying (younger) Verulam Formation, which are classified as limestone with
shale interbeds. Both formations are also members of the Middle Ordovician-aged Ottawa
Group.
The bedrock surface generally slopes at less than 1 degree in a northeasterly direction under
the Regional Study Area.
The Paleozoic formations in the Ottawa area are transected by steeply dipping normal faults,
three of which are found within the Regional Study Area oriented from northwest to southeast.
Carp River follows the orientation of the Hazeldean Fault, which separates the Paleozoic
bedrock found within the Regional Study Area from the much older Precambrian rocks that
compose the Carp Ridge northeast of the study area. A second line of faults separates the
Bobcaygeon and Verulam Formations east of the Huntley Quarry. A third fault has been
mapped west of the existing landfill, separating the Gull River and the Bobcaygeon Formations.
5.3.3 Hydrogeology
Groundwater occurs within the unconsolidated overburden units and the Paleozoic bedrock
fracture systems found within the Regional Study Area. The general direction of regional
groundwater flow is northeast toward Carp River. Water table elevations range from
approximately 135 metres southwest of the existing landfill to between 92 and 105 metres along
Carp River.
Locally, groundwater recharge occurs along the sand and gravel ridge and upland areas
extending north and south of the existing landfill. Overall, the western portion of the Regional
Study Area is interpreted as having strong to weak downward gradients, indicating that these
areas are considered recharge zones. Closer to Carp River, groundwater discharge zones
occur, with upward hydraulic gradients becoming more pronounced in proximity to the river.
Groundwater quality within the Carp River watershed is generally acceptable for potable usage,
and is free from recognizable regional-scale groundwater impacts. Non-health related water
quality parameters, such as total dissolved solids, hardness, iron, sulphate and chloride
commonly exceeded the Ontario Drinking Water Standards, although the concentrations in the
groundwater tend to vary considerably with the type of bedrock formation. In general, the
Page 17
Geology and Hydrogeology West Carleton Environmental Centre
14
regional groundwater quality reflects the characteristics of the limestone bedrock, being
dominated by calcium carbonate (hardness) and also containing iron and sulphur compounds
(sulphate, hydrogen sulphide) from the shaley interbeds.
6. Geology and Hydrogeology Net Effects
As mentioned, the previously identified potential effects and recommended mitigation or
compensation measures associated with the Preferred Alternative Landfill Footprint were
reviewed to ensure their accuracy in the context of the preliminary design of the Preferred
Alternative Landfill Footprint. Based on the more detailed development of the landfill design
components (e.g., stormwater management), additional investigations were completed to further
assess the potential effects on the Geology and Hydrogeology environments. With this in mind,
the predicted potential effects, mitigation measures, and net effects are summarized in Table 1
and described in further detail in the sections below.
6.1 Potential Effects on Geology and Hydrogeology
The potential effects on Geology and Hydrogeology from the construction and operation of the
proposed landfill presented in the Facility Characteristics Report are described in this section.
The environmental criteria used to determine the potential effects are Groundwater Flow and
Groundwater Quality, as listed in the approved Terms of Reference.
The potential effects from the Preferred Alternative Landfill Footprint are evaluated in relation to
the future baseline conditions that are projected to occur from the existing closed landfill.
Computer modelling simulations were used to predict future conditions for groundwater flow and
quality in the On-Site and Site Vicinity areas. The simulations were run using chloride as an
indicator of contaminant movement, because of its conservative nature in dissolved phase
transport. Whether chloride is appropriate to be used as a monitoring indicator and compliance
trigger for the site will be determined during the detailed design phase of the landfill and the
development of an Environmental Monitoring Plan.
6.1.1 Future Baseline Conditions
The future baseline conditions are defined as the groundwater flow and quality characteristics
that are predicted to occur from the existing closed landfill and infrastructure, without the
development of a new landfill footprint.
Page 18
Geology and Hydrogeology West Carleton Environmental Centre
15
Table 1. Potential Effects, Proposed Mitigation and Compensation Measures, and Resulting Net Effects
ID Number
Potential Effect Mitigation/ Compensation Net Effect
Groundwater Flow
1 Local groundwater elevations may be lowered as a result
of a reduction in the amount of recharge to groundwater
below the new landfill footprint. The local and regional
groundwater flow directions are not expected to be
impacted.
None required. No impacts to off-site
groundwater flow.
2 Infiltration from the SWM Ponds may cause water levels to
rise in the vicinity of the ponds. Groundwater flow is
expected to be oriented radially away from the ponds,
which will affect the orientation of the local flow regime.
None required. No impacts to off-site
groundwater flow.
Groundwater Quality
3 Surface water that infiltrates to the groundwater table from
the SWM Ponds may contain elevated concentrations of
contaminants from surface runoff, traffic and landfill
operations. These contaminants may migrate with the
groundwater flow toward the downgradient property
boundary, which is situated approximately 200 metres to
the east of the ponds.
Effluent limits should be
established on the concentration
of indicator parameters that are
discharged to groundwater from
the SWM Ponds.
The effluent limits will restrict the
migration of contaminants so
that there are no impacts to off-
site groundwater quality above
acceptable standards.
4 Radial groundwater flow predicted to occur around the
SWM Ponds is expected to intercept the movement of
leachate-impacted groundwater from the existing unlined
landfill, which may have the effect of re-orienting leachate-
impacted groundwater further northward, extending
beyond the northern site boundary.
A series of purge wells may be
installed along the northern toe
of the existing landfill. The purge
wells should be designed to
control the migration of leachate-
impacted groundwater away
from the existing landfill footprint.
The proposed mitigation
measure is considered to
provide a reasonable method of
reducing the potential effects on
groundwater quality. No impacts
to off-site groundwater quality
are expected above acceptable
standards.
Page 19
Geology and Hydrogeology West Carleton Environmental Centre
16
6.1.1.1 Groundwater Flow
The future baseline conditions for groundwater flow are predicted to be consistent with the
observed conditions seen at the landfill. The full extent of the landfill footprint and site
infrastructure have been established, and the site conditions at the time of the groundwater flow
model development and calibration are not expected to change significantly in future. The
future baseline groundwater head contours for the Regional Study Area and the Site-Vicinity
Study Area are shown on Figures 3 and 4, respectively.
6.1.1.2 Groundwater Quality
The western two-thirds of the existing landfill footprint is unlined, and leachate generated from
the waste can come into contact with the underlying groundwater. The direction of groundwater
flow from this area is toward the northeast. As described in the Existing Conditions Report, the
concentrations of leachate indicator parameters immediately adjacent to the unlined landfill are
elevated above background and indicate migration of leachate away from the toe of the landfill.
It is expected that this movement of elevated concentrations of dissolved parameters will
continue in future, following the direction of groundwater flow.
The existing purge well system installed along Carp Road to the east of the existing landfill
footprint and the closed south cell will continue to be operated in the future. The system
provides containment of leachate-impacted groundwater east of the site. As long as the purge
wells are operating, groundwater impacts on the Contaminant Attenuation Zone (CAZ)
properties are expected to gradually decrease over time.
In order to predict the future orientation and extent of leachate-impacted groundwater from the
unlined landfill footprint, computer-based numerical modelling of groundwater flow and
dissolved phase transport was completed. The groundwater flow model was calibrated to the
observed water levels on the landfill site and to water levels reported in the MOE’s Water Well
Information System (WWIS). The groundwater flow model simulates the flow system in the
study area and is used as the basis for establishing the direction that leachate impacts are
expected to migrate away from the landfill. To simulate movement of the leachate-impacted
groundwater, source concentration profiles were estimated for the landfill footprint based on
observed leachate concentrations, and by fitting an exponential decay curve post-closure. The
source concentrations were input to the groundwater flow system model, and allowed to migrate
with the groundwater flow according to the principles of advective-diffusive contaminant
transport. As noted above in Section 6.1, chloride was used as a modelling parameter to
examine plume orientations and trends. This is because of its conservative nature and elevated
source concentrations.
Page 20
Geology and Hydrogeology West Carleton Environmental Centre
17
Figure 3. Modelled Groundwater Heads in the Regional Area, Future Baseline
Conditions
Page 21
Geology and Hydrogeology West Carleton Environmental Centre
18
Figure 4. Modelled Groundwater Head Contours in the Site-Vicinity, Future
Baseline Conditions
Page 22
Geology and Hydrogeology West Carleton Environmental Centre
19
The results from the future baseline transport modelling indicate that leachate-impacted
groundwater is expected to continue to migrate away from the unlined landfill footprint.
Figure 5 illustrates the simulated progression of impacted groundwater. The figure shows the
approximate orientation and extent of chloride concentrations that are predicted to exceed
130 mg/L (the Reasonable Use Limit for an aquifer with a background chloride concentration of
10 mg/L). It is seen that the impacted groundwater is predicted to eventually extend beyond the
current boundaries of the CAZ properties. This is because the orientation of groundwater flow
takes the dissolved constituents north of the existing purge well system, beyond its zone of
influence. Measures to control and abate the predicted extent of leachate impacts from the
existing unlined landfill are expected to be required.
It should be noted that the computer modelling simulations are not considered sufficiently
accurate to predict actual groundwater concentrations at specific locations and/or times.
Instead, the simulations are used to provide a reasonable projection of future contaminant
orientations and trends. Field observations (groundwater elevations and concentration trends)
will be necessary to measure actual leachate impacts at specific monitoring well locations.
6.1.2 Potential Effects from the Preferred Alternative Landfill Footprint
The potential effects from the development of a new landfill footprint and stormwater
management ponds are described in this section. The design assumptions and preliminary
design of the new landfill and stormwater management system are found in the Facility
Characteristics Report.
6.1.2.1 Groundwater Flow
The new landfill footprint will include the development of a double-composite leachate collection
and containment system. This will have the effect of reducing the amount of recharge to the
groundwater within the confines of the landfill footprint. The result is predicted to be a general
decrease in the groundwater heads immediately below the landfill. The predicted change in
groundwater elevations ranges from approximately 0.49 to 0.62 metres, measured at full landfill
development within the footprint. Around the perimeter of the landfill, the groundwater
elevations are predicted to decrease between approximately 0.05 and 0.45 metres. However,
because the effect of the landfill at reducing the amount of recharge is localized, further from the
edges of the landfill the impacts are predicted to be much less noticeable. At the downgradient
property boundaries, the decrease in groundwater elevation is predicted to be equal to or less
than 0.21 metres. This is much less than the normal seasonal variations in the water table, and
is not expected to have negative effects on off-site water supplies.
Page 23
Geology and Hydrogeology West Carleton Environmental Centre
20
Figure 5. Predicted Chloride Concentrations under Future Baseline Conditions
Page 24
Geology and Hydrogeology West Carleton Environmental Centre
21
The orientations of the local and regional groundwater flow are also not expected to be
impacted by the small change in groundwater elevations as a result of the reduced recharge
under the landfill.
A more significant effect on the groundwater flow direction within the On-Site and Site-Vicinity
Study Areas is predicted to occur from the operation of the stormwater management ponds for
the Preferred Alternative Landfill Footprint. As described in the FCR, the three ponds are
designed with two stages, a lined stage for settlement and containment, and an unlined stage to
permit discharge via groundwater infiltration. Each of the stages is designed to hold the runoff
volume from a 1:100 year precipitation event. The estimated amount of infiltration that would
occur from each unlined pond stage on an average annual basis is provided in Table 2.
Table 2. Infiltration Estimates from Unlined Stormwater Management Pond Stages
Pond Volume of Runoff
(m3/yr)
Area of Base of
Unlined Stage (m2)
Annual Infiltration Rate
(mm/yr)
New Landfill-North Pond 76,048 6,000 12,675
Access Road-SW Pond 21,903 1,200 18,253
Existing Landfill-SE Pond 39,232 3,580 10,958
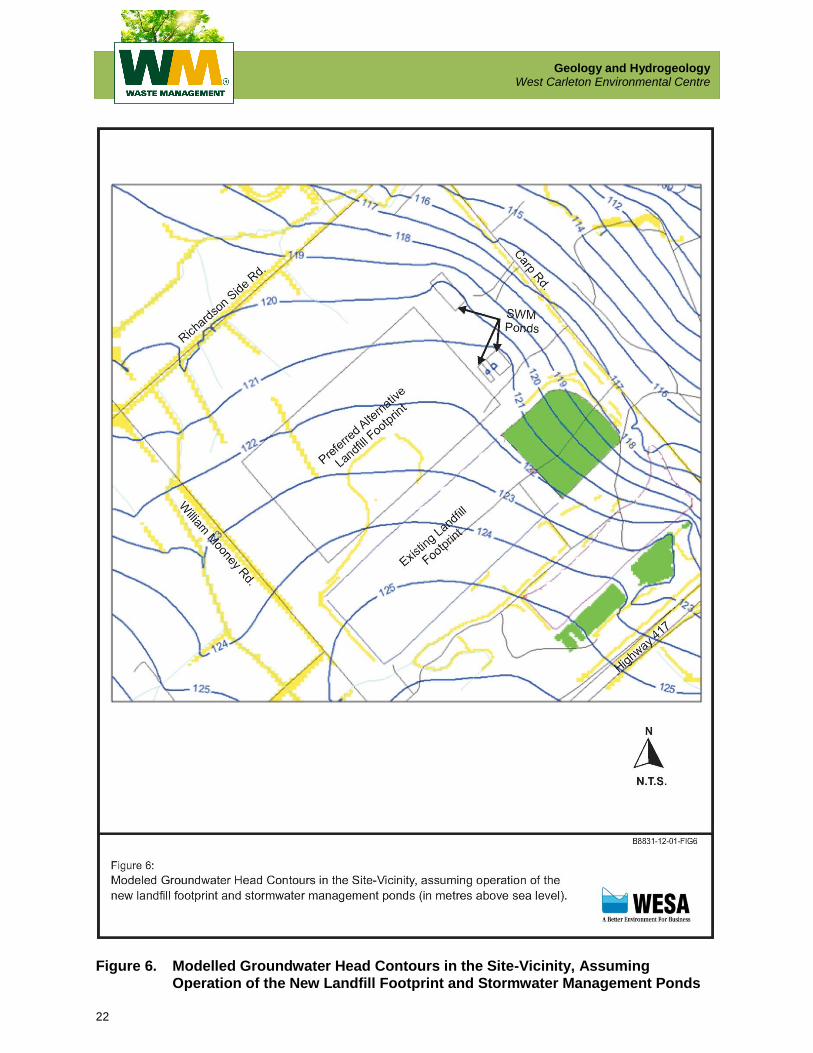
This amount of infiltration is predicted to cause the groundwater levels to rise on the order of
1.26 to 3.23 metres immediately under the unlined pond stages. The predicted groundwater
head contours in the Site-Vicinity Study Area from the development of the new landfill and the
stormwater management ponds are shown on Figure 6.
The effects of this groundwater mounding diminish with increased distance from the ponds;
however, the localized groundwater flow orientations are predicted to be affected, in that radial
flow away from the ponds can be expected. Downgradient from Carp Road and north of the
north property boundary, the groundwater elevations are not projected to change significantly,
and the regional groundwater flow patterns are not expected to be altered. The impacts of this
localized effect on groundwater flow are seen in the future projections of groundwater quality, as
described in the next section.
Page 25
Geology and Hydrogeology West Carleton Environmental Centre
22
Figure 6. Modelled Groundwater Head Contours in the Site-Vicinity, Assuming
Operation of the New Landfill Footprint and Stormwater Management Ponds
Page 26
Geology and Hydrogeology West Carleton Environmental Centre
23
In summary, the potential effects on Groundwater Flow from the Preferred Alternative Landfill
Footprint (including the stormwater management ponds) are as follows:
1. Recharge to the groundwater is expected to be reduced within the area of the
new landfill footprint. This will have the effect of lowering the groundwater
elevations immediately below the landfill, but is predicted to have minimal
effects away from the footprint. The local and regional groundwater flow
directions are not expected to be impacted.
2. Infiltration from the stormwater management ponds is predicted to cause the
groundwater levels to rise under the unlined pond stages. The effects of this
groundwater mounding diminish with increased distance from the ponds. The
groundwater flow will be radially away from the ponds, which is predicted to
affect the orientation of the local flow regime and influence groundwater
quality in the vicinity.
6.1.2.2 Groundwater Quality
The future baseline conditions of groundwater quality impacts from the existing unlined landfill
are described in Section 6.1.1.2. The proposed development of the new landfill footprint and
the stormwater management ponds is expected to have the following potential effects on the
future baseline conditions for Groundwater Quality:
1. Surface water that infiltrates to the groundwater table from the stormwater
management ponds may contain elevated concentrations of contaminants
from surface runoff, traffic and landfill operations. These contaminants may
migrate with the groundwater flow toward the downgradient property
boundary, which is situated approximately 200 metres to the east of the
ponds.
2. Radial groundwater flow predicted to occur around the stormwater
management ponds (refer to Section 6.1.2.1) is expected to intercept the
movement of leachate-impacted groundwater from the existing unlined
landfill. This is expected to have the effect of re-orienting leachate-impacted
groundwater further northward across the Northern Envelope and extending
beyond the northern property boundary. A southern arm of leachate-
impacted groundwater is expected to migrate eastward onto the existing
CAZ; however, because of the reduced mass of contaminants being
transported in this direction, the impacts may not extend as far east as the
future baseline scenarios, and may potentially remain within the CAZ
boundaries.
Page 27
Geology and Hydrogeology West Carleton Environmental Centre
24
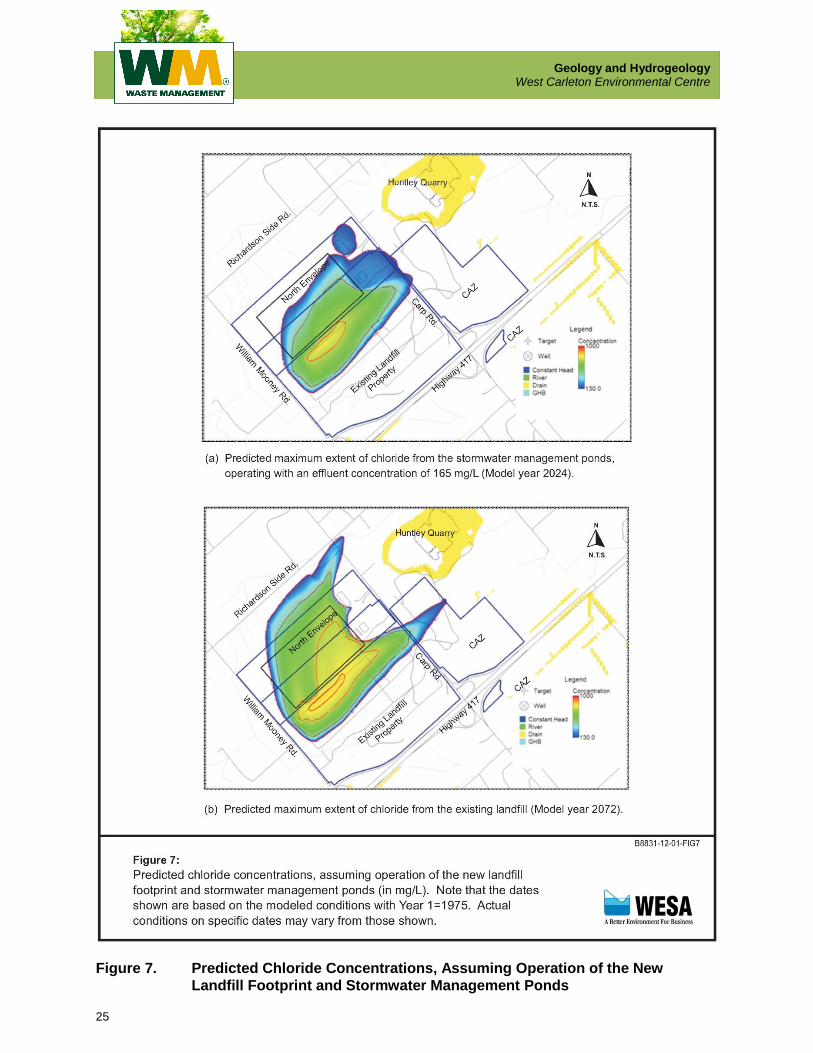
The potential effects from the stormwater management ponds and from the migration of
leachate-impacted groundwater from the existing unlined landfill are shown on Figure 7.
Figure 7(a) shows the maximum predicted extent of chloride concentrations greater than
130 mg/L from the stormwater management ponds. Note that the maximum source
concentration of chloride infiltrating from the ponds that was used in the modelling simulations
was set at 165 mg/L during landfill operations. This effluent concentration limit restricts the
mass of contaminant that is available for transport, as will be discussed further in Section 6.2,
Mitigation Measures. Once the landfill site is closed, final cover will be applied and operations
traffic reduced. In the simulations, the projected source concentration was linearly reduced to
0 mg/L over five years of post-closure.
Figure 7(b) shows the predicted maximum extent of leachate-impacted groundwater from the
existing unlined landfill, as influenced by the new landfill footprint and stormwater management
ponds. From the results of the simulations, it is apparent that the leachate-impacted
groundwater would be transported further northward than the future baseline scenarios. With
no mitigation measures in place, it is predicted that the potential effects to groundwater quality
would extend off-site to the north.
The predicted contaminant flux through the double-composite liner of the new landfill footprint is
described in the Facility Characteristics Report. The chloride concentrations predicted to
discharge through the base of the attenuation layer of the new landfill were used as source
concentration inputs to the groundwater model. Since the mass flux of contaminant through the
double-composite liner is very small (transport through the low permeability liner components is
dominated by diffusion rather than by advection), the changes in chloride concentrations in the
groundwater at the base of the attenuation layer are negligible. This is consistent with the
regulatory definition of the Generic Design Option II (G2) liner system, which is designed to
provide protection to groundwater quality without reliance on attenuation in the landfill buffer
area.
6.2 Mitigation Measures
Mitigation measures will be required to reduce the potential effects of the Preferred Alternative
Landfill Footprint on Groundwater Quality to acceptable levels. The proposed mitigation
measures are design-based and operational in nature, related to the movement of leachate-
impacted groundwater from the existing landfill and effluent from the stormwater management
ponds, respectively.
Page 28
Geology and Hydrogeology West Carleton Environmental Centre
25
Figure 7. Predicted Chloride Concentrations, Assuming Operation of the New
Landfill Footprint and Stormwater Management Ponds
Page 29
Geology and Hydrogeology West Carleton Environmental Centre
26
Within the context of the Environmental Assessment, the proposed mitigation measures have
been developed to a conceptual design level, using computer-based numerical modelling
simulations. This is considered reasonable and sufficient in order to evaluate general trends in
flow orientation and contaminant concentrations, and to assess the conceptual feasibility of the
proposed measures. A detailed design of the mitigation measures, including additional
modelling simulations and field testing, would need to be completed at such time as actual
contaminant transport dictates.
6.2.1 Purge Wells
The potential effects of the Preferred Alternative Landfill Footprint and associated operations
relative to the future baseline conditions are that contaminant concentrations from leachate-
impacted groundwater exceeding acceptable levels (as defined by the Reasonable Use Limits
and as modelled using chloride as an indicator parameter) are predicted to extend beyond the
northern boundary of the site. The source of the leachate-impacted groundwater is the existing
unlined (closed) landfill footprint.
Purge wells are an effective method for controlling leachate migration from landfills in
permeable geologic environments. The existing purge wells on the site control the eastward
movement of impacted groundwater. A proposed mitigation measure to reduce the potential
effects of the Preferred Alternative Landfill Footprint is to install a series of purge wells along the
northern toe of the existing landfill, between the landfill and the new footprint. The existing
geologic conditions in the area consist of sand to sand-gravel overburden, underlain by
fractured limestone bedrock of the Bobcaygeon Formation. The average hydraulic conductivity
in the overburden-shallow bedrock zone is on the order of 1.5x10⁻⁴ m/s, which is considered a
permeable formation with favourable conditions for hydraulic capture via purge wells. The
purge wells would target the saturated overburden and the upper six to eight metres of fractured
limestone as the primary pathway for leachate migration.
The concept of purge wells installed as a mitigation measure was simulated using the numerical
model of groundwater flow and contaminant transport. The results of the modelling simulations
indicate that sufficient capture could be achieved by installing nine purge wells spaced evenly
along the toe of the existing landfill, completed in the overburden-shallow bedrock zone. The
predicted maximum extent of leachate-impacted groundwater with chloride concentrations
greater than 130 mg/L with the operation of the new purge wells is shown in Figure 8. Each
purge well was simulated to pump 45 m3/day (31.3 L/min), which is considered to be a
reasonable pumping rate for this type of aquifer, and is less than the average pumping rate for
the existing purge wells.
Page 30
Geology and Hydrogeology West Carleton Environmental Centre
27
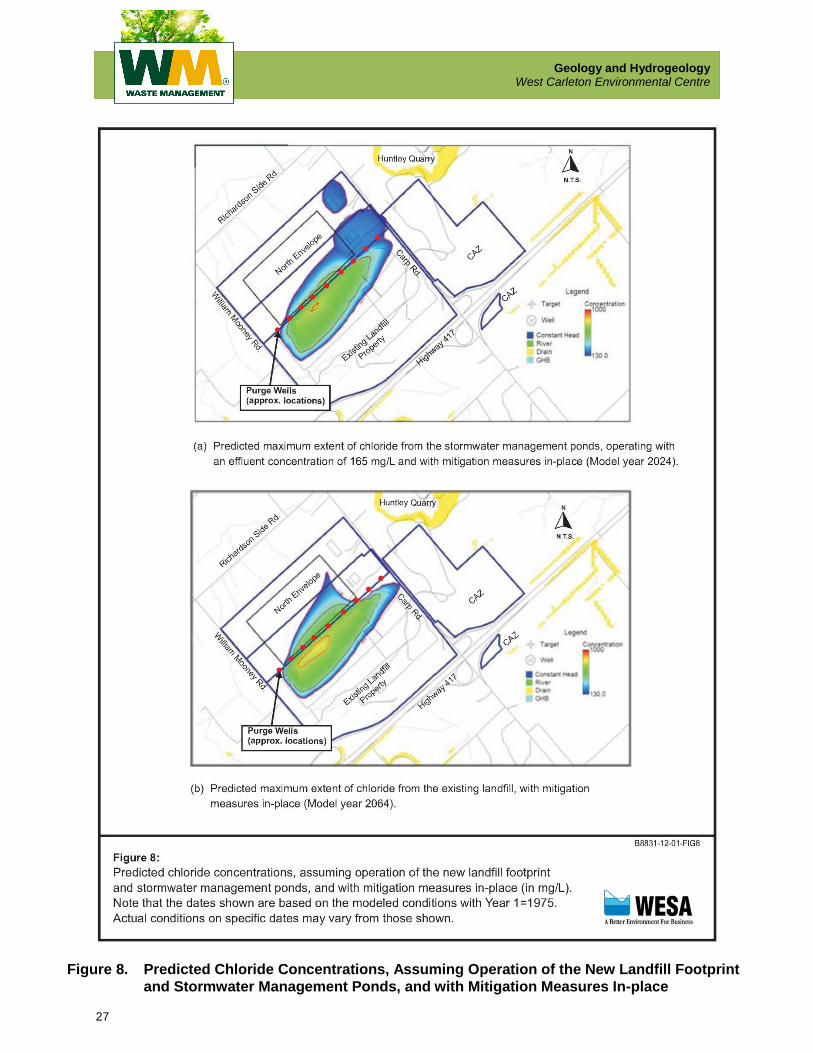
Figure 8. Predicted Chloride Concentrations, Assuming Operation of the New Landfill Footprint
and Stormwater Management Ponds, and with Mitigation Measures In-place
Page 31
Geology and Hydrogeology West Carleton Environmental Centre
28
Under this modelling scenario, the predicted distribution of leachate-impacted groundwater
exceeding Reasonable Use Limits would not extend beyond the property boundaries of the
Preferred Alternative Landfill Footprint. In addition, although there would be drawdown of
groundwater levels in the vicinity of the purge wells and changes to the localized groundwater
flow directions, it is not expected that there would be any impacts to groundwater levels or flow
directions beyond the property boundaries.
The actual number and spacing of purge wells required and the design pumping rates will be
determined during the detailed design of the mitigation measures, when required. However, for
conceptual design purposes, the proposed mitigation measure is considered to provide a
reasonable method of reducing the potential effects on groundwater quality to acceptable levels.
6.2.2 Operational Controls on Stormwater Management Pond Effluent
As described in Section 6.1.2.2, the stormwater management ponds have the potential effect of
allowing elevated concentrations of contaminants to infiltrate to the groundwater table. The
ponds are designed with two stages: surface runoff first flows into a lined stage and then
overflows to an unlined stage. Effluent in the lined stage can be contained in case of a spill of
other emergency (refer to the Facility Characteristics Report).
The stormwater management ponds are located relatively close to the downgradient property
boundary and beyond the zones of influence of the existing purge well system and the proposed
northern purge wells described in the previous section. Because of the pond locations and the
types of underlying geologic formations, once in the groundwater there is limited attenuation
capacity available to further reduce the effluent concentrations. Therefore, the potential effects
on groundwater quality from the operation of the stormwater management ponds should be
controlled by establishing limits on the concentration of effluent in the unlined pond stages.
These operational effluent limits would restrict the concentrations of dissolved constituents
entering the groundwater system such that groundwater quality at the property boundaries
would continue to meet acceptable levels.
Several predictive analyses of groundwater quality were completed using maximum effluent
concentrations from the ponds ranging from 50 to 300 mg/L. The results of the simulations
indicate that a chloride concentration of approximately 165 mg/L would reduce the potential
effects from the ponds to acceptable levels. Figure 8 shows the predicted maximum extent of
impacted groundwater with chloride concentrations greater than 130 mg/L, using a maximum
effluent concentration of 165 mg/L from the stormwater management ponds. The impacted
groundwater in this scenario (i.e., groundwater with chloride concentrations greater than
130 mg/L) does not extend beyond the property boundaries.
Page 32
Geology and Hydrogeology West Carleton Environmental Centre
29
Based on this conceptual assessment, the proposed mitigation measure for the potential effects
from the stormwater management ponds is to establish concentration limits on the effluent
infiltrating to the groundwater from the unlined pond stages. Further evaluation to confirm the
final recommended chloride effluent concentration and to determine whether other parameter
limits should be established will be completed during the detailed design phase for the landfill.
6.3 Net Effects
The mitigation measures described in Section 6.2 are intended to reduce the potential effects
from the Preferred Alternative Landfill Footprint to acceptable levels.
For the Groundwater Flow criterion used to assess the impacts of the proposed undertaking on
Geology and Hydrogeology, the potential effects described in Section 6.1.2.1 are acceptable
and do not require further mitigation or compensation.
For the Groundwater Quality criterion, mitigation measures have been applied to the potential
effects described in Section 6.1.2.2. With the implementation of mitigation measures, the
resultant net effects are considered acceptable. A summary of the potential effects, mitigation
measures and net effects for each criterion are summarized in Table 1.
7. Impact Analysis of Other WCEC Facilities
As part of the approved Terms of Reference (ToR), WM committed to undertaking an
assessment of the cumulative effects of the landfill and other WCEC components/facilities and
other non-WCEC activities that are existing, planned and approved or reasonably foreseeable.
The additional facilities considered in this assessment of cumulative effects are as follows:
Material recycling facility (MRF);
Construction and demolition (C&D) material recycling facility;
Organics processing facility (restricted to leaf and yard material);
Community lands for parks and recreation;
Residential diversion facility;
Greenhouses; and
Landfill gas-to-energy facility.
The MRF, C&D and organics processing facilities will be situated in the southwest corner of the
existing landfill property in an area currently used for equipment maintenance and storage. The
Page 33
Geology and Hydrogeology West Carleton Environmental Centre
30
area is already developed with a maintenance garage, gravelled equipment and employee
parking areas, and paved and gravelled access roads. A description of the proposed facilities
and processes is presented in the Ottawa Transfer and Processing Facility Design & Operations
Report (prepared by AECOM, dated June 2011).
Minor changes are expected to occur in the land use at the facility, such as the construction of
outdoor concrete slabs for tipping and sorting areas, and changes to the parking areas and
roadways. There are predicted to be minor changes in the quantity of runoff; however, the
runoff in contact with waste or processed materials will be contained and removed or directed to
an existing lined storage pond. Drainage from the concrete pads and gravelled areas will be
collected and pumped to the lined storage pond. Drainage from the MRF tipping area will be
collected with residue or commercial sorbent and disposed in the landfill.
From this assessment, it is concluded that no measurable effects will occur to the groundwater
flow or quality from the proposed MRF, C&D and organics processing facilities, and no
cumulative effects are expected on the geology and hydrogeology.
The community lands for parks and recreation will include predominantly passive areas, such as
trail systems and open spaces, located in the buffer lands around the perimeter of the WCEC
facilities. No negative net effects are expected from the community lands on the geology and
hydrogeology. Similarly, no cumulative effects are anticipated from the construction and
operation of the residential diversion facility, which will be located east of the new stormwater
management ponds.
The greenhouse facility, which will include approximately 2.0 hectares of greenhouses, indoor
storage, processing and offices, are to be located south of the existing landfill footprint. The
water supply for the greenhouses is not specified as yet; however, it is expected to be sourced
from the existing ponds (SWMF #2 or Depression #1 south of the Closed South Cell; refer to
Figure FCR-02 of the Facility Characteristics Report) or from a new water supply well. Because
of the large separation distance from the potential greenhouse water supplies to the new landfill
footprint (greater than 500 metres), it is expected that there will be no cumulative effect on
groundwater flow or quality.
The landfill gas-to-energy facility is situated in the southeast corner of the existing landfill
property. The facility is already constructed and operational, and has no effect on the geology
and hydrogeology on or around the site. There are not expected to be any cumulative effects
on the geology and hydrogeology from the continued operations of the landfill gas-to-energy
facility.
Page 34
Geology and Hydrogeology West Carleton Environmental Centre
31
8. Monitoring and Commitments for the Undertaking
To ensure that the mitigation measures identified in Section 6 are implemented as envisioned,
a strategy and schedule was developed for monitoring environmental effects. With these
mitigation measures and monitoring requirements in mind, commitments have also been
proposed for ensuring that they are carried out as part of the construction, operation, and
maintenance of the landfill.
8.1 Monitoring Strategy and Schedule
As mentioned, a monitoring strategy and schedule was developed based on the Geology and
Hydrogeology Impact Assessment carried out for the Preferred Alternative Landfill Footprint to
ensure that (1) predicted net negative effects are not exceeded, and (2) unexpected negative
effects are addressed.
8.1.1 Environmental Effects Monitoring
The predicted net effects from the design and operation of the Preferred Alternative Landfill
Footprint, including the proposed stormwater management facility, are that any negative
impacts to groundwater flow and groundwater quality will remain within the site boundaries.
Monitoring of groundwater levels and groundwater quality will be required to ensure that the
predicted net effects are as expected. Refer to Table 3 for a list of proposed monitoring
requirements for each potential effect identified in the Geology and Hydrogeology Impact
Assessment.
Groundwater flow on-site and within the site-vicinity (ID Numbers 1 and 2 in Table 3) will be
monitored by measuring water levels in monitoring wells and the stormwater management
ponds at a prescribed frequency. The water levels will be measured in selected monitoring
wells completed in the overburden-shallow bedrock zone and the deeper bedrock. The water
level measurements will be converted to groundwater elevations and will be plotted on a site
map to interpret the groundwater flow orientations, hydraulic gradients and average flow
velocities. Monitoring wells situated around the stormwater management ponds will be used to
observe flow conditions around the ponds, specifically whether localized radial flow occurs as
expected.
Page 35
Geology and Hydrogeology West Carleton Environmental Centre
32
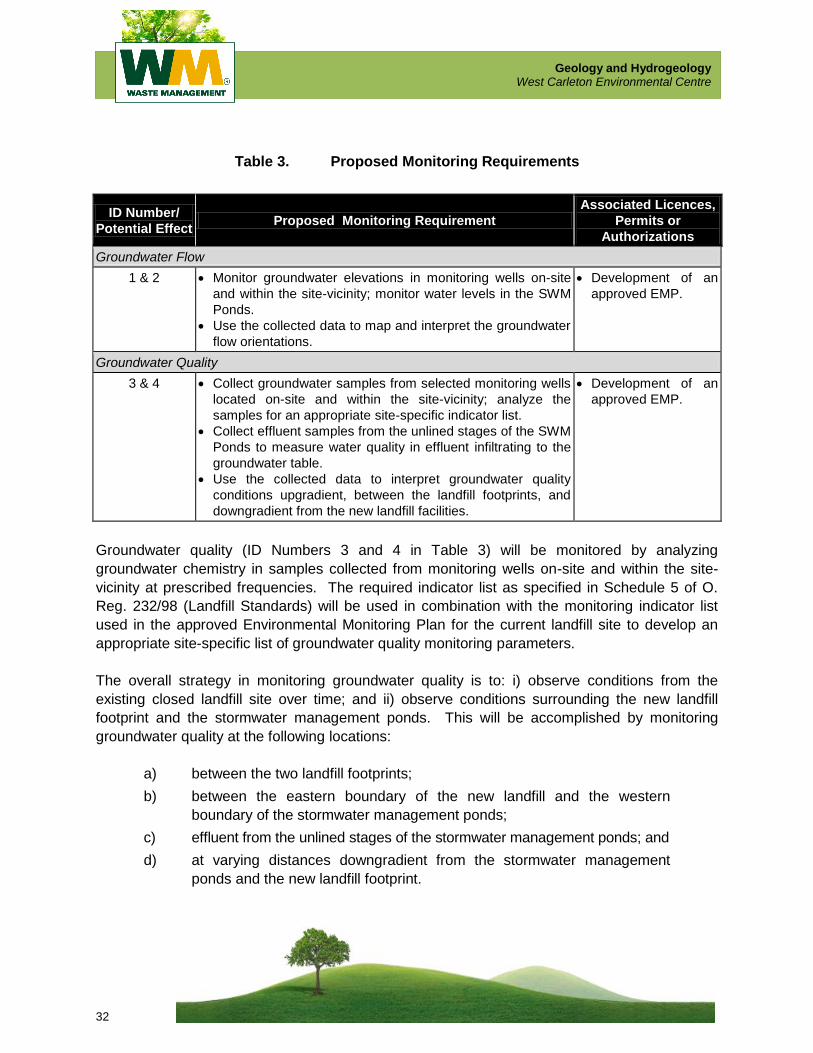
Table 3. Proposed Monitoring Requirements
ID Number/
Potential Effect Proposed Monitoring Requirement
Associated Licences,
Permits or
Authorizations
Groundwater Flow
1 & 2 Monitor groundwater elevations in monitoring wells on-site
and within the site-vicinity; monitor water levels in the SWM
Ponds.
Use the collected data to map and interpret the groundwater
flow orientations.
Development of an
approved EMP.
Groundwater Quality
3 & 4 Collect groundwater samples from selected monitoring wells
located on-site and within the site-vicinity; analyze the
samples for an appropriate site-specific indicator list.
Collect effluent samples from the unlined stages of the SWM
Ponds to measure water quality in effluent infiltrating to the
groundwater table.
Use the collected data to interpret groundwater quality
conditions upgradient, between the landfill footprints, and
downgradient from the new landfill facilities.
Development of an
approved EMP.
Groundwater quality (ID Numbers 3 and 4 in Table 3) will be monitored by analyzing
groundwater chemistry in samples collected from monitoring wells on-site and within the site-
vicinity at prescribed frequencies. The required indicator list as specified in Schedule 5 of O.
Reg. 232/98 (Landfill Standards) will be used in combination with the monitoring indicator list
used in the approved Environmental Monitoring Plan for the current landfill site to develop an
appropriate site-specific list of groundwater quality monitoring parameters.
The overall strategy in monitoring groundwater quality is to: i) observe conditions from the
existing closed landfill site over time; and ii) observe conditions surrounding the new landfill
footprint and the stormwater management ponds. This will be accomplished by monitoring
groundwater quality at the following locations:
a) between the two landfill footprints;
b) between the eastern boundary of the new landfill and the western
boundary of the stormwater management ponds;
c) effluent from the unlined stages of the stormwater management ponds; and
d) at varying distances downgradient from the stormwater management
ponds and the new landfill footprint.
Page 36
Geology and Hydrogeology West Carleton Environmental Centre
33
Monitoring wells will also be located at varying distances from the northern edge of the new landfill
footprint, and on the upgradient sides of the new landfill footprint. Selected monitoring wells on
the existing landfill site currently used for groundwater quality monitoring will continue to be used.
Water samples from the primary and secondary leachate collection systems of the new landfill
will be collected and analyzed for the same suite of parameters as the groundwater samples.
This will allow for comparison of water quality between the new landfill, the existing closed
landfill and groundwater in the vicinity of the two footprints. This information will be used to
verify the source of any observed impacts to groundwater quality.
Details of the groundwater monitoring program, including specific sampling locations,
physical/chemical parameters, and sampling frequencies, as well as trigger/compliance
locations and parameter concentrations, will be developed as part of the Environmental
Management Plan (EMP) for the proposed undertaking.
Groundwater monitoring results will be submitted to MOE for review in an annual report for the
WCEC landfill facility.
8.1.2 Development of an Environmental Management Plan
An Environmental Management Plan (EMP) will be prepared following approval of the
undertaking by the Minister of the Environment and prior to construction. The EMP will include a
description of the proposed mitigation measures, commitments, and monitoring.
8.2 Commitments
The following commitments have been proposed for ensuring that the identified mitigation or
compensation measures and monitoring requirements are carried out as part of the
construction, operation, and maintenance of the undertaking:
a) An EMP for groundwater flow and quality monitoring will be developed as
part of the application for approval under the Environmental Protection
Act for the new WCEC landfill facility;
b) An implementation plan will be prepared for the design and construction
of a purge well system (or other approved mitigation measure) in order to
control leachate migration from the existing closed landfill site. The
implementation plan will be prepared and submitted to MOE concurrent
with the application for approval under the Environmental Protection Act
for the new WCEC landfill facility; and
Page 37
Geology and Hydrogeology West Carleton Environmental Centre
34
c) The existing purge well system on the closed landfill site will continue to
be operated, maintained and monitored to ensure that groundwater
quality impacts from former operations remain within the boundaries of
the CAZs. The purge well system will continue to be operated until such
time as it can be demonstrated that the system is no longer required in
order to maintain groundwater impacts within the CAZs.
9. Hydrogeology Approvals Required for the Undertaking
The following approvals are required for hydrogeology-related components for the proposed
undertaking:
a) Approval of an EMP: will be developed as part of an application for
approval under Section 27 of the Environmental Protection Act for the
new WCEC landfill facility, and would be implemented through the terms
and conditions of an Environmental Compliance Approval (ECA).
b) Permit to Take Water (Section 34 of the Ontario Water Resources Act):
An amendment to the existing Permit to Take Water (PTTW) for the
current landfill site will be required in order to install and operate the new
purge well system. The new wells would be specified as additional
sources on the existing PTTW.
c) Industrial Sewage Works (Section 53 of the Ontario Water Resources
Act): The discharge of effluent to the groundwater from the proposed
stormwater management ponds will require approval under the Ontario
Water Resources Act. The operations and monitoring requirements for
the ponds would be specified in the terms and conditions of an ECA for
the sewage works.
Report Prepared By:
David Harding, M.Sc. P.Eng.
Senior Consulting Engineer
Page 38
Geology and Hydrogeology West Carleton Environmental Centre
35
10. References
AECOM, 2011:
Ottawa Transfer and Processing Facility, Design & Operations Report. Prepared for
Waste Management of Canada Corporation, dated June 2011.
AECOM, 2011:
Draft Facility Characteristics Report, West Carleton Environmental Centre, Landfill
Footprint Expansion. Prepared for Waste Management of Canada Corporation, dated
June 2011.
WESA Inc., 2011:
Existing Geology and Hydrogeology Conditions, West Carleton Environmental Centre,
Ottawa, Ontario. Prepared for Waste Management of Canada Corporation, dated
September 2011.
Page 39
Appendix A Groundwater Flow and Transport Modeling
Page 40
INTRODUCTION
The finite-difference model ‘MODFLOW-SURFACT ‘, based on the code, “MODFLOW”, which
was developed by the United States Geological Survey (USGS), was selected to simulate
groundwater flow and mass transport. MODFLOW-SURFACT was selected because of its
computational speed, stability and performance. This model is capable of simulating three-
dimensional groundwater flow and mass transport in both steady and transient states with
various degrees of complexity. Earthfx-ViewLog and Goldensoftware-Surfer were also used in
conjunction with Groundwater Vistas (GV) as the pre and post processing tools. In development
of the numerical model, multiple data sets were utilized across multiple iterations to combine the
conceptual and numerical models. Some of the data used during the model’s development are
included below:
Referenced regional data:
• Regional topography from the Ontario Ministry of Natural Resources (OMNR);
• Ontario Base Map layers (including streams, lakes, wetlands, drainage lines, bedrock and
surficial geology, etc.);
• Domestic well records from the Ontario provincial database, in particular lithologic
information, water levels, and specific capacities contained therein;
• Hydrograph data available from the HYDAT monitoring network in the area; and
• Land use information derived from Landsat satellite imagery.
Site-specific data:
• Local survey data (including waste mound topography);
• Physical data, including hydraulic properties of overburden deposits and bedrock;
• Historical hydrograph data, water levels, and water quality data for leachate and
groundwater;
• Borehole log data; and
• Purge well system data from within the Waste Management (WM) Ottawa landfill site
(PW1 through PW10 and PW20)
MODEL BOUNDARY CONDITIONS
Model boundary conditions and site-specific influential aspects which represent the conceptual
understanding of the geological and physical hydrogeological conditions of this site are provided
below:
The extent of the model domain was set to natural hydrogeologic boundaries (Figure
1): Carp River in the northeast and Carp River watershed/subwatershed boundaries
were used to define other lateral model limits. Model extents were defined from a
combination of topography (DEM), (Figure 2) and refined interpolated water level
(WL) information from the MOE Water Well Information System (WWIS) (Figure 3):
• Constant heads were assigned along the Carp River in Layers 1 through 4 ;
Page 41
• General Head Boundaries were used to represent inferred regional groundwater flow
into and out of the model domain, and were assigned along the up-gradient
boundary in the southwest in Layers 3 through 5 and to the down-gradient boundary,
the Carp River in Layer 5 and;
• All other sides were specified as No-Flow Boundaries (regional groundwater divides).
Further boundary conditions were assigned according to the following rules for surface water and
adjusted based on local settings:
• Streams and creeks represented based on Strahler class as Rivers (classes 3 and 4) or
Drains (classes 1 and 2), Figure 4;
• Lined portion of the current landfill is represented as a River (allows control of
conductance (very low) and stage (leachate head));
• Huntley Quarry: drains with low conductance; and
• Aggregate washwater ponds on quarry property northeast of the landfill represented
as Rivers using surveyed water levels (the stage in these ponds is artificially maintained
at a relatively constant elevation).
MODEL DISCRETIZATION
The total area of the active model domain is approximately 100 km2. The model grid ranges
from 100 m x 100 m at the periphery to 6.25 m x 6.25 m at the landfill site (Figure 5). Any cells
outside of the model boundary were defined as no-flow. The horizontal discretization reflects
the density and resolution of the data available (site data and MOE Water Well Records).
The vertical discretization is divided into 5 layers, as shown in Table 1. This layer configuration is
based on the site conceptual model which includes geological and physical hydrogeological
information.
MODEL CALIBRATION
Model calibration was completed by iteratively adjusting the modeling input parameters of: 1)
Hydraulic conductivity of model layers, 2) Reliability factor (RF) of groundwater head levels at
site wells (highly reliable) and MOE water wells (low reliability), and 3) Water levels in Carp
River.
In order to evaluate adjustments to these parameters the differences between observed and
modeled water levels were evaluated. These differences, known as residuals, are aggregated into
calibration checks called the Root Mean Squared Error (RMSE) and Normalized Root Mean
Page 42
Squared Error (NRMSE) (Equation 1 and Equation 2). The and represent the observed and
evaluated values, respectively and and represent the observed maximum and observed
minimum, respectively and the represents the number of target values utilized.
Equation 1 √∑( )
Equation 2
√∑( )
The finalized model had a RMSE and NRMSE of 5.9 m and 7.9%, respectfully, which is
acceptable as the NRMSE is less than 10%. Further evaluation of these error calculations reveals
that if the residuals were adjusted by the RF, the RMSE and NRMSE reduces to 2.0 m and 2.8 %,
respectfully. The scatter plot, Figure 6, presents the observed versus simulated groundwater
levels, whereby the 45 degree line indicates a perfect fit. The wells indicated on this figure are
segregated into four groups, MOE wells (RF=0.1), site wells (RF=1), site wells partially below
model domain (RF=1), and non-pumping purge wells (RF=1). In conjunction with these
calibration checks, mass balance checks of inputs and outputs (water entering and leaving the
modeling domain) and comparisons to previously developed groundwater contours of the
region were conducted to ensure model convergence is achieved within acceptable accuracy.
The mass balance of the final calibration was calculated to be 0.5%, as shown in Table 2. The
calibrated hydraulic parameters for all active zones are provided in Table 3.
GROUNDWATER FLOW MODELING RESULTS
Baseline Model (Existing Conditions)
The calibrated model simulating the groundwater contours in and around the current landfill site
is shown in Figure 7. This figure indicates that general groundwater flow direction within the
property limits of the WM landfill site is in a general north to northeast direction with a range of
head values from 126 to 116 metres above sea level (mASL).
New Landfill Footprint Model
The incorporation of the new landfill design into the model was accomplished by applying
recharge rates across determined hydrogeologically influential zones of the new design. These
zones include the new landfill footprint and three stormwater pond footprints that are designed
to discharge only to the groundwater. These footprints are plotted to the north of the current
landfill as seen in Figure 8. The recharge rates of the new landfill change over time (termed
transient) while the rates applied to the stormwater ponds are steady and are listed in Table 4.
Figure 8 indicates that mounding of the groundwater table is being simulated in the vicinity of
Page 43
the new landfill and stormwater ponds. This mounding ranges from 1.26 to 3.23 across the three
stormwater ponds, as provided in Table 5.
TRANSPORT MODELING RESULTS
Initial Transport Model Set-up and Calibration
The initial set-up for the purpose of calibrating the transport model to the observed conditions
simulated mass entering the domain at the closed south cell and the existing landfill between the
years 1975 and 2030. The simulation period was subdivided into a pre-current landfill period
when only the closed south cell was contributing mass (1975-1999), and a landfilling/post-landfill
period when both areas were contributing (1999-2030). The calibration model construction
assumptions are described in Table 6. Mass was introduced as a concentration with the recharge
rates applied at the landfill footprints.
The transport simulations were calibrated using potassium as the selected leachate indicator.
Potassium was used because it is elevated in the leachate, it is found at relatively low
concentrations in background groundwater, and there are no other significant sources in the
study area. Chloride, which is often used as a parameter in groundwater modeling studies, was
not used to calibrate the transport model in this case because of interferences from road salt
contamination which would affect the results in the southern area of the landfill site. However,
in areas away from the major arterial roads, such as the North Envelope, chloride is an
appropriate parameter to use for modeling solute transport and to examine various development
scenarios (e.g., future baseline, potential effects, net effects) since it has a Reasonable Use Limit
(potassium does not) and is elevated in the leachate relative to background conditions.
Concentration profiles of potassium for the closed south cell and the current landfill that were
used for calibration are provided in Figures 9 and 10. A set of sensitivity analyses were
completed to examine the best fit with respect to simulated versus observed concentrations of
potassium at the source and downgradient. Seven scenarios with a range of dispersivities were
used in the analyses as summarized in Table 7. Based on these sensitivity analyses, it was
determined that a model having longitudinal, transverse and vertical dispersivities of 20 m, 2 m,
and 0.2m, respectively, was the optimal configuration.
Future Baseline Transport Modeling
Once it was calibrated to existing conditions, the groundwater transport model was used to
project into simulation periods to the year 3004. These “future baseline” scenarios assumed
existing conditions, with no development of the new landfill or stormwater management ponds.
Chloride was used to predict the trends in concentration as the plume evolved. The
concentration profiles for chloride for the closed south cell and the current landfill are
summarized in Table 8 and on Figures 11 and 12, respectively. A progression of simulated
concentration plumes were plotted for Model Layer 3 (contact zone bedrock) with contour plots
Page 44
and colour flooding for the years 2005, 2037, 2064, 2232 and 2434 (Figures 13 to 17). The
extent of the simulated concentration plume on each of the figures is defined by a contour line
having a concentration of 130 mg/L, which is the Reasonable Use Limit (RUL) for an aquifer with
a median background concentration of 10 mg/L.
The results of the simulations as represented in Figures 13 to 17 indicate that a concentration
plume exceeding the RUL could extend beyond WM property boundaries to the north and
northeast, under future baseline conditions. The unlined portion of the current landfill is the
major contributor to the predicted groundwater impacts. The maximum extent of the
concentration plume was simulated to occur at approximately 2064; the extent of the plume at
that date in each of the Model Layers (1 through 5) is shown on Figures 18 to 22, respectively.
Under future baseline conditions, the transport modeling scenarios suggest that groundwater
impacts exceeding RUL could extend beyond WM’s property boundaries. Consequently, possible
mitigative measures were examined to determine an appropriate method of groundwater
control. A mitigative measure that controls the extent of the simulated chloride plume is to
install purge wells along the north side of the existing landfill. In the model, nine purge wells
pumping from Model Layers 2 and 3 were simulated, each extracting 45 m3/day of impacted
groundwater. These wells run parallel to the north toe of the current landfill and are equally
spaced 105 metres apart, as shown in Figure 23. The conceptual purge wells were included in
the transport model under future baseline conditions, and the simulation results indicate that the
concentration plume can be controlled. The resulting maximum extent of the simulated chloride
concentration plume is contained within the WM property limits as shown Figures 24 to 28
which present Model Layers 1 through 5 in 2064, respectively.
Transport Modeling with New Landfill Footprint and Stormwater Ponds
Adding the new landfill expansion and stormwater ponds with transient concentration profiles
was the next step in the modeling program. This allowed modeling of the potential effects from
the proposed undertaking. The transient chloride concentration profile of contaminant flux
through the G2 liner for the new landfill footprint was provided by AECOM and presented in
the Facility Characteristics Report. Figure 29 shows the concentration profile of chloride through
the G2 liner over time. The modeled concentration which fits this curve according to the applied
timesteps is also plotted on Figure 29 and summarized in Table 8 (refer to Source 3 in Table 8).
The concentration profile for the stormwater ponds was determined through an iterative process
which simulated the concentrations being held constant from 2014 to 2024 (i.e., during landfill
operations), with a linear decrease in concentration for five years after closure to 2029. The
maximum concentration that was simulated to be discharged from the stormwater ponds was
165 mg/L. At this maximum concentration, the extent of predicted groundwater impacts with
concentrations greater than 130 mg/L remains within WM property boundaries. Based on these
results, it is apparent that effluent concentration controls should be placed on the operation of
the stormwater ponds to ensure groundwater quality is maintained within acceptable limits. The
source concentration profile for the stormwater ponds is summarized in Table 8 and presented in
Page 45
Figure 30. The maximum extent of the simulated chloride concentration created by the
stormwater ponds is predicted to occur in 2024 (Figure 31).
The results of the potential effects modeling simulations are presented in Figures 32 to 36. These
figures show the predicted maximum extent of chloride concentrations greater than 130 mg/L in
Model Layers 1 through 5, in year 2064. The results indicate that the predicted groundwater
mounding around the stormwater ponds would have the effect of re-orienting the concentration
plume further northward relative to the future baseline conditions. The extent of the plume to
the east is expected to diminish. The groundwater quality is predicted to be affected beyond the
WM northern property boundary; consequently, mitigation measures would be required.
The final set of simulations involved the evaluation of mitigative measures to achieve acceptable
net effects to groundwater quality. The net effects simulations include the existing and proposed
new landfills, stormwater ponds and nine simulated pumping wells, as described above. Figures
37 to 41 show the extent of chloride concentrations greater than 130 mg/L in Model Layers 1
through 5, respectively, in year 2064 with mitigation measures in-place. The maximum extent of
the chloride concentration plume is predicted to be contained within the WM property
boundaries, indicating acceptable net effects.
Page 47
Figure 1: Extent of Groundwater Model Domain
Page 48
Figure 2: DEM Defining the Topography within the Groundwater Model Domain