15
Hull and Propeller Performance Workshop, Oslo 2013 Environmental Benefits of a Hull and Propeller Performance Standard Svend Søyland, Senior Advisor, Bellona Foundation

Hull and Propeller Performance Workshop, Oslo 2013
Environmental Benefits of a Hull and Propeller Performance Standard
Svend Søyland, Senior Advisor, Bellona Foundation

Hull and Propeller Performance Workshop, Oslo 2013
Workshop Objective • Lay the foundation for subsequent work on a reliable and
transparent standard for measuring hull and propeller performance.
Expected outcomes: • Working definition of hull and propeller performance • List of relevant hull and propeller performance measures • Overview of strengths and weaknesses of current measurement
approaches • Visibility on a way forward

Hull and Propeller Performance Workshop, Oslo 2013
Clean Shipping Coalition • Only global international environmental organisation that focuses
exclusively on shipping issues. Observer to IMO.
• Promotes policies aimed at the protection and restoration of the marine and atmospheric environment that are consistent with the safe operation of ships, sustainable development, social and economic justice, and human health.
Members: Air Pollution and Climate Secretariat (AirClim), Sweden Bellona Foundation, Norway Clean Air Task Force, USA Environmental Defense Fund (EDF), USA Transport and Environment (T&E), UK Oceana, USA Seas at Risk, Belgium Stichtung Noordzee (North Sea Foundation), Netherlands
Hull and Propeller Performance Workshop, Oslo 2013
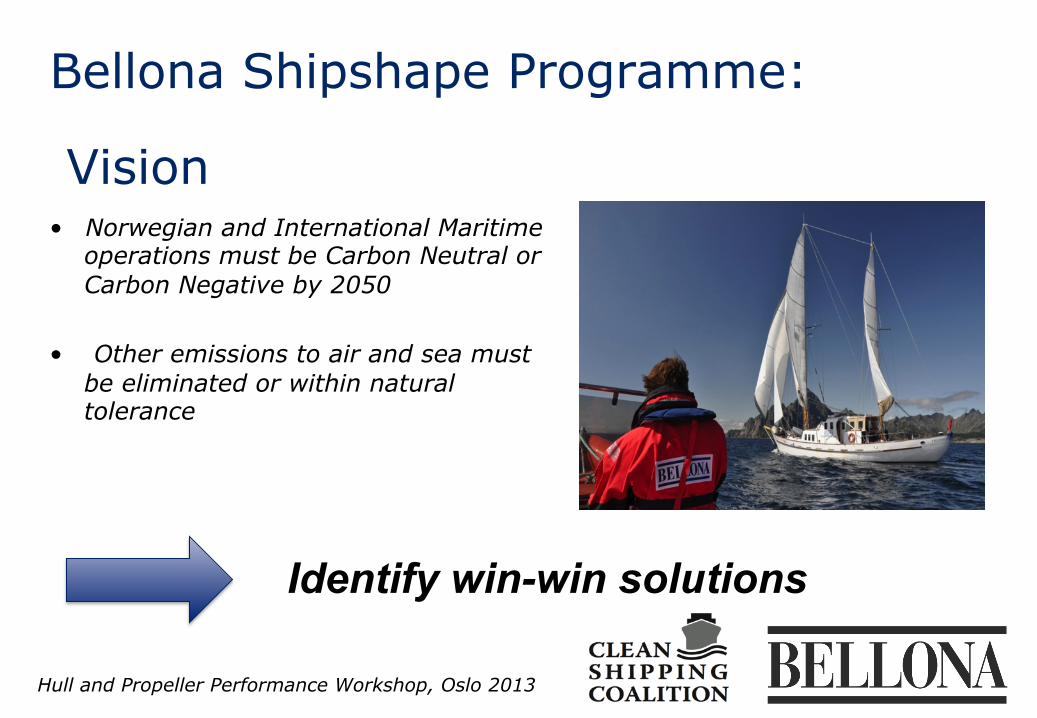
Bellona Shipshape Programme:
Vision • Norwegian and International Maritime
operations must be Carbon Neutral or Carbon Negative by 2050
• Other emissions to air and sea must be eliminated or within natural tolerance
Identify win-win solutions

Hull and Propeller Performance Workshop, Oslo 2013
Bellona Founda+on Mari+me Partners
NoxCare™

Hull and Propeller Performance Workshop, Oslo 2013
Why Clean Shipping Coalition raised this issue? Black Carbon Greenhouse gas emissions
NOx
SOx

Hull and Propeller Performance Workshop, Oslo 2013
Hull and propeller performance – key to improving ship efficiency.
World-fleet energy cost & GHG emissions
Other
Poor hull & propeller
performance ~10%
• Poor hull & propeller performance accounts for around 1/10 of world-fleet energy cost and GHG emissions.
• Implications: ~ $30 billion increase in energy
cost ~ 0.3% increase in man-made
carbon emissions

Hull and Propeller Performance Workshop, Oslo 2013
Needs dictates what and how we measure
Other? Company learning curve
Better company decisions
Reporting / regulation
Drive “desirable” industry decisions
Align incentives of buyers and
suppliers
Perf. based contracting
Trigger maintenance
Minimize consequence of
performance failure
Improved hull and propeller performance
Measurability
Company internal Between companies Between the industry and its’ stakeholders
ACTION

Hull and Propeller Performance Workshop, Oslo 2013
Why Standards? One size fits all?

Hull and Propeller Performance Workshop, Oslo 2013
EEDI – it’s complicated…

Hull and Propeller Performance Workshop, Oslo 2013
Fouled hull and propellers - consequences
Loss of Power

Hull and Propeller Performance Workshop, Oslo 2013
Abatement curve – shipping and emissions

Hull and Propeller Performance Workshop, Oslo 2013
Performance drop: bio-fouling & mechanical damage.
Hul
l and
pro
pelle
r
perf
orm
ance
docking interval
mechanical damage
bio fouling
• Average over period drop in propulsion efficiency caused by bio-fouling and mechanical damage:
– Marintek1: ~ 15% – Jotun (avg. over 60 months): ~18% – Propulsion Dynamic (tankers)2: ~ 20%
• CSC in MEPC 63-4-8: • 15 to 20% loss in propulsion
efficiency à 9 to 12% increase in energy cost and GHG emissions.
1) In second IMO GHG study 2009, section A2.63 2) In Hellio & Yebara, Advances in marine antifouling coatings and
technologies, 2009
Hull and Propeller Performance Workshop, Oslo 2013
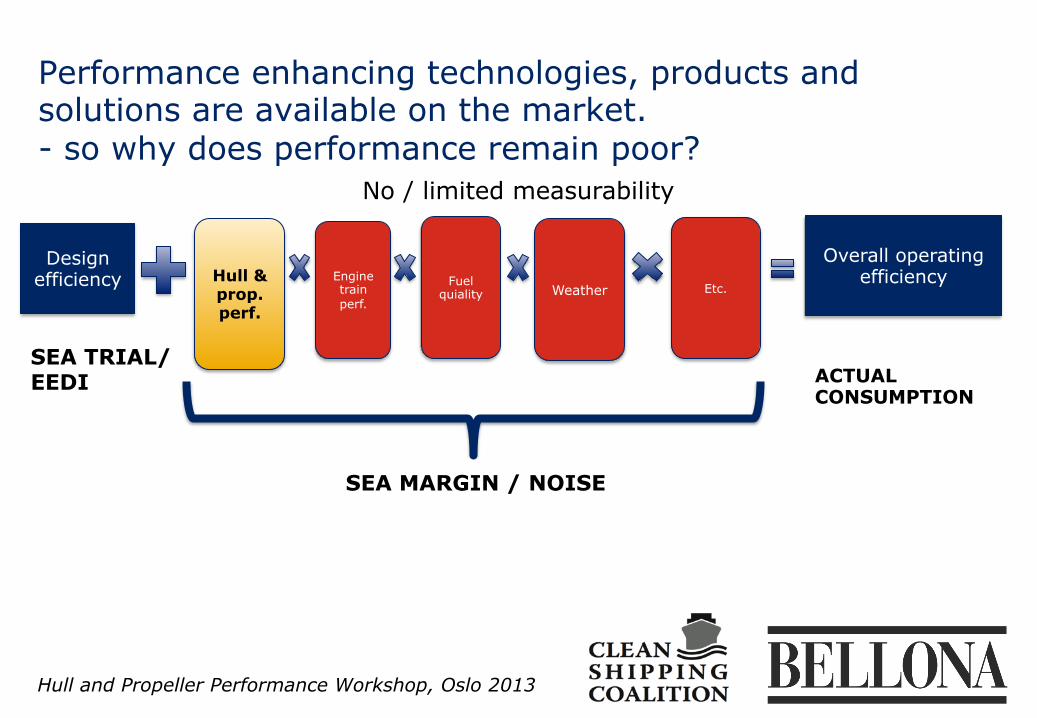
Performance enhancing technologies, products and solutions are available on the market. - so why does performance remain poor?
Design efficiency
Overall operating efficiency
SEA TRIAL/ EEDI ACTUAL
CONSUMPTION
SEA MARGIN / NOISE
Weather Engine train perf.
Fuel quiality
Hull & prop. perf.
Etc.
No / limited measurability

Hull and Propeller Performance Workshop, Oslo 2013
• If I cannot measure it, • I cannot do much
about it.


