124
Addressing Environmental Challenges and their Social Implications in Europe
| Date post: | 16-Aug-2015 |
| Category: |
Documents |
| Upload: | viorica-revenco |
| View: | 30 times |
| Download: | 0 times |

Addressing Environmental Challengesand their Social Implications in Europe


Addressing environmental challenges and their social implications in Europe - CEB 2015
3
| Disc laimer/ Acknowledgements |
The findings, interpretations and conclusions expressed here are those of the authors and do not necessarily reflect those of the Organs of the Council of Europe Development Bank (CEB), who cannot guarantee the accuracy of the data included in the study.
The designations employed and the presentation of the material in this paper do not imply the expression of any opinion whatsoever on the part of the CEB concerning the legal status of any country, territory, city or area, or of its authorities, or concerning the delimitation of its frontiers or boundaries.
The study is printed in this form to communicate the result of an analytical work with the objective of generating further discussions on the issue.
This study was prepared by Lucia Athenosy (Senior Economist) and Viorica Revenco (Economist), Corporate Responsibility & Studies Department, with contributions from Elena Flanigan, under the supervision of Jérôme Halb (Director of Corporate Responsibility & Studies Department, Deputy Director for European Cooperation & Strategy).
This study was peer reviewed by Dr. Simon Dietz (Associate Professor in the Department of Geography and Environment at the London School of Economics and Political Science, Co-Director of the Grantham Research Institute on Climate Change, Director of the ESRC Centre for Climate Change Economics and Policy). The authors wish to express their gratitude to Dr. Simon Dietz for his contribution to this study.
Disclaimer | Acknowledgements

Addressing environmental challenges and their social implications in Europe - CEB 2015
4
| Foreword |
Foreword
Weather extremes, environmental degradation, loss of biodiversity and heritage, depletion of natural resources and other environmental phenomena are happening all around us. Indeed, climate change, combined in some cases with environmental mismanagement, affects all segments of society, but it is the poorer, marginalised and vulnerable population groups who are the most acutely affected.
The impact on our daily lives has been widely covered in the literature and features high on the agenda of international initiatives. However, the social dimension of problems linked to these environmental challenges, in areas such as housing, energy, mobility, health, education, employment and gender equality, is somewhat more difficult to assess and has consequently been less widely addressed.
Against this backdrop, and as the only multilateral development bank in Europe with an exclusively social mandate, the Council of Europe Development Bank (CEB) has an important role to play.
Set up in 1956, the Bank’s primary purpose was to “help in solving the social problems with which European countries are or may be faced as a result of the presence of refugees (…) and as a result of the presence of victims of natural or ecological disasters”, as stated in the CEB’s Articles of Agreement.
This means that from the very beginning the Bank has always considered the environmental aspects of the projects it finances and, indeed, continues to do so today by carrying out environmental screening and impact assessment on all its projects and requiring that they adhere to all the relevant environmental obligations and standards.
Since the creation of a specific sectoral line of action “Managing the Environment” in 2003, the CEB has intensified its commitment to financing sustainable environmental projects, with a quarter of all CEB operations now being approved in this sector. In monetary terms, this represents € 10 billion in loans approved since 1995.
This publication, which was prepared by the Bank’s Studies Unit, looks at the major environmental issues facing the different regions of Europe through a social lens, analyses the risks in the context of the Bank’s Member States and considers their implications for CEB operations. It then goes on to describe the Bank’s experience in this sector, highlighting the added value of CEB-funded environmental projects with four case studies.
The document also emphasises the importance of addressing environmental investment needs without delay and stresses that upgrading infrastructure, ‘greening’ the built environment and strengthening resilience to extreme climatic events are vital if we wish to contain the economic, environmental, technological and social costs of environmental pressures and preserve our continent for future generations.
Looking ahead towards further initiatives at the international level in the months and years to come, the study explains why it is crucial to prioritise green investment solutions in all CEB Member States. My hope is that it will contribute to a better understanding of how environmental changes are likely to affect peoples and societies in different regions across Europe and how the CEB can help its Member States to cope with such changes.
Rolf WENZELGovernor/ Council of Europe Development Bank

Addressing environmental challenges and their social implications in Europe - CEB 2015
5
| Contents |
Boxes | Tables 6
Figures 7
Abbreviations and Acronyms 9
Executive summary 10
Introduction 11
Part A - Main environmental issues and their implications for CEB operations 12
1. Social investment priorities linked to environmental and climate change issues 15
2. A regional analysis of environmental pressures across CEB member countries 49
Part B - CEB environmental financing and its social value 68
3. Lending to date 71
4. Social impact 81
Concluding remarks: the way ahead 95
Bibliography 98
APPENDIX 1: EU environmental legislation 102
APPENDIX 2: Reducing GHG emissions – the EU initiatives 112
APPENDIX 3: Climate trends and projections across Europe 115
APPENDIX 4: CEB Financing, Monitoring and Evaluation 121
Contents

Addressing environmental challenges and their social implications in Europe - CEB 2015
6
| Boxes / Tables |
Box 1
Box 1.1
Box 1.2
Box 1.3
Box 2
Box 2.1
Box 2.2
Box 2.3
Table 2.1
Table 2.2
Table 2.3
Table 2.4
Table 2.5
The CEB and environmental management
Green economy
Differences, similarities and complementarities between adaptation and mitigation
Combating energy poverty in Europe
CEB Environmental Policy
The European Environment Agency (EEA) and the Intergovernmental Panel on Climate Change (IPCC)
EU adaptation policy and funding
Adaptation in practice
Regional classification of CEB countries
Area types in the EU-27
Share of population and urban population living in low elevation coastal zones, 2010
IPCC selected published cost estimates for planned adaptation in European countries
Potential distribution of investment needs across regions in CEB countries by 2100
Boxes | Tables

Addressing environmental challenges and their social implications in Europe - CEB 2015
7
Figure 1.1
Figure 1.2
Figure 1.3
Figure 1.4
Figure 1.5
Figure 1.6
Figure 1.7
Figure 1.8
Figure 1.9
Figure 1.10 Figure 1.11
Figure 2.1
Figure 2.2
Figure 2.3
Figure 2.4
Figure 3.1
Figure 3.2
Figure 3.3
Figure 3.4
Amounts of municipal waste landfilled, incinerated, recycled and composted as a percentage of total amounts treated, 2012
Amounts of municipal waste landfilled, incinerated, recycled and composted in kg per capita, 2012
Water abstraction by sector (irrigation, manufacturing industry, energy cooling and public water supply) in the early 1990s and the period 1998-2007
Regional variations in wastewater treatment in Europe between 1990 and 2009
Adaptation and mitigation synergies
Housing stock by age, 2008
Energy efficiency progress for households in the EU, measured with ODEX, 1990-2011
Change in the energy efficiency index for households by country in the period 2000-2009
Share of renewable energy in gross final energy consumption (in %)
Equipment rate for public transport vehicles (motor coaches, buses and trolleybuses), i.e. number of public transport vehicles per 1,000 inhabitants, 2011 Climate extremes, exposure and vulnerability
Urban population in Eastern Europe and Western Europe
Examples of adaptation in practice
Climate change: potential aggregate impact, adaptive capacity and vulnerability
EEA projections of economic costs stemming from climate change and socio-economic development
Geographic breakdown of CEB lending to environmental management (1957-2014)
Geographic breakdown of CEB lending to environmental management (2005-2014)
The relative breakdown of project approvals in favour of environmental management per sector of action and per sub-period (1957-2014)
Geographic breakdown of CEB lending to natural or ecological disasters (1957-2014)
Figures
| F igures |

Addressing environmental challenges and their social implications in Europe - CEB 2015
8
| F igures |
Figure A
Figure 1
Figure 2
Figure 3
Figure 4
Figure 5
Figure 3.5
Figure 3.6
GHG emissions per capita by selected European countries, 1990-2012
IPCC sub-regional classification of Europe
EEA classification of Europe
Projected changes in selected climate parameters and indices for 2071-2100 with respect to 1971-2000 (A1B scenario)
Projected changes in selected climate parameters and indices for 2071-2100 with respect to 1971-2000 (RCP4.5 and RCP8.5 scenarios)
Heavy precipitation, heat waves and dry spells, 2071-2100 compared to 1971-2000
Geographic breakdown of CEB lending to protection of the environment (1987-2014)
Geographic breakdown of CEB lending to historic and cultural heritage (1997-2014)
Appendix 2 Reducing GHG emissions – the EU initiatives
Appendix 3 Climate trends and projections across Europe

Addressing environmental challenges and their social implications in Europe - CEB 2015
9
AC
CEB
CEB-ELENA
CEE
CSR
EAFRD
EC
EEA
EMFF
ERDF
ESF
EU
EU-12
EU-15
EU-25
EU-27
EU-28
GDP
GHG
IFI(s)
IOM
IPCC
IRM
ISMEP
KfW
MEAs
OECD
RES
SMEs
UNHCR
UNECE
UNEP
UNFCCC
Administrative Council
Council of Europe Development Bank
European Local Energy Assistance
Central, Eastern and South Eastern Europe (19 countries): Albania, Bosnia and Herzegovina, Bulgaria, Croatia, Czech Republic, Estonia, Georgia, Hungary, Kosovo, Latvia, Lithuania, Republic of Moldova, Montenegro, Poland, Romania, Serbia, Slovak Republic, Slovenia and “the former Yugoslav Republic of Macedonia”
Corporate Social Responsibility
European Agricultural Fund for Rural Development
European Commission
European Environment Agency
European Maritime and Fisheries Fund
European Regional Development Fund
European Social Fund
European Union
Belgium, Denmark, France, Germany, Greece, Ireland, Italy, Luxembourg, the Netherlands, Portugal, Spain and the United Kingdom
EU-12 plus Austria, Finland and Sweden
EU-15 plus Cyprus, Czech Republic, Estonia, Hungary, Latvia, Lithuania, Malta, Poland, Slovak Republic and Slovenia
EU-25 plus Bulgaria and Romania
EU-27 plus Croatia
Gross Domestic Product
Greenhouse Gas
International Financial Institution(s)
International Organisation for Migration
Intergovernmental Panel on Climate Change
Integrated Risk Management
Istanbul Seismic Risk Mitigation and Emergency Preparedness Project
Kreditanstalt für Wiederaufbau
Multilateral Environmental Agreements
Organisation for Economic Co-operation and Development
Renewables
Small and medium-sized enterprises
United Nations High Commissioner for Refugees
United Nations Economic Commission for Europe
United Nations Environment Programme
United Nations Framework Convention on Climate Change
Abbreviations and Acronyms
| Abbreviat ions and Acronyms |
Addressing environmental challenges and their social implications in Europe - CEB 2015
10
1. European countries are currently facing many different environmental pressures and this is set to continue in the coming decades, with varying degrees of vulnerability across regions and sectors. These pressures stem from existing and projected climate trends, surrounded by uncertainty about local impacts and the timing of particular weather events. They are also the result of the legacies of environmental mismanagement and underinvestment, particularly in CEB target countries, and of rapid urbanisation, putting heavy pressure on existing infrastructure and affecting first and foremost marginalised population groups.
2. Protecting vulnerable populations, whether it is from climate change, rapid urbanisation or other environmental pressures, is a key element of the CEB’s action. The CEB has been tackling environmental challenges both through its sectoral line of action, “Managing the Environment”, and via the environmental screening and impact assessment carried out on all its projects.
3. From its creation to end 2014, the CEB approved close to € 12 billion and disbursed € 8.4 billion in loans to the sectoral line of action “Managing the Environment”, representing a stable 22% share of all CEB loans approved and disbursed over the same period. CEB lending in this field in the Central, Eastern and South Eastern European countries, known as “target countries”, represented € 5.6 billion or 48% of the total portfolio in this sectoral line of action.
4. Over the period 1957-2014, the sectoral distribution of projects approved in environmental management was between “protecting the environment” (close to € 6 billion or 49% of total loans approved) and addressing “natural or ecological disasters” (€ 5.5 billion or 47% of the total, with the remaining share devoted to “protecting and rehabilitating historic and cultural heritage” (€ 450 million or 4% of the total).
5. The next ten to twenty years offer a window of opportunity for countries to make their development more resilient to environmental pressures and reduce environmental inequalities. Operating in a demand-driven context and within the scope of its financing in environmental management, the CEB can help its 41 Member States address some of their investment needs by focusing on the following areas:
• Environmental protection: upgrading infrastructure (solid waste, water and wastewater management). • Climate change mitigation: “greening” the built environment (energy efficiency in buildings, cleaner and
renewable energy, and sustainable public transport). • Climate change adaptation: strengthening resilience to (extreme) climate events (urban and rural adaptation,
disaster risk management, and action to address potential risks from climate-driven migration).
6. In addition to continuing to address environmental investment needs with a social focus, the CEB could further enhance its contribution by mainstreaming environment and climate change considerations across all the projects entering the Bank’s pipeline. To this end, the CEB could implement systematic tracking of environmental benefits. It could also conduct more thorough screening at project inception to identify climate change vulnerabilities and the potential for increasing environmental co-benefits. In addition, the CEB could seek to mobilise additional funding in order to incentivise the borrower to undertake environmental measures. Blending loans with grants, for example, to cover the extra cost and technical assistance has proved to be an efficient incentive for making environmental co-benefits more attractive. To develop such incentives, the CEB could build upon existing partnerships and explore new opportunities for combining its environmental lending with EU Structural Funds and other EU funding mechanisms.
| Execut ive Summary |
Executive summary

Addressing environmental challenges and their social implications in Europe - CEB 2015
11
European countries are currently facing many different environmental pressures and this is set to continue in the coming decades. For an effective response, these challenges must be addressed from a holistic perspective so as to meet the needs of present generations without jeopardising the ability of future generations to meet their own needs. This means setting immediate and longer-term objectives, taking local and global action and addressing social, economic and environmental issues as interdependent components of human progress.
In the last two decades since the Earth Summit in 1992 and Rio+20 in 2012, “green economy” has emerged as a pathway towards sustainable development, drawing attention to the environmental failings of economic development and to the importance of enhancing social equity.
As a social development bank, the Council of Europe Development Bank (CEB) has adopted an integrated approach to environmental responses – by targeting vulnerable populations and regions, the social dimension is a key constituent of a CEB-financed environmental project. This study presents this integrated approach and the CEB’s experience to date in environmental financing in its 41 Member States.
While taking into account the CEB’s experience to date, this study is primarily forward-looking, with the main focus being to adapt the Bank’s response to the numerous and diverse environmental challenges Europe will be facing in the coming decades. In this context, the diversity of potential future CEB investments is discussed from both a geographic and a sectoral standpoint.
The study is divided into two main parts.
Part A: Main environmental issues and their implications for CEB operations
The various trends and drivers shaping the demand for investment in environmental management over the coming decades are assessed. This assessment is carried out within the scope of CEB financing and focuses on the sectors of action in which the CEB may have the potential to provide additional value. This analysis constitutes the basis for understanding where and to what extent environmental pressures may influence the Bank’s future financing. The CEB’s relevance in this evolving landscape is explored, in particular by identifying sector priorities and their geographic distribution across CEB member countries.
Part B: CEB environmental financing and its social value
The Bank’s scope and long-standing experience in financing projects in favour of sustainable management of the environment are presented. The project portfolio is analysed according to the types of infrastructure financed, reflecting the diversity of the Bank’s investments in this sector.
The added value and social impact of CEB environmental projects are evidenced by a series of case studies. In conclusion, potential avenues for the Bank’s continued investment in environmental management in the years to come are discussed.
This publication thus evidences the importance of sustained CEB investment in response to climate and other environmental pressures that are strongly intertwined with key socio-economic changes affecting the Bank’s Member States.
| Introduc t ion |
Introduction

Addressing environmental challenges and their social implications in Europe - CEB 2015
12
| Main environmental issues and their implicat ions for CEB operat ions |
Part A
Main environmental issues and their implications for CEB operations
The objective of Part A is to assess the various trends and drivers shaping demand for social investments in environmental management over the coming decades. This assessment constitutes the basis for understanding where and to what extent environmental pressures may influence the Bank’s financing. Chapter 1 attempts to identify sector priorities across CEB member countries, and Chapter 2 explores geographical patterns for such green and social investment needs.
1 The Bank was set up on 16 April 1956 by eight member countries of the Council of Europe – Belgium, France, Greece, Germany, Iceland, Italy, Luxembourg and Turkey – as the Council of Europe Resettlement Fund for National Refugees and Over-Population in Europe.2 Albania, Bosnia and Herzegovina, Belgium, Bulgaria, Croatia, Cyprus, Czech Republic, Denmark, Estonia, Finland, France, Georgia, Germany, Greece, Holy See, Hungary, Iceland, Ireland, Italy, Kosovo, Latvia, Lithuania, Liechtenstein, Luxembourg, “the former Yugoslav Republic of Macedonia”, MMalta, Republic of Moldova, Montenegro, Netherlands, Norway, Poland, Portugal, Romania, San Marino, Serbia, Slovak Republic, Slovenia, Spain, Sweden, Switzerland, Turkey. Note: Countries in bold are the CEB’s target countries in Central, Eastern and South-Eastern Europe. As of 4 November 2013, Kosovo became a CEB member.

Addressing environmental challenges and their social implications in Europe - CEB 2015
13
| Main environmental issues and their implicat ions for CEB operat ions |
Set up by the Committee of Ministers of the Council of Europe in 19561, the Council of Europe Development Bank (hereafter the CEB or “the Bank”) is the oldest IFI and the only development bank with an exclusively social mandate in Europe. With a mandate to operate in its 41 Member States2 and a particular focus on the countries in Central, Eastern and South Eastern Europe, known as “target countries”, the CEB has become an important financial tool within the framework of European solidarity.
The CEB conducts its operations in favour of socially and environmentally sustainable development. Improving living conditions in both urban and rural settings has always been at the core of CEB operations. In this context, the CEB has been active in environmental management since its establishment. The Bank’s original mandate was to respond to emergency situations, with aid to refugees, migrants, displaced persons and victims of natural or ecological disasters being a statutory priority (Article II of the Articles of Agreement).
The Bank’s scope of action has progressively widened, and today, environmental lending is one of its four sectoral lines of action, covering the following:
In 2006, the CEB strengthened its commitment to promote good environmental practices by signing the Declaration of “European Principles for the Environment” (EPE). As a signatory to the EPE and in accordance with the geographic scope of its operations, the CEB applies the guiding environmental principles stated in the EU Treaty and the standards incorporated in EU environmental legislation (see Appendix 1). The EPE were also the basis for the CEB’s Environmental Policy (see Box 2). Approved in 2010, the Policy formalised the Bank’s commitment to promoting sustainable development and combating climate change.
As a social development bank, the CEB also attaches great importance to all issues related to Corporate Social Responsibility (CSR).
Sectoral lines of action Sectors of action
Strengthening social integration • Aid to refugees, migrants and displaced persons • Housing for low-income persons • Improvement of living conditions in urban and rural areas
Managing the environment • Natural or ecological disasters • Protection of the environment • Protection and rehabilitation of historic and cultural heritage
Supporting public infrastructure with a social vocation
• Health • Education and vocational training • Infrastructure of administrative and judicial public services
Supporting micro-, small and medium-sized enterprises (MSMEs)
• Creation and preservation of viable jobs
Box 1 The CEB and environmental management

Addressing environmental challenges and their social implications in Europe - CEB 2015
14
| Main environmental issues and their implicat ions for CEB operat ions |

Addressing environmental challenges and their social implications in Europe - CEB 2015
15 1. Social investment priorities linked to environmental and climate change issues

Addressing environmental challenges and their social implications in Europe - CEB 2015
16
1. Environmental protection: upgrading infrastructure Solid waste managementWater and wastewater management
2. Climate change mitigation: “greening” the built environmentEnergy efficiency in buildings (housing, public buildings and heritage sites)Cleaner and renewable energySustainable public transport
3. Climate change adaptation: strengthening resilience to (extreme) climate eventsUrban and rural adaptationDisaster risk managementAction to address potential risks from climate-driven migration
Based on research available from the EU, EEA, IPCC, OECD, UNECE and the World Bank, Chapter 1 provides an overview of the social investment required in CEB member countries in response to environmental pressures over the coming decades. It focuses on the sectors of action eligible for CEB financing and in which the CEB may have the potential to provide additional value.
• • •
Investment needs are the result of the legacies of environmental mismanagement and underinvestment, particularly in CEB target countries, and of urban sprawl in the context of rapid (peri)urbanisation (analysed in Chapter 2), putting heavy pressure on existing infrastructure and affecting first and foremost marginalised population groups.
Social investment needs are also determined by the challenges associated with climate change. Certainty about climate change coexists with uncertainty about local impacts and the timing of particular weather events. Vulnerabilities are expected to be concentrated across different regions and population groups, depending on location and capacity to adapt (analysed in Chapter 2). CEB member countries are already experiencing the consequences of climate change: resource scarcity, biodiversity loss, warmer temperatures, more extreme weather events - droughts, floods and heat waves. The frequency and cost of natural disasters have risen dramatically in the region. The concentration of greenhouse gases already in the atmosphere indicates that similar or greater changes are yet to come. Furthermore, countries will also have to develop the production of renewable energies in order to reduce their greenhouse gas emissions.
The next ten to twenty years offer a window of opportunity for countries to make their development more resilient to these environmental pressures and reduce environmental inequalities. Within the scope of CEB financing in environmental management (see Case Studies presented in Chapter 4), the Bank’s member countries could thus concentrate on the following investment priorities:
| Par t A , Chapter 1. Social investment pr ior i t ies l inked to environmental and c l imate change issues |

Addressing environmental challenges and their social implications in Europe - CEB 2015
17
| Par t A , Chapter 1. Social investment pr ior i t ies l inked to environmental and c l imate change issues |
Moreover, CEB countries could also develop strategies to reduce vulnerability to future changes - focusing not only on infrastructure but also on capacity-building and stronger institutions – and to support further investments in mitigation, adaptation and resilience. Forward-looking decisions today could help avoid locking countries or settlements into unsustainable patterns of development in the future.
1.1 Environmental protection: upgrading infrastructure
Rapid urbanisation in Europe (see Chapter 2) is exerting pressures on fresh water supplies, sewerage networks, ecosystems and public health. Representing around 75% of the population in CEB member countries, urban areas have a particularly large potential for investment in both “green infrastructure”, i.e. infrastructure developed to serve an environmentally beneficial function, such as environmental protection, and “greenable” infrastructure, i.e. existing infrastructure that can be improved to reduce its environmental impact. Unique opportunities exist for urban areas to lead the greening of the global economy (see Box 1.1). As a first step, upgrading basic environmental infrastructure to be more efficient, reliable and sustainable can help curb resource and energy consumption, limit carbon emissions and adapt to climate change.
The green economy has become a pillar of major European and international strategies, most notably within the Europe 2020 strategy adopted in 2010 by the EU to drive sustainable growth, and in the Rio+20 outcome The Future We Want (UN, 2012) as a tool for achieving sustainable development. The green economy can now be seen as an approach that can achieve structural and permanent transformation of the economy.
The definitions of the green economy by different international organisations3 are broadly characterised by the following three objectives: The Bank’s scope of action has progressively widened, and today, environmental lending is one of its four sectoral lines of action, covering the following:
• improving resource-use efficiency: a green economy is one that is efficient in its use of energy, water and other material inputs
• ensuring ecosystem resilience: a green economy also protects the natural environment, the structure of ecosystems and flows of ecosystem services
• enhancing social equity: a green economy promotes human well-being and fair burden-sharing across societies.
Besides the twin challenge of boosting resource efficiency and maintaining ecosystem resilience, the integration of the social aspect or human well-being is fundamental given the importance of basic resources - food, water,
Box 1.1 Green economy
3 International organisations place different emphases on the three dimensions: the OECD focuses on efficiency in the use of resources, whereas the UNDP and UNEP focus on the inclusion of environmentally sensitive approaches in development strategies. The World Bank, the EEA and UNEP focus on natural systems and the biosphere, in particular the importance of respecting environmental limits - respecting resource constraints and planetary boundaries. The social dimension of the green economy plays a large role in the definitions used by the UNDP, UNEP and by the World Bank, which concludes that this [green] growth needs to be inclusive (World Bank, 2012).

Addressing environmental challenges and their social implications in Europe - CEB 2015
18
Moreover, legislative change, primarily but not exclusively from the EU, has imposed and continues to impose structural challenges on the environmental management sector across CEB member countries. The objectives and targets set in European legislation have been one of the key drivers for improving environmental infrastructure across Europe. CEB member countries, mainly comprising EU Member States, candidate and potential candidate countries, have to align their environmental standards and infrastructure with EU environmental and climate change legal requirements. A comprehensive overview of the EU’s environmental legislation is provided in Appendix 1.
This first section focuses on the investment needs in basic environmental infrastructure, namely the management of solid waste, water and wastewater within the scope of the CEB’s action. On the one hand, CEB target countries lag behind their Western European counterparts in terms of the service delivery, quality and capacity of their basic environmental facilities as a result of historic environmental mismanagement and under-investment in such infrastructure. On the other hand, this basic environmental infrastructure has been in place for many years in Western Europe and needs investment in upgrading. In addition, investments in “green infrastructure” can complement investments in the conventional “grey infrastructure”.
Solid waste management
Whether household and industrial waste is re-used, recycled, incinerated or put into landfill sites, its management comes at a financial and environmental cost. Waste must be collected, sorted and transported before being treated, which can prove expensive and result in greenhouse gas emissions and pollution of air, soil and water. Improved waste management is an essential element in efforts to make Europe more resource efficient. If a country is to generate greater economic returns at lower costs to the environment, then it must find ways to extract more value from the resources that it takes from nature, while cutting the burden of emissions and waste. One key means of achieving this is by shifting waste management up “the waste hierarchy”4, i.e. reducing waste disposal into or onto land (e.g. landfill) and instead focusing on waste prevention, re-use, recycling and recovery.
4 A ranking of waste management options, from the most to the least desirable: prevention, reduction, re-use, recycling, recovery and disposal.
energy, and materials - as well as ecosystem services for people’s subsistence needs. Enhanced social equity and fair burden-sharing with respect to present and future generations can be seen as highly relevant to the long-term view of the green economy.
The green economy approach marks a shift away from the short-term understanding of environmental considerations as a cost factor that constrains economic growth and impairs competitiveness towards a belief that such considerations are fundamental to the long-term sustainability of economic output.
Source: EEA (2014), Resource-efficient green economy and EU policies, EEA Report 2/2014, July 2014
| Par t A , Chapter 1. Social investment pr ior i t ies l inked to environmental and c l imate change issues |

Addressing environmental challenges and their social implications in Europe - CEB 2015
19
Waste prevention can be achieved through cleaner technologies, eco-design, or more eco-efficient production and consumption patterns. Waste prevention and recycling, focused on materials technology, can also reduce the environmental impact of resources that are used by limiting the extraction and transformation of raw materials during production processes. Where possible, waste that cannot be recycled or re-used should be safely incinerated with landfills only used as a last resort. The benefits of shifting waste management up the waste hierarchy are not limited to more efficient resource use and a reduced waste burden on the natural environment. Better waste management also provides a way of cutting greenhouse gas emissions and contributing to combating climate change. Solid waste management should be viewed not only as an environmental and health challenge, but also as a green economic opportunity.
In 20105, the total generation of waste from economic activities and households in the EU-27 amounted to 2.5 billion tonnes. Of all the waste generated in the EU-27 in 2010, some 101.3 million tonnes (4% of the total) were classified as hazardous waste. This was equivalent to an average of about 5 tonnes of waste for each inhabitant in the EU-27, of which 202 kg were hazardous waste.
Focus on municipal waste, accounting for only about 10% of total waste generated, is informative for the following reasons. First, indicators on municipal waste, collected and published by Eurostat since 1995, are used to monitor European waste policies. Second, responsibility for municipal waste primarily lies with the public sector. Third, the EU’s Waste Framework Directive (see Appendix 1) includes a 50% recycling target for household waste, to be met by 2020. Progress on recycling municipal waste by individual countries is reported to Eurostat.
In 20126, municipal waste generation totals (see Figure 1.2) varied considerably, ranging from 694 kg per capita in Switzerland to 279 kg per capita in Estonia. The variations reflect differences in consumption patterns and economic wealth, but also depend greatly on how municipal waste is collected and managed. There are pronounced differences between countries regarding the degree to which waste from commerce, trade and administration is collected and managed together with waste from households. Households generate between 60% and 90% of municipal waste while the remainder can be attributed to commercial sources and administration.
Figure 1.1 and Figure 1.2 show the huge differences between countries with regard to their waste management systems. Figure 1.1 shows the amounts of municipal waste landfilled, incinerated, recycled and composted in 2012 as a percentage of total amounts treated. Figure 1.2 shows the corresponding figures in kg per capita. Both are sorted by the percentage of waste amounts landfilled relative to total amounts treated.
5 Source: Eurostat, July 2013 (most recent data), http://epp.eurostat.ec.europa.eu/statistics_explained/index.php/Waste_statistics6 Source: Eurostat, March 2014 (most recent data), http://epp.eurostat.ec.europa.eu/statistics_explained/index.php/Municipal_waste_statistics
| Par t A , Chapter 1. Social investment pr ior i t ies l inked to environmental and c l imate change issues |

Addressing environmental challenges and their social implications in Europe - CEB 2015
20
Several countries are very advanced in diverting municipal waste from landfills. This is usually because they have implemented national measures to reduce landfill. Switzerland, Germany, the Netherlands, Sweden, Austria, Denmark, Norway and Belgium have reported landfill rates below 5%. France, Finland, Estonia, the United Kingdom, Ireland and Italy reported rates between 28% and 42%. Landfill rates in 2012 were even higher in Greece (81%), Spain (63%) and Portugal (54%).
The highest rates for recycling were reported by Germany (47%, 284 kg per capita), Ireland (37%, 208 kg per capita), Belgium (36%, 165 kg per capita), Iceland (36%, 122 kg per capita) and Switzerland (35%, 241 kg per capita). For composting, Austria (32%, 179 kg per capita) and the Netherlands (26%, 141 kg per capita) reported the highest rates. Belgium was among the countries with the highest rates for both recycling (36%) and composting (21%).
In the Member States that joined the EU in or after 2004 and in EU candidate countries, as well as in Iceland, landfill is still the predominant waste management option. Landfill rates in these countries range between 35% in Estonia and 100% in the “former Yugoslav Republic of Macedonia”. Bosnia and Herzegovina, Croatia, Malta, Turkey and Latvia recorded an 80% share of landfill municipal waste.
There are few waste incineration facilities in the new EU Member States and candidate countries, while collection and recycling schemes are in some cases still in their infancy. Only seven of these countries do report some incineration of municipal waste. The rate is highest in the Czech Republic (20%, 62 kg per capita), followed by Estonia (12%, 34 kg per capita), Iceland (8%, 26 kg per capita), Hungary (9%, 37 kg per capita) and the Slovak Republic (10%, 31 kg per capita). In the others, the incineration rate is under 5%.
Statistics from Eurostat presented in this section underline the investment needed at many levels if the new EU Member States and candidate countries are to meet EU legal targets and obligations (in terms of recycling, recovery and diversion of waste from landfill) such as separate collection requirements by 2015, reduced amounts of landfill biodegradable municipal waste by 2020 and the 50% target for recycling municipal waste by 2020 (see Appendix 1). The figures above demonstrate that CEB target countries are generally well behind their Western counterparts in terms of waste management infrastructure, activities and solutions.
Substantial investments in waste management infrastructure will thus have to be made in CEB target countries to reach the EU targets and to converge with the more mature waste management sectors in Western Europe. In this perspective, the CEB can finance investments in favour of the construction, rehabilitation or extension of solid waste collection and treatment infrastructure and energy from waste facilities such as combined heat and power plants. The particular focus of these investments could be on shifting municipal waste management up the waste hierarchy: diverting waste from landfill, and increasing the recycling and composting of municipal waste.
| Par t A , Chapter 1. Social investment pr ior i t ies l inked to environmental and c l imate change issues |

Addressing environmental challenges and their social implications in Europe - CEB 2015
21
Source: http://epp.eurostat.ec.europa.eu/statistics_explained/index.php/Municipal_waste_statistics
Source: http://epp.eurostat.ec.europa.eu/statistics_explained/index.php/Municipal_waste_statistics
Figure 1.2 Amounts of municipal waste landfilled, incinerated, recycled and composted in kg per capita, 2012
Figure 1.1 Amounts of municipal waste landfilled, incinerated, recycled and composted as a percentage of total amounts treated, 2012
| Par t A , Chapter 1. Social investment pr ior i t ies l inked to environmental and c l imate change issues |
Addressing environmental challenges and their social implications in Europe - CEB 2015
22
Water and wastewater management
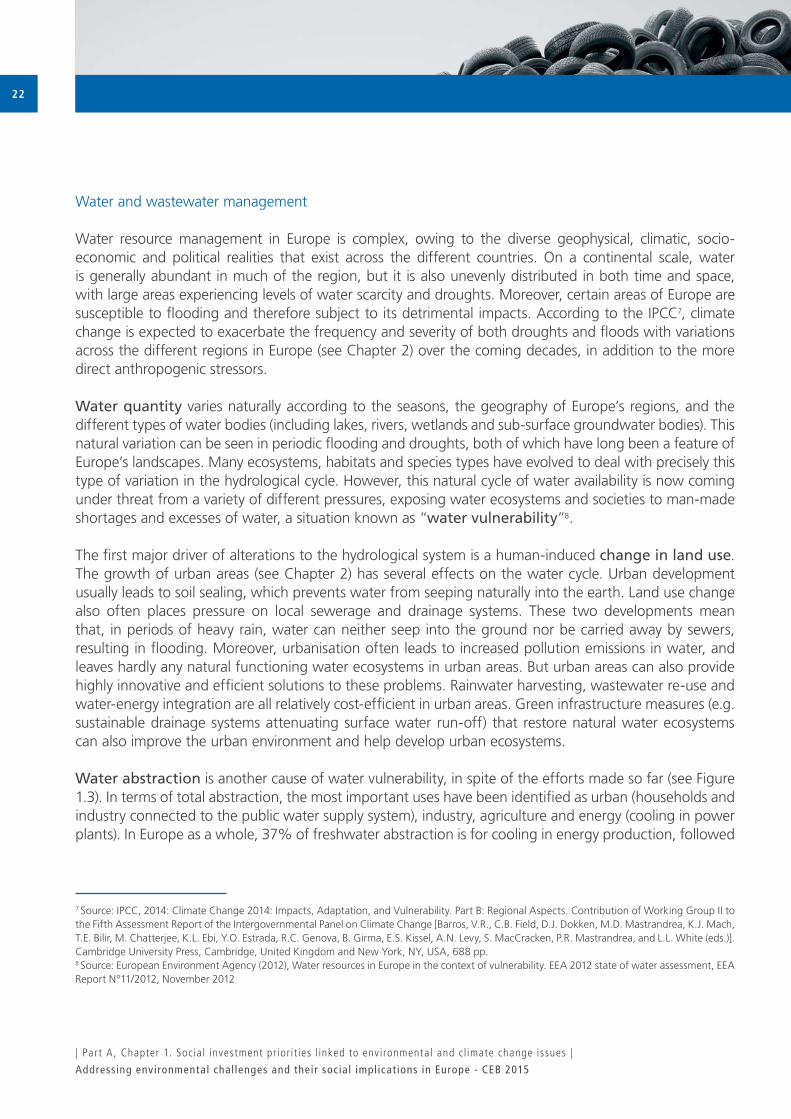
Water resource management in Europe is complex, owing to the diverse geophysical, climatic, socio-economic and political realities that exist across the different countries. On a continental scale, water is generally abundant in much of the region, but it is also unevenly distributed in both time and space, with large areas experiencing levels of water scarcity and droughts. Moreover, certain areas of Europe are susceptible to flooding and therefore subject to its detrimental impacts. According to the IPCC7, climate change is expected to exacerbate the frequency and severity of both droughts and floods with variations across the different regions in Europe (see Chapter 2) over the coming decades, in addition to the more direct anthropogenic stressors.
Water quantity varies naturally according to the seasons, the geography of Europe’s regions, and the different types of water bodies (including lakes, rivers, wetlands and sub-surface groundwater bodies). This natural variation can be seen in periodic flooding and droughts, both of which have long been a feature of Europe’s landscapes. Many ecosystems, habitats and species types have evolved to deal with precisely this type of variation in the hydrological cycle. However, this natural cycle of water availability is now coming under threat from a variety of different pressures, exposing water ecosystems and societies to man-made shortages and excesses of water, a situation known as “water vulnerability”8.
The first major driver of alterations to the hydrological system is a human-induced change in land use. The growth of urban areas (see Chapter 2) has several effects on the water cycle. Urban development usually leads to soil sealing, which prevents water from seeping naturally into the earth. Land use change also often places pressure on local sewerage and drainage systems. These two developments mean that, in periods of heavy rain, water can neither seep into the ground nor be carried away by sewers, resulting in flooding. Moreover, urbanisation often leads to increased pollution emissions in water, and leaves hardly any natural functioning water ecosystems in urban areas. But urban areas can also provide highly innovative and efficient solutions to these problems. Rainwater harvesting, wastewater re-use and water-energy integration are all relatively cost-efficient in urban areas. Green infrastructure measures (e.g. sustainable drainage systems attenuating surface water run-off) that restore natural water ecosystems can also improve the urban environment and help develop urban ecosystems.
Water abstraction is another cause of water vulnerability, in spite of the efforts made so far (see Figure 1.3). In terms of total abstraction, the most important uses have been identified as urban (households and industry connected to the public water supply system), industry, agriculture and energy (cooling in power plants). In Europe as a whole, 37% of freshwater abstraction is for cooling in energy production, followed
7 Source: IPCC, 2014: Climate Change 2014: Impacts, Adaptation, and Vulnerability. Part B: Regional Aspects. Contribution of Working Group II to the Fifth Assessment Report of the Intergovernmental Panel on Climate Change [Barros, V.R., C.B. Field, D.J. Dokken, M.D. Mastrandrea, K.J. Mach, T.E. Bilir, M. Chatterjee, K.L. Ebi, Y.O. Estrada, R.C. Genova, B. Girma, E.S. Kissel, A.N. Levy, S. MacCracken, P.R. Mastrandrea, and L.L. White (eds.)]. Cambridge University Press, Cambridge, United Kingdom and New York, NY, USA, 688 pp.8 Source: European Environment Agency (2012), Water resources in Europe in the context of vulnerability. EEA 2012 state of water assessment, EEA Report N°11/2012, November 2012
| Par t A , Chapter 1. Social investment pr ior i t ies l inked to environmental and c l imate change issues |

Addressing environmental challenges and their social implications in Europe - CEB 2015
23
by agriculture (33%); public water supply (20%); and industry (10%). In Southern Europe, agriculture (specifically irrigation) accounts for more than half of total national abstraction, rising to more than 80% in certain locations (e.g. Turkey), while in Western Europe more than half of the water abstracted is used for cooling in energy production, followed by public water supply and industry. In Eastern Europe, the largest abstractor is the electricity generation sector (>50%), followed by public water supply.
Figure 1.3 Water abstraction by sector (irrigation, manufacturing industry, energy cooling and public water supply) in the early 1990s and the period 1998-2007
Source: EEA (CSI 018), http://www.eea.europa.eu/data-and-maps/figures/water-abstractions-for-irrigation-manufacturing-industry-energy-cooling-and-public-water-supply-million-m3-year-in-early-1990s-and-the-period-1997. Note: Turkey is plotted on an individual column in this graph to depict the large increase in agricultural water use, and to avoid the projection of this trend/effect on the Southern countries trend.
The third main cause of water vulnerability is climate change with a more indirect effect on water quantity than land use change or abstraction. Its impact is also more difficult to discern given the natural variability in the hydrological cycle. Nevertheless, the effects are increasingly visible. Rising temperature and changing precipitation patterns are projected to lead to changes in the quantity, quality and timing of freshwater flows in the environment. A whole range of eco-hydrological impacts can be expected to affect ecosystems and species: increased low-flow episodes and water stress; shifts in the timing of floods; increased evaporative losses from shallow waters; more frequent and intense storm flows; shifts in seasonality and frequency in
| Par t A , Chapter 1. Social investment pr ior i t ies l inked to environmental and c l imate change issues |

Addressing environmental challenges and their social implications in Europe - CEB 2015
24
the thermal stratification of lakes and wetlands; salt-water intrusion; more intense run-off with increased sediment and pollution loads; and water temperature changes with shifts in concentrations of dissolved oxygen. Such impacts will reduce the resilience of freshwater ecosystems to disturbance and subsequently increase their vulnerability to further climate change. The inherent uncertainty in these complex systems of how changes in timing and flow will affect ecosystems requires a risk-based approach to vulnerability. This risk-based approach is increasingly being adopted by climate change policies and adaptation strategies for disaster risk reduction (see section 3 in this chapter for more details).
In addition to the growing problem of water stress (the misbalance between water demand and availability amounts during a certain period), Europe’s water quality is also a concern. More than half of the surface water bodies in Europe are reported9 as not meeting the standards defined by “Good Ecological Status” and require remedial measures being taken to meet the EU Water Framework Directive objectives (see Appendix 1). The presence of a whole range of pollutants originating from many sources such as agriculture, industry, transport and households threatens aquatic ecosystems and raises concerns for health. Industry and households produce wastewater containing all sorts of pollutants including organic matter and nutrients (mainly phosphorus). The extent to which the pollutants in wastewater are discharged into surface waters depends on the wastewater treatment facilities available. Similarly, agricultural activities lead to the discharge of a variety of pollutants into water bodies, the most important being nitrogen resulting from the excess application of artificial fertilisers and manure. The impacts of pollution, diffuse or point source, are many and diverse but the general picture is one of deterioration in the ecological quality of aquatic systems, such as phosphorus induced eutrophication (which threatens biodiversity and tourism), and threats to human health and well-being from nitrates in drinking water, pathogens (associated with organic matter), pesticides and other hazardous substances.
9 Source: European Environment Agency (2012), Water resources in Europe in the context of vulnerability. EEA 2012 state of water assessment, EEA Report N°11/2012, November 2012
| Par t A , Chapter 1. Social investment pr ior i t ies l inked to environmental and c l imate change issues |

Addressing environmental challenges and their social implications in Europe - CEB 2015
25
Source: EEA (CSI 024), published in January 2013http://www.eea.europa.eu/data-and-maps/indicators/urban-waste-water-treatment/urban-waste-water-treatment-assessment-3
Figure 1.4 Regional variations in wastewater treatment in Europe between 1990 and 2009
Notes: 1. The vertical axis shows the share of population connected to wastewater collection and treatment plants in selected European sub-regions.2. Primary (mechanical) treatment removes part of the suspended solids. Secondary (biological) treatment uses aerobic or anaerobic micro-organisms to decompose most of the organic matter and retain some of the nutrients (around 20-30%). Tertiary (advanced) treatment removes the organic matter even more efficiently. It generally includes phosphorus retention and in some cases nitrogen removal.3. Geographic coverage: North (Norway, Sweden, Finland and Iceland), West (Austria, Denmark, UK, the Netherlands, Germany, Switzerland, Luxembourg and Ireland), South (Cyprus, Greece, Malta, Spain and Portugal), East (Czech Republic, Estonia, Hungary, Latvia, Lithuania, Poland, Slovenia, Slovak Republic), Southeast (Bulgaria, Romania and Turkey).
Despite significant progress in CEB countries in reducing pollution loads from municipal and industrial point sources by installing wastewater treatment plants and reducing chemical use, pollution loads from diffuse agricultural and urban sources (fertilisers and pesticides, run-off from sealed surfaces and roads, and pharmaceuticals in animal and human waste) are continuing challenges in many countries. Wastewater treatment in all parts of Europe has improved during the last 15-20 years. The percentage of the population connected to wastewater treatment (see Figure 1.4) in Southern, South-Eastern and Eastern Europe has increased over the last ten years. Latest values for populations connected to wastewater treatment in
| Par t A , Chapter 1. Social investment pr ior i t ies l inked to environmental and c l imate change issues |

Addressing environmental challenges and their social implications in Europe - CEB 2015
26
Southern countries (about 80%) are comparable to the values of Western (>90%) and Northern countries, whereas the values of Eastern (67%) and South Eastern Europe (about 40% covering only Bulgaria, Romania and Turkey) are still relatively low compared to Western and Northern Europe. About a quarter of the population in South Eastern Europe is connected to collecting systems without treatment.
Much of the water and wastewater infrastructure in developed Europe has been in place for fifty to hundred years and is in need of upgrading or replacement. Being overstretched and/or underfunded, water and sanitation utilities show relatively poor performance in terms of service delivery, quality and capacity in South Eastern European countries, as a result of historic environmental mismanagement and under-investment in infrastructure. Ageing, underfunded or overstretched water and wastewater networks require investment. This need also opens up possibilities for interlinking “green infrastructure” (such as natural water retention measures10, e.g. innovative water storage capacities) with “grey infrastructure” such as conventional water treatment through pipes.
Based on its experience, the CEB can finance infrastructure investments in the reduction and treatment of wastewater through sewage collection networks, pumping stations and treatment facilities, clean-up and protection of surface and underground water, decontamination of soils and aquifers, and protection and development of biodiversity. The CEB can also partially finance investments aimed at improving the quality and reliability of drinking water supply networks, and connecting isolated or badly supplied communities to the mains. Investments in green infrastructure could also be part of the CEB’s action.
10 Natural water retention measures aim to safeguard and enhance the water storage potential of landscape, soil, and aquifers, by restoring ecosystems, natural features and characteristics of water courses and using natural processes. They support green infrastructure by contributing to integrated goals dealing with nature and biodiversity conservation and restoration, landscaping, etc. They are adaptation measures that use nature to regulate the flow and transport of water so as to smooth peaks and moderate extreme events (floods, droughts, desertification, salination). They are relevant both in rural and urban areas.
| Par t A , Chapter 1. Social investment pr ior i t ies l inked to environmental and c l imate change issues |

Addressing environmental challenges and their social implications in Europe - CEB 2015
27
Box 1.2 Differences, similarities and complementarities between adaptation and mitigation
Effective climate policy aimed at reducing the risks of climate change for natural and human systems involves a portfolio of diverse adaptation and mitigation actions. Such actions include technological, institutional and behavioural options, the introduction of economic and policy instruments to encourage the use of these options, and research and development to reduce uncertainty and to enhance the effectiveness and efficiency of such options. Opportunities exist for integrating adaptation and mitigation into broader development strategies and policies.
In this study, we use the following IPCC definitions of climate change mitigation and adaptation (see also Box 2.1):
• Mitigation: an anthropogenic intervention to reduce the sources or enhance the sinks of greenhouse gases • Adaptation: adjustment in natural or human systems in response to actual or expected climatic stimuli or
their effects, which moderates harm or exploits beneficial opportunities.
It follows from these definitions that mitigation reduces all impacts (positive and negative) of climate change and thus reduces the adaptation challenge, whereas adaptation is selective; it can take advantage of positive impacts and reduce negative ones.
The two options are implemented on the same local or regional scale, and may be motivated by local and regional priorities and interests, as well as global concerns. Mitigation has global benefits (ancillary benefits might be achieved at local/regional level), although effective mitigation needs to involve a sufficient number of major greenhouse-gas emitters to foreclose leakage. Adaptation typically works on the scale of an impacted system, which is regional at best, but mostly local (although some adaptation might result in spill-overs across national boundaries, for example by changing international commodity prices in agricultural or forest-product markets).
Expressed as CO2-equivalents, emission reductions achieved by different mitigation actions can be compared and if the costs of implementing the actions are known, their cost-effectiveness can be determined and compared. The benefits of adaptation are more difficult to express in a single metric, thus impeding comparisons between adaptation efforts. Moreover, as a result of the predominantly local or regional effect of adaptation, the benefits of adaptation will be valued differently depending on the social, economic and political contexts within which they occur.
The benefits of mitigation achieved today will be evidenced in several decades because of the long residence time of greenhouse gases in the atmosphere (ancillary benefits such as reduced air pollution are possible in the near term), whereas many adaptation measures would be effective immediately and yield benefits by reducing vulnerability to climate variability. As climate change continues, the benefits of adaptation (i.e. avoided damage) will increase over time. Thus there is a delay between incurring the costs of mitigation and realising its benefits from smaller climate change, while the time span between expenditure and returns of adaptation is usually much shorter. This difference is augmented in analyses adopting high discount rates. These asymmetries have led to a situation whereby the initiative for mitigation has tended to stem from international agreements and ensuing national public policies, sometimes supplemented by community-based or private-sector initiatives, whereas the bulk of adaptation actions have historically been motivated by the self-interest of affected private actors and communities, possibly facilitated by public policies.
| Par t A , Chapter 1. Social investment pr ior i t ies l inked to environmental and c l imate change issues |

Addressing environmental challenges and their social implications in Europe - CEB 2015
28
There are a number of ways in which adaptation and mitigation are related at different levels of decision-making. Mitigation efforts can foster adaptive capacity if they eliminate market failures and distortions, as well as perverse subsidies that prevent actors from making decisions on the basis of the true social costs of the available options. On a highly aggregated scale, mitigation expenditure appears to divert social or private resources and reduces the funds available for adaptation, but in reality the actors and budgets involved are different. Both options change relative prices, which can lead to slight adjustments in consumption and investment patterns and thus to changes in the affected economy’s development pathway, but direct trade-offs are rare. The implications of adaptation can be both positive and negative for mitigation. For example, afforestation that is part of a regional adaptation strategy also makes a positive contribution to mitigation. In contrast, adaptation actions that require increased energy use from carbon-emitting sources (e.g. increased fossil-based air conditioning in response to higher temperatures) would affect mitigation efforts negatively and mitigation may impede adaptation (e.g. increased use of land for bioenergy crop production negatively impacting ecosystems).
Mitigation has the potential to reduce climate change impacts, and adaptation can reduce the damage of those impacts. Together, both approaches can contribute to the development of societies that are more resilient to the threat of climate change and therefore more sustainable. Studies indicate that interactions between adaptation and mitigation responses have potential synergies and trade-offs that vary according to context. There are a growing number of examples of the co-benefits of mitigation and development policies, such as those that can potentially reduce local emissions of health-damaging and climate-altering air pollutants from energy systems. It is clear that adaptation, mitigation and sustainable development will be connected in the future.
Source: http://ccap.org/connecting-the-dots-adaptation-mitigation-synergies/The text in this box is based on the information available in the IPCC Assessment Reports that can be accessed via the following links: \http://www.ipcc.ch/publications_and_data/ar4/wg2/en/ch18s18-1-2.htmlhttp://ipcc-wg2.gov/AR5/images/uploads/WGIIAR5-Volume-FAQs_FGD.pdf
Open space preservation
Land use changes,Relocation
Building design
Flood mitigation
Emergency responce
Business Continuity Planning
Community engagement
Energy Efficiency
Renewable Energy
Combined Heat and Power
Sustainable Transportation
Methane capture and use
Industrial process improvements
Carbon sinks
GreenInfrastructure
Power SystemResilience
Protection of Sustainable
Transportation
Water & EnergyConservation
BuildingWeatherisation
| Par t A , Chapter 1. Social investment pr ior i t ies l inked to environmental and c l imate change issues |
Figure 1.5 Adaptation and mitigation synergies
Adaptation Mitigation
Afforestation,
Infrastructure protection

Addressing environmental challenges and their social implications in Europe - CEB 2015
29
1.2 Climate change mitigation: “greening” the built environment
Climate change mitigation refers to efforts to cut or prevent greenhouse gas (GHG) emissions in order to arrest the rate of increase of global mean temperature and associated climatic changes (see Box 1.2). It may also encompass attempts to remove greenhouse gases from the atmosphere. There is a wide range of possible actions to reduce or prevent GHG emissions, largely carbon dioxide (around 75%) from the combustion of fossil fuels (coal, oil and gas).
This section outlines several mitigation options for CEB member countries, focusing on sectors and infrastructure in the built environment. These options mainly include investments in energy efficiency in residential and non-residential buildings, low-carbon mobility, and cleaner energy infrastructure.
Energy efficiency in buildings
Investing in energy efficiency simultaneously achieves several goals: reduced energy requirements and lower greenhouse gas emissions indirectly contribute to better energy security and greener economic growth. Benefits from improved energy efficiency also include positive impacts on business development and employment, as well as strengthened national competitiveness, (energy) poverty alleviation and reduced social inequality, better indoor and outdoor air quality, reduced mortality and enhanced health. The benefits thus represent a multi-win situation for governments, end users, market participants (public and private) and society in general.
In Europe, buildings offer the largest cost-effective opportunity for savings since they represent the largest energy-consuming sector, being responsible for over a third of total final energy consumption. The residential sector (around 75% of the total building stock in Europe) represents on average 20% to 40% of total final energy consumption and 40% of CO2 emissions. Up to 90% of total energy used during the life of a building is consumed during its operation, while the rest concerns the construction and demolition phases. Most energy consumption in residential buildings is used for space and water heating11. Numerous demographic, economic, social and cultural changes are expected to further increase the pressure of buildings on energy consumption and to generate even higher levels of greenhouse gas emissions. Yet, it is in the building sector, and particularly in the residential sector, where some of the greatest energy savings can be achieved.
The building sector in urban areas has a central role to play in the reduction of carbon emissions and the fight against climate change. Concentrating people and infrastructure, cities are responsible for the largest share of CO2 emissions, mostly from buildings and transport, both directly as generators of such emissions and indirectly as end-users of fossil fuel based energies and other goods and services, the production of which generates emissions elsewhere. In many CEB member countries, cities are already leading the transition towards a green economy (see Box 1.1) and low-carbon development.
11 Source: European Environment Agency (EEA), Sustainable consumption and production in South Eastern Europe and Eastern Europe, Caucasus and Central Asia, October 2007
| Par t A , Chapter 1. Social investment pr ior i t ies l inked to environmental and c l imate change issues |

Addressing environmental challenges and their social implications in Europe - CEB 2015
30
They offer major savings in terms of infrastructure, thus reducing the damaging environmental effects of built-up areas and their high energy consumption.
Buildings in rural areas also have a high potential for energy savings. First, due to an older building stock and fewer incentives for building retrofitting, energy efficiency levels of buildings are significantly lower in rural than in urban areas. Second, given their limited access to the natural gas grid, consumers in rural areas are left with fewer energy choices, are often compelled to use high-carbon, polluting, inefficient and expensive sources of energy and have less access to modern energy technologies. Last but not least, energy poverty (see Box 1.3) tends to be more acute in rural areas, due to lower incomes, reduced energy choices and poor insulation of buildings. Compared to cities, rural areas face several barriers to energy efficiency improvements. The first barrier is of a financial nature: income per capita is 21% to 62% lower in rural areas, mainly because wage rates are lower. This gap is accentuated in CEB target countries. The second barrier is the dominance of individual houses in rural areas and the scattered nature of dwellings. While in the urban environment, economies of scale will come into play with large-scale renovation programmes able to act on streets, districts and localities, retrofitting in rural environments may be more spread out and hence benefit from economies of scale to a lesser extent.
Improved energy efficiency in housing is defined12 as achieving reduced energy intensities in residential services without compromising the well-being of the residents or the environment. The corollary of this definition is that housing that consumes excessive energy, pollutes the environment and is associated with problems of energy affordability cannot be considered to be efficient. This definition thus recognises the links between energy efficiency and the three components of sustainable development: the environment, society and the economy.
Based on this definition, improved housing energy efficiency includes the following components:
• Retrofitting of existing housing to achieve high energy efficiency standards • High energy standards for all newly built homes • Energy-efficient utility systems providing services to housing • Low-energy housing management systems • Replacement of inefficient equipment, appliances and lighting systems • Good environmental quality in spatial planning • Environmentally friendly building practices • A minimised carbon footprint for the housing sector • Housing energy affordability.
Throughout Europe, the general challenge to be addressed is the energy efficient refurbishment and retrofitting, known as “greening” of existing buildings. The emphasis on the existing stock is essential since new buildings account for a (very) limited share of the total housing stock across CEB countries (see Figure 1.6).
12 Source: UNECE, Committee on Housing and Land Management, Action plan for energy-efficient housing in the UNECE region, 2010
| Par t A , Chapter 1. Social investment pr ior i t ies l inked to environmental and c l imate change issues |

Addressing environmental challenges and their social implications in Europe - CEB 2015
31
Figure 1.6 Housing stock by age, 2008
The energy efficiency of buildings can be improved in all CEB countries, but there are large differences in the region with respect to the levels of economic development, legislative and organisational structures, history of the residential sector, climate conditions, landscapes and cultures. As CEB member countries stretch geographically from Scandinavia to Malta, there is also a climatic variation in the structure of energy consumption and, as a consequence, different requirements and opportunities for improved energy efficiency. Southern countries have a smaller share of space heating and a larger share of cooling in their energy balances than their Northern counterparts. Some 550 million inhabitants spread over 41 CEB countries reside in a wide array of building types with an equally wide range of thermal qualities, in a constantly expanding building stock. Investments must therefore be sensitive to this diversity and be sufficiently embedded in the local socio-economic, institutional and geographic context.
Although some progress has been made recently, the existing situation in CEB member countries leaves much room for improvement. Even those countries in Western and Northern Europe considered to have advanced building standards in place are far from fully realising the potential for the sector. Western EU countries have set target refurbishment rates of 2.5-3% of the total housing stock per year, but the current prevailing renovation rate across Europe is around 1%. Central, Eastern and South Eastern
Source: http://www.entranze.enerdata.eu/
| Par t A , Chapter 1. Social investment pr ior i t ies l inked to environmental and c l imate change issues |
Addressing environmental challenges and their social implications in Europe - CEB 2015
32
European countries in particular have the greatest untapped potential for energy efficient buildings13. Moreover, CEB financings in the housing sector could especially target the most vulnerable households often hit by energy poverty (see Box 1.3), in particular in Central, Eastern and South Eastern Europe.
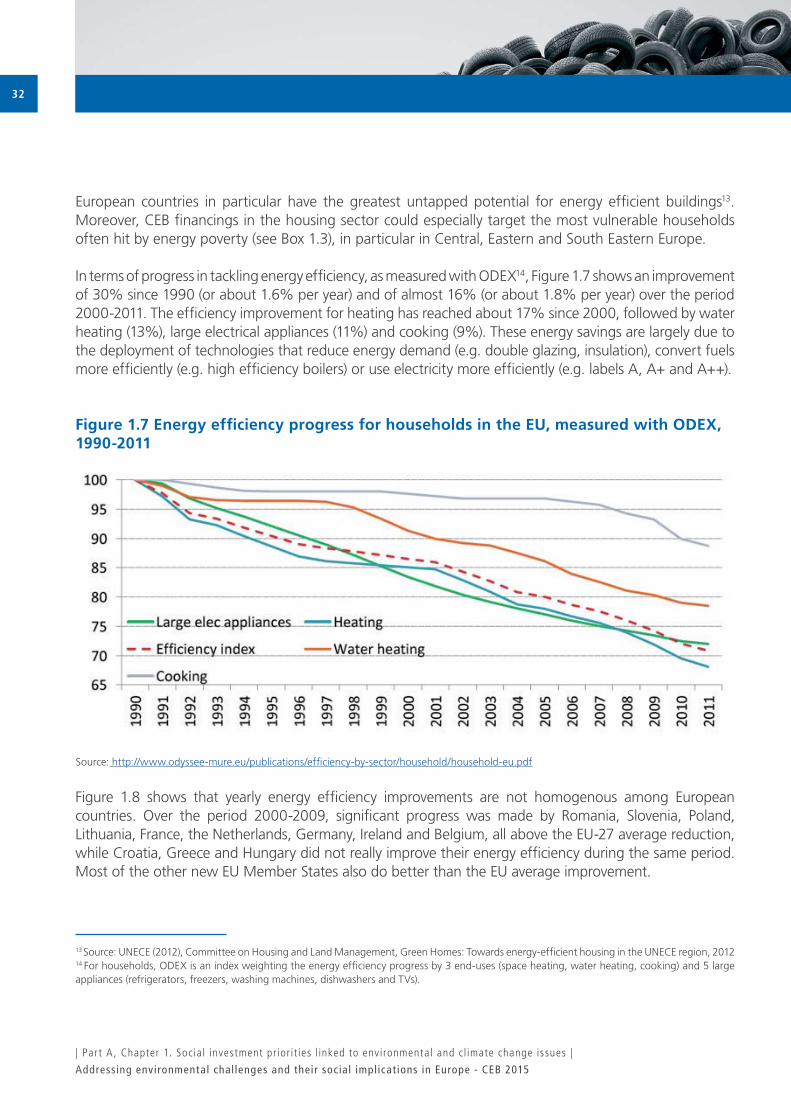
In terms of progress in tackling energy efficiency, as measured with ODEX14, Figure 1.7 shows an improvement of 30% since 1990 (or about 1.6% per year) and of almost 16% (or about 1.8% per year) over the period 2000-2011. The efficiency improvement for heating has reached about 17% since 2000, followed by water heating (13%), large electrical appliances (11%) and cooking (9%). These energy savings are largely due to the deployment of technologies that reduce energy demand (e.g. double glazing, insulation), convert fuels more efficiently (e.g. high efficiency boilers) or use electricity more efficiently (e.g. labels A, A+ and A++).
Figure 1.7 Energy efficiency progress for households in the EU, measured with ODEX, 1990-2011
Figure 1.8 shows that yearly energy efficiency improvements are not homogenous among European countries. Over the period 2000-2009, significant progress was made by Romania, Slovenia, Poland, Lithuania, France, the Netherlands, Germany, Ireland and Belgium, all above the EU-27 average reduction, while Croatia, Greece and Hungary did not really improve their energy efficiency during the same period. Most of the other new EU Member States also do better than the EU average improvement.
13 Source: UNECE (2012), Committee on Housing and Land Management, Green Homes: Towards energy-efficient housing in the UNECE region, 201214 For households, ODEX is an index weighting the energy efficiency progress by 3 end-uses (space heating, water heating, cooking) and 5 large appliances (refrigerators, freezers, washing machines, dishwashers and TVs).
Source: http://www.odyssee-mure.eu/publications/efficiency-by-sector/household/household-eu.pdf
| Par t A , Chapter 1. Social investment pr ior i t ies l inked to environmental and c l imate change issues |

Addressing environmental challenges and their social implications in Europe - CEB 2015
33
This energy efficiency improvement for the EU is now higher than the 1% per year requested by the European Commission in the Energy Services Directive (ESD, see Appendix 1), and more than half of countries are above the ESD requirement.
Figure 1.8 Change in the energy efficiency index for households by country in the period 2000-2009
Source: http://www.eea.europa.eu/data-and-maps/figures/energy-efficiency-odex-by-country-2
| Par t A , Chapter 1. Social investment pr ior i t ies l inked to environmental and c l imate change issues |

Addressing environmental challenges and their social implications in Europe - CEB 2015
34
For the CEB, it is vital to interlink energy efficiency and social objectives. Projects should ensure affordable access to energy efficiency measures, mitigation of social inequality and energy poverty, and improved social wellbeing. In this regard, the CEB is well positioned to finance such projects since it has expertise in the field of housing for lower income persons, energy efficient housing and renewable energy. The CEB is also well placed to finance energy efficiency investments benefiting the most needy or vulnerable persons, who are often more economically fragile than active populations and may be faced with energy poverty.
In this perspective, CEB financing can cover energy-saving and efficiency investments in both the rehabilitation of existing buildings and the construction of new buildings. The eco-efficient refurbishment of the building sector can involve a large spectrum of energy saving and efficiency investments, including thermal rehabilitation, efficient heating systems, water supply and electrical/lighting systems, installation of solar, photovoltaic, biomass, geothermic or wind devices for heating and electricity generation purposes. Green building construction mainly involves high levels of thermal insulation of walls, roofs and windows, efficient heating and cooling systems, the use of passive lighting and active shading, solar water heating, energy efficient appliances and lighting, use of recycled, re-used or low-energy building materials.
In the CEB’s integrated approach to sustainable urban and rural development, the greening of buildings can also cover non-residential buildings such as educational and health care facilities, cultural infrastructure and heritage sites (museums, libraries, theatres, etc.) as well as different components of local infrastructure (public transport, the residential environment, public spaces), utilities such as water supply, waste treatment or electricity and gas provision, collective urban heating and renewable energy production. Such investment needs are further described in other sections of this chapter.
| Par t A , Chapter 1. Social investment pr ior i t ies l inked to environmental and c l imate change issues |
Addressing environmental challenges and their social implications in Europe - CEB 2015
35
Box 1.3 Combating energy poverty in Europe
Between 50 million and 125 million people (or one household in seven) in Europe are estimated15 to be “fuel poor”. The term “fuel poverty” (also referred to as “energy poverty”) is used for households that have difficulties in accessing energy services at an affordable price16. Although not clearly defined in every European country17, fuel poverty results from a combination of three key factors: low household income, poor heating and insulation standards and high energy prices.
In many EU countries, not least in Central, Eastern and South Eastern Europe (CEE), it is increasingly common for low income households to either spend a large proportion of their income on energy costs thus leaving them below the poverty line or to be forced to disconnect from heat and gas supplies to save money, a problem known as “the choice between heating and eating”. This only deepens the vicious circle of social exclusion and poverty. The scale of the problem is being further exacerbated, as in many CEE countries residents have increased their use of “dirty” fuels and resorted to cheap stoves, which can have high levels of CO2 emissions and pollution, with the attendant detrimental effects on indoor air quality and health. Households are trapped in fuel poverty and society ultimately bears the cost of inequality and underdevelopment.
Covering a wide array of sectors such as housing, energy, health and social services, fuel poverty is a multidimensional issue requiring coherent solutions that take into account the various factors located at the roots of poverty. Drivers of vulnerability include living conditions (energy performance of the building, heating system) and individual circumstances (health, age, income level, education) but also market conditions (energy prices) and the social and natural context (state of the economy, climate).
When tackling fuel poverty, it is vital to interlink policies seeking to improve energy efficiency and social policies. One of the most effective and sustainable ways for consumers to reduce their building energy demand is through energy renovation that reduces the share of energy needed to reach an adequate level of thermal comfort. The issue of affordability of such investments may be addressed through specific programmes for fuel-poor households that combine several measures such as:
• Provision of financial and technical assistance to improve the energy efficiency of the dwelling so as to reduce the energy bill for fuel-poor or vulnerable households;
• Introduction of ‘social’ measures that seek to lower energy prices or increase income for energy poor households (energy subsidies, income support) so as to increase the ability of vulnerable consumers to pay for basic energy needs and protect them from potential disruptions.
The energy renovation of dwellings of fuel-poor or vulnerable households may simultaneously generate local jobs, economic growth and social inclusion.
15 Source: European Fuel Poverty and Energy Efficiency Project, co-funded by the European Union (EU)16 Source: Bouzarovski S. (2011), Energy poverty in the EU: a review of the evidence, November 201117 Without a common definition at EU level, EU Statistics on Income and Living Conditions (EU-SILC) use three indicators taken as proxies to measure fuel poverty in the EU: 1. Inability to keep home adequately warm, 2. Arrears on utility bills, and 3. Presence of a leaking roof, damp walls, floors or foundation, or rot in window frames or floors.
| Par t A , Chapter 1. Social investment pr ior i t ies l inked to environmental and c l imate change issues |

Addressing environmental challenges and their social implications in Europe - CEB 2015
36
As a social development bank, the CEB is well positioned to finance projects involving energy efficiency measures targeted to the most needy or vulnerable persons. On the one hand, the Bank possesses expertise in the field of housing for lower income persons, “green buildings” and renewable energy. On the other, it has long-standing experience in financing projects devoted to vulnerable population groups such as refugees, migrants and displaced persons, minorities, victims of natural and ecological disaster, children, the elderly and the handicapped. Last but not least, the CEB is also well placed to cooperate with its European partners so as to mobilise the resources needed to fight against energy poverty that affects too many households in Europe. And the number of fuel poor is projected to increase in the foreseeable future, in line with rising energy prices and increased fuel bills.
Cleaner and renewable energy
Promoting the use of renewable energy sources contributes to cutting GHG emissions and makes the countries less dependent on imported energy. Boosting the renewables industry also encourages technological innovation and employment in Europe. Therefore, the EU has put forward its “Climate and Energy Package” (see Appendices 1 and 2), comprising, amongst other commitments, the binding 20% target for renewable energies in final energy consumption by 202018 (and at least 10% of total fuel consumption in all forms of transport) and a binding 20% GHG reduction target by the same year (in the event of an international agreement on climate change this target will be increased to 30%). For 2030, EU leaders have agreed on the EU’s (as a whole) GHG reduction target of at least 40% compared to 1990 and on an EU-wide binding target for renewable energy of at least 27% (see Appendix 2).
One major factor for substantial CO2 reductions is to shift from fossil fuel power generation to renewable energy supplies. Renewable energy, which includes bioenergy, direct solar energy, geothermal energy, hydropower, ocean energy and wind energy, has a significant role to play in mitigating climate change. The potential to produce energy from renewable sources depends considerably on the region. Coastal regions tend to have greater potential for producing wind energy and Southern countries are more suitable for the production of solar energy, while the production of hydropower and geothermal is restricted to particular locations. Solar technologies clearly dominate the renewable supply potential within urban areas, whereas wind energy, biomass and hydropower can provide high renewable fractions outside cities. But outside of these natural limitations, the ability to make full use of renewable energy potential also depends on the policy environment, the existing regional transmission, distribution and storage infrastructure, as well as the pattern of demand.
Increasing the share of renewable energies in Europe’s fuel mix will result in significantly lower greenhouse gas emissions. Wind, solar, hydropower, ocean and geothermal energy do not contain any fossil carbon
18 Directive 2009/28/EC on the promotion of the use of energy from renewable sources set individual targets for all Member States with a view to reaching an overall EU target of a 20% share of total energy consumption from renewables by 2020. The targets take into account the different starting points of the Member States, the renewable energy potential and economic performance. In 2009 alone, CO2 emissions were reduced by about 340 million tonnes or 7% against 1990 levels in the EU through the use of renewable energy sources. Given a carbon price of about €15/t in 2009 this emission reduction benefit equals about € 51 billion.
| Par t A , Chapter 1. Social investment pr ior i t ies l inked to environmental and c l imate change issues |

Addressing environmental challenges and their social implications in Europe - CEB 2015
37
atoms to form climate-damaging CO2 during combustion. In principle, biomass - stored solar energy- is CO2-neutral as it absorbs the same amount of CO2 during its growth period as is emitted during its combustion. Hence, renewable energy is not only resource compatible, but also climate compatible.
Figure 1.9 Share of renewable energy in gross final energy consumption (in %)
In 2012, the share of renewables (RES) in gross final energy consumption (see Figure 1.9) in the EU-28 stood at 14.1%. Across Europe, the highest share of consumption from RES was recorded in Norway (64.5%) and Sweden (51%), while more than 30% of the final energy consumption was derived from RES in Latvia (35.8%), Finland (34.3%) and Austria (32.1%). Compared to 2012, the indicative targets for France, Ireland, the United Kingdom, the Netherlands and Malta require each of these countries to increase their share of renewables in final energy consumption by around 10 percentage points. In contrast, Bulgaria, Estonia and Sweden have already exceeded their targets and Austria, Finland, Latvia, Lithuania, Norway, Romania and Sweden are very close to their targets.
The CEB can contribute to enhancing the use of renewable energy in many different types of small-scale infrastructure. In addition to solar, photovoltaic, biomass, geothermic or wind devices for heating and electricity generation purposes in residential and non-residential buildings, the CEB can also partially finance investments in renewable energy production.
Source: http://epp.eurostat.ec.europa.eu/tgm/table.do?tab=table&init=1&plugin=1&language=en&pcode=tsdcc110
| Par t A , Chapter 1. Social investment pr ior i t ies l inked to environmental and c l imate change issues |

Addressing environmental challenges and their social implications in Europe - CEB 2015
38
19 Source: UNEP (2011), Cities: Investing in energy and resource efficiency.
Sustainable public transport
Urban areas are now home to around 75% of the population in CEB member countries and account for 60-80% of energy consumption and 75% of carbon emissions19. With increasing urbanisation (see Chapter 2) environmental priorities are progressively evolving from brown (waste disposal and water quality) and grey issues (air and chemical pollutants) to green issues (sustainability). Urban living offers a wealth of social and cultural opportunities, and urban transport provides access to them, as well as to work and training. However, transport can also have a negative impact on the quality of life. Key impacts relate to health and the environment, for example noise, road safety and air pollution. There are also wider impacts relating to well-being, including congestion and associated stress and social exclusion.
It is not only the technological attributes of buildings and their interiors that contribute to reducing energy use (as described in the previous section), but also the very spatial and density attributes of communities and cities at large. In the case of higher residential density in urban areas, the provision of sustainable transport is an important consideration for improved air quality, energy savings, reduced congestion and lower greenhouse gas emissions, since such measures typically reduce vehicle use and bring more efficiency to energy consumption. On average, urban transport is responsible for 40% of road transport CO2 emissions and for 10% of the total CO2 emissions in the EU. Given the relatively high use of public transport (see Figure 1.10) in CEB target countries (e.g. Bulgaria, Poland and Turkey), updating and greening public transportation systems will be challenging.
Greening public transport (see Appendix 1) is one of the possible ways of limiting noise, pollution, energy use and land take resulting from individual car transport. Better and cleaner public transport is important for city and suburban commuters. Nevertheless, it is also a necessary precondition for the social and economic viability of rural areas. The mobility of large categories of people who do not have access to a car - usually lower-income or older people, women, children - is dependent on public transport.
Within its integrated approach to sustainable development, the CEB can partially finance different components of urban and rural infrastructure such as sustainable and integrated public transport, local road network infrastructure, the residential environment, public spaces, etc. In urban areas in particular, the Bank can finance projects concerned with protection against noise nuisance and the reduction of air pollution.
| Par t A , Chapter 1. Social investment pr ior i t ies l inked to environmental and c l imate change issues |

Addressing environmental challenges and their social implications in Europe - CEB 2015
39
Figure 1.10 Equipment rate for public transport vehicles (motor coaches, buses and trolleybuses), i.e. number of public transport vehicles per 1,000 inhabitants, 2011
Source: http://epp.eurostat.ec.europa.eu/cache/GISCO/yearbook2013/1003EN.pdf
| Par t A , Chapter 1. Social investment pr ior i t ies l inked to environmental and c l imate change issues |

Addressing environmental challenges and their social implications in Europe - CEB 2015
40
1.3 Climate change adaptation: strengthening resilience to (extreme) climate events
Adaptation consists of actions responding to current and future climate change impacts and vulnerabilities (as well as to the climate variability that occurs in the absence of climate change) within the context of on-going and expected societal change20. This means not only protecting against the negative impacts of climate change, but also building resilience and taking advantage of any benefits it may bring (see Box 1.2). The earlier adaptation responses are planned and implemented, the better equipped societies will be to cope with the challenges. In many respects, adaptation can be seen as a process of managing society’s portfolio of assets. These assets include built infrastructure, natural environment, society and economy.
A first step towards adaptation to future climate change is reducing vulnerability and exposure to present climate variability. Adaptation is not a one-off measure; it can be seen as a continuous process, involving forward-looking anticipatory measures. Adaptation is place- and context-specific, with no single approach for reducing risks. Effective risk reduction and adaptation actions have to consider the dynamics of vulnerability (i.e. the propensity or predisposition to be adversely affected) and exposure (i.e. the presence of people, livelihoods, species or ecosystems, environmental functions, services, resources, infrastructure or economic, social or cultural assets in places and settings that could be adversely affected) and their linkages with socioeconomic processes, natural variability, sustainable development and climate change (see Figure 1.11).
Figure 1.11 Climate extremes, exposure and vulnerability
Source: IPCC (2012), Special Report on Managing the Risks of Extreme Events and Disasters to Advance Climate Change Adaptation (SREX)
| Par t A , Chapter 1. Social investment pr ior i t ies l inked to environmental and c l imate change issues |

Addressing environmental challenges and their social implications in Europe - CEB 2015
41
Adaptation options can be grouped under three broad categories (see Box 2.3): “grey” options that rely on technology and civil engineering projects; “green” options that make use of nature; and “soft” options that aim at altering human behaviour and styles of governance. Often, implementing a combination of these measures is an effective way to ensure resilience. In addition, measures that provide benefits under the current climate and future climate change scenarios, called “low-regret” measures21, are the starting points for addressing projected trends in exposure, vulnerability and climate extremes. They have the potential to offer benefits now and to lay the foundation for addressing projected changes. Many of these low-regret strategies produce co-benefits, help address other development goals, such as improvements in livelihoods, human well-being and biodiversity conservation, and help minimise the scope for maladaptation22.
Urban and rural adaptation
There are considerable differences in the character and severity of the consequences of climate change with which CEB countries, regions and geographical zones will have to cope (see Chapter 2).
Three quarters of the population in CEB countries live in urban areas and this is where, according to the IPCC (2014)23, many global risks of climate change are concentrated and will be most apparent in everyday life. Heat stress, extreme precipitation, inland and coastal flooding, landslides, air pollution, drought, and water scarcity pose risks for people, assets, economies and ecosystems. Risks are amplified for those lacking essential infrastructure and services or living in poor-quality housing and exposed areas. Urban adaptation based on reducing basic service deficits and building climate-resilient infrastructure can significantly reduce vulnerability and exposure in urban areas. At the same time, urban adaptation to climate change offers opportunities for developing new jobs and promoting innovation.
In rural areas23, major future climate change impacts are expected on water availability and supply, food security and agricultural incomes, including shifts in the production areas of food and non-food crops. These impacts are likely to disproportionally affect the welfare of the poor in rural areas, such as female-headed households and those with limited access to land, modern agricultural inputs, infrastructure and education. Further adaptation to agriculture, water, forestry and biodiversity, and investment in infrastructure can enhance the long-term resilience of rural settings and allow adjustment to climate change impacts on rural communities.
20 Source: EEA (2013), Adaptation in Europe. Addressing risks and opportunities from climate change in the context of socio-economic development, 03/201321 Low-regret measures include early warning systems; risk communication between decision makers and local citizens; sustainable land management, and ecosystem management and restoration. Other low-regret measures include improvements to health surveillance, water supply, sanitation, irrigation and drainage systems; development and enforcement of building codes; better education and awareness.22 Maladaptation occurs when specific adaptation actions: (1) do not increase resilience/adaptive capacity or do not reduce vulnerability; (2) are not sustainable from an environmental, economic or social perspective (e.g. over-exploitation of water resources); or (3) conflict with other long-term policy objectives, such as climate change mitigation targets (EEA, 2009; IPCC, 2007). Maladaptation can be avoided by considering both the climatic and the socio-economic elements that constitute vulnerability to climate change. 23 Source: IPCC (2014): Summary for Policymakers. In: Climate Change 2014: Impacts, Adaptation, and Vulnerability. Part A: Global and Sectoral Aspects. Contribution of Working Group II to the Fifth Assessment Report of the Intergovernmental Panel on Climate Change [Field, C.B., V.R. Barros, D.J. Dokken, K.J. Mach, M.D. Mastrandrea, T.E. Bilir, M. Chatterjee, K.L. Ebi, Y.O. Estrada, R.C. Genova, B. Girma, E.S. Kissel, A.N. Levy, S. MacCracken, P.R. Mastrandrea, and L.L. White (eds.)]. Cambridge University Press, Cambridge, United Kingdom and New York, NY, USA, pp. 1-32
| Par t A , Chapter 1. Social investment pr ior i t ies l inked to environmental and c l imate change issues |

Addressing environmental challenges and their social implications in Europe - CEB 2015
42
The impacts of climate change are particularly pertinent to infrastructure and buildings in both urban and rural areas given their long lifespan, high initial costs and their essential role in the functioning of our societies and economies. Buildings and infrastructure can be vulnerable to climate change because of their design (low resistance to extreme weather events) or location (e.g. in flood-prone areas, landslides, avalanches). They can be damaged or rendered unfit for use by any changing climatic condition or extreme weather event: rising sea levels, extreme precipitation and floods, extreme low or high temperatures, heavy snowfalls, strong winds, etc.
Making infrastructure resilient to climate change is an important adaptation challenge. Even though such investments often come with higher up-front costs24, their climate resilience makes them more profitable over the lifetime of the infrastructure. Climate change may also affect where infrastructure is built and how it is designed and operated. There will also be a need for additional infrastructure dedicated to climate protection such as improved sea defences and flood protection, interconnections in water supply, and retrofitting to improve resilience of existing infrastructure.
The severity of climate impacts on infrastructure will vary across Europe according to individual locations and their geophysical risk exposure, existing adaptive capacity and resilience, and the levels of regional economic development. Medium- and long-term climatic trends (e.g. increasing average temperatures, modified rainfall patterns) and an inherently rising frequency of extreme weather events impact differently from site to site. Climate impacts not only show regional and seasonal patterns (e.g. North/South, winter/summer) but also differ between territorial settings (e.g. urban/rural/coastal). Adapting infrastructure thus requires a complex, site-based analysis of the different trends and impact patterns.
Last but not least, climate change is strongly intertwined with other socio-economic changes. Demographic trends such as ageing populations and rapid urbanisation (see Chapter 2) can exacerbate the climate risks. An ageing population increases the share of people vulnerable to heat waves. Urbanisation also reduces the area available for natural flood management or increases the number of homes and businesses actually in flood-prone areas. Competing demand for water from the public and sectors such as industry and agriculture (addressed in this chapter) leads to regional water scarcity. These socio-economic changes further increase the vulnerability of people, property and ecosystems under current climate conditions as long as no adaptation measures are taken.
24 Such climate proofing can be expected to increase costs for infrastructure projects. According to the World Bank study (2009, The Costs of Adapting to Climate Change for Infrastructure), the net cost of adapting infrastructure to climate change is around 1-2% of the total cost of providing that infrastructure. Overall, the cost of adaptation appears small in relation to other factors that may influence the future costs of infrastructure.
| Par t A , Chapter 1. Social investment pr ior i t ies l inked to environmental and c l imate change issues |

Addressing environmental challenges and their social implications in Europe - CEB 2015
43
Over the coming decades, existing and future buildings and infrastructure therefore need huge investments, alongside those for climate-proofing, in order to keep them functioning and delivering services. This means incorporating climate change adaptation actions into building standards and retrofitting activities, such as ensuring that sewerage systems can cope with heavier precipitation, reviewing building design to better insulate against heat and adapting the energy and transport systems to cope with higher temperatures, low water availability or flooding. In this perspective, the CEB can support such adaptation infrastructure investments in close cooperation with the national, regional and local governments in its member countries.
Disaster risk management
According to the IPCC (2012)25, one of the most important consequences of climate change will be the increase in the frequency and/or magnitude of extreme events such as floods, droughts, windstorms and heat waves. Climate change may also trigger other hazards in which climate or weather conditions play a fundamental role, such as avalanches, landslides and forest fires.
Adaptation to climate change and disaster risk reduction share the same ultimate goal: to reduce vulnerability to hazardous events and increase resilience to the potential adverse impacts of climate extremes, even though risks cannot fully be eliminated. They provide a range of complementary approaches for managing the risks of climate extremes and disasters. Risk reduction and prevention in the short- and medium-term will primarily address socio-economic developments and climate variability in order to reduce the impacts of natural and technical hazards, while adaptation aims at developing longer-term planning to address climate change impacts. Preparedness refers to the readiness of human and natural systems to undergo gradual change through flexibility in practices and governance, and is a key common element of adaptation and disaster risk reduction actions.
Taking steps to reduce the risks to people and infrastructure from climate-related disasters is a worthwhile endeavour that will pay off over time. By investing in strategies and systems for lowering the risk from one hazard, a government is strengthening a society’s capacity to prepare for and adapt to a range of other threats. Planning for the extremes will lessen physical damage and save lives, while softening the economic impact.
Disaster risk reduction and management in Europe has shifted from a response-oriented approach towards an Integrated Risk Management (IRM) approach that includes prevention, preparedness, response and recovery. From an environmental perspective, the focus is on prevention and preparation, given the main synergies with environmental protection and integration with ecosystem-based management. Measures addressing the reduction of risks have ensured improved safety for populations, infrastructure and the environment, for example, in the case of avalanches, where IRM has already reached an advanced level and incorporates technical measures developed and implemented during the last five decades.
25 Source: IPCC (2012) Special Report on Managing the Risks of Extreme Events and Disasters to Advance Climate Change Adaptation (SREX)
| Par t A , Chapter 1. Social investment pr ior i t ies l inked to environmental and c l imate change issues |

Addressing environmental challenges and their social implications in Europe - CEB 2015
44
Nevertheless, more effort is needed to implement such an integrated risk management approach throughout Europe that would address all hazards. It is important to enhance early warning systems, public awareness campaigns, implementation of evacuation procedures and decision support tools. There is a need to improve technical and biological measures (such as protection of forests) and spatial planning (including, e.g. the appropriate separation of establishments, infrastructure and residential settlements in industrial areas). Spatial planning can be a very powerful tool for effectively and efficiently reducing the potential impact of natural or technological hazards. Nevertheless, correcting or improving the ‘legacy of the past’ (i.e. deficient spatial planning in former times) still presents a challenge.
Risk reduction policies exist in many European countries. They are aimed at numerous hazards (e.g. forest fires, floods, earthquakes). However, these policies across Europe have either not yet been harmonised (e.g. avalanches, forest fires) or the process has only started recently (e.g. floods). Concerted and coordinated actions at the European level, such as those implemented under the Floods Directive (see Appendix 1), can bring considerable added value and are likely to strengthen the protection of populations, infrastructure and ecosystems throughout Europe.
For most CEB target countries in particular, there is both the opportunity and the need to catch up with advances in systems for managing disaster risks. Sophisticated disaster risk management would lessen countries’ vulnerability to weather extremes; and improved weather tracking and forecasting would help anticipate emergencies and provide protection for human life and critical structures. By making the necessary investments today, countries would not only contain losses from disasters but would build a variety of useful capacities that would benefit other sectors such as agriculture, aviation and energy.
The significant variation in exposure and sensitivity across Europe implies a need for locally determined disaster risk management plans. Each locality must be able to analyse specific risks and to define programmes that address the most urgent threats. Investments that actually mitigate the risks by making infrastructure, people and ecological systems less vulnerable to damage from a climate-induced disaster would mainly include:
• Retrofitting of existing structures to withstand natural disasters. Examples include installing back-up valves in sewage and water pipes, elevating structures and installing storm shutters or strengthening foundations.
• Regulations: by controlling the use of land and the construction of buildings, governments can significantly reduce the potential losses from disasters. In some cases, risks could be lowered simply by enforcing existing zoning and building codes.
• Protective structures: structures such as sea walls and levees can protect buildings and people and mitigate the impact of floods and storms.
• Better natural resource management- controlling erosion, managing forests and restoring wetlands preserves ecosystem services that minimise the risk of disasters.
• Modernising of weather forecasting and hydro-meteorological services.
| Par t A , Chapter 1. Social investment pr ior i t ies l inked to environmental and c l imate change issues |

Addressing environmental challenges and their social implications in Europe - CEB 2015
45
The CEB fully recognises the need for investments in measures aimed at providing lasting solutions for reducing vulnerability to natural disasters, reversing environmental degradation and promoting the countries’ sustainable development and adherence to national and international environmental standards. This goes hand in hand with the CEB’s pro-active approach to tackling climate change related events first and foremost through adaptation rather than emergency reconstruction.
Action to address potential risks from climate-driven migration
Although economic and political factors remain dominant in the decision to migrate, environmental change is becoming increasingly important in the context of climate change. The impacts of climate change are expected to exert significant pressure on cross-border and internal population movement. Millions of people could be compelled to move between countries and regions, to seek new sources of water and food if these fall below critical thresholds. Rising sea levels may force others to move out of low-lying coastal zones.
The concept of “environmental refugees” was introduced in 1976 by Lester Brown from the Worldwatch Institute26. Since then, several terms such as “environmental migrants”, “climate refugees” or “environmentally displaced persons” have been interchangeably used. The International Organisation for Migration (IOM) recommends the following definition for environmental migrants: “Environmental migrants are persons or groups of persons who, for compelling reasons of sudden or progressive changes in the environment that adversely affect their lives or living conditions, are obliged to leave their habitual homes, or choose to do so, either temporarily or permanently, and who move either within their country or abroad”.
The exact number of environmentally induced migrants is very difficult to estimate. This is due to the difficulty of disaggregating the linkages between the multiple causes of migration, and because most environmentally induced migration takes place not across international borders but within countries. Indeed, it has been estimated that on a general level, international migration makes up only about one-fifth of all migration in the world. When it comes to environmental migration, those who are most vulnerable to environmental change (poor populations in less developed countries) are also those who are less likely to be able to migrate internationally.
Furthermore, it is difficult to forecast the number of environmentally induced migrants over any given period of time because environmental changes are themselves difficult to predict. For cases of gradual environmental degradation in particular, political, social, and economic factors play a major role in the choices made by migrants. The number largely depends on the extent of future environmental degradation as well as on the level of investment, planning and resources that are at a government’s disposal to adapt to and mitigate the results of environmental change. Estimates of the numbers of environmentally induced migrants and their future development are therefore divergent. In 2005, the UN Refugee Agency
26 Source: Brown L., Mcgrath P. and Stokes B., (1976). Twenty two dimensions of the population problem, Worldwatch Paper 5, Washington DC: Worldwatch Institute
| Par t A , Chapter 1. Social investment pr ior i t ies l inked to environmental and c l imate change issues |

Addressing environmental challenges and their social implications in Europe - CEB 2015
46
(UNHCR) estimated that as of that date there were 24 million people affected. In assessing the current state of knowledge on the subject27, the IOM found that 200 million potentially displaced persons by 2050 is the most frequently cited figure, but projections vary widely from 25 million to one billion.
Countries that have a low capacity to adapt to environmental change, as well as countries with particularly susceptible geographies, such as small island states, are the most vulnerable to the effect of environmental degradation and climate change. The developing world tends to be particularly affected. According to the IOM27, about 95% of all fatalities due to climate change related disasters occur in developing countries. Cities in developing countries may be particularly affected, as they face the dual challenges of population growth due to increased rural-to-urban migration and increasing vulnerability due to the effects of global environmental change. Africa, which is one of the most vulnerable continents to climate change and climate variability28, could potentially fuel climate-related migration in the direction of (Southern) Europe. The IPCC29 estimated that, by the 2080s, the proportion of arid and semi-arid lands in Africa is likely to increase by 5-8%. About 25% of Africa’s population (about 200 million people) currently already experience high water stress. The population at risk of increased water stress in Africa is projected to be between 75-250 million and 350-600 million people by the 2020s and 2050s, respectively.
Environmentally induced migration can have positive and negative consequences – a factor that affects how policies are formulated. The negative impacts stem particularly from emergency mass movements that are generally related to intensified natural disasters. These movements most closely resemble refugee movements and often require large-scale humanitarian assistance. Negative impacts may also occur if large numbers of people spontaneously relocate from rural to urban areas that are not ready to absorb them in terms of housing, infrastructure, jobs and services. Most of these movements are likely to be internal, and many will likely challenge the resources of already impoverished countries. The more positive impacts occur when migration is a voluntary coping strategy that allows people time to weigh alternatives and to use migration as a way of reducing household risk. In addition, migration could potentially help slow the process of environmental degradation and allow those who remain in affected communities to adjust their livelihood strategies by changing their agricultural practices or, for instance, shifting to non-agricultural activities.
Therefore, adaptation and disaster risk reduction policies can involve:
• local actions to reduce the need for individuals to migrate, or • migration as an adaptation/risk reduction strategy that allows a community or household to cope with
changes and, perhaps, reduce risk for others.
27 Source: International Organisation for Migration (2009), Migration, Environment and Climate Change: Assessing the Evidence28 Out of the 28 countries that are in danger of suffering from climate change, 22 are located in Africa. (Source: International Organisation for Migration (2009), Migration, Environment and Climate Change: Assessing the Evidence)29 Source: IPCC (2007), Assessment Report: Impacts, Adaptation and Vulnerability
| Par t A , Chapter 1. Social investment pr ior i t ies l inked to environmental and c l imate change issues |

Addressing environmental challenges and their social implications in Europe - CEB 2015
47
While environmental change is expected to continue impacting migration into the future, its effects can to some extent be mitigated via a bi-pronged policy action that works to reduce the impact of climate change while simultaneously taking a planned approach to migration30. Migration can be seen as a means of adaptation to climate change by helping to ease people out of vulnerable situations and, if managed appropriately, can in some cases serve to benefit both source and destination communities and build long-term resilience.
Aid to refugees, migrants and displaced persons is one of the CEB’s statutory priorities31. Founded in 1956 in the post-war context of increased migratory flows to Western Europe, the Bank has seen subsequent enlargements in its membership, particularly after the fall of the Berlin wall, which have turned its attention to migratory flows in South-Eastern Europe. Over almost sixty years of the Bank’s existence, projects have been financed specifically to assist refugees and displaced persons in the aftermath of crisis situations, for the (re)construction of housing, urban and social infrastructure for migrants, both at international and country level, for education and professional training for young migrants, for the stabilisation of population flows in rural areas and for social integration programmes in host countries.
The issue of “climate change and migration” is new on the political agenda and is likely to shape national policies in the future. It should be noted that the CEB is not involved in policy making. The Bank’s projects are designed and implemented in a given context to assist the countries faced with migration issues at their request. Despite the difficulty in forecasting migratory flows in/to CEB member countries in the future, the CEB intends to continue its action in the field of migration in the coming years at the request of the countries concerned. The Bank’s action will generally be focused on projects that contribute to containing migratory pressures, facilitating return whenever it is desired and/or promoting the integration of populations in host countries. The issue of “environmental refugees” could also be considered for CEB activities.
30 Source: Source: EEA (2013), Targeted support to the update of analysis of global megatrends for the European Environment State and Outlook Report 2015 Global megatrends assessment, Increasing divergence in global population trends: Analysis for update and improved assessment of this megatrend, 25 July 2013.31 Article 2 of the Articles of Agreement states: “The primary purpose of the [Fund]/Bank is to help in solving the social problems with which European countries are or may be faced as a result of the presence of refugees, displaced persons or migrants consequent upon movements of refugees or other forced movements of populations and as a result of the presence of victims of natural or ecological disasters. The investment projects to which the [Fund]/Bank contributes may be intended either to help such people in the country in which they find themselves or to enable them to return to their countries of origin when the conditions for return are met or, where applicable, to settle in another host country.”
| Par t A , Chapter 1. Social investment pr ior i t ies l inked to environmental and c l imate change issues |

Addressing environmental challenges and their social implications in Europe - CEB 2015
48
| Main environmental issues and their implicat ions for CEB operat ions |

2. A regional analysis of environmental pressures across CEB member countries

Addressing environmental challenges and their social implications in Europe - CEB 2015
50
This chapter explores the geographical patterns for environmental and social investment, previously described in Chapter 1. It starts by identifying how different regions across CEB countries will be affected by environmental pressures and then links the projected impacts with potential demand.
The chapter largely follows the taxonomy for Europe employed by the European Environment Agency (EEA) and the Intergovernmental Panel on Climate Change (IPCC) (see Box 2.1).
All regions across CEB countries (see Table 2.1) will experience different degrees of vulnerability to environmental challenges depending not only on climate change impacts and socio-economic processes, such as rapid urbanisation, but also on the adaptive capacity of countries to respond to the implications of such projections.
Box 2.1 The European Environment Agency (EEA) and the Intergovernmental Panel on Climate Change (IPCC)
Established in 1990 and operational since 1994, the EEA is an agency of the European Union. Its core objective is to produce European, pan-European and regional integrated environmental data and indicator sets, assessments and thematic analyses. At the time of writing, the EEA had 33 member countries and six cooperating countries, of which 37 were CEB member countries, i.e. except for Georgia, Holy See, San Marino and Republic of Moldova (see Figure 2 in Appendix 3).Source: EEA website
Set up in 1988 by the World Meteorological Organization and United Nations Environment Programme (UNEP), the IPCC is the international body for assessing the science related to climate change. It produces regular assessments of the scientific basis of climate change, its impacts and future risks, and options for adaptation and mitigation. Source: IPCC website
At the time of writing, the EEA report on “Climate change, impacts and vulnerability” published in 2012 and the IPCC’s Fifth Assessment Report “Climate Change 2014: Impacts, Adaptation, and Vulnerability” released in November 2014 were the latest comprehensive scientific and technical assessments of climate change for Europe. This study, and in particular this chapter, makes substantial reference to the conclusions and taxonomies from these two reports. Regarding climate projections, the study makes reference mainly to the IPPC’s report as the IPCC draws on a range of scenarios and models, contrary to the EEA report, built around one scenario.
| Par t A , Chapter 2. A regional analysis of environmental pressures across CEB member countr ies |

Addressing environmental challenges and their social implications in Europe - CEB 2015
51
Table 2.1 Regional classification of CEB countries
Source: CEB table based on the IPCC’s sub-regional classification of Europe, see Figure 1 in Appendix 3.Notes: (1) Holy See, Liechtenstein and San Marino are not included in the table. (2) Georgia is classified as West Asia in the IPCC’s 2014 assessment report and is not included in the table either.
Alpine Atlantic Continental Northern Southern
CEB target countries
Albania - Albania Estonia Albania
Bosnia and Herzegovina Bosnia and Herzegovina Latvia Bosnia and Herzegovina
Bulgaria Bulgaria Lithuania Bulgaria
Czech Republic Croatia Poland Croatia
Kosovo Czech Republic Cyprus
“the former Yugoslav Republic of Macedonia”
Hungary “the former Yugoslav Republic of Macedonia”
Montenegro Kosovo Malta
Poland “the former Yugoslav Republic of Macedonia”
Montenegro
Romania Poland Slovenia
Serbia Republic of Moldova Turkey
Slovak Republic Romania
Slovenia Serbia
Turkey Slovak Republic
Slovenia
CEB non-target countries
Finland Belgium Belgium Finland France
France Denmark France Iceland Greece
Germany France Germany Norway Italy
Italy Germany Luxembourg Sweden Portugal
Norway Ireland Switzerland Spain
Spain Luxembourg
Sweden Netherlands
Switzerland Portugal
Spain
| Par t A , Chapter 2. A regional analysis of environmental pressures across CEB member countr ies |

Addressing environmental challenges and their social implications in Europe - CEB 2015
52
2.1 Key climate projections
When it comes to climate projections, data availability is often a significant constraint in performing different model simulations, adding to the uncertainty of estimates. Nevertheless, the IPCC report published in November 2014, citing over 12,000 scientific references, is considered a useful indicator of the scope of climate change32, disclosing confidence levels attached to forecasts.
According to the IPCC, observed climate trends and future climate projections show regionally and seasonally varying changes in temperature and rainfall in Europe (high confidence).
• Since the 1980s, the largest temperature increases have been registered in Northern Europe, especially in winter, and in Southern Europe mostly in summer. During 2071-2100, compared to 1971-2000, land temperature is projected to increase in the range of 1.9˚C (lower bound for the Atlantic region) to 5.8˚C (upper bound for the Northern region) (see Appendix 3). For comparison, the period 2002-2011, when the average temperature was 1.3˚C±0.11˚C above the pre-industrial level (1850-1899), is already considered the warmest decade on record.
• Precipitation changes show more spatial and temporal variability, with continued increases projected for Northern Europe (from a 4% to a 28% increase in annual total precipitation for 2071-2100 compared to 1971-2000), most notably during winter, and decreases in Southern Europe (from a 7% to a 24% decrease for the same period), most notably during summer, with less clear trends in Continental Europe (medium confidence) (see Appendix 3).
More extreme climate events
According to the IPCC, climate projections show a marked increase in temperature extremes towards increased numbers of hot days, tropical nights and heat waves (high confidence), droughts (medium confidence), heavy precipitation events (high confidence) (see Appendix 3) and extreme sea level events, with variations across Europe. Small or no changes in wind speed extremes (low confidence) are expected, except for increases in winter wind speed extremes over Central and Northern Europe (medium confidence).
• More frequent and intense heat waves are projected in particular for Southern Europe (high confidence). Two to almost five more months of warm spells33 per year are expected in Southern Europe in 2071-2100 compared to 1971-2000 (see Appendix 3). In 2007, for example, Greece already witnessed the hottest summer on record since 1891. A mega-fire destroyed several protected conservation sites, caused 80 deaths, burned 575,500 hectares and burned or rendered uninhabitable 1,710 buildings.
32 The majority of published assessments are based on climate projections in the range of 1˚C to 4˚C global mean temperature per century. Limited evidence exists regarding the potential impacts in Europe under high rates of warming (>4˚C global mean temperature per century), leading, among others, to a large increase in coastal flood risk. Source: IPCC (2014)33 Warm spell duration index in days per year: annual count of days with at least 6 consecutive days when TX > 90th percentile. Let TXij be the daily maximum temperature on day i in period j and let TXin90 be the calendar day 90th percentile centered on a 5-day window for the base period 1971-2000. Then the number of days per period is summed where, in intervals of at least 6 consecutive days: TXij> TXin90. Source: IPCC (2014)
| Par t A , Chapter 2. A regional analysis of environmental pressures across CEB member countr ies |

Addressing environmental challenges and their social implications in Europe - CEB 2015
53
Another example from the last decade is France in 2011, when the hottest and driest spring since 1880 led to reductions in snow cover for skiing and an 8% decline in wheat yield.
• The analysis of droughts is more complex given not only the lack of long-term observational data but also the different definitions of drought: meteorological, agricultural and hydrological. Southern Europe shows trends, although inconsistent, towards more intense and longer meteorological droughts. When considering the different definitions, droughts are projected to become longer and more intense in Central and Southern Europe and the Mediterranean as far as the UK (medium confidence). Even in regions where summer precipitation is expected to increase, soil moisture and hydrological droughts may become more severe due to increasing evapotranspiration.
• Increased extreme precipitation is expected in Northern Europe, during all seasons, and in Continental Europe, except for summer (high confidence). Projections are regionally and seasonally different for Southern Europe (see Appendix 3). Extreme sea level events will increase (high confidence), mainly due to the global mean sea level increase. Significant increases are projected in the Eastern Northern Sea.
• Sea level rises together with increases in extreme rainfall are projected to further increase coastal and river flood risks.
Atlantic, Northern and Southern Europe are the regions projected to be most affected by coastal flooding. Without adaptation, direct costs stemming from sea level rise in the EU-27 could reach € 17 billion per year by 2100, with indirect costs also estimated for land-locked countries. Countries with high absolute damage costs include the Netherlands, Germany, France, Belgium, Denmark, Spain and Italy.
Central and Northern Europe are expected to be most affected by river and pluvial flooding. In the EU-15, river flooding could affect 250,000-400,000 additional people by the 2080s and more than double annual average damage. Recent major flood events in CEB countries include the 2013 floods in Germany and the spring 2014 floods in the Western Balkans.
| Par t A , Chapter 2. A regional analysis of environmental pressures across CEB member countr ies |

Addressing environmental challenges and their social implications in Europe - CEB 2015
54
2.2 Major non-climate trend: increasing urbanisation
Europe is a highly urbanised continent with 75% of the population living in cities today (see Table 2.2) and 80% in the near future34. According to the IPCC, urban development is projected to increase across all CEB countries, particularly rapidly in Eastern Europe (see Figure 2.1), with the magnitude depending on population growth, economic development and land use planning policies.
Figure 2.1 Urban population in Eastern Europe and Western Europe
Eastern Europe
34 PLUREL: Peri-urban Land Use Relationships – Strategies and Sustainability Assessment Tools for Urban – Rural Linkages.
| Par t A , Chapter 2. A regional analysis of environmental pressures across CEB member countr ies |

Addressing environmental challenges and their social implications in Europe - CEB 2015
55
Source: Shared Socio-Economic Pathway Scenarios (SSPs) Database, accessed on 9 July 2014
What is specific about the urbanisation trend in Europe is that, instead of continued growth of the major urban centres, it has rather been characterised by a trend known as peri-urbanisation – when regions of big and small cities and towns and rural areas are integrated into urban-rural regions, entailing a shift from mainly rural towards urban land uses and activities with not only physical but also socio-economic transformations. This conversion is generally rapid and unpredictable. According to PLUREL, peri-urban areas are growing four times faster than urban areas, a rate which, if continued, would double their area of 48,000 sq. km between 2040 and 2060 (see Table 2.2). Peri-urban growth is likely to continue especially in the conversion regions of Southern, Central and Eastern Europe, with increasing welfare, changing lifestyle and consumption patterns.
| Par t A , Chapter 2. A regional analysis of environmental pressures across CEB member countr ies |
Western Europe

Addressing environmental challenges and their social implications in Europe - CEB 2015
56
Table 2.2 Area types in the EU-27
The peri-urbanisation trend has an impact on land use and functional linkages between urban and rural areas with deep consequences for human quality of life, the environment and ecosystem services, i.e. the demand for and supply of water, food and recreation in natural settings. In many cases, the result is sprawl, with increasing problems of social segregation, urban decline, wasted land and oil dependency for transport. For example, in the Western Balkans the growing sprawl around many cities and towns and along coastlines is generating higher levels of urban waste. In these countries, this phenomenon is aggravated by the legacies of illegal waste dumping and old industrial sites. Peri-urbanisation thus sets a new context for sustainable development as there are potential solutions for improved quality of life, green infrastructure, better linkages between city and countryside and more sustainable urban and rural development.35 36
In Eastern Europe, the challenges associated with the rapid pace of urbanisation also stem from pressures on fresh water supplies, sewerage, the living environment and public health, which affect the urban poor most. For example, in many countries in this region, sewerage systems are far better at meeting the needs of upper- and middle-class neighbourhoods than they are at servicing poorer neighbourhoods, particularly unregulated neighbourhoods and slums37 on the urban periphery. These neighbourhoods, which grow most rapidly due to migration or concentration of ethnic minorities, are characterised by their crowdedness and lack of urban development standards, including lack of access to safe drinking water and waste and wastewater disposal facilities,38 potentially leading to spatial poverty traps. Providing adequate infrastructure for roads, water, sanitation and electricity is thus a major urban environmental challenge in many large and middle-sized cities in CEB target countries.
Source: PLUREL (2011), Peri-Urbanisation in Europe. Towards European Policies to Sustain Urban-Rural Futures. Synthesis Report.
35 PLUREL: Peri-urban Land Use Relationships – Strategies and Sustainability Assessment Tools for Urban – Rural Linkages. Database accessed on 9 July 2014. Plurel is a large research project funded within the 6th Research Framework Programme of the European Union. 31 partner organisations from 14 European countries and China participate in the project. It is led by the University of Copenhagen. 36 European Environment Agency (2010), Environmental trends and perspectives in the Western Balkans: Future Production and Consumption Patterns.37 UN-HABITAT defines a slum household as a group of individuals living under the same roof in an urban area who lack one or more of the following: 1. Durable housing of a permanent nature that protects against extreme climate conditions. 2. Sufficient living space which means not more than three people sharing the same room. 3. Easy access to safe water in sufficient amounts at an affordable price. 4. Access to adequate sanitation in the form of a private or public toilet shared by a reasonable number of people. 5. Security of tenure that prevents forced evictions.38 European Environment Agency (2013), Targeted Support to the Update of Analysis of Global Megatrends for the European Environment State and Outlook Report 2015 Global Megatrends Assessment. Living in an Urban World: Analysis for Update and Improved Assessment of this Megatrend.
| Par t A , Chapter 2. A regional analysis of environmental pressures across CEB member countr ies |

Addressing environmental challenges and their social implications in Europe - CEB 2015
57
Table 2.3 Share of population and urban population living in low elevation coastal zones, 2010
Source: CEB table based on the database “Urban-Rural Population and Land Area Estimates, v2 (1990, 2000, 2010, 2100)” from the Socioeconomic Data and Applications Center (SEDAC), accessed on 23 July 2014.Notes: (1) “the former Yugoslav Republic of Macedonia”, Luxembourg and Switzerland have no exposed population. (2) No data was available for Czech Republic, Hungary, Kosovo and Slovak Republic.
| Par t A , Chapter 2. A regional analysis of environmental pressures across CEB member countr ies |
CEB Member StatesTotal population in low elevation coastal zones
Share of total population (%) Share of urban population (%)
Target countries
Albania 354,132 11.0 4.8
Bosnia and Herzegovina 4,874 0.1 0.1
Bulgaria 82,611 1.1 0.9
Croatia 115,291 2.6 1.4
Cyprus 103,761 9.3 8.2
Estonia 123,017 9.2 7.2
Georgia 176,485 4.1 2.5
Latvia 645,838 28.8 27.6
Lithuania 164,110 5.0 4.1
Malta 24,218 5.8 4.1
Poland 860,298 2.2 1.5
Republic of Moldova 86,086 2.4 1.8
Romania 617,654 2.9 2.0
Serbia21,283 0.2 0.1
Montenegro
Slovenia 19,053 0.9 0.8
Turkey 2,335,342 3.2 2.3
Non-target countries
Belgium 2,264,375 21.1 19.2
Denmark 1,492,575 26.8 18.3
Finland 260,454 4.8 4.1
France 2,983,590 4.7 3.7
Germany 4,430,201 5.4 4.0
Greece 927,234 8.1 5.9
Iceland 36,207 11.2 5.1
Ireland 451,169 10.0 7.6
Italy 5,304,525 8.7 6.6
Netherlands 11,967,821 71.8 59.7
Norway 294,258 6.0 3.8
Portugal 653,262 6.1 4.3
Spain 3,556,459 7.7 6.5
Sweden 678,429 7.2 5.2

Addressing environmental challenges and their social implications in Europe - CEB 2015
58
When it comes to the sensitivity of urban areas to climate change, according to the EEA, local characteristics are highly important, sometimes more important than regional grouping, with increased urbanisation generally aggravating the impact.39
• In Southern and Eastern Europe, a large proportion of cities are likely to face issues associated with heat waves. The impact, however, is not particular to these regions as there are also Northern European cities that are projected to be highly sensitive to high heat loads.
• While many Western, Central and Eastern European areas are likely to be more sensitive to river floods, high sensitivities are also expected in areas with a projected decrease in flood events.
• Western and Northern European cities are likely to be sensitive to urban drainage flooding. However, cities in other regions that have high soil sealing (e.g. Cyprus, Estonia, Greece and Luxembourg) or inadequate capacity of urban drainage systems also may face flooding risks.
• Coastal40 cities are expected to face additional concerns, with sea level rises accelerating coastal erosion, increasing flood risks and leading to saltwater intrusion into groundwater aquifers. Cities in Turkey, for example, are highly vulnerable as the country is bordered by four seas: Mediterranean, Black, Aegean and Marmara. The World Bank has estimated that a 1m rise in sea level would affect approximately 30% of a nation’s total population living in urban areas close to the coastline. Vulnerability may be referenced to whether a significant share of a country’s population is situated in low-elevation coastal zones, i.e. less than 10m above sea level.41 In 2010, this share was highest in Denmark, Belgium, Latvia and Netherlands (see Table 2.3). Vulnerability also depends on the effectiveness of coastal management and the state of existing conditions.
2.3 Adaptive capacities
When analysing present and future climate projections, almost all sectors and all regions of CEB countries have been and will continue to be affected. Responding to these risks (and benefits) means adapting to climate change, while taking into account other socio-economic factors such as urbanisation. The European Commission’s Climate Action defines adaptation as “anticipating the adverse effects of climate change and taking appropriate action to prevent or minimise the damage they can cause, or taking advantage of opportunities that may arise.”
39 European Environment Agency (2012), Urban Adaptation to Climate in Europe: Challenges and Opportunities for Cities together with Supportive National and European Policies.40 Coastal areas are complex systems composed of a range of terrestrial, intertidal, and marine environments with seaward and landward zones of influence that stretch far inland and out to sea. Different countries use different definitions and boundaries for coastal zones. Nevertheless, coastal areas are commonly defined as intertidal and subtidal areas on and above the continental shelf routinely inundated by saltwater, and adjacent land, within 100 km from the shoreline. Source: the World Bank 41 The World Bank (2009), Adapting to Climate Change in Europe and Central Asia.
| Par t A , Chapter 2. A regional analysis of environmental pressures across CEB member countr ies |

Addressing environmental challenges and their social implications in Europe - CEB 2015
59
According to the IPCC, the capacity to adapt in Europe is high compared to other world regions. There are however important differences across CEB regions and countries. Western European and Scandinavian regions have a higher adaptive capacity than most of the countries in South Eastern Europe and the Mediterranean region, with countries around the Mediterranean having a lower capacity than the countries around the Baltic Sea region (see Figure 2.3). This implies that the countries that are expected to be affected the most, as previously identified, are the least prepared for adaptation. Therefore, the classification of countries that are most vulnerable to climate change, which results from combining impacts and adaptive capacity, is quasi-identical to the map of impacts (see Figure 2.3).
Across Europe, adaptation policy, including the prioritisation of adaptation options, has been developed at EU level (see Box 2.2) and at national, regional and city levels.
42 http://ec.europa.eu/clima/policies/adaptation/what/documentation_en.htm
Box 2.2 EU adaptation policy and funding
The EU Strategy on Adaptation to Climate Change42 (see Appendix 1), adopted in April 2013, aims at making Europe more capable of facing climate change by reducing the vulnerability of its sectors, systems, people and assets. It will enhance the preparedness and capacity of all European governance levels to respond to the impacts of climate change. The Adaptation Strategy, still to be implemented, recognizes that improved access to funding will be critical in building a climate-resilient Europe. The Multiannual Financial Framework 2014-2020 will ensure that at least 20% of the European budget is climate-related expenditure, including both adaptation and mitigation.
Climate change adaptation is mainstreamed throughout EU sectoral policies, using the five European Structural and Investment Funds: the European Regional Development Fund (ERDF), the European Social Fund (ESF), the Cohesion Fund (CF), the European Agricultural Fund for Rural Development (EAFRD) and the European Maritime and Fisheries Fund (EMFF).
At the same time, other instruments co-exist: Horizon 2020, which will promote research and development on climate change adaptation, the LIFE instrument which finances a wide range of projects related to environment and climate mitigation and adaptation and the EU Solidarity Fund for natural disasters.
Climate adaptation is also integrated into funding and loans by the European Investment Bank and the European Bank for Reconstruction and Development and is a major issue for insurance and other cross-cutting challenges in the private sector.
Sources: European Commission Climate Action and European Climate Adaptation Platform, Climate-Adapt
| Par t A , Chapter 2. A regional analysis of environmental pressures across CEB member countr ies |

Addressing environmental challenges and their social implications in Europe - CEB 2015
60
Adaptation is a challenging task as effective actions require the integration of different levels of governance, sectors of economy and society, and regions.
In its policy analysis, the EEA43 concluded that, so far, action at national level has mainly consisted in establishing research programmes, mapping vulnerabilities and planning. Even the countries that have adaptation strategies are not yet implementing adaptation measures in large numbers. Furthermore, the IPCC report concluded that while significant progress has been made to advance the planning and development of adaptation measures, actual implementation of national strategies was often limited to disaster risk reduction, environmental protection, spatial planning, and coastal zone and water resource management. At the local level, adaptation was generally identified as a low priority for many cities.
Box 2.3 Adaptation in practice
The EEA provides a library of examples of adaptation actions across European countries and at pan-European level (see Figure 2.2). Adaptation measures are usually grouped into “grey”, “green” and “soft” actions or a combination of these approaches. This classification builds on the 2009 EU White Paper on adapting to climate change.
• “Grey” adaptation actions correspond to physical initiatives or construction measures and using civil engineering services (e.g. dyke building and beach restoration to prevent coastal erosion). In Barcelona, for example, the El Prat de Llobregat desalination plant, fully operational since July 2009, can supply the city with 200,000 m3 of drinking water per day, satisfying 20% of Barcelona’s drinking water needs. It was built as a response to the challenges of water scarcity and droughts.
• “Green” adaptation actions make use of nature to achieve a more cost effective and feasible adaptation than “grey” infrastructure (e.g. new crop and tree varieties, allowing room for rivers to naturally flood onto floodplains and restoring wetlands). In the Netherlands, for example, under the national “Room for River” programme, rivers are being given more room to overflow at a total of 39 locations by lowering floodplains, relocating dykes, de-poldering or deepening the river beds.
• “Soft” adaptation actions are managerial, legal and policy approaches that alter human behaviour and styles of governance (e.g. early warning systems that can monitor threats from heat waves, floods and new disease types, or financial infrastructure that can insure against damage from natural disasters). Some of these measures can facilitate the implementation of “grey” and “green” measures.
43 European Environment Agency (2013), Adaptation in Europe: Addressing Risks and Opportunities from Climate Change in the Context of Socio-Economic Developments.
| Par t A , Chapter 2. A regional analysis of environmental pressures across CEB member countr ies |

Addressing environmental challenges and their social implications in Europe - CEB 2015
61
Sources: (1) European Environment Agency (2013), Adaptation in Europe: Addressing Risks and Opportunities from Climate Change in the Context of Socio-Economic Developments. (2) European Environment Agency (2012), Urban Adaptation to Climate in Europe: Challenges and Opportunities for Cities together with Supportive National and European Policies.
Figure 2.2 Examples of adaptation in practice
| Par t A , Chapter 2. A regional analysis of environmental pressures across CEB member countr ies |

Addressing environmental challenges and their social implications in Europe - CEB 2015
62
Figure 2.3 Climate change: potential aggregate impact, adaptive capacity and vulnerability
Note: Overall impacts derived from 26 impact indicators, overall adaptive capacity from 15 individual indicators, and overall vulnerability from a combination of overall impacts and adaptive capacity.Source: EPSON Climate, 2011.
Source: European Environment Agency (2012), Climate Change, Impacts and Vulnerability in Europe 2012, p.221
| Par t A , Chapter 2. A regional analysis of environmental pressures across CEB member countr ies |

Addressing environmental challenges and their social implications in Europe - CEB 2015
63
2.4 Investment needs
Adaptation needs are mainly determined by (projected) climate impacts, socio-economic factors and, in some countries, particularly in CEB target countries, by the legacies of environmental mismanagement and under-investment in infrastructure and housing. The cross-cutting issue among all CEB countries is to improve the climate resilience of infrastructure while acting upon the associated co-benefits and reducing environmental inequalities. Existing infrastructure has been engineered and built for a past or current climate and may not be resilient to future climate. New infrastructure needs to be resilient to a climate that could be significantly different.
Our desk research indicates that while all CEB regions are likely to be affected by environmental pressures, the impact will differ regionally. This means that the distribution of investment needs will likely mirror the vulnerability map (see Figure 2.3):
• The Southern region is likely to be particularly vulnerable as multiple sectors are projected to be adversely affected (high confidence). Among the sectors most affected are water management given the increased risk of water restrictions; energy production, transmission and use given the increased cooling demand, peaking in summer; and the built environment due to longer and more intense heat waves and droughts.
• Urban areas are vulnerable given the high density of people and the damage caused by urban sprawl.
The built and environmental infrastructure is also vulnerable to weather extremes, such as heat waves, increased rainfall and rising sea levels. Cities in the conversion regions of Southern, Central and Eastern Europe face particular risks, mostly due to the legacies of environmental mismanagement.
• In coastal regions, populations and infrastructure are likely to be adversely affected by sea level rise, particularly after mid-century. River and pluvial flooding are likely to affect Central and Northern Europe.
• Mountain areas concentrate vulnerabilities in infrastructure for transport and energy due to the high impact of climate change on natural hazards, water and snow resources and lack of migration possibilities for plant species.
Based on the analysis of urbanisation trends, the current state of infrastructure and vulnerabilities to climate change, the following allocation of demand for “green” and “grey” climate-resilient investment eligible for CEB financing is likely to be present across CEB regions in the medium- to longer-term (see also Table 2.5).
• Constructing or modernising urban infrastructure across all CEB countries, but particularly in CEB target countries. Improved water, sanitation and waste generation and treatment, reliable and sufficient power supply, efficient transport networks and modern information and communication technologies (ICTs) are key to the sustainability, inclusion and economic growth of increasing peri-urban areas and to avoiding or addressing sprawls around cities and towns and along coastal zones.
| Par t A , Chapter 2. A regional analysis of environmental pressures across CEB member countr ies |

Addressing environmental challenges and their social implications in Europe - CEB 2015
64
• Retrofitting housing across all Europe, particularly in CEB target countries, in the context of weather extremes.
• Implementing cooling measures, especially in Southern Europe, in the context of increased overheating.
• Improving power generation capacity, especially in Southern Europe – given the increased summer energy demand, which will be under-utilised during the rest of the year, entailing higher supply costs.
• Implementing integrated water resource management, such as river basin management planning, flood defence plans and drought contingency plans, in Southern, Central and Atlantic regions, where climate change is likely to have significant impacts on future water availability.
• Putting into action disaster risk reduction measures and management in coastal regions as populations and infrastructure are likely to be adversely affected by sea level particularly after mid-century. A shift from clean-up towards mitigation of risks could lower the costs significantly.
• Preserving cultural heritage, including monuments, buildings, archaeological sites, iconic places and cultural landscapes, given the emerging concerns over its vulnerability to climate change and sea level rise. As cultural heritage is a non-renewable resource, there is a risk that some cultural landscapes may be lost forever.
Such adaptation measures entail costs. The IPCC summarised the following estimates for some planned adaptation measures across Europe by 2100:
Table 2.4 IPCC selected published cost estimates for planned adaptation in European countries
Source: IPCC (2014), Climate Change 2014: Impacts, Adaptation, and Vulnerability, p. 1297Note: The line with UK data has been deleted from the original version.
| Par t A , Chapter 2. A regional analysis of environmental pressures across CEB member countr ies | | Par t A , Chapter 2. A regional analysis of environmental pressures across CEB member countr ies |
Region Cost estimate Time period Sector/ outcomes Reference
Europe
€ 2.6-3.5 billion yr-1 In 2100 Coastal adaptation costs Hinkel et al. (2010)
€ 1.7 billion yr-1 By 2020sProtection from river flood risk
for EU27Rojas et al. (2013)€ 3.4 billion yr-1 By 2050s
€ 7.9 billion yr-1 By 2080s
Netherlands€ 1.2-1.6 billion yr-1 Up to 2050 Protection from coastal and river
floodingDelta Committee (2008)
€ 0.9-1.5 billion yr-1 2050-2100
Sweden Total of up to € 2.4 billion 2010-2100Investments in structural adaptation, information campaigns and research
Swedish Commission on Climate and Vulnerability (2007)
Italy€ 0.4-2 billion By 2080s Coastal protection Bosello et al. (2012)
Up to € 44 billion By 2080s Hydrogeological protection Medri et al. (2013)
Greece € 0.4-3.3 billion Up to 2100 Coastal protection Bank of Greece (2011)

Addressing environmental challenges and their social implications in Europe - CEB 2015
65
| Par t A , Chapter 2. A regional analysis of environmental pressures across CEB member countr ies |
Figure 2.4 EEA projections of economic costs stemming from climate change and socio-economic development
While these amounts might seem substantial, the costs of inaction are much more significant. The EEA included in its report the costs of inaction in Europe, in terms of river flooding, heat waves and energy demand for cooling44, estimated to range from € 100 billion a year in 2020 to almost € 350 billion a year in 2080 (see Figure 2.4, left graph). The EEA also shows the significant reduction in costs of inaction that can be achieved by a mitigation policy consistent with the EU’s 2˚ target, including avoiding some of the potential lower-probability high-consequence events (see Figure 2.4, right graph).
Adapting infrastructure to climate change impacts will not eliminate the risk of extreme weather adversely affecting infrastructure. Neither will it eliminate the need for contingency plans to be in place. In fact, measures that contain “soft” actions, such as in rural and urban development and disaster risk management, are necessary to anticipate the effects of climate change and extreme events and avoid maladaptation. In this sense, capacity building, stronger institutions and effective ties with the scientific community, are also key to developing and implementing coordinated, coherent and cost-effective adaptation actions across all CEB countries.
Source: European Environment Agency (2012), Climate Change, Impacts and Vulnerability in Europe 2012, p.232
44 The total costs of the impacts of global climate change on the European economy is not available. Source: EEA
| Par t A , Chapter 2. A regional analysis of environmental pressures across CEB member countr ies |

Addressing environmental challenges and their social implications in Europe - CEB 2015
66
| Par t A , Chapter 2. A regional analysis of environmental pressures across CEB member countr ies |
Table 2.5 Potential distribution of investment needs across regions in CEB countries by 2100
Source: CEB table. The regional classification is based on the IPCC’s sub-regional classification of Europe, see Table 2.1.Note: The table summarises the geographical distribution of environmental investment needs identified in Chapter 1, p. 1 . It is based on the assessment of vulnerabilities to environmental pressures across regions of CEB countries conducted in this Chapter.
Alpine Atlantic Continental Northern Southern
Environmental protection: upgrading infrastructure
Solid waste management X X
Water and wastewater management X X X
Climate change mitigation: “greening” the built environment
Energy efficiency in buildings
- Energy efficiency in power supply and ICTs X X X X X
- Cooling systems X
- Retrofitting X X X X X
Cleaner and renewable energy
- Wind energy production X X X
- Hydropower generation X X X
Sustainable public transport X X X X
Climate change adaptation: strengthening resilience to (extreme) climate events
Flooding
- Coastal flooding X X X X
- River and pluvial flooding X X
Mass movements and avalanches X
Cultural heritage and landscapes X X X X X

Addressing environmental challenges and their social implications in Europe - CEB 2015
67
| Main environmental issues and their implicat ions for CEB operat ions |

Addressing environmental challenges and their social implications in Europe - CEB 2015
68
Part B
CEB environmental financing and its social value
The objective of Part B is to describe the Bank’s experience to date in financing projects in favour of sustainable management of the environment and, acting upon the findings from Part A, to explore potential avenues for the Bank’s continued investment in this field in the years to come.
Chapter 3 provides a comprehensive overview of the CEB’s experience in financing projects in favour of environmental management since 1957. Chapter 4 elaborates on the social added value of the CEB’s activities in this sector based on four case studies selected by purposive sampling. The concluding remarks deliver several potential actions in environmental management over the following years.
| CEB environmental f inancing and i t s social value |

Addressing environmental challenges and their social implications in Europe - CEB 2015
69
Approved by the Administrative Council on 17 September 2010, the Environmental Policy formalises the CEB’s commitment towards promoting sustainable development and describes the environmental and social principles that guide the conduct of its project-related operations.
“The CEB is committed to promote social responsibility and sustainable development in the following two ways: 1) in the way it conducts its project related operations and the dialogue with its beneficiaries and stakeholders; and 2) in the way it operates as a responsible organisation respecting human resources and the environment.” Putting into effect its mission statement, the CEB actively seeks to finance projects that yield tangible social and environmental benefits.
The approach and sector specific eligibility criteria that guide the project identification process and reflect the Bank’s explicitly social mandate are laid down in its Overall Policy Framework for Loan and Project Financing (Loan Policy). By means of its due diligence and monitoring processes, the CEB seeks to ensure that the projects it finances are designed and implemented in such a way as to:
• optimise social and environmental benefits • minimise negative environmental impacts • comply with appropriate social and environmental standards.
Environmental screening and impact assessment
To be considered for CEB financing, all projects undergo environmental screening in line with the Environmental Impact Assessment Directive 85/337/EC (as amended by 97/11/EC, 2003/35/EC and 2009/31/EC). The CEB also requires the assessment of exogenous risks (e.g. natural, environmental health and safety) that are likely to jeopardise project implementation and development outcomes.
Environmental standards
The CEB requires that all projects comply with any obligations and standards enshrined in relevant Multilateral Environmental Agreements (MEAs) and Council of Europe conventions incorporated into the applicable laws (e.g. biodiversity, climate change, the ozone layer, wetlands, persistent organic pollution, trans-boundary air pollution, endangered species and environmental information, and others that may be ratified from time to time).
The CEB also acknowledges the conclusions issued by the UN Intergovernmental Panel on Climate Change (IPCC), in particular, that climate change is unequivocal and that the bulk of global warming can be linked to anthropogenic greenhouse gas emissions. Consequently, the Bank is aware that the carbon footprint of CEB-funded projects can influence the extent of climate change in the near future.
The CEB’s approach to combating climate change is twofold:
• through mitigation, which includes mainstreaming energy efficiency measures in the projects the Bank finances, developing specific energy saving programmes in the housing and public sectors as well as supporting sustainable energy production, notably decentralised renewable energy facilities;
• through adaptation, which means the protection of vulnerable population groups and their livelihoods against loss and damage associated with extreme climate events.
| CEB environmental f inancing and i t s social value |
Box 2 CEB Environmental Policy

Addressing environmental challenges and their social implications in Europe - CEB 2015
70
| CEB environmental f inancing and i t s social value |

Addressing environmental challenges and their social implications in Europe - CEB 2015
713. Lending to date

Addressing environmental challenges and their social implications in Europe - CEB 2015
72
| Par t B, Chapter 3. Lending to date |
This chapter provides an overview of the CEB’s experience in financing projects in favour of environmental management since the Bank’s creation in 1957. Analysis of the portfolio of environmental management projects covers the sectors of action under the sectoral line “Managing the Environment” (see Box 1), namely “natural or ecological disasters”, “protection of the environment” and “protection and rehabilitation of historic and cultural heritage”. The diversity of CEB investments is discussed from both a geographic and a sectoral standpoint.
3.1 Amounts approved and disbursed
From its creation to end 2014, the CEB approved € 11.8 billion and disbursed € 8.4 billion in loans to the sectoral line of action devoted to environmental management, representing a stable 22% share of all CEB loans approved and disbursed over the same period. Even though the roots of the Bank’s financing in favour of environmental management date back to 1957, this sectoral line of action has become markedly more significant since the mid-1990s.
• Between 1957 and 1994, the CEB approved loans totalling € 1.4 billion and disbursed € 1 billion, representing 11% of total loans approved and disbursed over the period.
• Between 1995 and 2014, the CEB approved loans totalling € 10.4 billion and disbursed € 7.4 billion. Relative to its total lending, the allocation of CEB loans to this sectoral line of action averaged 25%. This ratio also holds for the environmental projects approved by the CEB over the last ten years (since 2005), involving € 5 billion or 22% of total CEB loans approved.
3.2 Geographic portfolio profile
From a geographic perspective (see Figure 3.1), total CEB lending to environmental management (1957-2014) was concentrated in Southern Europe (Cyprus, Greece, Italy, Portugal and Spain) with € 4.7 billion approved, representing 40% of the total portfolio.
• Environmental management projects in South Eastern Europe (Western Balkans, Bulgaria, Romania and Turkey) accounted for € 3.1 billion or 26% of the total approved since 1957.
• Large environmental projects were also financed in Central Europe (the Czech Republic, Hungary, Poland, the Slovak Republic and Slovenia) for € 1.8 billion or 15% of the total approved since 1957.
• In Western Europe (Belgium, Germany, France and Ireland), the sectoral line of action benefited from CEB financing worth € 1.6 billion or 14% of the total approved since 1957.
• Smaller amounts totalling € 545 million or 5% of the total approved since 1957 were allocated in Northern Europe (Baltic countries, Finland, Iceland and Sweden).

Addressing environmental challenges and their social implications in Europe - CEB 2015
73
| Par t B, Chapter 3. Lending to date |
CEB lending to the environmental management sector in the Central, Eastern and South Eastern European countries, known as “target countries”, represented € 5.6 billion or 48% of the total portfolio in this sectoral line of action.
At country level, the Bank’s largest borrowers in the environmental management sector are Italy (18% of total loans approved), Turkey (17%), Spain (9%), Germany (8%), Romania (7%), Hungary (6%), Portugal and Poland (5% each). These countries represent about 75% of the CEB’s loan portfolio in this sector.
Figure 3.1 Geographic breakdown of CEB lending to environmental management (1957-2014)
When CEB lending to environmental management is considered over the last ten years (see Figure 3.2), the geographic breakdown appears more balanced. Whereas in the first decades CEB lending focused mostly on four countries, namely Greece, Italy, Portugal and Turkey, in recent years it has reached 29 countries of operation. While some of the main borrowers from Southern Europe have decreased their shares (e.g. Portugal) or disappeared from the portfolio (e.g. Greece, Italy), the Central and South Eastern European countries have increased their share, reaching 60% of the loan portfolio over the ten-year period under consideration. Investments in environmental management in CEB target countries have particularly gained in importance, representing € 3.5 billion or 70% of the Bank’s environmental lending between 2005 and 2014.
5%
14%
26%
15%
Scandinavian countries (Baltics, Finland, Iceland, Sweden)
Western Europe (Belgium, France, Germany, Ireland)
Central Europe (Czech Republic, Hungary, Poland, Slovak Republic, Slovenia)
South Eastern Europe (Bulgaria, Romania, Turkey, Western Balkans)
Southern Europe (Cyprus, Greece, Italy, Portugal, Spain)
40%
Total approved (1957-2014): € 11.8 billion
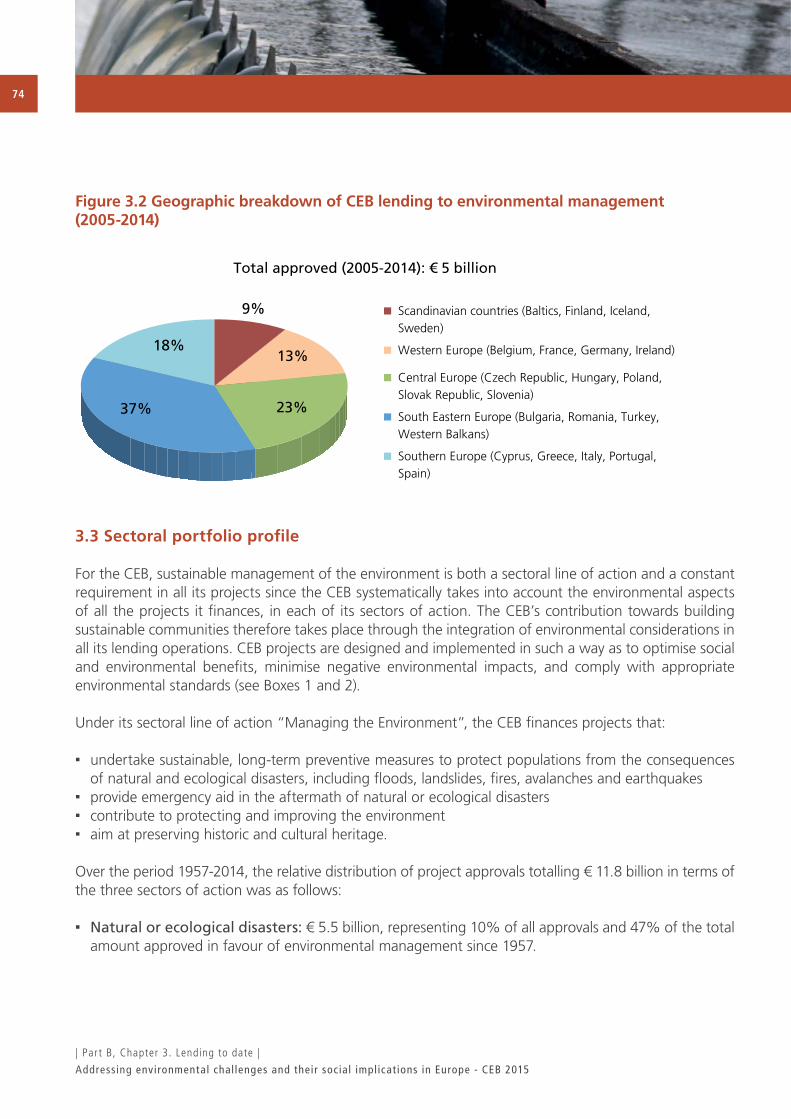
Addressing environmental challenges and their social implications in Europe - CEB 2015
74
Figure 3.2 Geographic breakdown of CEB lending to environmental management (2005-2014)
3.3 Sectoral portfolio profile
For the CEB, sustainable management of the environment is both a sectoral line of action and a constant requirement in all its projects since the CEB systematically takes into account the environmental aspects of all the projects it finances, in each of its sectors of action. The CEB’s contribution towards building sustainable communities therefore takes place through the integration of environmental considerations in all its lending operations. CEB projects are designed and implemented in such a way as to optimise social and environmental benefits, minimise negative environmental impacts, and comply with appropriate environmental standards (see Boxes 1 and 2).
Under its sectoral line of action “Managing the Environment”, the CEB finances projects that:
• undertake sustainable, long-term preventive measures to protect populations from the consequences of natural and ecological disasters, including floods, landslides, fires, avalanches and earthquakes
• provide emergency aid in the aftermath of natural or ecological disasters • contribute to protecting and improving the environment • aim at preserving historic and cultural heritage.
Over the period 1957-2014, the relative distribution of project approvals totalling € 11.8 billion in terms of the three sectors of action was as follows:
• Natural or ecological disasters: € 5.5 billion, representing 10% of all approvals and 47% of the total amount approved in favour of environmental management since 1957.
| Par t B, Chapter 3. Lending to date |
9%
13%
23% 37%
18%
Total approved (2005-2014): € 5 billion
Scandinavian countries (Baltics, Finland, Iceland, Sweden)
Western Europe (Belgium, France, Germany, Ireland)
Central Europe (Czech Republic, Hungary, Poland, Slovak Republic, Slovenia)
South Eastern Europe (Bulgaria, Romania, Turkey, Western Balkans)
Southern Europe (Cyprus, Greece, Italy, Portugal, Spain)

Addressing environmental challenges and their social implications in Europe - CEB 2015
75
• Protection of the environment: € 5.8 billion, representing 11% of all approvals and 49% of total loans approved in favour of environmental management since 1957.
• Protection and rehabilitation of historic and cultural heritage: € 450 million or 1% of all approvals and 4% of total loans approved in favour of environmental management since 1957.
Aggregate data per successive sub-periods show that the relative sectoral distribution of projects approved has been less balanced over time (see Figure 3.3). Projects dedicated to victims of “natural or ecological disasters” have been financed since the Bank’s creation. Their relative share in the portfolio has decreased over time to represent 26% of the environmental sectoral line of action over the last 10-year period. Operations supporting “protection of the environment” were initiated in the mid 1980s and have progressively increased their share in the portfolio to reach more than two thirds of the environmental sectoral line of action over the last ten years of activity. Projects in favour of the “protection and rehabilitation of historic and cultural heritage” have maintained a relatively stable 5% share in the portfolio since 1997 (the year in which this specific sector of action was established).
Figure 3.3 The relative breakdown of project approvals in favour of environmental management per sector of action and per sub-period (1957-2014)
| Par t B, Chapter 3. Lending to date |
0%
20%
40%
60%
80%
100%
1957-1986 (€ 0.8bn) 1987-1996 (€ 1bn) 1997-2004 (€ 5bn) 2005-2014 (€ 5bn)
Protection and rehabilitation of historicand cultural heritage
Protection of the environment
Natural or ecological disasters

Addressing environmental challenges and their social implications in Europe - CEB 2015
76
Natural or ecological disasters
Aid to victims of natural or ecological disasters constitutes one of the CEB’s two statutory priorities. Projects in this sector involve the reconstruction or rehabilitation of destroyed or damaged infrastructure, in particular housing and basic infrastructure such as water supplies, wastewater and solid waste treatment, electricity and gas supplies. On the other hand, enhancing the effectiveness and sustainability of the CEB’s contribution to helping populations manage natural risks has meant shifting the operational focus from immediate emergency response to long-term preventive action.
This is reflected by the Bank’s pro-active approach to tackling climate change related events first and foremost through adaptation rather than emergency reconstruction. Within this sustainability perspective, the CEB’s action has steadily evolved in favour of prevention so that the breakdown of the CEB’s activities between prevention and reconstruction over the past ten years has been approximately 50/50. The CEB projects that help protect populations and livelihoods from damage arising from natural disasters aim at providing lasting solutions for reducing vulnerability to natural disasters, reversing environmental degradation and promoting the Member States’ sustainable development and adherence to national and international environmental standards.
Since 1957, lending in this sector has totalled € 5.5 billion across CEB member countries (see Figure 3.4), with projects located in Bosnia and Herzegovina, Bulgaria, Croatia, Cyprus, the Czech Republic, Germany, Greece, Hungary, Italy, Poland, Romania, Serbia, the Slovak Republic, Slovenia, Spain and Turkey. These projects have mainly been implemented with central and local government authorities.
CEB investments in Southern and South Eastern Europe have represented more than 80% of total loans approved, mostly involving post-disaster reconstruction works in the Mediterranean area. The CEB notably participated in the reconstruction of areas destroyed by earthquakes in the Azores, Southern Italy, Greece and Turkey during the 1980s and 1990s. Over the period, the CEB also took action following floods that occurred in Portugal and Spain. Since 2000, more attention has been devoted to preventive measures, such as fire prevention in Castilla y León in Spain (see Case Study 4), protection of the Veneto Region in Italy from chronic flooding due to high tides, and improvement in Istanbul’s preparedness for a potential earthquake under the Istanbul Seismic Risk Mitigation and Emergency Preparedness Project (ISMEP) in Turkey (see Case Study 4). Regarding the activities in Western Europe, the CEB implemented one project worth € 40 million in Eastern Germany, following the floods at the beginning of the 2000s.
| Par t B, Chapter 3. Lending to date |

Addressing environmental challenges and their social implications in Europe - CEB 2015
77
Figure 3.4 Geographic breakdown of CEB lending to natural or ecological disasters (1957-2014)
Over the last fifteen years, there has been a marked shift in the geographic distribution of CEB lending in this sector towards the target countries in Central, Eastern and South Eastern Europe, with € 1.8 billion or 65% of total loans approved in favour of this sector over this period. As a statutory priority, this sector has always represented a substantial share of CEB loans in the target group countries. Although the relative share of this sector (in total lending to the target group) has decreased over the years, absolute volumes invested in the sector have continuously increased with a clear shift from reconstruction to prevention. In effect, the Bank’s first actions in the 1990s were aimed at post-disaster rehabilitation, after floods in Central Europe or earthquakes in Slovenia and Turkey. However, since the beginning of the 2000s, the CEB has implemented significant large-scale prevention projects, mostly in Hungary, Poland, Romania and Turkey, while still paying attention to post-disaster support in the region (e.g. Hungary, Romania and Serbia).
Protection of the environment
The CEB finances projects that contribute to protecting and improving the environment. Projects involve the reduction and treatment of solid and liquid waste; clean-up and protection of surface and underground water; protection against noise nuisance; production of renewable energy on a non-industrial scale and air pollution prevention; energy saving and efficiency measures; protection and development of biodiversity; cleaner transport means and networks. The CEB has recently increased its attention to energy saving and efficiency investments. In line with energy efficiency objectives, CEB financing can cover residential dwellings and non-residential buildings such as educational and health care facilities as well as different components of urban infrastructure. Moreover, the Bank also finances initiatives in the areas of renewable energy production and collective urban heating.
| Par t B, Chapter 3. Lending to date |
1%
17%
28% 54%
Western Europe (Germany)
Central Europe (Czech Republic, Hungary, Poland, Slovak Republic, Slovenia)
South Eastern Europe (Bulgaria, Romania, Turkey, Western Balkans)
Southern Europe (Cyprus, Greece, Italy, Portugal, Spain)
Total approved (1957-2014): € 5.5 billion
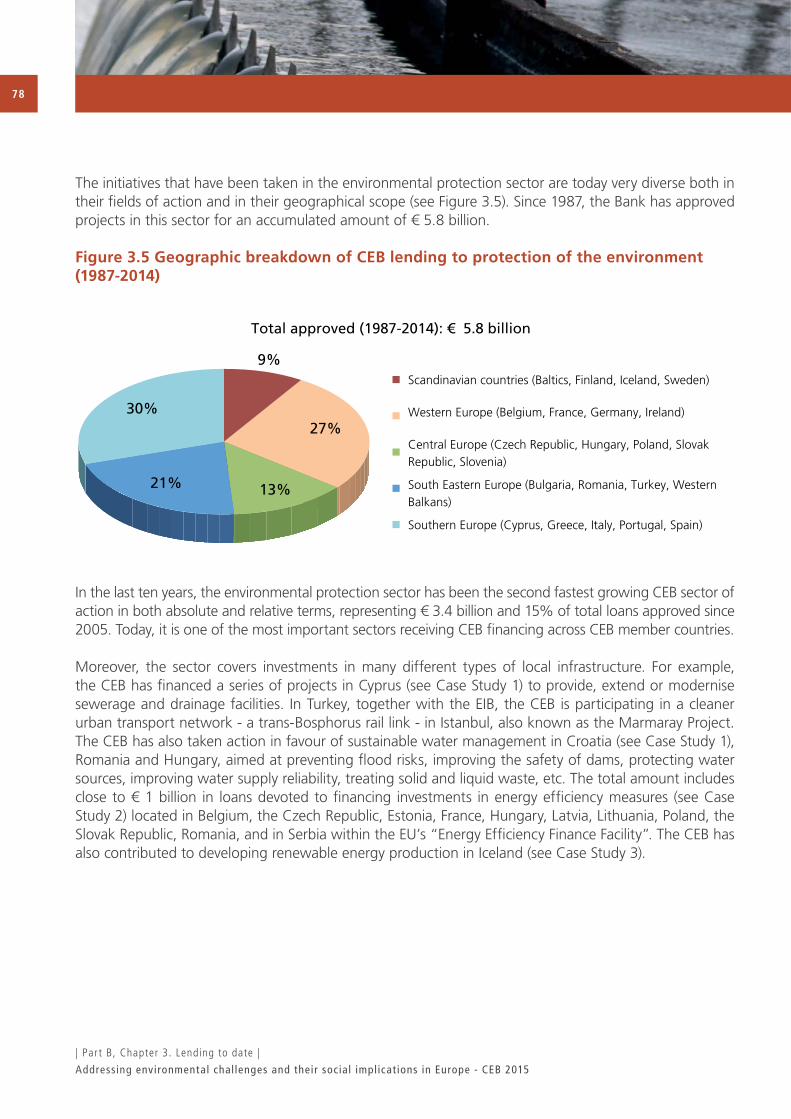
Addressing environmental challenges and their social implications in Europe - CEB 2015
78
The initiatives that have been taken in the environmental protection sector are today very diverse both in their fields of action and in their geographical scope (see Figure 3.5). Since 1987, the Bank has approved projects in this sector for an accumulated amount of € 5.8 billion.
Figure 3.5 Geographic breakdown of CEB lending to protection of the environment (1987-2014)
In the last ten years, the environmental protection sector has been the second fastest growing CEB sector of action in both absolute and relative terms, representing € 3.4 billion and 15% of total loans approved since 2005. Today, it is one of the most important sectors receiving CEB financing across CEB member countries.
Moreover, the sector covers investments in many different types of local infrastructure. For example, the CEB has financed a series of projects in Cyprus (see Case Study 1) to provide, extend or modernise sewerage and drainage facilities. In Turkey, together with the EIB, the CEB is participating in a cleaner urban transport network - a trans-Bosphorus rail link - in Istanbul, also known as the Marmaray Project. The CEB has also taken action in favour of sustainable water management in Croatia (see Case Study 1), Romania and Hungary, aimed at preventing flood risks, improving the safety of dams, protecting water sources, improving water supply reliability, treating solid and liquid waste, etc. The total amount includes close to € 1 billion in loans devoted to financing investments in energy efficiency measures (see Case Study 2) located in Belgium, the Czech Republic, Estonia, France, Hungary, Latvia, Lithuania, Poland, the Slovak Republic, Romania, and in Serbia within the EU’s “Energy Efficiency Finance Facility”. The CEB has also contributed to developing renewable energy production in Iceland (see Case Study 3).
| Par t B, Chapter 3. Lending to date |
Scandinavian countries (Baltics, Finland, Iceland, Sweden)
Western Europe (Belgium, France, Germany, Ireland)
Central Europe (Czech Republic, Hungary, Poland, Slovak Republic, Slovenia)
South Eastern Europe (Bulgaria, Romania, Turkey, Western Balkans)
Southern Europe (Cyprus, Greece, Italy, Portugal, Spain)
Total approved (1987-2014): € 5.8 billion
9%
27%
13% 21%
30%

Addressing environmental challenges and their social implications in Europe - CEB 2015
79
Protection and rehabilitation of historic and cultural heritage
Protection and rehabilitation of historic and cultural heritage became an eligible sector of action as such in 1997. Before 1997, the CEB had financed various projects that involved reconstruction works in the wake of a natural disaster or where the creation of community facilities made it necessary to rehabilitate historic buildings. Since 2006, the CEB has participated in the financing of investments for the rehabilitation of historic and cultural heritage, as part of the built environment, within the sectoral line of action concerned with sustainable management of the environment.
The CEB finances the restructuring and rehabilitation of historic and cultural heritage, classified as such by UNESCO or by the Member States concerned.
Since 1997, the Bank has approved a total of € 450 million for the protection and rehabilitation of elements of historic and cultural heritage with the national governments of Croatia, Poland, Romania and the Slovak Republic, within municipal programmes implemented in Finland, Central Europe (Hungary, Poland, Slovak Republic, Slovenia), Bosnia and Herzegovina, Croatia and Serbia, and in collaboration with financial institutions in Italy, Portugal and Spain (see also Figure 3.6).
Figure 3.6 Geographic breakdown of CEB lending to historic and cultural heritage (1997-2014)
| Par t B, Chapter 3. Lending to date |
3%
23%
24%
50%
Total approved (1997-2014): € 450 million
Scandinavian countries (Finland)
Central Europe (Hungary, Poland, Slovak Republic, Slovenia)
South Eastern Europe (BiH, Croatia, Romania)
Southern Europe (Italy, Portugal, Spain)

Addressing environmental challenges and their social implications in Europe - CEB 2015
80
| CEB environmental f inancing and i t s social value |

Addressing environmental challenges and their social implications in Europe - CEB 2015
814. Social impact

Addressing environmental challenges and their social implications in Europe - CEB 2015
82
| Par t B, Chapter 4. Social impac t |
The objective of this chapter is to elaborate on the social value and highlight the social impact of the CEB’s activities in environmental management based on four case studies selected by purposive sampling to cover a wide range of countries, borrowers, final beneficiaries and responses to environmental and climate pressures.
4.1 Measuring social impact: methodology and assessment
Although CEB lending is demand-driven and based on borrowers’ needs, the value added generated by CEB activities goes further than providing long-term loans on favourable terms for the borrower, i.e. “financial added value”. CEB projects have not only material added value by responding to the lack of infrastructure but also a qualitative aspect and a strong social impact through improved living conditions and enhanced integration of final beneficiary groups. Beyond loans, the CEB also provides sectoral expertise and delivers assistance, monitoring and support at all stages in the project cycle, i.e. “non-financial added value”, to ensure that the anticipated social objectives are achieved (see Appendix 4).
The impact generated by CEB activities can be assessed across their social, economic and environmental dimensions.
First, since the main purpose of CEB projects is to improve living conditions/standards and to facilitate the integration into society of (vulnerable) population groups in specific sectors and/or specific countries/regions, CEB projects have clearly set social objectives. These objectives are measured through a set of relevant quantitative social indicators before and after the project. During the appraisal phase, the CEB performs an initial assessment to ensure that the project addresses the needs of the targeted final beneficiaries. In this perspective, evaluating social impact offers the Bank a vector for efficiency and a means of improving the quality of future projects.
Second, the relationship between the financial resources employed and the social objectives to be achieved needs to be efficient in time and space. Also, the economic cost of CEB projects must be shared out fairly and acceptably among final beneficiaries, the institutions involved at all administrative levels and, ultimately, taxpayers.
Third, all CEB projects are designed and implemented in such a way as to optimise social and environmental benefits, minimise negative environmental impacts, and comply with the appropriate social and environmental standards (see Box 2). The CEB does not finance projects that are likely to cause significant and irreversible negative environmental impacts and that do not meet the CEB’s environmental and social requirements.
Taking into consideration the priority given to social objectives within CEB projects, this chapter mainly focuses on the social effects of CEB projects, i.e. direct effects on the end-beneficiaries targeted in the projects.

Addressing environmental challenges and their social implications in Europe - CEB 2015
83
| Par t B, Chapter 4. Social impac t |
4.2 Case studies
In order to show the diversity of CEB investments and analyse their social value and environmental impact, this section presents four case studies in the investment areas identified in Part A:
1. Environmental protection: upgrading infrastructure • Water and wastewater management (Case Study 1)
2. Climate change mitigation: “greening” the built environment • Energy efficiency retrofitting (Case Study 2) • Renewable energy production (Case Study 3)
3. Climate change adaptation: strengthening resilience to (extreme) climate events • Disaster risk management (Case Study 4)

Addressing environmental challenges and their social implications in Europe - CEB 2015
84
Water supply, wastewater collection and treatment in Croatia (2011)
Objective: the development and upgrade of water supply systems, wastewater collection and treatment and storm water disposal in selected municipalities where the existing facilities are still inadequate or insufficiently developed (as per EU requirements)
Borrower: Ministry of Finance of the Republic of Croatia
Beneficiaries: local populations throughout Croatia
CEB loan: € 75 million, covering 50% of the total cost of € 150 million
At end 2014, the project was under implementation and expected to be completed by June 2016. The project is co-financed by the EIB.
Environmental impact:
Rehabilitation of existing sewerage networks is expected to lead to reduced wastewater losses and a related reduction in soil and groundwater pollution while the extension of water and sewerage networks should bring the current service levels in water and sanitation and the consequent environmental protection to long-term sustainable standards.
The project should deliver substantial environmental quality improvements, including increased service coverage and higher ecological quality of surface and groundwater resources.
Social impact:
Through improved and expanded water supply and sewage collection and disposal systems, the project should have a positive impact on public health and the quality of life of the inhabitants.
Sewerage infrastructure in Nicosia (2009)
Objective: the construction and extension of sewerage networks, pumping stations and treatment facilities in the Greater Nicosia area
• Component 1: the construction of the Mia Milia / Haspolat wastewater treatment plant (WWTP) and the introduction of modern methods of disposal to avoid nuisance due to overflows
CASE STUDY 1. WATER AND WASTEWATER MANAGEMENT
| Par t B, Chapter 4. Social impac t |

Addressing environmental challenges and their social implications in Europe - CEB 2015
85
• Component 2: the extension of the existing drainage and sewerage networks and treatment facilities to not-yet-covered areas in the Greater Nicosia area where the population is expected to grow considerably by 2025
• Component 3: re-asphalting of the excavated roads where the sewage collection system had been completed
Borrower: Sewerage Board of Nicosia
Beneficiaries: Inhabitants of the Greater Nicosia area
CEB loan:
• Approved in 2002, CEB loan of CYP 58.2. million (or € 101 million), covering 50% of the total cost of CYP 116.4 million.
• Approved in 2009, CEB loan of € 68 million, covering up to 36% of the total cost of € 189.5 million.
The CEB financed a total of € 148 million in the two loans. The project was implemented over the period 2002-2013 and co-financed by the EIB (first loan) and with the EU funds (second loan).
Environmental impact:
The project responded to urgent sanitation needs for people living in priority areas where sewage pit overflows were serious and frequent. The new WWTP eliminated environmental risks and impacts (pollutant discharges in Phedios river and odour problems) related to the suboptimal treatment of sewage flows in the old Mia Milia WWTP. The project also enabled compliance with the EU Urban Wastewater Treatment Directive (see Appendix 1) and contributed to promoting sustainable development in the region. The operation of the new WWTP is also partly powered by renewable energy, leading to a reduction in CO2 emissions.
Social impact:
The project created better living conditions for all the inhabitants of the area and contributed to controlling pollution and protecting natural resources. Most importantly, the project has a bi-communal dimension and could contribute to closer co-operation between the Turkish Cypriot and the Greek Cypriot communities. It is estimated that 300,000 people living in the Greater Nicosia area use the completed re-asphalted roads, 235,000 people are served by the Mia Milia/Haspolat WWTP and another 42,500 people benefit from connecting surrounding villages to the sewerage networks.
| Par t B, Chapter 4. Social impac t |

Addressing environmental challenges and their social implications in Europe - CEB 2015
86
Green investment programme (PIVERT) in Wallonia (2010)
Objective: the thermal renovation of up to 12,000 social dwellings amongst the least energy efficient of the Walloon housing stock
The works mainly cover the insulation of dwellings and the replacement of windows and heating and ventilation systems. Technical and financial eligibility criteria in this programme are very stringent. The targeted energy performance of rehabilitated buildings is high, and in some cases very high (e.g. passive housing).
Borrower: Société Wallonne du Logement (SWL)
Beneficiaries: low-income groups living in social dwellings in the Walloon Region of Belgium
CEB loan: € 125 million, covering 31% of the total cost of € 400 million
At end 2014, the project was under implementation and expected to be completed in 2015.
Environmental impact:
Energy efficiency measures resulted on average in a reduction in energy consumption of 60% in about 8,500 dwellings renovated in the two phases of the PIVERT programme. On the basis of an energy consumption of 9 litres of fuel/sq. m, this programme consistently reduced the overall carbon footprint by 30,000 tons of CO2 per year. Environmental impact is expected to increase in the two subsequent phases of the programme.
Social impact:
Around 26,000 inhabitants in Wallonia benefitted from the renovation during the first two phases of the programme. SWL estimated that the average monthly reduction in rental service charges (through the reduction in energy bills) was around € 62 per household. Given the average household income of 15,000€/year, energy efficiency measures helped reduce fuel poverty and contributed to increasing the purchasing power of the targeted population. Lastly, the project also contributed to improving the living conditions of social tenants with insecure or low incomes.
CASE STUDY 2. ENERGY EFFICIENCY RETROFITTING
| Par t B, Chapter 4. Social impac t |

Addressing environmental challenges and their social implications in Europe - CEB 2015
87
Retrofitting of panel buildings in the Slovak Republic (2012)
Objective: the retrofitting of panel buildings and old brick multi-apartment houses, built between the 1950s and the 1990s
Undertaken by around 200 condominiums, the investments under the CEB loan are mainly expected to cover the insulation of walls, roofs, floors and balconies, the replacement of windows (double/triple glazed) and the installation of efficient boilers, heat exchangers and radiators.
Borrower: Slovenska sporitelna a.s. (SLSP)
Beneficiaries: lower and middle-income inhabitants of panel buildings throughout the Slovak Republic
CEB loan: € 30 million, covering 50% of the total cost of € 60 million
At end 2014, the project was under implementation and expected to be completed by end 2015.
Environmental impact:
It is envisaged by the borrower that the energy consumption of each rehabilitated building will be reduced by 30% to 60%. The first tranche of € 15 million, disbursed in 2013, contributed to retrofitting some 6,300 dwellings in panel buildings with up to 3,000 sq. m of living area.
Social impact:
In addition to lowering the energy costs, the project will increase the buildings’ life expectancy and, at the same time, improve the living conditions of the final beneficiaries. For families at risk of poverty (approximately 12% of the final beneficiaries), energy savings could amount to more than 10% of their disposable income.
Retrofitting of multi-apartment buildings in Estonia (2008)
Objective: the retrofitting of about 17,700 dwellings in multiple-unit residential buildings built before 1993 and thus a reduction in greenhouse gas emissions in Estonia’s residential sector
Borrower: KredEx, Credit and Export Guarantee Fund
Beneficiaries: housing associations, co-operatives and communities of apartment owners
CEB loan: € 28.8 million, covering 50% of the total cost of € 57.6 million
| Par t B, Chapter 4. Social impac t |

Addressing environmental challenges and their social implications in Europe - CEB 2015
88
KredEx on-lent the CEB loan, together with the EU Structural Funds (€ 17 million or 29.5% of the cost), to two local commercial banks, SEB and Swedbank, that provided long maturity sub-loans at preferential interest rates to Estonian housing associations, co-operatives and communities of apartment owners. The remaining share came from KredEx (5.5%) and final beneficiaries (15%). This programme was implemented between 2008 and 2012, with technical assistance provided by KFW Bankengruppe.
Environmental impact:
The project enabled at least 20% savings in energy consumption, especially in smaller (up to 3,000 sq. m of living area) multi-apartment buildings that usually have less access to financing. CEB technical services estimated that this project assisted the country to consistently reduce greenhouse gas emissions by more than 24,000 tons of CO
2 per year.
Social impact:
The thermal rehabilitation of about 17,700 dwellings benefited directly more than 25,000 inhabitants. In addition to lowering the energy cost burden on the beneficiary households (with reductions between 7% and 20%, based on CEB estimations), the reduction in energy consumption is sufficient to cover the reimbursement of loans contracted within this project. Communication campaigns carried out in connection with this innovative project led to increasing awareness of the importance of energy saving measures among the population.
| Par t B, Chapter 4. Social impac t |

Addressing environmental challenges and their social implications in Europe - CEB 2015
89
Construction of stages 2, 3 and 4 of the Hellisheidi geothermal power plantin Iceland (2007)
Objective: the construction of stages 2, 3 and 4 of the Hellisheiði geothermal combined heat and power plant in the Hengill region in South-Western Iceland
• Component 1: installation of 2 high pressure turbines of 45 MW each (stage 2) • Component 2: installation of a low pressure turbine of 33 MW (stage 3) • Component 3: construction of a hot water plant (133 MW capacity) and pipeline to supply the district
heating system of Reykjavik (stage 4)
The additional electricity generating capacity was intended to provide electricity for an aluminium smelter, small businesses and the residential market.
Borrower: Reykjavik Energy
Beneficiaries: inhabitants of Reykjavik and surroundings (over 50% of the Icelandic population)
CEB loan: ISK 14,817 million (or € 145 million), covering 50% of the total cost of ISK 29,634 million
The project was implemented over the period 2007-2011 and co-financed by the EIB.
Environmental impact:
This CEB financing helped Reykjavik Energy to meet the increasing demand for electricity and hot water for space heating in the industrial and household sectors and contributed to protecting the environment via the production of renewable energy. In terms of environmental benefits, stages 2 and 3 enabled the saving of an estimated 800,000 tons of relative CO2 emissions per year.
Social impact:
The geothermal power plant now serves residential customers through the supply of district heating and electricity. Residential clients benefit from lower tariffs due to economies of scale achieved through energy sales to industrial users. Furthermore, the project directly created 18 jobs in the power plant and indirectly contributed to the creation of around 100 permanent highly skilled jobs in the smelting industry.
CASE STUDY 3. RENEWABLE ENERGY PRODUCTION
| Par t B, Chapter 4. Social impac t |

Addressing environmental challenges and their social implications in Europe - CEB 2015
90
Fire prevention in Castilla y León (2011)
Objective: With the overall aim of achieving compliance with EU environmental and water directives (see Appendix 1) for Castilla y León, this multi-sector scheme includes the following components:
• Component 1: the prevention of wildfire through silvicultural treatment (clean-up of forests) and measures to stop fire extension such as diversification (type of trees), the creation of discontinuities (silvicultural cutting with forest compartmentation), and a reduction in combustible material. Investments also included heavy and light equipment, civil works and signalisation.
• Component 2: the renovation of water distribution and wastewater treatment facilities.
Borrower: Junta de Castilla y León
Beneficiaries: inhabitants of the Castilla y León region
CEB loan: € 100 million, covering 48% of the total cost of € 208 million
The CEB loan was disbursed between 2012 and 2014 and co-financed by the EIB.
Environmental impact:
Under component 1, the environmental impact was largely positive: the silvicultural treatments not only reduced fires, but also enhanced biodiversity and adaptability to climate change in the forest areas of Castilla y León.
Under component 2, wastewater treatment improved the environmental conditions of the ground and surface water. In addition, as a result of this investment, the extended system of water supply provides water from reliable sources and avoids pumping from wells that could deplete ground water, thus preserving a valuable resource.
Social impact:
The whole population of Castilla y León (2 million inhabitants) stood to benefit from the fire prevention component as fires could randomly destroy large surfaces of forest in the region. Some direct beneficiaries (estimated by the borrower at 250,000 inhabitants) included workers and villagers concerned by fire prevention treatments in rural areas and inhabitants connected to new or renovated water supplies and wastewater treatment facilities.
CASE STUDY 4. DISASTER RISK MANAGEMENT
| Par t B, Chapter 4. Social impac t |

Addressing environmental challenges and their social implications in Europe - CEB 2015
91
Under component 2, the main social impact came from reduced health problems caused by polluted water. New water supply systems ensure that good quality water is provided to persons that did not have a proper system (i.e. the use of wells of non-reliable water) or who did not have a system guaranteeing sufficient quality.
Flood protection in Croatia (2014)
Objective: the construction of water regulation and flood protection facilities
• Component 1 (93% of the loan): a wide range of civil engineering and hydro-technical works in order to stop the rapid evolution of riverbank erosion, to reshape and recalibrate riverbeds through excavations, fillings and compensations in profile, to reconsolidate river embankments and to increase the stability of watercourses. The project also includes the rehabilitation and expansion of dykes, canals and channels, together with a number of hydro-technical works to improve and upgrade retention equipment and installations in order to improve flood risk management.
• Component 2 (7% of the loan): targeted capacity building measures to improve the operational management of flood risks and the direct implementation of flood protection measures.
Borrower: Ministry of Finance of the Republic of Croatia
Beneficiaries: populations living in the surroundings of high risk flood areas of the Danube and Adriatic River Basins
CEB loan: € 40 million, covering 50% of the total cost of € 80 million
CEB grant support: interest rate subsidy totalling € 1 million
The borrower expects to have fully allocated the entire loan to eligible expenditures by end 2018.
Environmental impact:
Several positive environmental impacts are expected:
• Protection of the environment from the pollution of known and unknown origin spread via flood waters. • Certain reservoirs to be built will preserve the ecological flow of rivers, thus avoiding floods and
droughts and consequently protecting the natural environment of these areas.
Social impact:
Significant direct impact is expected in terms of increased protection of populations from potentially devastating effects of floods. In addition, the project will have a major positive social and economic
| Par t B, Chapter 4. Social impac t |

Addressing environmental challenges and their social implications in Europe - CEB 2015
92
impact by preventing damage to property, infrastructure and cultural assets, and disturbances to economic activity in areas that are currently inadequately protected from flood threats.
Initial estimates suggest that the two phases of the project are expected to increase the area of the country with an acceptable risk of flooding by 5.5%, benefitting an additional 300,000 inhabitants45.
The Istanbul seismic risk mitigation and emergency preparedness project (2010, 2014)
Objective: the improvement of the resilience of critical public facilities and the strengthening of institutional and technical capacities for disaster management and emergency response
Borrower: Republic of Turkey
Beneficiaries: Inhabitants of Istanbul
CEB loan:
• Approved in 2010, CEB loan of € 250 million, covering 14% of the total cost of € 1.76 billion. • Approved in 2014, CEB loan of € 250 million, covering 14% of the total cost of € 1.76 billion.
CEB grant support: interest rate subsidy totalling € 4 million
The investment programme is co-financed by the EIB and the World Bank.
Within the first loan, financed between 2011 and 2014, the CEB funds: i) focused on the reconstruction of 90 public schools, one student dormitory campus and two police stations, ii) covered consultancy services for design, supervision and feasibility studies of various selected public buildings, and iii) allocated a small portion to financing activities aimed at social capacity building and public awareness for disaster preparedness.
The second CEB loan, approved in 2014 and expected to be completed by end 2019, will again mainly support the reconstruction and retrofitting of public schools and, to a lesser extent, other types of priority buildings (dormitories, social service and administrative buildings such as police stations). In addition, the CEB will contribute to financing the activities of the Istanbul Project Coordination Unit, which acts as the ISMEP project management entity.
45 These figures account for the potential impact on the inhabitants of flooded dwellings. Nevertheless, the inhabitants of the entire flooded areas would also benefit from these investments, given the potential reduction in risks and damage (e.g. roads or bridges destroyed, service disruption in schools).
| Par t B, Chapter 4. Social impac t |
Addressing environmental challenges and their social implications in Europe - CEB 2015
93
Environmental impact:
According to the appraisal conducted by the World Bank, the environmental assessment category for ISMEP has been determined to be B as the environmental risks from the project are minor to moderate in scale, local in extent, and can be easily identified, mitigated and monitored. Furthermore, the project is considered as environmentally positive as it helps minimise the potentially disastrous environmental consequences of an earthquake and ensures the existence of critical public facilities in the event of a disaster.
Social impact:
The project’s social impact is expected to be highly positive given its overall objective to save lives and reduce the social, economic and financial impacts of possible future earthquakes in the City of Istanbul. Earthquake risk mitigation and emergency preparedness investments and activities will benefit the entire population of Istanbul and will enhance safety and overall life quality in the city. The project also intends to raise the local community’s awareness and involvement in emergency preparedness and seismic risk mitigation efforts.
Most importantly, the retrofitting and reconstruction of public schools carried out so far and projected will allow about one million students and teachers to pursue educational activities in a safe environment. It is estimated that more than 150,000 additional school children, teachers and students will directly benefit from safe facilities.
| Par t B, Chapter 4. Social impac t |

94
Addressing environmental challenges and their social implications in Europe - CEB 2015
Addressing environmental challenges and their social implications in Europe - CEB 2015
95
This concluding section paves the way for reflections on the CEB’s potential avenues for action in environmental management, taking into account the Bank’s scope of action, regional vulnerabilities to projected environmental pressures across the Bank’s countries of operation in the years to come (analysed in Part A) and the CEB’s experience of over five decades in this field (described in Part B).
1. Helping countries address environmental pressures while focusing on social impact
Addressing environmental investment needs – upgrading infrastructure, greening the built environment and strengthening resilience to extreme climate events – and their social dimensions as identified in Part A is vital for limiting the economic, environmental and social costs of environmental pressures and for preserving our continent for future generations.
As shown in this publication, the CEB’s approach to environmental management reflects the primary purpose of the Bank to create better living conditions across Europe. The CEB strives to optimise social and environmental benefits for the targeted beneficiaries (directly) and for larger population groups (indirectly). The current sectoral line of action “Managing the Environment” provides the CEB with a broad range of financing options enabling it to address the current and projected environmental issues across its countries of operation.
As identified in Part A, almost all sectors and all regions of CEB countries will continue to be affected by environmental pressures, with varying degrees of vulnerability (see Table 2.5). Protecting vulnerable populations, whether it is from climate change, rapid urbanisation or other environmental pressures, is already a key element of the CEB’s action. As the study demonstrates, the CEB has been financing projects that address these environmental challenges without necessarily labelling them as such, particularly when it comes to adaptation measures. In terms of climate change mitigation, i.e. reducing greenhouse gas emissions, there are some limitations to what the CEB can do. The eligibility of renewable energy production, for example, is limited to facilities that are of “non-industrial nature”. The reasoning behind maintaining such a cautious approach reflects the CEB’s social mandate which does not extend to large-scale industrial operations.
Operating in a demand-driven context and within the scope of its financing, the CEB will thus continue to address environmental investment needs across Europe, maintaining its focus on social dimensions. The CEB will also strive to raise borrowers’ awareness of environmental pressures and encourage spending towards specific environmentally beneficial investments, such as energy efficiency, by offering attractive financing packages: blending loans with grants, providing technical assistance and offering loans with longer maturities which may be important in energy investments that tend to have long pay-back periods.
Moreover, building upon lessons learned is part of the CEB’s institutional commitment to optimising the social value of its projects. All projects are regularly monitored to ensure proper implementation and selected (groups of) projects are independently evaluated post-completion to assess impact and sustainability (see Appendix 4 for the CEB Project Cycle).
Concluding remarks: the way ahead
| Concluding remarks |

Addressing environmental challenges and their social implications in Europe - CEB 2015
96
When it comes to environmental management, in 2006, the CEB’s Evaluation Department released a first evaluation cycle on CEB natural and ecological disaster projects. This synthesis presents conclusions, lessons and recommendations for the CEB with a view to improving the effectiveness of its action in this field. Since 2011, individual evaluations have been conducted on projects covering environmental protection, energy efficiency and water supply and sanitation. The emerging findings from these project-specific evaluations will later become part of broader recommendations so as to enhance the value of the CEB’s activity in these areas. In addition, sharing in-house and with intermediaries the knowledge gained from prior operations based on regular monitoring is part of the CEB’s institutional learning to better target support.
2. Mainstreaming environment and climate change
In this demand-driven context, the CEB’s avenues for enhancing its contribution to preserving the environment are primarily concentrated on increasing environmental co-benefits in all projects entering the Bank’s pipeline. The following actions may be considered to this end:
• Measure and screen more to manage better
Systematic tracking of environmental benefits is an important tool for obtaining a reliable overview of the environmental action in the CEB’s portfolio and for making adjustments if needed. Specific indicators such as the OECD’s Rio Markers for tracking climate change finance could be used more systematically at project inception.
Projects could also be more thoroughly screened at inception to identify possibilities for adding co-benefits that help reduce the environmental pressures in the communities where the projects are implemented. Furthermore, to increase their viability and resilience, projects could be screened for their climate change vulnerability.
The CEB’s current Environmental Policy (see Box 2) includes commitments that support these approaches but the requirements for the CEB and the borrower should be clarified to make them more operational. An update of the policy that the CEB expects to complete in 2015 should provide for this.
• Mobilise additional funding to incentivise the borrower to undertake environmental measures
Borrowers tend to perceive environmental measures as an additional cost with an added value that may not be clearly tangible or with associated benefits that are often substantially deferred. Borrowers may also feel that such project add-ons create additional complexity. Blending loans with grants to cover the extra cost and technical assistance to support project implementation is an efficient incentive for making environmental co-benefits more attractive. To develop such incentives, the CEB could use its access to EU Structural Funds and other EU multilateral funding mechanisms, such as the Neighbourhood Investment Facility and Western Balkans Investment Framework. A specific bilateral facility, CEB-ELENA (European Local Energy Assistance), has already been set up with the European Commission to subsidise technical
| Concluding remarks |
Addressing environmental challenges and their social implications in Europe - CEB 2015
97
assistance to public entities for developing energy efficiency or renewable energy projects benefitting disadvantaged regions or populations.
• Raise awareness and strengthen communication to enhance the understanding of co-benefits
Lack of awareness, patchy expertise and the legacies of under-investment and mismanagement remain important obstacles for integrating environmental considerations in projects in Eastern European countries. Building awareness and providing training on environmental concerns for all relevant stakeholders are key to ensuring that these issues are well understood and integrated throughout the project cycle. Climate change risk assessment and adaptation, for example, are areas where the needs for adequate information and training are particularly high. Through partnerships with other IFIs and EU bodies, the CEB can contribute to the dissemination of environmental knowledge among its stakeholders.
| Concluding remarks |

Addressing environmental challenges and their social implications in Europe - CEB 2015
98
Brown L., Mcgrath P. and Stokes B., (1976). Twenty two dimensions of the population problem, Worldwatch Paper 5, Washington DC: Worldwatch Institute
Bouzarovski S. (2011), Energy poverty in the EU: a review of the evidence, November 2011
Buildings Performance Institute Europe (2014), Alleviating Fuel Poverty in the EU: Investing in home renovation, a sustainable and inclusive solution, May 2014
CMS Cameron McKenna LLP (2013), Waste Management in Central and Eastern Europe: 2020 Obligations. A sector under severe challenge, September 2013
Database “Urban-Rural Population and Land Area Estimates, v2 (1990, 2000, 2010, 2100)” from the Socioeconomic Data and Applications Center (SEDAC), accessed on 23 July 2014
ECORYS /for DG Environment (2014), Resource efficiency in the building sector, May 2014
Europa Website
European Commission Climate Action and European Climate Adaptation Platform, Climate-Adapt
European Commission (2013), Communication from the Commission to the European Parliament, the Council, the European Economic and Social Committee and the Committee of the Regions. An EU Strategy on adaptation to climate change, COM(2013) 216 final, Brussels, 16.4.2013
European Commission (2008), Addressing the social dimensions of environmental policy: a policy briefing, July 2008
European Environment Agency Website
European Environment Agency (2013), Adaptation in Europe: Addressing risks and opportunities from climate change in the context of socio-economic development, EEA Report N°03/2013, May 2013
European Environment Agency (2012), Climate Change, Impacts and Vulnerability in Europe, EEA Report N°12/2012, November 2012
European Environment Agency (2013), Environmental indicator report 2013: Natural resources and well-being in a green economy, November 2013
European Environment Agency (2010), Environmental trends and perspectives in the Western Balkans: future production and consumption patterns, EEA Report N°1/2010
Bibliography
| Bibl iography |

Addressing environmental challenges and their social implications in Europe - CEB 2015
99
European Environment Agency (2012), European waters – current status and future challenges. Synthesis, EEA Report N°09/2012, November 2012
European Environment Agency (2013), Managing municipal solid waste – a review of achievements in 32 European countries, EEA Report N°02/2013, March 2013
European Environment Agency (2014), Resource-efficient green economy and EU policies, EEA Report N°02/2014, July 2014
European Environment Agency (2007), Sustainable consumption and production in South East Europe and Eastern Europe, Caucasus and Central Asia, EEA Report N°03/2007, October 2007
European Environment Agency (2013), Targeted support to the update of analysis of global megatrends for the European Environment State and Outlook Report 2015 Global megatrends assessment. Increasing divergence in global population trends: Analysis for update and improved assessment of this megatrend, 25 July 2013
European Environment Agency (2012), Territorial cohesion and water management in Europe: the spatial perspective, EEA Report N°4/2012, August 2012
European Environment Agency (2013), Towards a green economy in Europe, EU environmental policy targets and objectives 2010-2050, EEA Report N°08/2013, July 2013
European Environment Agency (2012), Urban Adaptation to Climate in Europe: Challenges and Opportunities for Cities together with Supportive National and European Policies, EEA Report N°02/2012, May 2012
European Environment Agency (2011), Waste opportunities: Past and future climate benefits from better municipal waste management in Europe, EEA Report N°3/2011, August 2011
European Environment Agency (2009), Water resources across Europe – confronting water scarcity and drought, EEA Report N°02/2009, March 2009
European Environment Agency (2012), Water resources in Europe in the context of vulnerability. EEA 2012 state of water assessment, EEA Report N°11/2012, November 2012
European Environment Agency (2014), Why did greenhouse gas emissions decrease in the EU between 1990 and 2012?, June 2014
Eurostat Website
European Fuel Poverty and Energy Efficiency Project (2009), Tackling Fuel Poverty in Europe, Recommendations Guide for Policy Makers, September 2009
| Bibl iography |

Addressing environmental challenges and their social implications in Europe - CEB 2015
100
Free choices (2012), Policy Recommendations for Sustainable Rural Communities in Europe, White Paper, November 2012
Inter-American Development Bank (2011), IDB Integrated Strategy for Climate Change Adaptation and Mitigation, and Sustainable and Renewable Energy, 18 March 2011
International Organization for Migration (2009), Migration, Environment and Climate Change: Assessing the Evidence, 2009
IPCC Website
IPCC (2007), Fourth Assessment Report, Climate Change 2007: Impacts, Adaptation and Vulnerability, 2007
IPCC (2012), Special Report on Managing the Risks of Extreme Events and Disasters to Advance Climate Change Adaptation (SREX), November 2011
IPCC, 2014: Climate Change 2014: Impacts, Adaptation, and Vulnerability. Part A: Global and Sectoral Aspects. Contribution of Working Group II to the Fifth Assessment Report of the Intergovernmental Panel on Climate Change [Field, C.B., V.R. Barros, D.J. Dokken, K.J. Mach, M.D. Mastrandrea, T.E. Bilir, M. Chatterjee, K.L. Ebi, Y.O. Estrada, R.C. Genova, B. Girma, E.S. Kissel, A.N. Levy, S. MacCracken, P.R. Mastrandrea, and L.L. White (eds.)]. Cambridge University Press, Cambridge, United Kingdom and New York, NY, USA, 1132 pp.
IPCC, 2014: Climate Change 2014: Impacts, Adaptation, and Vulnerability. Part B: Regional Aspects. Contribution of Working Group II to the Fifth Assessment Report of the Intergovernmental Panel on Climate Change [Barros, V.R., C.B. Field, D.J. Dokken, M.D. Mastrandrea, K.J. Mach, T.E. Bilir, M. Chatterjee, K.L. Ebi, Y.O. Estrada, R.C. Genova, B. Girma, E.S. Kissel, A.N. Levy, S. MacCracken, P.R. Mastrandrea, and L.L. White (eds.)]. Cambridge University Press, Cambridge, United Kingdom and New York, NY, USA, 688 pp.
Kovats, R.S., R. Valentini, L.M. Bouwer, E. Georgopoulou, D. Jacob, E. Martin, M. Rounsevell, and J.-F. Soussana, 2014: Europe. In: Climate Change 2014: Impacts, Adaptation, and Vulnerability. Part B: Regional Aspects. Contribution of Working Group II to the Fifth Assessment Report of the Intergovernmental Panel on Climate Change [Barros, V.R., C.B. Field, D.J. Dokken, M.D. Mastrandrea, K.J. Mach, T.E. Bilir, M. Chatterjee, K.L. Ebi, Y.O. Estrada, R.C. Genova, B. Girma, E.S. Kissel, A.N. Levy, S. MacCracken, P.R. Mastrandrea, and L.L. White (eds.)]. Cambridge University Press, Cambridge, United Kingdom and New York, NY, USA, pp.1267-1326.
MURE ODYSSEE (2014), Energy Efficiency Trends for households in the EU, January 2014
OECD (2012), OECD Environmental Outlook to 2050. The consequences of inaction, June 2012
PLUREL (2011), Peri-Urbanisation in Europe. Towards European Policies to Sustain Urban-Rural Futures. Synthesis Report, 2011
| Bibl iography |

Addressing environmental challenges and their social implications in Europe - CEB 2015
101
Shared Socio-Economic Pathway Scenarios (SSPs) Database, accessed on 9 July 2014
Sir N. Stern (2007), The Economics of Climate Change: The Stern Review, January 2007
Special magazine for Rio+20 (2012), From Green Economy to Green Society: Bringing the Social to Rio+20
The United Nations Office for Disaster Risk Reduction, Hyogo Framework for Action (HFA), http://www.unisdr.org/we/coordinate/hfa accessed on 15 May 2014.
UNECE (2010), Committee on Housing and Land Management, Action plan for energy-efficient housing in the UNECE region, 2010
UNECE (2012), Committee on Housing and Land Management, Green Homes: Towards energy-efficient housing in the UNECE region, 2012
UNEP (2011), Cities: Investing in energy and resource efficiency, 2011
UN-HABITAT Website
United Nations Task Team on Social Dimensions of Climate Change (2011), The Social Dimensions of Climate Change, discussion draft released on 7 December 2011
World Bank (2009), Adapting to Climate Change in Europe and Central Asia, June 2009
World Bank (2012), Managing Disaster Risks for a Resilient Future. A Strategy for the Global Facility for Disaster Reduction and Recovery 2013-2015, December 2012
World Bank (2012), What a Waste. A Global Review of Solid Waste Management, March 2012
| Bibl iography |
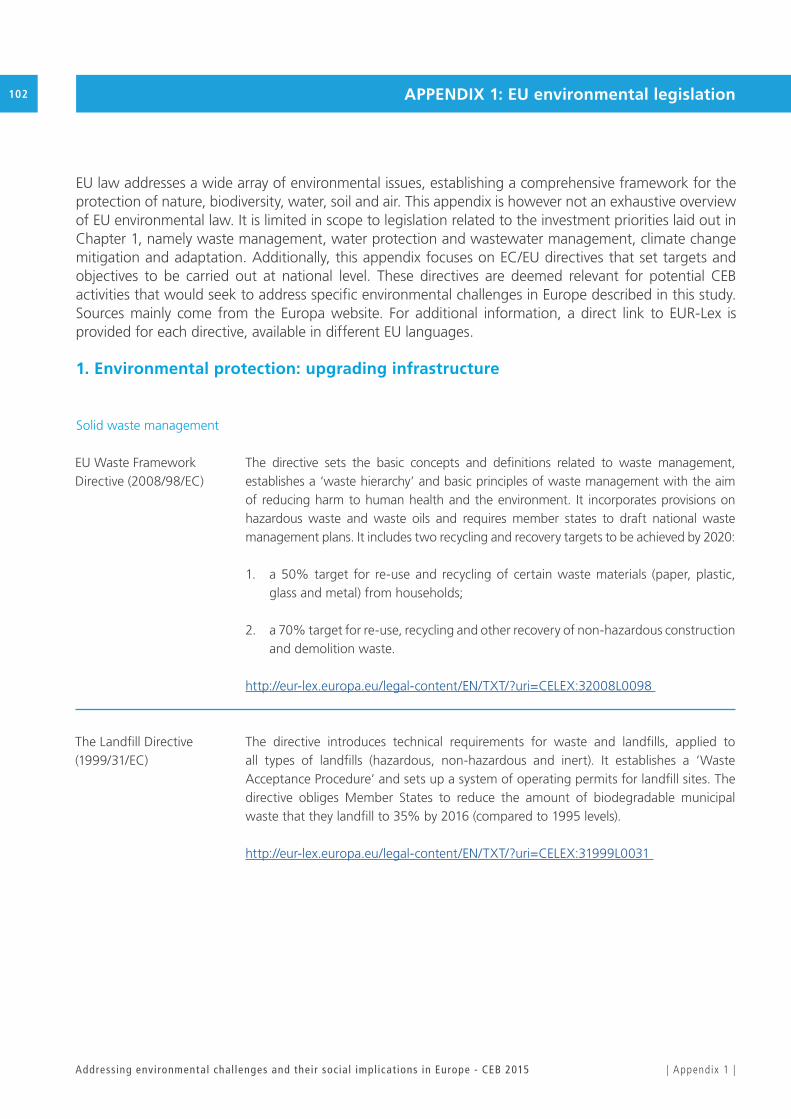
Addressing environmental challenges and their social implications in Europe - CEB 2015
102
| Appendix 1 |
APPENDIX 1: EU environmental legislation
EU law addresses a wide array of environmental issues, establishing a comprehensive framework for the protection of nature, biodiversity, water, soil and air. This appendix is however not an exhaustive overview of EU environmental law. It is limited in scope to legislation related to the investment priorities laid out in Chapter 1, namely waste management, water protection and wastewater management, climate change mitigation and adaptation. Additionally, this appendix focuses on EC/EU directives that set targets and objectives to be carried out at national level. These directives are deemed relevant for potential CEB activities that would seek to address specific environmental challenges in Europe described in this study. Sources mainly come from the Europa website. For additional information, a direct link to EUR-Lex is provided for each directive, available in different EU languages.
1. Environmental protection: upgrading infrastructure
EU Waste Framework Directive (2008/98/EC)
The Landfill Directive (1999/31/EC)
The directive sets the basic concepts and definitions related to waste management, establishes a ‘waste hierarchy’ and basic principles of waste management with the aim of reducing harm to human health and the environment. It incorporates provisions on hazardous waste and waste oils and requires member states to draft national waste management plans. It includes two recycling and recovery targets to be achieved by 2020:
1. a 50% target for re-use and recycling of certain waste materials (paper, plastic, glass and metal) from households;
2. a 70% target for re-use, recycling and other recovery of non-hazardous construction and demolition waste.
http://eur-lex.europa.eu/legal-content/EN/TXT/?uri=CELEX:32008L0098
The directive introduces technical requirements for waste and landfills, applied to all types of landfills (hazardous, non-hazardous and inert). It establishes a ‘Waste Acceptance Procedure’ and sets up a system of operating permits for landfill sites. The directive obliges Member States to reduce the amount of biodegradable municipal waste that they landfill to 35% by 2016 (compared to 1995 levels).
http://eur-lex.europa.eu/legal-content/EN/TXT/?uri=CELEX:31999L0031
Solid waste management
APPENDIX 1: EU environmental legislation

Addressing environmental challenges and their social implications in Europe - CEB 2015
103
Directive on the Incineration of Waste (2000/76/EC)
Directive on Port Reception Facilities of Ship-generated Waste and Cargo Residues (2000/59/EC)
Directive on Waste Electrical and Electronic Equipment (WEEE) (2012/19/EU)
Directive on Packaging and Packaging Waste (94/62/EC amended by Directive 2004/12/EC’)
The Water Framework Directive (WFD) (2000/60/EC)
To prevent or to reduce pollution to the environment (soil, air, water) caused by the incineration and co-incineration of waste, the directive sets operational conditions, technical requirements, monitoring requirements and emission limit values for incineration and co-incineration plants within the EU.
http://eur-lex.europa.eu/legal-content/EN/ALL/?uri=CELEX:32000L0076
The directive addresses in detail the legal, financial and practical responsibilities of the different operators involved in the delivery of ship-generated waste and cargo residues with the aim of reducing the discharges of ship-generated waste and cargo residues into the sea.
http://eur-lex.europa.eu/legal-content/EN/ALL/?uri=CELEX:32000L0059
The Directive aims to prevent or reduce the negative environmental effects resulting from the generation and management of WEEE and from resource use. It sets several binding re-use, recycling, recovery and collection targets for the various categories of WEEE by 2016 and 2018.
http://eur-lex.europa.eu/legal-content/EN/TXT/?uri=CELEX:32012L0019
This Directive establishes measures and targets aimed at limiting the production of packaging waste and promoting recycling, re-use and other forms of waste recovery.
http://eur-lex.europa.eu/legal-content/EN/TXT/?uri=CELEX:31994L0062
The objective is to prevent and reduce pollution, promote sustainable water usage, protect the environment, improve aquatic ecosystems and mitigate the effects of floods and droughts. All Member States are required to achieve an overall ‘good ecological and chemical status’ for all community waters by 2015. The directive introduces water management by ‘river basin’ (i.e. the natural geographical and hydrological unit) rather than political boundaries, setting a number of objectives for each river basin in respect of which the quality of water is protected.
http://eur-lex.europa.eu/legal-content/EN/TXT/?uri=CELEX:32000L0060
Water and Wastewater management
| Appendix 1 |

Addressing environmental challenges and their social implications in Europe - CEB 2015
104
Directive on Technical Specifications for Chemical Analysis and Monitoring of Water Status (2009/90/EC)
The Floods Directive (2007/60/EC)
Directive on the Protection of Groundwater against Pollution (2006/118/EC)
The Drinking Water Directive (98/83/EC)
The Bathing Water Directive (2006/7/EC)
Pursuant to the WFD, the directive seeks to establish common quality rules for chemical analysis and monitoring of water, sediment and biota to be carried out by Member States.
http://eur-lex.europa.eu/legal-content/EN/TXT/?uri=CELEX:32009L0090
The directive requires Member States to assess whether water courses and coast lines are at risk of flooding, to map the flood extent, assets and humans at risk in these areas, and to take adequate and coordinated measures to reduce the flood risk. By 2011, Member States had to undertake preliminary flood risk assessment of their river basins and associated coastal zones to identify flooding risks; by 2013, they had to develop flood hazard maps and flood risk maps for areas where real risks of flood damage exist; by 2015, flood risk management plans must be drawn up for those zones.
http://eur-lex.europa.eu/legal-content/EN/TXT/?uri=CELEX:32007L0060
Considered as the daughter directive to the WFD, the directive sets criteria for assessing the chemical status of groundwater, for identifying significant and sustained upward trends in groundwater pollution levels and for preventing and limiting indirect discharges.
http://eur-lex.europa.eu/legal-content/EN/TXT/?uri=CELEX:32006L0118
The directive lays down quality standards for drinking water at EU level and establishes a list of 48 microbiological and chemical indicator parameters to be monitored and tested regularly.
http://eur-lex.europa.eu/legal-content/EN/TXT/?uri=CELEX:31998L0083
The directive requires Member States to assess and monitor bathing water for at least two parameters of faecal bacteria and to ensure that, by the end of 2015 bathing season, all bathing waters are at least ‘sufficient’, based on clear bacteriological quality standards. Member States have the responsibility to inform the public about bathing water quality and beach management.
http://eur-lex.europa.eu/legal-content/EN/TXT/?uri=CELEX:32006L0007
| Appendix 1 |

Addressing environmental challenges and their social implications in Europe - CEB 2015
105
Directive on Urban Wastewater Treatment (91/271/EEC)
The Nitrates Directive (91/676/EEC)
The Energy Efficiency Directive (2012/27/EU)
As an integrated part of the WFD, this directive seeks to protect the environment from urban waste water discharges and discharges from certain industrial sectors. It introduces binding targets for collecting and treating urban wastewater for agglomerations superior to 2,000 people to be fully implemented by 2005 in EU-15 and by 2008-2015 for the remaining Member States. Secondary treatment of urban wastewater in smaller agglomerations is also required.
http://eur-lex.europa.eu/legal-content/EN/TXT/?uri=CELEX:31991L0271
The directive aims at protecting water quality in Europe by preventing nitrates from agricultural sources from polluting ground and surface water and by promoting the use of good farming practices. http://eur-lex.europa.eu/legal-content/EN/TXT/?uri=CELEX:31991L0676
The directive establishes a framework of measures for the promotion of energy efficiency within the Union in order to achieve the 20% headline target by 2020 and put the EU on track for further improvements beyond that date. The main requirements of this Directive are:
1. Renovation of public buildings: as from 1 January 2014, Member States have to renovate 3% of the total floor area of “heated and/or cooled buildings owned and occupied by their central government” each year.
2. Saving plans for utilities: By 2020, energy companies have to achieve a “cumulative end-use energy savings target” of at least 1.5% energy savings every year among their end clients.
3. Energy audits: All large enterprises are required to undergo an energy audit, which is to be carried out every four years by qualified and accredited experts. SMEs are excluded from this obligation at present; however, Article 8 of the Directive states “Member States shall develop programmes to encourage SMEs to undergo energy audits and the subsequent implementation of the recommendations from these audits”.
4. Financing facilities: Member States and regions should be encouraged to make full use of the Structural Funds and the Cohesion Fund to trigger investments in energy efficiency improvement measures.
Energy efficiency in buildings
2. Climate change mitigation: “greening” the built environment
| Appendix 1 |

Addressing environmental challenges and their social implications in Europe - CEB 2015
106
Energy End-use Efficiency and Energy Service Directive (2006/32/EC)
Directive on the Energy Performance of Buildings (2010/31/EU)
Directive on the Promotion of Cogeneration based on a useful Demand in the Internal Energy Market (2004/8/EC)
The Emissions Trading System Directive (ETS) (2009/29/EC)
Cleaner and renewable energy
5. Certification schemes for energy services: If deemed necessary, Member States will make available certification, accreditation or qualification schemes for providers of energy services, energy audits, energy managers and installers of energy-related building elements.
http://eur-lex.europa.eu/legal-content/EN/TXT/?uri=uriserv:OJ.L_.2012.315.01.0001.01.ENG
Member States must adopt and achieve an indicative energy saving target of 9% by 2016 in the framework of a national energy efficiency action plan. The directive also includes obligations on national public authorities as regards energy savings and energy efficient procurement and measures to promote energy efficiency and energy services.
http://eur-lex.europa.eu/legal-content/EN/ALL/?uri=CELEX:32006L0032
Member States are required to have a methodology for calculating energy performances of buildings and establish minimum requirements for energy performances to be reviewed every 5 years.
By 31 December 2020, all new buildings shall be ‘nearly zero-energy consumption buildings’. New buildings occupied and owned by public authorities shall comply with the same criteria by 31 December 2018.
http://eur-lex.europa.eu/legal-content/EN/ALL/?uri=CELEX:32010L0031
The directive aims at developing a transparent common framework to promote and facilitate the installation of cogeneration plants and is based on harmonised efficiency reference values for separate production of electricity and heat established by the Commission.
http://eur-lex.europa.eu/legal-content/EN/ALL/?uri=CELEX:32004L0008
Based on a cap-and-trade system, the EU ETS aims at reducing GHG emissions and combating climate change by introducing a limit on overall emissions to high-emitting industry sectors which is reduced each year. Companies receive or buy emission allowances that they can trade with one another as needed. After each year, companies
| Appendix 1 |

Addressing environmental challenges and their social implications in Europe - CEB 2015
107
Directive on Geological Storage of CO2
(2009/31/EC)
The Renewable Energy Directive (2009/28/EC)
have to surrender enough allowances to cover all their emissions or else a heavy fine is imposed, thus effectively placing climate change on the agenda of company boards, creating the incentive to reduce GHG emissions and to invest in environmentally sustainable technologies. It covers more than 11,000 power stations and industrial plants in 31 countries (EU-28, Iceland, Liechtenstein and Norway) as well as the aviation industry, altogether covering 45% of total GHG emissions in EU-28. By 2020, the target is to lower GHG emissions from 2005 levels by 21% in areas covered by the EU ETS.
http://eur-lex.europa.eu/legal-content/en/ALL/?uri=CELEX:32009L0029
The CCS Directive establishes a framework for the environmentally safe geological storage of CO2 to fight climate change. It lays down extensive requirements for selecting CO2 storage sites and substantiates the need to hold a ‘storage permit’.
http://eur-lex.europa.eu/legal-content/EN/TXT/?uri=CELEX:32009L0031
This directive establishes a common framework for the production and promotion of energy from renewable sources, including:
1. National targets and measures: Each Member State has a target calculated according to the share of energy from renewable sources in its gross final consumption for 2020. This target is in line with the overall ‘20-20-20’ goal for the EU. Moreover, the share of energy from renewable sources in the transport sector must amount to at least 10% of final energy consumption in the sector by 2020.
2. National renewable energy action plans: The Member States are to establish national action plans which set the share of energy from renewable sources consumed in transport, as well as in the production of electricity and heating, for 2020.
3. Member States must guarantee the origin of electricity, cooling and heating produced by renewables and must guarantee that grid operators transport and operate renewable energy, also ensuring priority access to the grid.
4. Energy from biofuels and bioliquids: from 1 January 2017, their share in emissions savings should be increased to 50%.
http://eur-lex.europa.eu/legal-content/EN/ALL/?uri=CELEX:32009L0028
| Appendix 1 |
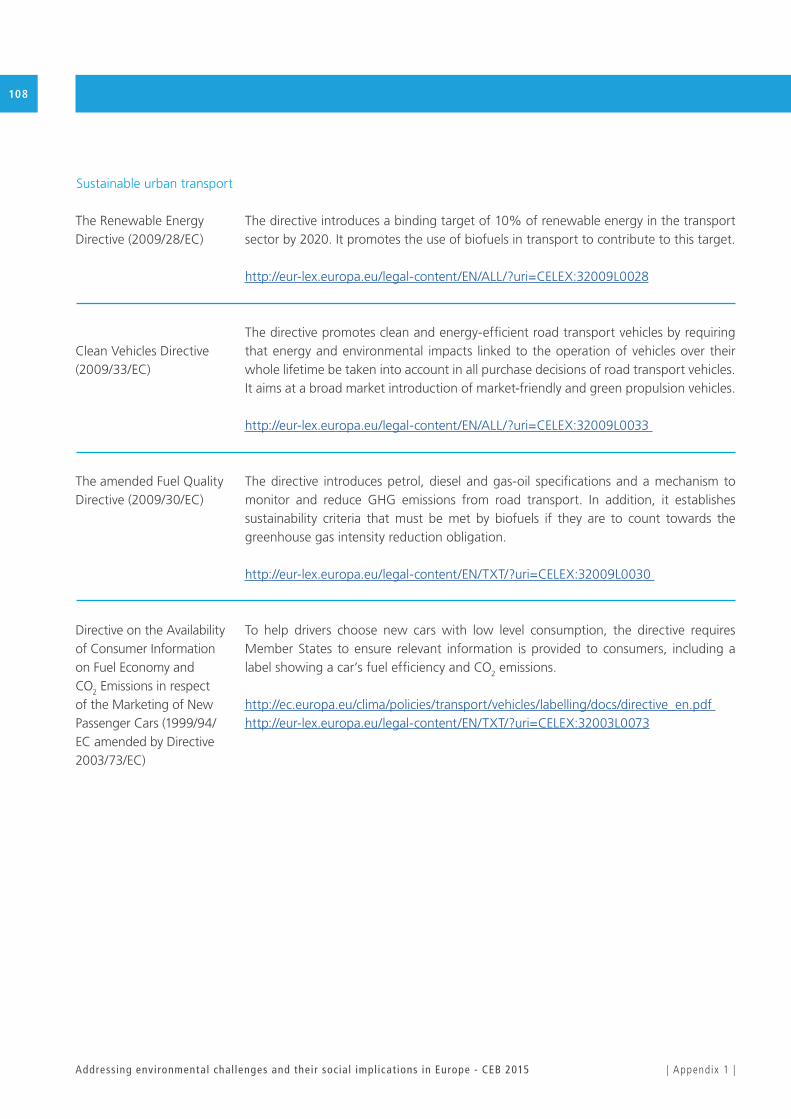
Addressing environmental challenges and their social implications in Europe - CEB 2015
108
The Renewable Energy Directive (2009/28/EC)
Clean Vehicles Directive (2009/33/EC)
The amended Fuel Quality Directive (2009/30/EC)
Directive on the Availability of Consumer Information on Fuel Economy and CO2 Emissions in respect of the Marketing of New Passenger Cars (1999/94/EC amended by Directive 2003/73/EC)
Sustainable urban transport
The directive introduces a binding target of 10% of renewable energy in the transport sector by 2020. It promotes the use of biofuels in transport to contribute to this target.
http://eur-lex.europa.eu/legal-content/EN/ALL/?uri=CELEX:32009L0028
The directive promotes clean and energy-efficient road transport vehicles by requiring that energy and environmental impacts linked to the operation of vehicles over their whole lifetime be taken into account in all purchase decisions of road transport vehicles. It aims at a broad market introduction of market-friendly and green propulsion vehicles.
http://eur-lex.europa.eu/legal-content/EN/ALL/?uri=CELEX:32009L0033
The directive introduces petrol, diesel and gas-oil specifications and a mechanism to monitor and reduce GHG emissions from road transport. In addition, it establishes sustainability criteria that must be met by biofuels if they are to count towards the greenhouse gas intensity reduction obligation.
http://eur-lex.europa.eu/legal-content/EN/TXT/?uri=CELEX:32009L0030
To help drivers choose new cars with low level consumption, the directive requires Member States to ensure relevant information is provided to consumers, including a label showing a car’s fuel efficiency and CO2 emissions.
http://ec.europa.eu/clima/policies/transport/vehicles/labelling/docs/directive_en.pdf http://eur-lex.europa.eu/legal-content/EN/TXT/?uri=CELEX:32003L0073
| Appendix 1 |

Addressing environmental challenges and their social implications in Europe - CEB 2015
109
Directive on Major Accident Hazards involving Dangerous Substances (2012/18/EU)
The Water Framework Directive (2000/60/EC)
The Floods Directive (2007/60/EC)
Directive on Safety of Offshore Oil and Gas Operations (2013/30/EU)
To prevent chemical accidents, the Seveso III Directive obliges Member States to ensure that operators inform the public of the danger related to hazardous substances, provide safety reports, safety management systems and internal emergency plans.
http://eur-lex.europa.eu/legal-content/EN/TXT/?uri=CELEX:32012L0018
The directive develops a stage for further interactions which link climate change adaptation and disaster risk reduction. It requires that ‘river basin management plans’ take climate change impacts into account and establishes preventive measures for issues relating to water management, notably water scarcity and droughts. Such management plans must be drawn up by 2015.
http://eur-lex.europa.eu/legal-content/EN/TXT/?uri=CELEX:32000L0060
The directive aims at reducing adverse consequences from floods by requiring the establishment of flood hazard maps, flood risk maps and flood risk management plans. It establishes a risk-based framework that focuses on prevention, protection and preparation.
http://eur-lex.europa.eu/legal-content/EN/TXT/?uri=CELEX:32007L0060
The directive establishes minimum requirements for preventing major accidents in offshore oil and gas operations and limiting the consequences of such accidents through risk assessment and management action. It sets clear rules that cover the whole lifecycle of all exploration and production activities from design to the final removal of an oil or gas installation. In addition, the highest safety standards must be followed at every oil and gas platform across Europe.
http://eur-lex.europa.eu/legal-content/EN/ALL/?uri=CELEX:32013L0030
Disaster risk management
| Appendix 1 |
3. Climate change adaptation: strengthening resilience to (extreme) climate events
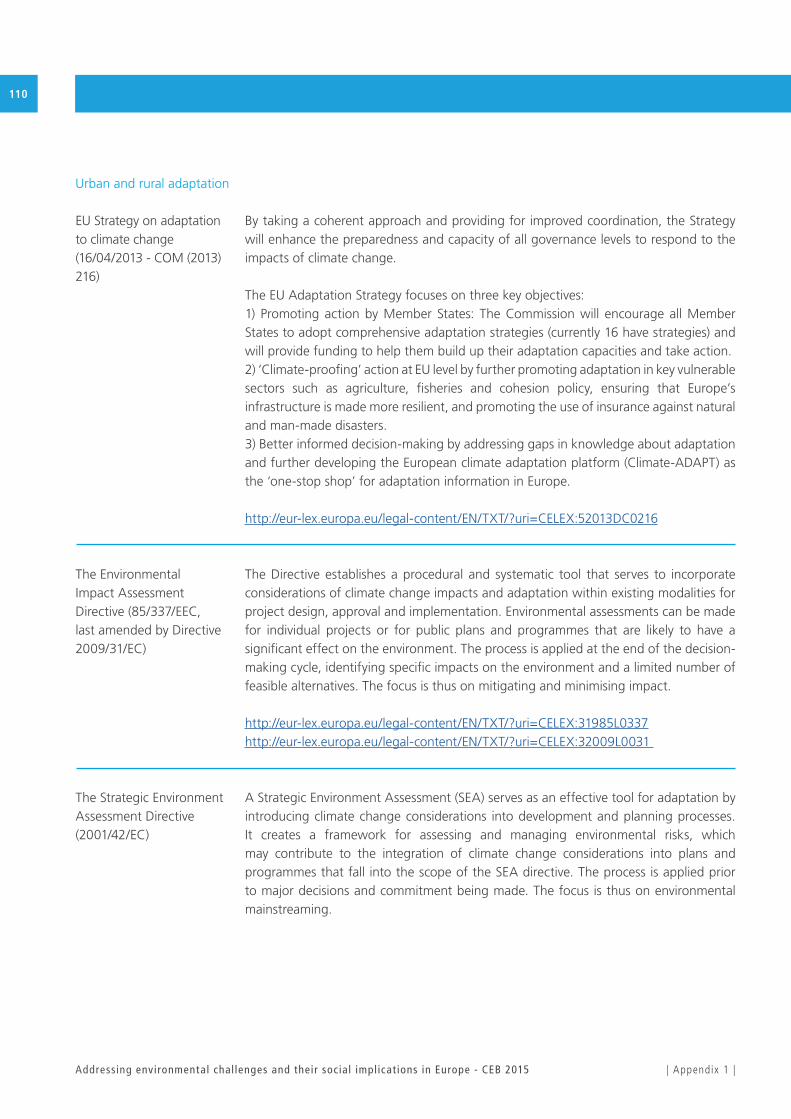
Addressing environmental challenges and their social implications in Europe - CEB 2015
110
EU Strategy on adaptation to climate change (16/04/2013 - COM (2013) 216)
The Environmental Impact Assessment Directive (85/337/EEC, last amended by Directive 2009/31/EC)
The Strategic Environment Assessment Directive (2001/42/EC)
Urban and rural adaptation
By taking a coherent approach and providing for improved coordination, the Strategy will enhance the preparedness and capacity of all governance levels to respond to the impacts of climate change.
The EU Adaptation Strategy focuses on three key objectives:1) Promoting action by Member States: The Commission will encourage all Member States to adopt comprehensive adaptation strategies (currently 16 have strategies) and will provide funding to help them build up their adaptation capacities and take action.2) ‘Climate-proofing’ action at EU level by further promoting adaptation in key vulnerable sectors such as agriculture, fisheries and cohesion policy, ensuring that Europe’s infrastructure is made more resilient, and promoting the use of insurance against natural and man-made disasters.3) Better informed decision-making by addressing gaps in knowledge about adaptation and further developing the European climate adaptation platform (Climate-ADAPT) as the ‘one-stop shop’ for adaptation information in Europe.
http://eur-lex.europa.eu/legal-content/EN/TXT/?uri=CELEX:52013DC0216
The Directive establishes a procedural and systematic tool that serves to incorporate considerations of climate change impacts and adaptation within existing modalities for project design, approval and implementation. Environmental assessments can be made for individual projects or for public plans and programmes that are likely to have a significant effect on the environment. The process is applied at the end of the decision-making cycle, identifying specific impacts on the environment and a limited number of feasible alternatives. The focus is thus on mitigating and minimising impact.
http://eur-lex.europa.eu/legal-content/EN/TXT/?uri=CELEX:31985L0337http://eur-lex.europa.eu/legal-content/EN/TXT/?uri=CELEX:32009L0031
A Strategic Environment Assessment (SEA) serves as an effective tool for adaptation by introducing climate change considerations into development and planning processes. It creates a framework for assessing and managing environmental risks, which may contribute to the integration of climate change considerations into plans and programmes that fall into the scope of the SEA directive. The process is applied prior to major decisions and commitment being made. The focus is thus on environmental mainstreaming.
| Appendix 1 |

Addressing environmental challenges and their social implications in Europe - CEB 2015
111
Directive establishing an Infrastructure for Spatial Information in the European Community (INSPIRE) (2007/2/EC)
The SEA Directive applies to a wide range of public plans and programmes (e.g. on land use, transport, energy, waste, agriculture, etc.).
http://eur-lex.europa.eu/legal-content/EN/TXT/?uri=CELEX:32001L0042
The directive lays down the rules for establishing, within the EU, an Infrastructure for Spatial Information (INSPIRE) whose purpose is to make it possible for interoperable spatial and environmental data and services related to these data to be exchanged, shared, accessed and used. INSPIRE aims to coordinate users and suppliers of information in such a way that information originating from different sectors will be combined and disseminated.
http://eur-lex.europa.eu/legal-content/EN/ALL/?uri=CELEX:32007L0002
| Appendix 1 |

Addressing environmental challenges and their social implications in Europe - CEB 2015
112
Less than 10% of the greenhouse gases emitted worldwide each year comes from the European Union (EU). The EU’s share of global emissions is falling as Europe reduces its own emissions whereas those from other parts of the world, especially the major emerging economies, continue to grow.
Total GHG emissions (excluding land use, land use changes and forestry) in the EU-28 have decreased by 19.2% since 1990, reaching their lowest level in 2012. Most EU Member States reduced emissions between 1990 and 2012. Almost 50% of the EU net decrease in GHG emissions was accounted for by Germany and the United Kingdom. The main reasons in Germany were increasing efficiency in power and heating plants and the economic restructuring of the five new Länder after the German reunification. Lower GHG emissions in the United Kingdom were primarily the result of liberalising energy markets and the subsequent fuel switch from oil and coal to gas in electricity production. On the negative side, Spain significantly increased emissions (+20%) despite its rapid deployment of renewable energy technologies.
For the EU as a whole, per capita emissions went down from about 12 tonnes of CO2-equivalent in 1990 to 9 tonnes of CO2 eq. in 2012, which is above the world average of around 7t CO2 eq. per person, similar to China’s 8t CO2 eq., but well below per capita emissions of 21t CO2 eq. in the United States46. Across the European continent, per capita emissions (see Figure A) varied largely in 2012: from around 6t CO2 eq. in Croatia, Hungary, Latvia, Romania, Sweden and Turkey, to 11.5t CO2 eq. in Germany, 13t CO2 eq. in Ireland and the Czech Republic, 14t CO2 eq. in Estonia and Iceland, and reaching 23t CO2 eq. in Luxembourg. This disparity in GHG emissions per capita mainly reflects differences in the fuel mix for the conversion of primary fuels to heat and electricity across Europe.
Figure A GHG emissions per capita by selected European countries, 1990-2012
APPENDIX 2: Reducing GHG emissions – the EU initiatives
| Appendix 2 |
46 Source: European Environment Agency (2014), Why did greenhouse gas emissions decrease in the EU between 1990 and 2012?, June 2014
Source: European Environmental Agency (EEA), EEA greenhouse gas - data viewer, accessed on 17 July 2014
1990 2000 2012
0
5
10
15
20
25
30
35
Luxe
mbo
urg
Esto
nia
Icel
and
Irela
nd
Cze
ch R
epub
lic
Ger
man
y
Net
herla
nds
Finl
and
Cyp
rus
Nor
way
Belg
ium
Pola
nd
Gre
ece
Aus
tria
Den
mar
k
Slov
enia
UK
EU15
EU28
Bulg
aria
Slov
ak R
epub
lic
Italy
Mal
ta
Fran
ce
Spai
n
Lith
uani
a
Port
ugal
Switz
erla
nd
Hun
gary
Cro
atia
Swed
en
Rom
ania
Turk
ey
Latv
ia
Mg
(to
nn
es)
- C
O2
equ
ival
ent

Addressing environmental challenges and their social implications in Europe - CEB 2015
113
Figure A also shows that most European countries decreased their per capita GHG emissions between 1990 and 2012, while Iceland, Cyprus, Slovenia and Spain recorded stable per capita levels, and Malta (+33%), Portugal (+7%) and Turkey (+73%) increased their per capita emissions.
EU leaders have committed to transforming Europe into a highly energy-efficient, low carbon economy. The EU has set itself targets for reducing its greenhouse gas emissions progressively up to 2050:
• Under the Kyoto Protocol, the 15 countries that were EU members before 2004 (‘EU-15’) committed to reducing their collective emissions to 8% below 1990 levels by the years 2008-2012. The latest emission monitoring and projections show that the EU-15 is on track to over-achieve this target47. Most Member States that have joined the EU since 2004 also have Kyoto reduction targets of 6% or 8% (5% in Croatia’s case) - which they are also on course to achieve.
• For 2020, the EU has committed to cutting its emissions to 20% below 1990 levels. This commitment is one of the headline targets of the Europe 2020 growth strategy and is being implemented through a package of binding legislation, known as the “20-20-20” targets. The EU has offered to increase its emissions reduction to 30% by 2020 if other major emitting countries in the developed and developing world commit to undertake their fair share of a global emissions reduction effort.
• For 2030, on 23 October 2014, EU leaders agreed on the EU’s (as a whole) greenhouse gas reduction target of at least 40% compared to 199048. The agreed greenhouse gas target will be the EU’s contribution to the global climate change agreement due to be concluded in Paris in 2015.
• For 2050, EU leaders have endorsed the objective of reducing Europe’s greenhouse gas emissions by 80-95% compared to 1990 levels as part of the efforts by developed countries as a group to reduce their emissions by a similar degree. The European Commission has published a roadmap for building the low-carbon European economy49 that this will require.
EU initiatives (see also Appendix 1) to reduce greenhouse gas emissions include:
• Implementing the EU Emissions Trading System (ETS), which has become the EU’s key tool for reducing greenhouse gas emissions from industry most cost-effectively;
• Adopting legislation to raise the share of energy consumption produced by renewable energy sources, such as wind, solar and biomass, to 20% by 2020;
• Setting a target to increase Europe’s energy efficiency by 20% by 2020 by improving the energy efficiency of buildings and a wide array of equipment and household appliances;
• Setting binding targets to reduce CO2 emissions from new cars and vans;
| Appendix 2 |
47 In 2012, EU-15 emissions were 15.1% below the base year under the Kyoto Protocol. That constituted a net reduction of 646 million tonnes of CO2-equivalents. The average reduction between 2008 and 2012 compared to base year was 11.8%.

Addressing environmental challenges and their social implications in Europe - CEB 2015
114
• Supporting the development of carbon capture and storage (CCS) technologies to trap and store CO2 emitted by power stations and other major industrial installations.
The “20-20-20” targets represent an integrated approach to climate and energy policy that aims to combat climate change, increase the EU’s energy security and strengthen its competitiveness. They are also headline targets of the Europe 2020 strategy for smart, sustainable and inclusive growth. This reflects the recognition that tackling the climate and energy challenges contributes to creating jobs, generating “green” growth and strengthening Europe’s competitiveness. It is estimated that meeting the 20% renewable energy target could have a net effect of creating around 417,000 additional jobs, while getting on track to achieving the 20% energy efficiency improvement by 2020 is forecast to boost net employment by some 400,000 jobs.
Source: http://ec.europa.eu/clima/policies/brief/eu/index_en.htm
| Appendix 2 |
48 The agreed targets also include an EU-wide binding target for renewable energy of at least 27% and an indicative energy efficiency target of at least 27%. For further details: http://ec.europa.eu/clima/policies/2030/index_en.htm 49For further details: http://ec.europa.eu/clima/policies/roadmap/index_en.htm

Addressing environmental challenges and their social implications in Europe - CEB 2015
115
Figure 1 IPCC sub-regional classification of Europe
APPENDIX 3: Climate trends and projections across Europe
Source: IPCC (2014), Climate Change 2014: Impacts, Adaptation, and Vulnerability, p. 1274
| Appendix 3 |

Addressing environmental challenges and their social implications in Europe - CEB 2015
116
Figure 2 EEA classification of Europe
Source: European Environment Agency (2012), Climate Change, Impacts and Vulnerability in Europe, 2012Note: The EEA’s classification of Central and Eastern Europe is different from the CEB’s classification of its target countries.
| Appendix 3 |

Addressing environmental challenges and their social implications in Europe - CEB 2015
117
50 In 2000, the IPCC published a set of emissions scenarios for use in climate change studies (Special Report on Emissions Scenarios – SREs). The SRES scenarios were constructed to explore future developments in the global environment with special reference to the production of GHGs and aerosol precursor emissions. The A1 storyline and scenario family describes a future world of very rapid economic growth, global population that peaks in mid-century and declines thereafter, and the rapid introduction of new and more efficient technologies. Major underlying themes are convergence among regions, capacity building and increased cultural and social interactions, with a substantial reduction in regional differences in per capita income. The A1 scenario family develops into three groups that describe alternative directions of technological change in the energy system. The three A1 groups are distinguished by their technological emphasis: fossil intensive (A1FI), non-fossil energy sources (A1T), or a balance across all sources (A1B) (where balanced is defined as not relying too heavily on one particular energy source, on the assumption that similar improvement rates apply to all energy supply and end-use technologies). Source: IPCC Website
Figure 3 Projected changes in selected climate parameters and indices for 2071-2100 with respect to 1971-2000 (A1B scenario50)
Source: IPCC (2014), Climate Change 2014: Impacts, Adaptation, and Vulnerability, Europe: Supplementary Material, p. SM23-3
| Appendix 3 |

Addressing environmental challenges and their social implications in Europe - CEB 2015
118
51 Representative Concentration Pathways (RCPs) are defined by their total radiative forcing (cumulative measure of human emissions of GHGs from all sources expressed in Watts per square meter). RCP4.5 is a stabilization-without-overshoot pathway to 4.5 W/m2 at stabilization after 2100. RCP8.5 is a rising radiative forcing pathway leading to 8.5 W/m2 in 2100. Source: IPCC Website
Figure 4 Projected changes in selected climate parameters and indices for 2071-2100 with respect to 1971-2000 (RCP4.5 and RCP8.551 scenarios)
Source: IPCC (2014), Climate Change 2014: Impacts, Adaptation, and Vulnerability, Europe: Supplementary Material, p. SM23-4
| Appendix 3 |

Addressing environmental challenges and their social implications in Europe - CEB 2015
119
Figure 5 Heavy precipitation, heat waves and dry spells, 2071-2100 compared to 1971-2000
| Appendix 3 |

Addressing environmental challenges and their social implications in Europe - CEB 2015
120
Source: IPCC (2014), Climate Change 2014: Impacts, Adaptation, and Vulnerability, Europe: Supplementary Material, p. SM23-4
| Appendix 3 |

Addressing environmental challenges and their social implications in Europe - CEB 2015
121
The CEB takes action in the form of loans and/or guarantees or through the use of trust accounts. The Bank offers flexible long-term loans at favourable interest rates, in specific cases accompanied by interest rate subsidies, to its Member States, their regional or local authorities, and public or private financial institutions (€ 2.1 billion in approved projects in 2014). For its borrowing activity, the Bank has been rated by Moody’s since 1988, by Standard & Poor’s since 1989 and by Fitch Ratings since 1996. Its principal long-term debt is rated Aa1 with a stable outlook by Moody’s, AA+ with a stable outlook by Standard & Poor’s and AA+ with a stable outlook by Fitch Ratings.
Along with loans, grant resources can be made available through the CEB’s fiduciary accounts in order to subsidise interest rates and/or to finance technical assistance. On a much smaller scale, the Bank also provides separate grants, especially in the case of emergency aid.
CEB projects are financed through long-term loans, disbursed in several tranches, generally with a grace period. The Bank’s activity thus makes it possible to alleviate the constraints weighing upon access to long-term credit for projects generating positive social impacts.
All CEB operations are granted in accordance with specific technical and social criteria and in strict compliance with public procurement rules. The eligibility criteria and general procedures for projects financed by the CEB are presented in the Policy for Loan and Project Financing – a reference document setting out provisions for the appraisal, approval, financing and monitoring of the Bank’s projects (the document is available on the CEB’s website).
The CEB is committed to the quality of its projects and strives to optimise their social added value. Assistance and monitoring throughout the whole project cycle therefore constitute key factors in the effective implementation of projects.
• At identification stage, project eligibility, feasibility and objectives, including a description of the means required to achieve the objectives, are analysed. This involves a thorough evaluation of the financial and technical sustainability of both the project and the borrower.
• At appraisal stage, social impact is the key consideration. The CEB performs an in-depth “two-pronged approach” assessment. The underlying premise of this methodology is that the social value of a CEB loan depends both on the intrinsic characteristics of a project and on the context in which that project is being carried out. To ensure greater social impact, the Bank also increasingly provides technical assistance for project preparation and implementation, namely through its fiduciary accounts and the Social Dividend Account.
• During approval by the Bank’s Administrative Council, CEB loans are considered not only in terms of their fulfilment of specific technical and social criteria but also of their alignment with the Bank’s environmental, procurement and compliance guidelines and policies. A framework loan agreement is negotiated and signed between the Bank and the borrower to provide a contractual basis for the project’s implementation.
APPENDIX 4: CEB Financing, Monitoring and Evaluation
| Appendix 4 |

Addressing environmental challenges and their social implications in Europe - CEB 2015
122
CEB project cycle
• After the first disbursement, the CEB carries out regular in-house reviews and on-site monitoring to assess the physical progress of works, compliance with costs and procurement procedures, and the achievement of expected social outcomes.
• Upon completion, the borrower draws up a final report detailing the use of funds and compliance with the pre-approved objectives. This report thus provides information on the material and social results. The Bank also plays a role in any eventual difficulties that could jeopardise the success of the project as well as an advisory role in solving any such difficulties.
• After completion, the CEB’s Evaluation Department, created at end 2002, conducts an independent evaluation of selected projects. Evaluation guidelines have been defined in accordance with international best practices and OECD-DAC guidelines52. The Evaluation Department reports directly to the Governor, who transmits the evaluation reports unaltered to the Administrative Council. Such evaluations enable the CEB to measure the medium-term impact of its support, strengthen the transparency of CEB operations and, through organisational learning, improve the quality of its on-going and future operations.
| Appendix 4 |
52 Each evaluation follows a rating system based on the following criteria: (1) Relevance (of objectives with regard to needs) (2) Effectiveness (achievement of objectives) (3) Efficiency (conversion of inputs into results)(4) Impact (broader, notably social or environmental, effects)(5) Sustainability (prospects for lasting effects beyond project implementation)


55, avenue KléberF-75116 PARIS, FranceTel : +33 (0)1 47 55 55 00Fax : +33 (0)1 47 55 03 38SWIFT : CEFPFRPPwww.coebank.org


