25, June 2017, V.1 | 1 Environmental Change Detection from SAR Images in ArcGIS Adapted from coursework developed by Franz J Meyer, Ph.D., Alaska Satellite Facility In this document you will find A. Background B. Materials List C. Steps D. Example Image E. Other Applications F. Further Reading A) Background Due to their 24/7 observation capabilities, SAR data are relevant for a broad range of applications in environmental monitoring and emergency response. However, identifying changes in images with complex content is difficult, as the image content often masks the signatures of change. A simple and highly effective change detection approach is the log- ratio scaling method. It is based on a differential analysis of repeated images and has shown to be effective in background suppression and change features enhancement. B) Materials List Computer running Windows Two RTC images o Options to obtain images: Download and unzip sample images Image 1 and Image 2 Download and unzip RTC ALOS PALSAR images using Vertex Process RTC images using Sentinel data ArcGIS Note: To identify RTC images suitable for change detection, ensure images are from the same season. This is important for change detection operations as it avoids seasonal changes and focuses on true environmental changes in a change detection analysis. Making remote-sensing data accessible since 1991
Transcript
25, June 2017, V.1 | 1
Environmental Change Detection from SAR Images in ArcGIS
Adapted from coursework developed by Franz J Meyer, Ph.D., Alaska Satellite Facility
In this document you will find
A. Background
B. Materials List
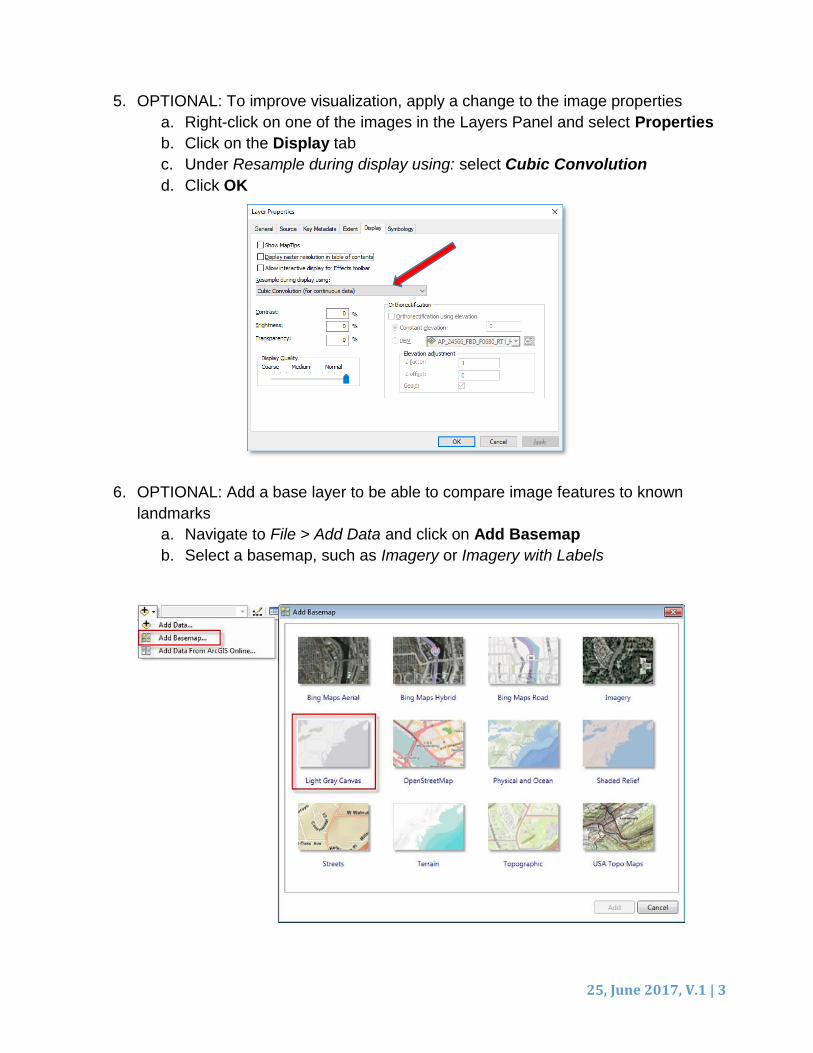
C. Steps
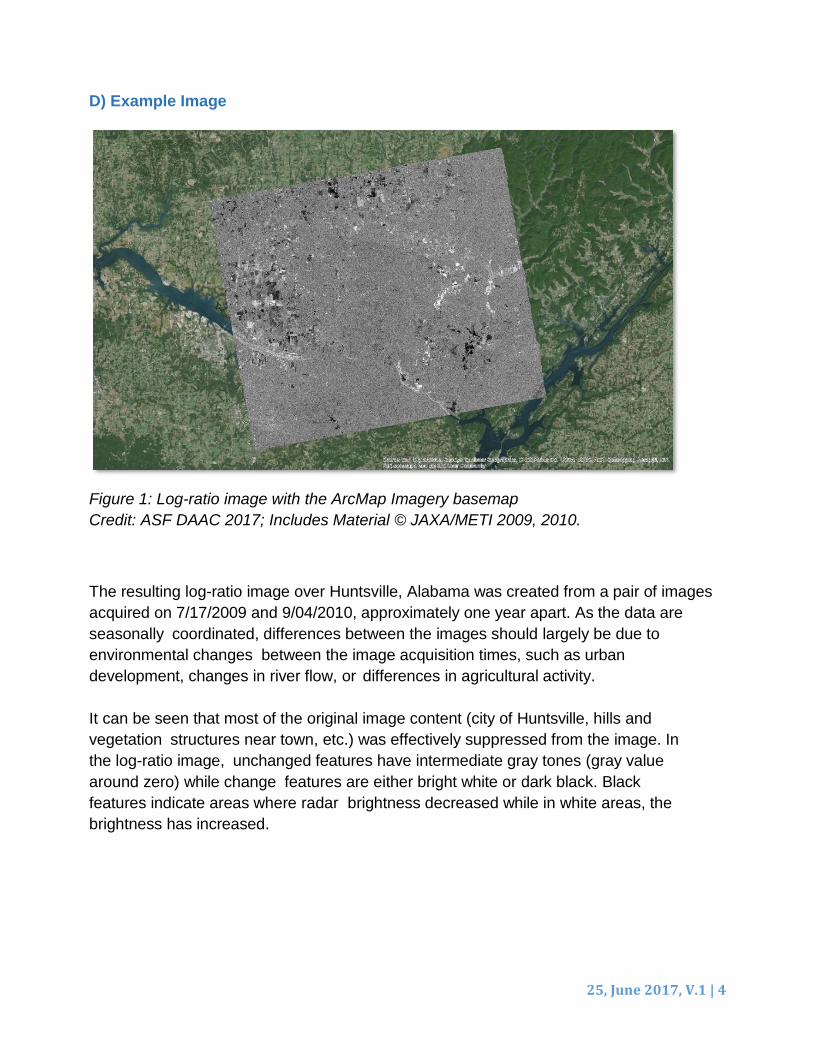
D. Example Image
E. Other Applications
F. Further Reading
A) Background
Due to their 24/7 observation capabilities, SAR data are relevant for a broad range of
applications in environmental monitoring and emergency response. However, identifying
changes in images with complex content is difficult, as the image content often masks the
signatures of change. A simple and highly effective change detection approach is the log-
ratio scaling method. It is based on a differential analysis of repeated images and has
shown to be effective in background suppression and change features enhancement.
B) Materials List
Computer running Windows
Two RTC images
o Options to obtain images:
Download and unzip sample images Image 1 and Image 2
Download and unzip RTC ALOS PALSAR images using Vertex
Process RTC images using Sentinel data
ArcGIS
Note: To identify RTC images suitable for change detection, ensure images are from the
same season. This is important for change detection operations as it avoids seasonal
changes and focuses on true environmental changes in a change detection analysis.
Select and download High-Res Terrain Corrected ALOS PALSAR repeated images over the logging areas near the Brazilian city of Altamira. Target similar seasons. Due to the evergreen vegetation in this tropical area, there is no preference for which season you choose. Use the Log-Ratio Scaling method as outlined in Section C. Note: To use Sentinel-1 data, please use high res GRD data. You must first extract, project, and scale to byte before the data can be used in the GIS environment.
25, June 2017, V.1 | 5
F) Further Reading
• Chatelain, F., Tourneret, J. Y., Inglada, J., and Ferrari, A., 2007, Bivariate Gamma
Distributions for Image Registration and Change Detection: IEEE Transactions on
Image Processing, v. 16, no. 7, p. 1796-1806.
• Cha, Miriam, Rhonda D. Phillips, Patrick J. Wolfe, and Christ D. Richmond.
"Two-Stage Change Detection for Synthetic Aperture Radar." (2015).
• Dogan, Ozan, and Daniele Perissin. "Detection of Multitransition Abrupt Changes
in Multitemporal SAR Images." Selected Topics in Applied Earth Observations
and Remote Sensing, IEEE Journal of 7, no. 8 (2014): 3239-3247.
• F. Bovolo and L. Bruzzone, "A detail-preserving scale-driven approach to
change detection in multitemporal SAR images," Geoscience and Remote
Sensing, IEEE Transactions on, vol. 43, pp. 2963-2972, 2005.
• J. Inglada and G. Mercier, "A new statistical similarity measure for change
detection in multitemporal SAR images and its extension to multiscale change
analysis," Geoscience and Remote Sensing, IEEE Transactions on, vol. 45, pp.
1432-1445, 2007.
• L. Bruzzone and D. F. Prieto, "Automatic analysis of the difference image for
unsupervised change detection," Geoscience and Remote Sensing, IEEE
Transactions on, vol. 38, pp. 1171-1182, 2000.
• R. J. Dekker, "Speckle filtering in satellite SAR change detection imagery,"
International Journal of Remote Sensing, vol. 19, pp. 1133-1146, 1998.
• S. Huang, "Change mechanism analysis and integration change detection
method on SAR images," The International Archives of the Photogrammetry,
Remote Sensing and Spatial Information Sciences. Vol. XXXVII. Part B7, 2008.
• S.-H. Yun, E. J. Fielding, F. H. Webb, and M. Simons, "Damage proxy
map from interferometric synthetic aperture radar coherence," ed: Google
Patents, 2012.
• T. Celik, "A Bayesian approach to unsupervised multiscale change detection in
synthetic aperture radar images," Signal processing, vol. 90, pp. 1471-1485,
2010.
• Y. Bazi, L. Bruzzone, and F. Melgani, "An unsupervised approach based on the
generalized Gaussian model to automatic change detection in multitemporal SAR
images," Geoscience and Remote Sensing, IEEE Transactions on, vol. 43, pp.
874-887, 2005.
• Xiong, Boli, Qi Chen, Yongmei Jiang, and Gangyao Kuang. "A threshold
selection method using two SAR change detection measures based on the
Markov random field model." Geoscience and Remote Sensing Letters, IEEE9,