International Journal of Applied Environmental Sciences
ISSN 0973-6077 Volume 12, Number 9 (2017), pp. 1733-1745
© Research India Publications
http://www.ripublication.com
Environmental crisis due to eutrophication in
Ludhiana city, Punjab, India.
Sharda Shakha1, Kaur Jasleen2 and Sharma Geetanjali 3
1 Post Graduate Government College, Sector-11, Chandigarh, India. 2 M.C.M.D.A.V. College, Sector-36, Chandigarh, India.
3 Post Graduate Government College, Sector-11, Chandigarh, India.
Abstract
The rapid stride of industrialization, increasing population pressure and
excessive use of fertilizers accelerated the problem of eutrophication in mega
city of Ludhiana. The water pollution, in Buddha Nallah stream passing
through the city carry sewage and industrial sludge to Sutlej River. 22 surface
water samples spatially located were analyzed for quality parameters such as
pH, EC, TDS, Ca2+, Mg2+, NO32-, PO4
3-, BOD, COD, As, Cd, Cr, Cu, Fe, Mn,
Ni, Pb and Zn. The results show high level of EC, TDS, NO, BOD, COD,
Chromium, Copper, Iron, Manganese and Nickel are due to the untreated
effluent discharged into the water bodies and these metals become phyto-toxic
at high concentrations indicating absence of self-purification mechanism in
Buddha Nallah. This paper highlights the environmental crisis in the area due
to eutrophication.
Keywords: Industrialization, Fertilizers, Environmental crisis and
Eutrophication
INTRODUCTION
Eutrophication is a complex process which occursboth in fresh and marine water and
cause excessive development of certain types of algae disturbing the aquatic
ecosystems and became threat for animal and human health. The aim of the study
deals with physico chemical analysis of surfacewater in both pre-monsoon (May) and
post-monsoon (November) in order to determine the nutrient status of water causing
eutrophication. The water of Ludhiana is polluted day by day due to industrial,
1734 Sharda Shakha, Kaur Jasleen and Sharma Geetanjali
agricultural as well as domestic waste and now has been on the state of
eutrophication. Eutrophication is the slow aging process during which a lake, estuary,
or bay evolves into a bog or marsh and eventually disappears (11). Eutrophication is
the process of enrichment of nutrients in an aquatic ecosystem (18). Cultural
eutrophication (excessive plant growth resulting from nutrient enrichment by human
activity) is the primary problem facing most surface waters today. It is one of the most
visible examples of human changes to the biosphere (5, 15). Eutrophication often
results from nutrient enrichment sewage, fertilizer runoff; even decomposing leaves in
street gutters can produce a human-caused increase in biological productivity called
cultural eutrophication (19). Due to tremendous development of industry and
agriculture, the water ecosystem has become appreciably altered in several respects in
recent years and as such they are exposed to all local disturbances regardless of where
they occur (17). The increasing industrialization, urbanization and developmental
activities, to cope up the population explosion have brought inevitable water crisis.
The health of rivers and their biological diversity are directly related to health of
almost every component of the ecosystem (10). Industrial wastes and domestic
sewage are the major urban sources of nutrient overload, responsible for 50% of the
total amount of phosphorus unloaded into lakes from human settlements (14).
Approximately 15% of the Indian population contributes phosphorus-containing
wastewater effluents to rivers and lakes, resulting in eutrophication. Other sources
that contribute to cultural eutrophication include the use of fertilizers, faulty septic
systems, and erosion into the lake. Industrial agriculture, with its reliance on
phosphate-rich fertilizers, is the primary source of excess phosphorus responsible for
degrading rivers and lakes (4). The routine application of chemical fertilizers and
phosphorus-laden manure has resulted in the gradual accumulation of phosphorus in
soil, which washes into lakes of the watershed where it is applied. On a global basis,
researchers have demonstrated a strong correlation between total phosphorus inputs
and algal biomass in lakes (2). Since 1950, phosphorus inputs to the environment
have been increasing as the use of phosphate-containing fertilizer, manure, and
laundry detergent has become more common (8). Consequently, humans release 75%
more phosphorus to the soil than would be naturally deposited by weathering of rock
(3). Even increases in minute amounts of the nutrient can stimulate tremendous
growth and productivity (1). According to an estimate, 400 grams of phosphates could
potentially induce an algal bloom to the extent of 350 tons (13).The Green Revolution
technology in the field of agriculture had put a great pressure on ecological balance,
resulting in the fall of ground water table, soil resources deterioration and
environmental pollution from farm chemicals. This imbalance results in global
warming and ozone depletion through agricultural practices and also poisoned the
environment (12) .In India many researchers have worked on physicochemical and
biological characteristics of reservoir’s and rivers (6), (7), (16), and (9).
Environmental crisis due to eutrophication in Ludhiana city, Punjab, India 1735
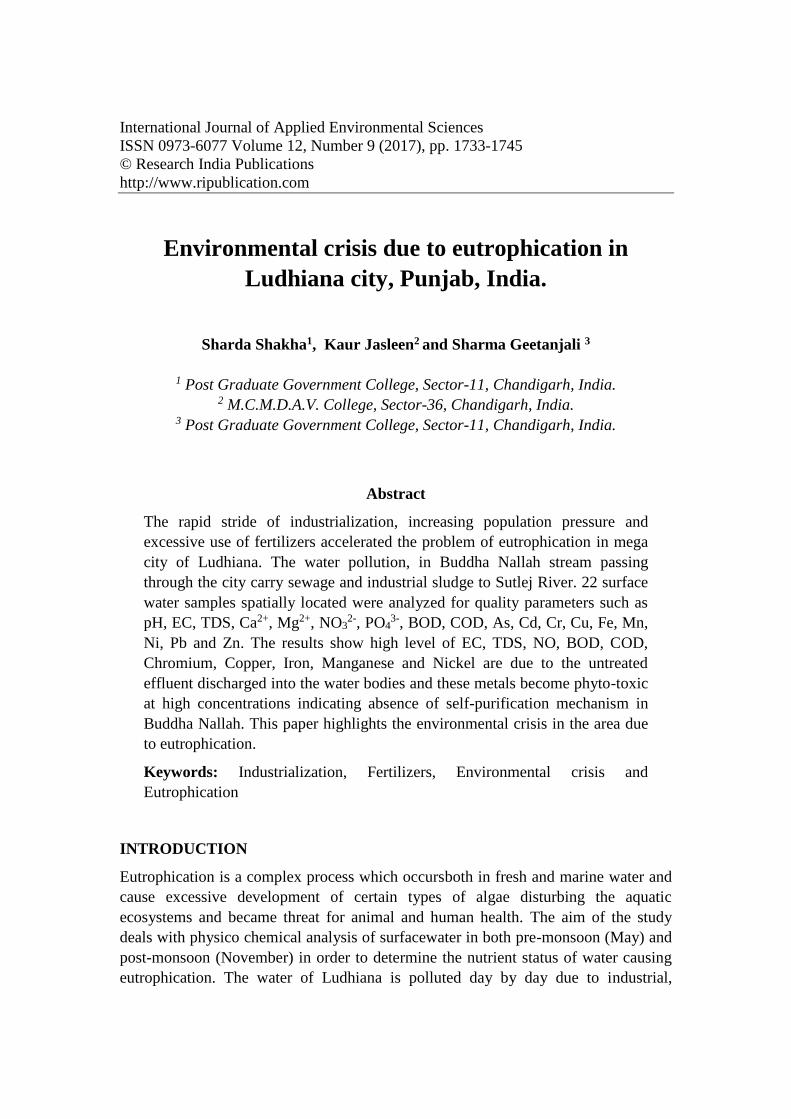
STUDY AREA
Figure 1: Location map of the study area
Geographically, Ludhiana district lies between North Latitude 30o-34' and 31
o-01' and
East longitude 75o-18' and 76
o-20' is the most centrally located district of the State of
Punjab as shown in Figure 1.Ludhiana is the first metropolitan city, popularly known
as “Manchester of India.” located on National Highway-I, has emerged as the most
vibrant and important business center of Punjab. It is the largest city in Punjab, both
in terms of area (3860 sq km) and population (approximately 34, 87,882 as per 2011
census). After the great strides in the field of agriculture, the total number of
industries has increased tremendously after 1980s. The maximum exports
(Rs.23.0billion) were from district Ludhiana (comprising 57.5%) of total exports from
the state (Statistical Abstract, 2005) which have the severe effect on the quality of
water of the Ludhiana district. There is an urgent need to reduce the anthropogenic
nutrient inputs to aquatic ecosystems in order to protect the water quality and to
reduce eutrophication. High nutrients intake is responsible for the proliferation of
harmful algal blooms and dead zones in an aquatic ecosystem. However both these
parameters have increased due to fertilizer use in agriculture, as well as from
municipal and industrial water waste.
1736 Sharda Shakha, Kaur Jasleen and Sharma Geetanjali
LENTIC WATER BODIES
Figure 2: Budha Nallah in Ludhiana City
The Buddha Nallah constitute thechief hydrographic feature of the areas. Budha
nallah takes its rise near Chamkaur Sahib and enters Ludhiana District near village
Bholapur. Buddha nallah carries the industrial and domestic waste of the Ludhiana
city, indicating high level of water pollution as shown in Figure 2.
Environmental crisis due to eutrophication in Ludhiana city, Punjab, India 1737
MATERIALS AND METHODS
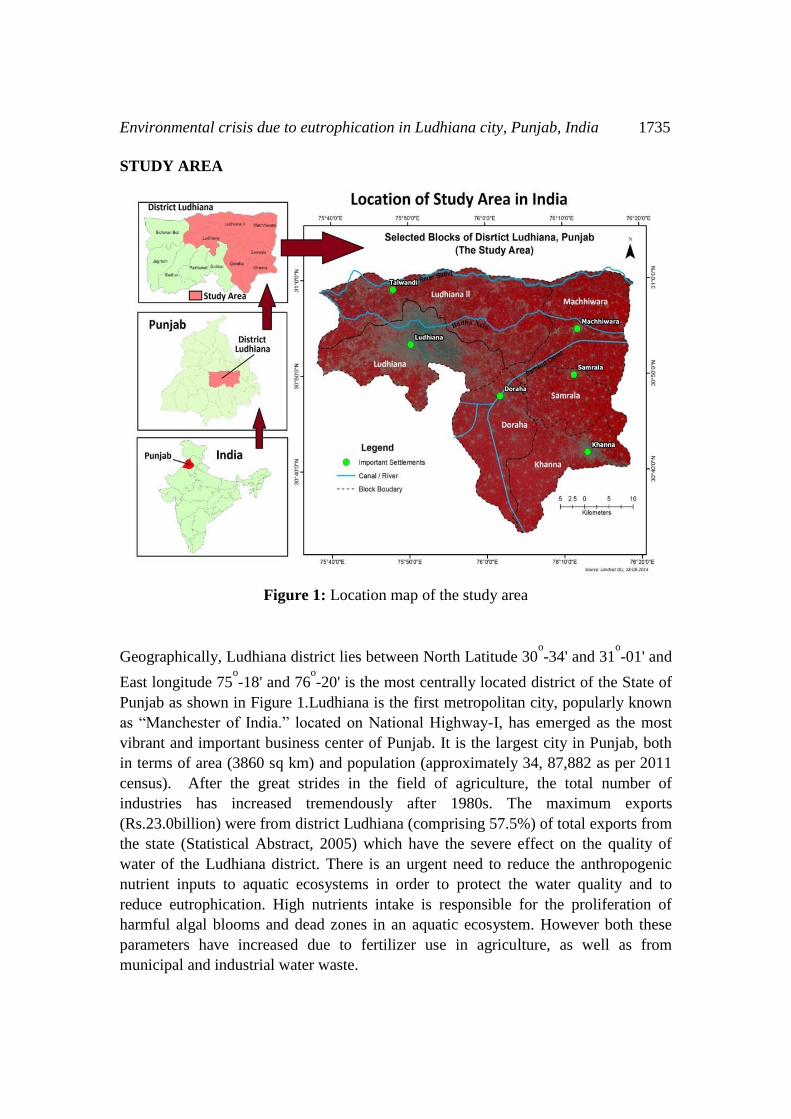
Figure 3: Surfacewater sampling points of the study area during pre and post
monsoon
The hydrochemical analyses of surface water have been carried out to check the
parameters causing eutrophication. 22 surface water have been collected from various
water sources of Ludhiana district during the Months of May and November 2014 as
shown in Figure 3. The samples from these areas have been collected from varying
depths of 2.5 mtrs to 110 mtrs. Sampling, preservation and analytical protocols were
conducted by standard methods. Good qualities, air tight plastic bottles with cover
lock were used for sample collection and safe transfer to the laboratories for analysis.
The surfacewater samples were analyzed to assess various chemical and physical
water quality parameters such as (pH, EC, TDS) and major elements such as (Ca2+,
Mg2+, NO32-,and PO4
3-) were evaluated according to the standard method
(APHA,2002, BIS,2012 and WHO,1996) within a short period of time to get a more
reliable and accurate results. Physical parameters like EC, pH, TDS were measured on
the spot at the time of sample collection using potable kit. Analysis were done for
major cations (Ca2+ and Mg2+) and anions (PO43- and NO3
-) using APHA method.
Mean value was calculated for each parameter, with standard deviation being used as
an indication of the precision of each parameter. The data were subjected to statistical
analysis using different computer programmes like Minitab16, Microsoft Office
Excel, Map Info. 6.5.
1738 Sharda Shakha, Kaur Jasleen and Sharma Geetanjali
Parameters Analytical Methods
Electrical Conductivity (EC) Soil and Water analysis kit (Electronic India,model-
161)
Total Dissolved Solids (TDS) By Factor (multiplying EC with 0.65)
pH pH meter
Calcium Titremetry (EDTA as titrant and murexide as
indicator))
Magnesium Titremetry (EDTA as titrant and erichrome black T as
indicator)
Nitrate Spectrophotometer (Phenol disulphonic acid )
BOD BOD Incubator ( 3 days at 27º C) (Winkler’s Method)
COD Dichromate reflux method
RESULTS AND DISCUSSIONS
The pH value of surfacewater during pre-monsoon is between 6.5 to 8.5 with
the mean value 7.35 and the value of surfacewater during post-monsoon varied
between 5.98 to 8.3 with the average value of 7.0.
The EC values of surfacewater during pre-monsoonranged between 326 µS/cm to
4692 µS/cm with the mean value of 1771.27 µS/cm and 315 µS/cm to 4587
µS/cm with the mean value of 1734.5 µS/cm during post-monsoon.
The value of TDS in surfacewater varied from 211.9mg/l to 3049.8mg/l
with the average value of 1151.32mg/l during pre-monsoon and 204.7mg/l
to 2981.5mg/l with the average value of 1127.4mg/l during post-monsoon.
The amount of calcium in surfacewater varied from 25.08mg/l to 76.11mg/l
with the average value of 55.41mg/l during pre-monsoon and 22.31mg/l to
77.84mg/l with the average value of 53.15 during post-monsoon.
The amount of magnesium in surfacewater during pre-monsoon varied
from 6.13mg/l to35.21mg/l with the mean value of 21.91mg/l and 6.54mg/l
to 34.19mg/l with the mean value of 21.30mg/l during post-monsoon.
The concentration of nitrate in surfacewater of the study area varied
between 19.14mg/l to 95.35mg/l with the mean value of 58.06mg/l during
pre-monsoon and 19.13mg/l to 90.21mg/l with the mean value of 56.0mg/l
during post-monsoon.
The concentration of phosphate in surfacewater during pre-monsoon ranged
between 0.021mg/l to 2.07mg/l with the mean value of 0.748mg/l and 0.021mg/l
Environmental crisis due to eutrophication in Ludhiana city, Punjab, India 1739
to 2.06mg/l with the mean value of 0.69mg/l during post-monsoon.
In pre-monsoon season the BOD concentration ranged between 51 mg/l to 192
mg/l with mean value of 119.5 mg/l in surfacewater samples.
In post-monsoon season the concentration of BOD ranged between 49.12
mg/l to 190 mg/l with mean value of 119.4 mg/l in surfacewater samples.
In pre-monsoon season the COD concentration of surfacewater samples
ranged between 98 mg/l to 443 mg/l with mean value of 262.68 mg/l.
In post-monsoon season the concentration of COD in the surfacewater samples
ranged between 96 mg/l to 441mg/l with mean value of 262.5 mg/l.
Tables 1 and 2 show the chemical analysis of surfacewater during pre and post-
monsoon followed by Table 3 which shows the surfacewater parameters above
desirable and permssiblelimits.
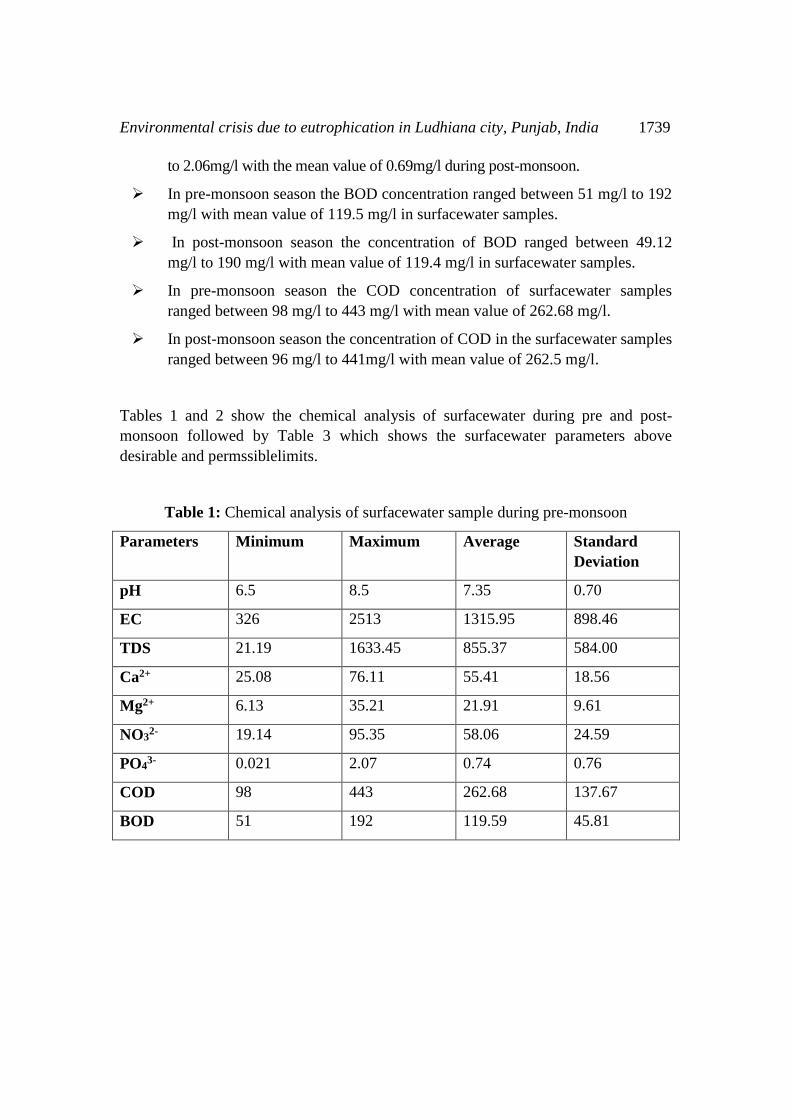
Table 1: Chemical analysis of surfacewater sample during pre-monsoon
Parameters Minimum Maximum Average Standard
Deviation
pH 6.5 8.5 7.35 0.70
EC 326 2513 1315.95 898.46
TDS 21.19 1633.45 855.37 584.00
Ca2+ 25.08 76.11 55.41 18.56
Mg2+ 6.13 35.21 21.91 9.61
NO32- 19.14 95.35 58.06 24.59
PO43- 0.021 2.07 0.74 0.76
COD 98 443 262.68 137.67
BOD 51 192 119.59 45.81
1740 Sharda Shakha, Kaur Jasleen and Sharma Geetanjali
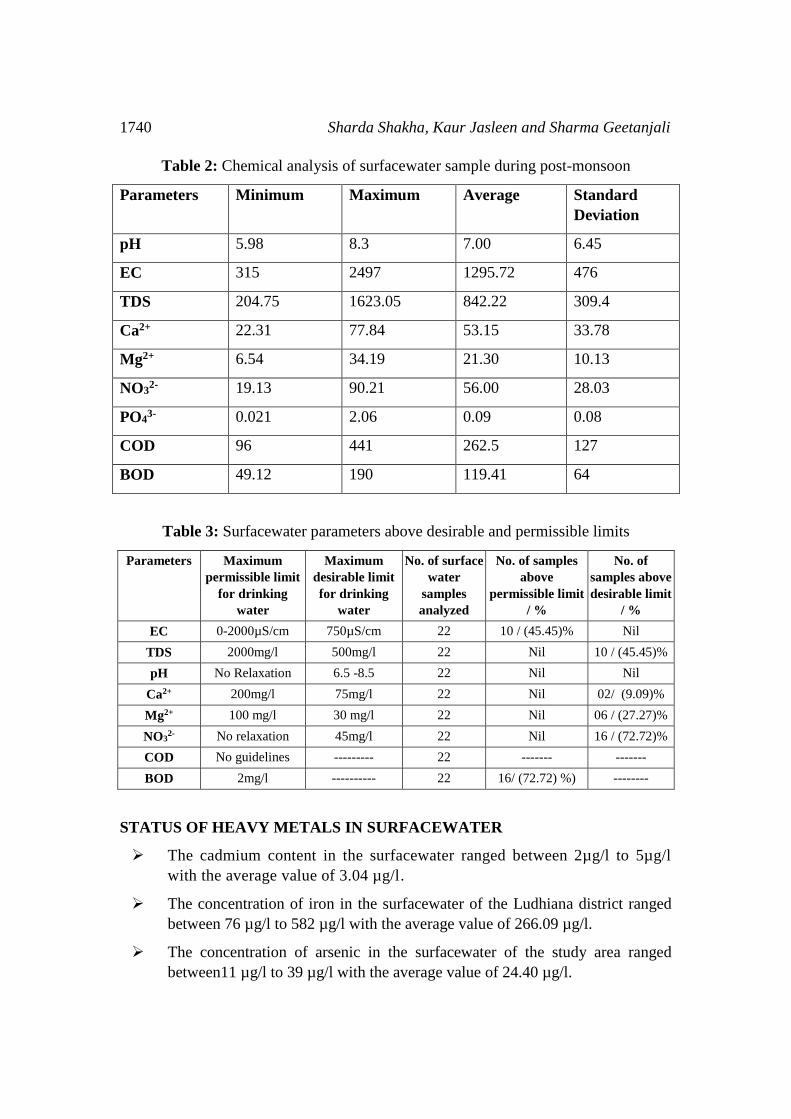
Table 2: Chemical analysis of surfacewater sample during post-monsoon
Parameters Minimum Maximum Average Standard
Deviation
pH 5.98 8.3 7.00 6.45
EC 315 2497 1295.72 476
TDS 204.75 1623.05 842.22 309.4
Ca2+ 22.31 77.84 53.15 33.78
Mg2+ 6.54 34.19 21.30 10.13
NO32- 19.13 90.21 56.00 28.03
PO43- 0.021 2.06 0.09 0.08
COD 96 441 262.5 127
BOD 49.12 190 119.41 64
Table 3: Surfacewater parameters above desirable and permissible limits
Parameters Maximum
permissible limit
for drinking
water
Maximum
desirable limit
for drinking
water
No. of surface
water
samples
analyzed
No. of samples
above
permissible limit
/ %
No. of
samples above
desirable limit
/ %
EC 0-2000µS/cm 750µS/cm 22 10 / (45.45)% Nil
TDS 2000mg/l 500mg/l 22 Nil 10 / (45.45)%
pH No Relaxation 6.5 -8.5 22 Nil Nil
Ca2+ 200mg/l 75mg/l 22 Nil 02/ (9.09)%
Mg2+ 100 mg/l 30 mg/l 22 Nil 06 / (27.27)%
NO32- No relaxation 45mg/l 22 Nil 16 / (72.72)%
COD No guidelines --------- 22 ------- -------
BOD 2mg/l ---------- 22 16/ (72.72) %) --------
STATUS OF HEAVY METALS IN SURFACEWATER
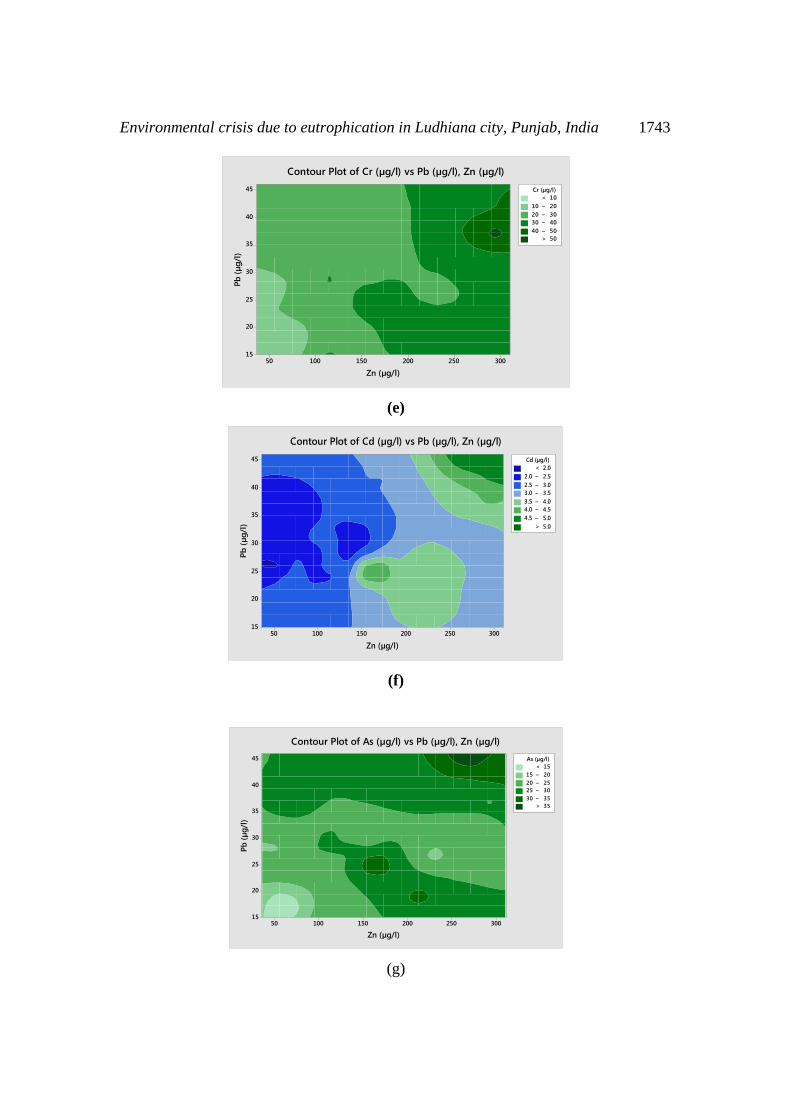
The cadmium content in the surfacewater ranged between 2µg/l to 5µg/l
with the average value of 3.04 µg/l.
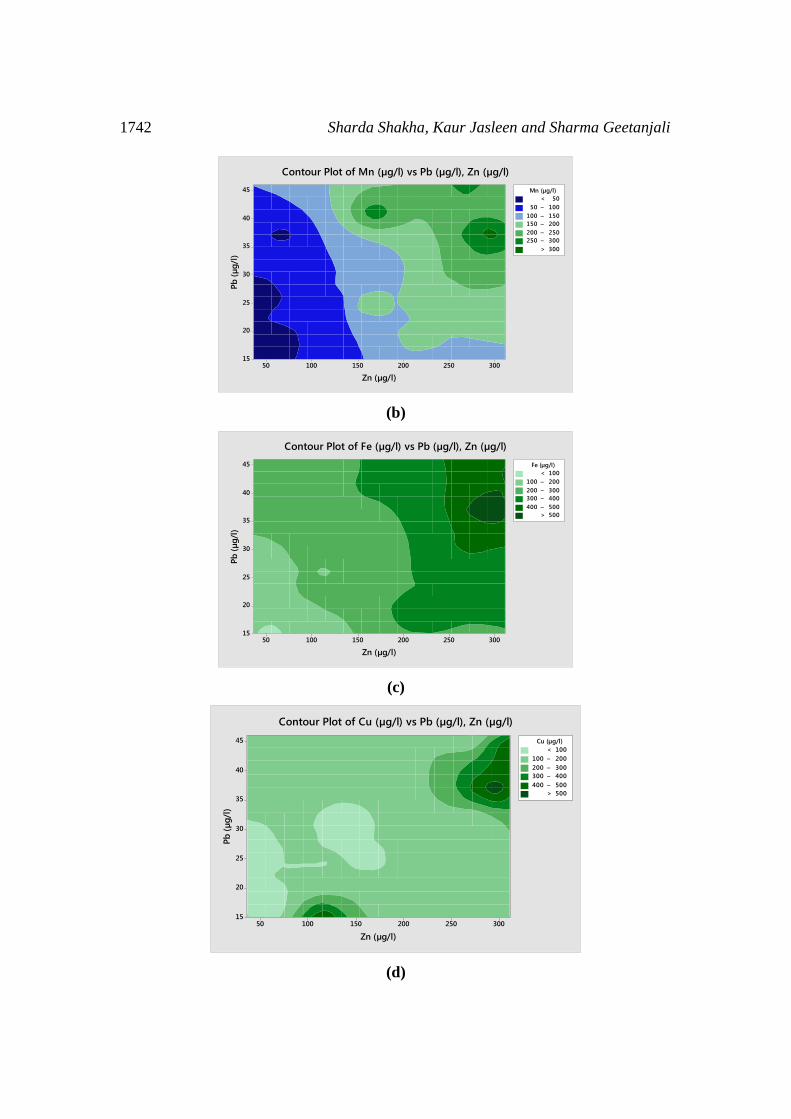
The concentration of iron in the surfacewater of the Ludhiana district ranged
between 76 µg/l to 582 µg/l with the average value of 266.09 µg/l.
The concentration of arsenic in the surfacewater of the study area ranged
between11 µg/l to 39 µg/l with the average value of 24.40 µg/l.
Environmental crisis due to eutrophication in Ludhiana city, Punjab, India 1741
Lead concentration in the surfacewater of the study area ranged between 15
µg/l to 46 µg/l with the average value of 28.36 µg/l.
The concentration of chromium in the surfacewater of the study area ranged
between 9 µg/l to 51 µg/l with the average value of 26.86 µg/l.
The concentration of copper in the surfacewater of the study area ranged
between 47 µg/l to 532 µg/l with the average value of 155.5 µg/l.
The concentration of manganese in the surfacewater of the study area ranged
between 11 µg/l to 309 µg/l with the average value of 120.54 µg/l.
The nickel concentration in the surfacewater of the study area ranged between
6 µg/l to 31 µg/l with the average value of 13.81 µg/l.
The zinc concentration in the surfacewater of the study area varies from 36
µg/l to 311 µg/l with the average value of 141.81 µg/l.
The status of heavy metal in surfacewater of the study area are shown in the form of
contours in Figure 4 (a-g) followed by Table 4 showing parameters of heavy metals in
surfacewater above permissible and desirable limit
(a)
Zn (µg/l)
Pb
(µ
g/l
)
30025020015010050
45
40
35
30
25
20
15
>
–
–
–
–
< 10
10 15
15 20
20 25
25 30
30
Ni (µg/l)
Contour Plot of Ni (µg/l) vs Pb (µg/l), Zn (µg/l)
1742 Sharda Shakha, Kaur Jasleen and Sharma Geetanjali
(b)
(c)
(d)
Zn (µg/l)
Pb
(µ
g/l
)
30025020015010050
45
40
35
30
25
20
15
>
–
–
–
–
–
< 50
50 100
100 150
150 200
200 250
250 300
300
Mn (µg/l)
Contour Plot of Mn (µg/l) vs Pb (µg/l), Zn (µg/l)
Zn (µg/l)
Pb
(µ
g/l
)
30025020015010050
45
40
35
30
25
20
15
>
–
–
–
–
< 100
100 200
200 300
300 400
400 500
500
Fe (µg/l)
Contour Plot of Fe (µg/l) vs Pb (µg/l), Zn (µg/l)
Zn (µg/l)
Pb
(µ
g/l
)
30025020015010050
45
40
35
30
25
20
15
>
–
–
–
–
< 100
100 200
200 300
300 400
400 500
500
Cu (µg/l)
Contour Plot of Cu (µg/l) vs Pb (µg/l), Zn (µg/l)
Environmental crisis due to eutrophication in Ludhiana city, Punjab, India 1743
(e)
(f)
(g)
Zn (µg/l)
Pb
(µ
g/l
)
30025020015010050
45
40
35
30
25
20
15
>
–
–
–
–
< 10
10 20
20 30
30 40
40 50
50
Cr (µg/l)
Contour Plot of Cr (µg/l) vs Pb (µg/l), Zn (µg/l)
Zn (µg/l)
Pb
(µ
g/l
)
30025020015010050
45
40
35
30
25
20
15
>
–
–
–
–
–
–
< 2.0
2.0 2.5
2.5 3.0
3.0 3.5
3.5 4.0
4.0 4.5
4.5 5.0
5.0
Cd (µg/l)
Contour Plot of Cd (µg/l) vs Pb (µg/l), Zn (µg/l)
Zn (µg/l)
Pb
(µ
g/l
)
30025020015010050
45
40
35
30
25
20
15
>
–
–
–
–
< 15
15 20
20 25
25 30
30 35
35
As (µg/l)
Contour Plot of As (µg/l) vs Pb (µg/l), Zn (µg/l)
1744 Sharda Shakha, Kaur Jasleen and Sharma Geetanjali
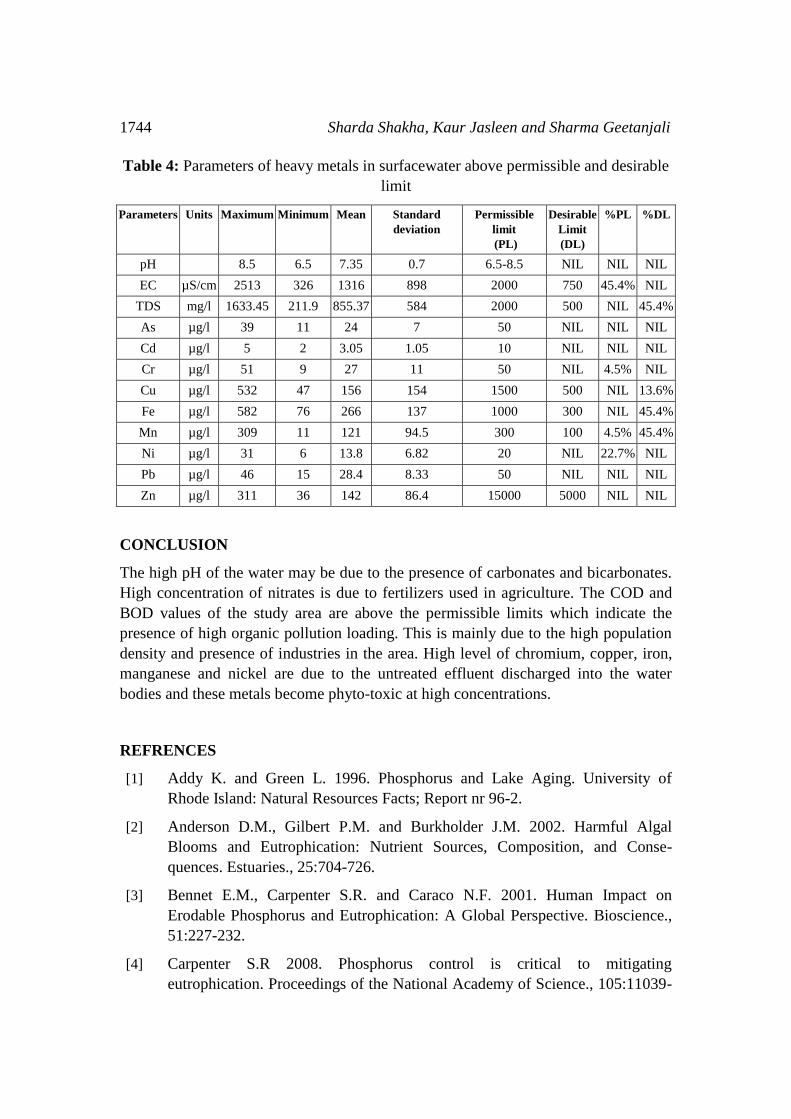
Table 4: Parameters of heavy metals in surfacewater above permissible and desirable
limit
Parameters Units Maximum Minimum Mean Standard
deviation
Permissible
limit
(PL)
Desirable
Limit
(DL)
%PL %DL
pH 8.5 6.5 7.35 0.7 6.5-8.5 NIL NIL NIL
EC µS/cm 2513 326 1316 898 2000 750 45.4% NIL
TDS mg/l 1633.45 211.9 855.37 584 2000 500 NIL 45.4%
As µg/l 39 11 24 7 50 NIL NIL NIL
Cd µg/l 5 2 3.05 1.05 10 NIL NIL NIL
Cr µg/l 51 9 27 11 50 NIL 4.5% NIL
Cu µg/l 532 47 156 154 1500 500 NIL 13.6%
Fe µg/l 582 76 266 137 1000 300 NIL 45.4%
Mn µg/l 309 11 121 94.5 300 100 4.5% 45.4%
Ni µg/l 31 6 13.8 6.82 20 NIL 22.7% NIL
Pb µg/l 46 15 28.4 8.33 50 NIL NIL NIL
Zn µg/l 311 36 142 86.4 15000 5000 NIL NIL
CONCLUSION
The high pH of the water may be due to the presence of carbonates and bicarbonates.
High concentration of nitrates is due to fertilizers used in agriculture. The COD and
BOD values of the study area are above the permissible limits which indicate the
presence of high organic pollution loading. This is mainly due to the high population
density and presence of industries in the area. High level of chromium, copper, iron,
manganese and nickel are due to the untreated effluent discharged into the water
bodies and these metals become phyto-toxic at high concentrations.
REFRENCES
[1] Addy K. and Green L. 1996. Phosphorus and Lake Aging. University of
Rhode Island: Natural Resources Facts; Report nr 96-2.
[2] Anderson D.M., Gilbert P.M. and Burkholder J.M. 2002. Harmful Algal
Blooms and Eutrophication: Nutrient Sources, Composition, and Conse-
quences. Estuaries., 25:704-726.
[3] Bennet E.M., Carpenter S.R. and Caraco N.F. 2001. Human Impact on
Erodable Phosphorus and Eutrophication: A Global Perspective. Bioscience.,
51:227-232.
[4] Carpenter S.R 2008. Phosphorus control is critical to mitigating
eutrophication. Proceedings of the National Academy of Science., 105:11039-
Environmental crisis due to eutrophication in Ludhiana city, Punjab, India 1745
11040.
[5] Howarth, R.W. 2002. Nutrient Over-Enrichment of Coastal Waters in the
United States: Steps toward a Solution, Pew Oceans Commission.
[6] Jakhar G.R, Bhargava S.C. and Sinha, R.K.1990. Comparative limnology of
Sambar and Didwana lakes, Geobiology.
[7] Kodarkar, M.S.1992. Methodology for water analysis. Physic-chemical,
Biological and Microbiological Indian Association of Aquatic Biologist
Hyderabad, No. 2 : 50.
[8] Litke, D.W. 1999. Review of phosphorus control measures in the US and their
effects on water quality. National Water Quality Assessment Program: Water-
Resources Investigations Repor : 99-4007.
[9] Patil, S and Patwari, J.M. 2003. Ground water quality from Prarava area,
district Ahmednagar (M.S.), J. Aquatic Biology, 18 (2) : 85-86.
[10] Ramesh, M., Saravanan, M. and Pradeepa, G. 2007. Studies on the
physicochemical characteristics of the Singallunar lake, Coimbatore, South
India. In Proceeding National Seminar on Limnol. Maharana Pratap
University of Agric. Technology, Udaipur, India.
[11] Sankaran, S. 2006. “Environmental impact assessment of selected lakes in
greater Hyderabad, Andhra Pradesh” PhD thesis,Department of Geophysics,
University of Osmania.
[12] Sharda, S, Brar,K.K., Kaur,G., and Rishi, M.S. 2015.Environmental Study of
Water and Soil Regime on Sustainable Agriculture of Ludhiana District,
Punjab, India. International Journal of Environment, Ecology, Family and
Urban Studies, 5 : 1-8.
[13] Sharma, P.D. 2009. Ecology and Environment., Rastogi Publications. 10th ed.
Meerut, India.
[14] Smith, V.H. 2003. Eutrophication of freshwater and marine ecosystems: a
global problem, Environ. Sci. Pollut. Res. Int. 10: 126–139.
[15] Smith,V.H., Tilman, G.D. and Nekola, J.C. 1999. Eutrophication: impacts of
excess nutrient inputs on freshwater, marine, and terrestrial ecosystems.
Environment. Pollution., 100 :179-196.
[16] Subba, R. 1993. Fresh water molluscs of Indian Recent advances in fresh
water, Anmol publications pvt. Ltd. New Delhi : 47-52.
[17] Venkatesan, J. 2007. Protecting Wetlands. Current Sci., 93: 288-290.
[18] Weber, C.A. 1907. Aufbav and Vegetation der Moore Norddentschlands, Bot
Jahrb, 40.
[19] William, P. and Cunningham, M.A. 2008. Environmental Science: A Global
Concern, 10th ed. McGraw-Hill, New York.
1746 Sharda Shakha, Kaur Jasleen and Sharma Geetanjali