Notre Dame Law Review Volume 85 | Issue 1 Article 2 11-1-2009 Environmental Enforcement in Dire Straits: ere is No Protection for Nothing and No Data for Free Victor B. Fla Paul Collins Follow this and additional works at: hp://scholarship.law.nd.edu/ndlr is Article is brought to you for free and open access by NDLScholarship. It has been accepted for inclusion in Notre Dame Law Review by an authorized administrator of NDLScholarship. For more information, please contact [email protected]. Recommended Citation Victor B. Fla & Paul Collins, Environmental Enforcement in Dire Straits: ere is No Protection for Nothing and No Data for Free, 85 Notre Dame L. Rev. 55 (2013). Available at: hp://scholarship.law.nd.edu/ndlr/vol85/iss1/2
Transcript
Notre Dame Law Review
Volume 85 | Issue 1 Article 2
11-1-2009
Environmental Enforcement in Dire Straits: Thereis No Protection for Nothing and No Data for FreeVictor B. Flatt
Paul Collins
Follow this and additional works at: http://scholarship.law.nd.edu/ndlr
This Article is brought to you for free and open access by NDLScholarship. It has been accepted for inclusion in Notre Dame Law Review by anauthorized administrator of NDLScholarship. For more information, please contact [email protected].
Recommended CitationVictor B. Flatt & Paul Collins, Environmental Enforcement in Dire Straits: There is No Protection for Nothing and No Data for Free, 85Notre Dame L. Rev. 55 (2013).Available at: http://scholarship.law.nd.edu/ndlr/vol85/iss1/2
Those charged with drafting and enforcing our environmental lawshave had to work with little or no information about whether or not theseprograms are actually working properly. There are a host of reasons for this,many of them having to do with availability of data that can be examinedempirically. Using newly available data on state actions in environmentalenforcement, and a new data set of state environmental expenditures which
they created, the authors of this Article are able to examine for the first timethe relationship between state environmental expenditures and the effective-ness of state environmental enforcement for all permitted sources. They con-clude that state expenditures on environmental programs are stronglyassociated with effective environmental compliance, which has importantimplications for environmental law and policy. The authors also examinethe debate over the effectiveness of cooperative- versus deterrence-based enforce-ment, relate that to findings on state expenditures, and make suggestions forimproving the availability of data and environmental enforcement generally.
* Thomas F. and Elizabeth Taft Distinguished Professor in Environmental Law,University of North Carolina, Chapel Hill; Director, Center for Law, Environment,Adaptation, and Resources (CLEAR), UNC, Chapel Hill.
t Assistant Professor, Department of Political Science, University of NorthTexas. The authors would like to thank the Center for Progressive Reform, and inparticular Professors Rob Glicksman, Joel Mintz, Rena Steinzor, and CliffRechtschaffen for their help in constructing the study and for comments on earlierdrafts of the Article. Thanks also to the O'Quinn Foundation for funding to assist inthe project, and to the dedicated and helpful U.S. Environmental Protection Agencypersonnel who assisted in securing data and addressing issues as they arose in thestudy. The Article builds on prior work on environmental enforcement conducted bymany people, but the authors especially wish to recognize the prior contributions ofJoel Mintz, Rena Steinzor, Rob Kuehn, Rob Glicksman, Cliff Rechtschaffen, DavidMarkell, and William Andreen. The article is dependent on the work of multipleResearch Assistants, including Philip Shotts, Ben Bhem, Jere Overdyke, and WendiLucas. Many thanks as well to John Meiser and the staff at the Notre Dame Law Reviewfor their excellent editing and data assistance.
55
NOTRE DAME LAW REVIEW
INTRODUCTION
While much of the world debates what our environmental lawsshould be,' the less esoteric question of whether the environmentallaws we do have are being properly enforced continues to be insuffi-ciently examined. Yet this question is absolutely critical to any discus-sion of environmental protection or policy. Whether or not oneagrees with the goals of our current environmental statutes, determin-ing whether and how environmental laws are enforced is critical to thesuccessful operation of any environmental law, present or future.
The question of how well environmental enforcement works isreally the question of whether our environmental laws get the jobs ofcleaning the environment and protecting public health done. In aworld of limited financial resources, the answer to this question mustinclude whether the job is done in the most effective and efficient waypossible. As we approach the fortieth anniversary of modem environ-mental laws, the answer to this "$64 billion question" still is not clear.
We are told that the environmental laws provide extraordinarilyhigh benefits if enforced properly. In its Draft Report to Congress on theCosts and Benefits of Federal Regulation, the Office of Management andBudget noted that the EPA estimated the total benefits of ten years ofClean Air Act2 (CAA) enforcement would be $1.45 trillion, and thebenefits for enforcement of the more stringent regulation of criteriapollutants since 1990 would exceed costs of $54 billion.3 Variousassumptions exist, however, relating to these estimates.4 More impor-tantly, we don't know if these laws are being properly enforced. Eventhough we can identify the many areas where pollution has beenreduced and environmental improvements have occurred, we are una-
1 See, e.g., Marcilynn A. Burke, Green Peace? Protecting Our National Treasures WhileProviding for Our National Security, 32 Wm. & MARY ENvrT. L. & PoL'Y REV. 803, 805-11(2008) (discussing requested changes to a host of federal environmental laws toaccommodate national security); Charles de Saillan, The Use of Imminent Hazard Provi-sions ofEnvironmental Laws to Compel Cleanup at Federal Facilities, 27 STAN. ENvrTL. L.J. 43,204-06 (2008) (advocating several amendments to federal environmental laws); Rob-ert V. Percival, Environmental Law in the Twenty-First Century, 25 VA. ENvrTL. L.J. 1, 2-4(2007) (describing a "remarkable, bipartisan burst" of environmental regulation overthe past three decades).
2 42 U.S.C. §§ 7401-7671 (2006 & Supp. II 2008).3 Draft Report to Congress on the Costs and Benefits of Federal Regulations, 65
Fed. Reg. 7197, 7203 (Feb. 11, 2000).4 Professor Hsu presents a very good description of how environmental harms
and benefits, as well as the societal costs of regulation, may be routinely under- (orsometimes over-) valued. See Shi-Ling Hsu, The Identifiability Bias in EnvironmentalLaw, 35 FLA. ST. U. L. REv. 433, 440-51 (2008).
56 [VOL. 85:1
ENVIRONMENTAL ENFORCEMENT IN DIRE STRAITS 57
ble to clearly determine whether we are valuing and protecting theenvironment in the most cost-effective and efficient way possible.
Numerous commentators have noted that the difference betweenenvironmental laws that actually protect the environment and thosethat do not is highly dependent on whether, and in what way, theselaws are enforced.5 Testing whether we are correctly and/or ade-quately enforcing our environmental laws, however, has provenremarkably difficult as measures of environmental quality havechanged over time and differ between locations.6 This makes theactual connection between enforcement action and environmentalimprovements very difficult to ascertain. The possibility of having anymore than broad-based measures of actual environmental qualityimprovements or changes seems so difficult, especially when relatedto enforcement mechanisms, that their pursuit may be impossible.
Throughout much of the history of environmental law, theassumption has been that vigorous enforcement deters noncompli-ance with laws, and thus, brings about the desired outcomes.7 Thisassumption is reflected in the very structure of the cooperative feder-alism model for the administration of environmental laws (i.e., if thestate is enforcing, it is doing a good job),8 as well as the theoriesunderlying citizen-suit provisions, which are only necessary when thestate or federal government is not fulfilling its enforcement role.9
However, merely examining the number of such actions taken againstnoncomplying parties may not tell us much about the overall effective-
5 See William L. Andreen, Beyond Words of Exhortation: The Congressional Prescrip-tion for Vigorous Enforcement of the Clean Water Act, 55 GEO. WASH. L. REv. 202, 203-11(1987); Victor B. Flatt, Spare the Rod and Spoil the Law: Why the Clean Water Act Has NeverGrown Up, 55 ALA. L. REV. 595, 596-99 (2004); Robert L. Glicksman & Dietrich H.Earnhart, The Comparative Effectiveness of Government Interventions on Environmental Per-
formance in the Chemical Industry, 26 STAN. ENvrL. L.J. 317, 319-21 (2007); see alsoJOELA. MINTZ ET AL., ENVIRONMENTAL ENFORCEMENT 5-15 (2007) (discussing various theo-ries and objectives of environmental enforcement).
6 See Robert W. Adler, The Two Lost Books in the Water Quality Trilogy: The ElusiveObjectives of Physical and Biological Integrity, 33 ENvrTL. L. 29, 49 (2003); Clifford Recht-schaffen & David L. Markell, Improving State Environmental Enforcement PerformanceThrough Enhanced Government Accountability and Other Strategies, 33 ENVrL. L. REP.10,559, 10,565 (2003).
7 Glicksman & Earnhart, supra note 5, at 320.8 See Richard J. Pierce, Jr., Issues Raised by Friends of the Earth v. Laidlaw Envi-
ronmental Services: Access to the Courts for Environmental Plaintiffs, 11 DUKE ENvrL. L. &POL'Y F. 207, 234 (2001) (arguing that the environmental federalism standard allowsno or very little second guessing of state enforcement decisions).
9 See Peter A. Appel, The Diligent Prosecution Bar to Citizen Suits: The Search forAdequate Representation, 10 WIDENER L. REv. 91, 91 (2004).
20091
NOTRE DAME LAW REVIEW
ness of an environmental program.' 0 Because pollution sources maybe different and states may utilize different strategies, standards, andpenalties for enforcement, it is not obviously apparent that the num-ber of actions taken to bring sources into compliance is a good mea-sure of how effective different enforcement mechanisms may be inreaching statutory goals."
Additionally, recent "second generation" regulatory proponentshave suggested that direct enforcement may not achieve effectivecompliance (and thus, environmental improvements), and that so-called cooperative mechanisms may work better.12 As defined byProfessors Clifford Rechtschaffen and David Markell, authors of a2003 book about environmental enforcement, cooperative-basedenforcement "eschews penalties in favor of persuasion."13 Coopera-tive-based enforcement suggests that carrots work better than sticks."Many states have actively championed this strategy," pushing towardsmarket mechanisms for pollution control, and proposing to changeenvironmental enforcement from primarily deterrence-based enforce-ment to a cooperative regime.' 4 Some of the cooperative-basedenforcement literature propounds the theory that in addition to bet-ter results, cooperative-based enforcement may cost less, and thus, bea more cost-efficient form of effective environmental enforcement.15
Theories regarding different environmental policies and enforce-ment strategies are important to making environmental protectionefficient and responsive to societal needs. So where is the answer tothe question of whether we are enforcing our environmental laws inthe most effective and efficient ways possible? What is really needed isan empirical examination of which kinds of environmental enforce-ment strategies work successfully.
The EPA has catalogued a trove of empirical analyses of mea-sured environmental indicators and also of attitudes towards enforce-ment in the regulated community. Some of these studies (citedbelow) also try to link these statistically with environmental outcome
10 See Michael P. Vandenbergh, Beyond Elegance: A Testable Typology of Social Normsin Corporate Environmental Compliance, 22 STAN. ENVTL. L.J. 55, 66 (2003) (citing Clif-ford Rechtschaffen, Deterrence vs. Cooperation and the Evolving Theory of EnvironmentalEnforcement, 71 S. CAL. L. REV. 1181, 1219 (1998)).
11 Victor B. Flatt, A Dirty River Runs Through It (The Failure of Enforcement in theClean Water Act), 25 B.C. ENvrTL. Ae. L. REV. 1, 17-19 (1998).
12 See Rena 1. Steinzor, Myths of the Reinvented State, 29 CAP. U. L. REV. 223, 231-32(2001).
13 CLIFFORD RECHTSCHAFFEN & DAVID L. MARKELL, REINVENTING ENVIRONMENTAL
ENFORCEMENT & THE STATE/FEDERAL RELATIONSHIP 2 (2003).14 Id.15 See, e.g., Steinzor, supra note 12, at 233.
58 [VOL. 85:1
ENVIRONMENTAL ENFORCEMENT IN DIRE STRAITS
measurements.16 Because of the lack of comprehensive data on envi-ronmental noncompliance and variables we believe may have animportant relationship with enforcement, we attempt to go furtherand bring something new to this analysis. Good attempts have beenmade in the past and recently, and upon those attempts, we set out inthis Article to gather data and conduct statistical analyses that can takethe discussion even further. By using data painstakingly culled fromthe states and combining them with newly available EPA enforcementdata, we put forward some important new conclusions regarding theresource allocation necessary for effective environmental enforce-ment strategies.' 7 Just as importantly, we use the knowledge gainedfrom the process and results of data collection to propose ways thatdata can be improved to make future analyses of environmentalenforcement and progress both easier and more useful. This is not aneasy task, especially given the difficulty in data retrieval and usage.
Certain theories on enforcement have political constituenciesthat may be more concerned with political gain, or with spendingmoney on other priorities, than with cost-efficient and effective envi-ronmental regulation.' 8 Particularly now, in a time of falling state rev-enues, many states may not wish to learn that specific resource levelsare necessary for effective environmental enforcement. If the differ-ent strategies based on such theories are not held up for empiricaltesting, however, then legislators, administrators, businesses, and envi-ronmentalists will keep asserting their differing views about whatworks in enforcement and what does not. The citizens and the envi-ronment will thus be the ones to suffer. Environmental enforcementstrategies incur costs-to the government, regulated industries, andsociety-when those strategies fail.' 9 We have a duty to acquire thebest data available to assist in making policy decisions for the benefitof the whole, rather than for a select few.
In this Article, we attempt to answer important questions aboutapproaches to general enforcement across all industry groups, at leastpartially, and to make recommendations based on these answers.Additionally, we highlight the difficulty in acquiring the data neces-sary to make these comparisons effectively, and propose a systematic
16 See U.S. ENvmT. PROT. AGENCY, COMPLIANCE LrrERATURE SEARCH RESULTS
(2007), available at http://www.epa.gov/oecaerth/resources/reports/compliance/research/lit-results-2007.pdf (citing and summarizing more than two hundred com-pliance-related articles and books).
17 See discussion infra Parts IV & V.18 See Steinzor, supra note 12, at 225, 228-32, 240-41.19 Carol M. Rose, Rethinking Environmental Controls: Management Strategies for Com-
mon Resources, 1991 DUKE L.J. 1, 12-13.
200g) 59
NOTRE DAME LAW REVIEW
approach for collecting these data that makes enforcement effective-ness, and thus environmental protection, more transparent. In Part I,we will discuss the different enforcement ideas and strategies andwhat we would like to learn about them. In Part II, we set out theresearch background, ultimate methodology, and data acquisitionchosen to answer these questions. Part III contains our analysis of theresults of the statistical analyses, Part IV contains our summary of thecore empirical findings and their implications, and Part V sets out thepolicy prescriptions that can be drawn from this study.
I. ENFORCEMENT STRATEGIES
A. Theories of Environmental Enforcement
The issue of the effectiveness of environmental enforcement is anold one that begat the modern environmental laws. Though federali-zation of environmental laws is supported by the economic theory ofcontrolling all factors in a commons pollution problem, 20 as well asproviding a floor of environmental health for all U.S. citizens,21 muchof our modern environmental laws can be traced directly to the his-toric failures of state governments to address these harms them-selves.22 Environmental law was traditionally local in origin.23
Through the concept of public nuisance and later of zoning, the mostobvious environmental harms of the past-from raw sewage to chok-ing smoke-were dealt with by local government. 24
As environmental harms increased, the ability of states or locali-ties to control those harms did not seem to keep up with them. Evenwhen the federal government stepped in, both the CAA and the CleanWater Act2 5 (CWA) (before their modern incarnations) relied prima-rily upon the states to do the regulation necessary to control environ-mental harms. 2 6 The states proved spectacularly unsuccessful,however, giving impetus to the federal government to take the lead in
20 See CRAIG N. JOHNSTON ET AL., LEGAL PROTECTION OF THE ENVIRONMENT 12-15,24 (2d ed. 2007).
21 See William W. Buzbee, Asymmetrical Regulation: Risk, Preemption, and the Floor/Ceiling Distinction, 82 N.Y.U. L. REV. 1547, 1551-52 (2007).
22 Flatt, supra note 11, at 7, 13-14 (explaining the failure of states to administerthe Clean Water Program).
23 See ROBERT L. GLICKSMAN ET AL., ENVIRONMENTAL PROTECTION 586-87 (5th ed.
2007); JOHNSTON ET AL., supfa note 20, at 3.
24 See GLICKSMAN ET AL., supra note 23, at 65, 586-87.25 Clean Water Act of 1948, Pub. L. No. 80-845, 62 Stat. 1155 (codified as
amended at 33 U.S.C. §§ 1251-1376 (2006 & Supp. II 2008)).26 SeeJOHNSTON ET AL., supra note 20, at 6-9.
60o [VOL. 85:1
ENVIRONMENTAL ENFORCEMENT IN DIRE STRAITS
environmental law.2 7 A new kind of cooperative federalism was cre-ated, which moved beyond the traditional reliance on states to dealwith such issues, in favor of a state-federal mix of controls.28 Thoughthe states were still to play a role, theoretically it was the federal gov-ernment that would ensure a fail-safe system in case of state failure.29
The fail-safe system would occur primarily through federal oversightsoand federal ability to take over failing state programs. Though federaloversight showed some strength at first, with the federal governmenttaking over state programs and ordering particular kinds of compli-ance, this changed quickly.31 For political reasons, some of the fed-eral power was reduced.3 2 Moreover, the appetite for suchinvolvement with local issues, as well as the resources for such take-overs, quickly became a thing of the past.33
At this point, the states themselves began to assert their ownvisions for environmental enforcement, and in the face of economicdownturns, many states perceived less aggressive environmentalenforcement as a way to maximize scarce state resources.34 Manystates thus prohibited themselves or localities from adopting any regu-lations that were more stringent than the federal government's, whichin effect made an environmental floor into a ceiling.35 Many statesalso began actively pursuing a new cooperative-based enforcementstrategy, typified by the passage of audit-shield laws, which protectedpolluters from environmental prosecutions if they corrected environ-mental problems, and also allowed them to avoid reporting of envi-ronmental violations.36 These two examples were but part of a largerpattern. Whether because of state independence, flexibility, friendli-
27 SeeJerome M. Organ, Limitations on State Agency Authority to Adopt EnvironmentalStandards More Stringent than Federal Standards: Policy Considerations and InterpretiveProblems, 54 MD. L. REv. 1373, 1373-74 (1995).
28 JOHNSTON ET AL., supra note 20, at 9-10.29 Flatt, supra note 11, at 15.30 Buzbee, supra note 21, at 1567, 1587.31 See Flatt, supra note 11, at 16-19; see also Union Elec. Co. v. EPA, 427 U.S. 246,
265-69 (1976) (limiting EPA's authority to review state air pollution controls).32 See, for example, 42 U.S.C. § 7410(a)(5)(A)(i) (2006), originally added in
1977, which prohibits the Federal Administrator from requiring states to control indi-rect sources of air pollution, i.e. control of land use, for State Implementation Planprogram approval.
33 Flatt, supra note 11, at 16.34 Kirsten H. Engel, State Environmental Standard Setting: Is There a "Race" and is it
"To the Bottom"?, 48 HASTINGS L.J. 271, 340-41, 359 (1997).35 Organ, supra note 27, at 1376-77.36 RECHTSCHAFFEN & MARKELL, supra note 13, at 2, 179-81 (noting that almost
one-half of states passed audit privilege shield laws despite EPA objection).
2009] 61
NOTRE DAME LAW REVIEW
ness to business, or friendliness to state coffers, the late 1980s and1990s saw a new wave of enforcement, wherein states were to"reinvent" environmental enforcement to be more cooperative.3 7
Many environmental scholars were suspicious of such an agenda, andnoted that assertions of state primacy and "better" environmentalenforcement may be a screen for special interests, which would onlyundermine environmental protection.3 8 Rechtschaffen and Markellsummarize this movement as follows:
Two major tenets, among others, lie at the heart of the move-ment to reinvent environmental regulation. The first is that envi-ronmental enforcement should be shifted from a deterrence-basedapproach to one based on cooperation or compliance. The secondis that the federal government should devolve more environmentalresponsibility and decisionmaking authority to the states. These twodistinct, yet related areas have generated enormous interest anddebate. From 1997 to 2000 alone, for example, the U.S. Congressheld over a dozen hearings on one of these two topics. 3 9
B. Prior Empirical Analyses of Environmental Enforcement
Despite the major shift in theories regarding enforcement in thelast two decades, empirical analyses and testing of these strategies havebeen limited. Most of the data examining the effectiveness of eitherdeterrence- or compliance-based enforcement are industry specific. 40
In one case, Rechtschaffen and Markell note the importance of theHarrison study from the 1990s, which compared pulp and paper millpollution sources in Canada and the United States. 4 1 The Canadiansources, which were in the more cooperative-enforcement jurisdic-tion, showed less compliance. 42 Conversely, there have also been eval-uations of smaller programs that have shown positive results fromusing cooperative-based enforcement methods. 43 However, none ofthese studies controlled for other factors that could have influencedthe outcomes, and many of the successful programs were resource
37 Id. at 1, 156.38 See, e.g., Daniel C. Esty, Next Generation Environmental Law: A Response to Richard
Stewart, 29 CAP. U. L. REv. 183, 189 (2001) (suggesting regulatory reform initiativesare actually concerned with using deregulation in an attempt to advance the interestsof groups such as small businesses).
39 RECHTSCHAFFEN & MARKELL, supra note 13, at 1-2.40 See id. at 237-51.41 Id. at 242.42 Id.
43 Id. at 239-40.
62 [VOL. 85:1
ENVIRONMENTAL ENFORCEMENT IN DIRE STRAITS
intensive, which does not support the theory that cooperative-basedenforcement saves money.44
From 2005 through 2008, a research group at the University ofKansas surveyed opinions of major National Pollutant Discharge Elim-ination System4 5 (NPDES) permit holders to determine which types ofenforcement mechanisms were believed to be most effective, and alsosought to see what happened to source compliance following variousenforcement actions.46 Their findings have been an important sourceof new information, particularly about the effectiveness of stateenforcement versus federal enforcement. Through a complex analy-sis, the group was able to assess how state administrative actions com-pared with federal administrative actions in affecting the amount thatmajor chemical dischargers were over the NPDES-permitted limits. 4 7
The results tended to show that federal administrative actions weremore effective than state ones, thus complementing the earlierresearch on state comparisons.4 8
In a follow up article, Professors Glicksman and Earnhart wereable to classify regulated sources into two categories depending onwhether permit terms had been modified or not modified, using thatdifferentiation as a marker for cooperative- versus deterrence-basedenforcement.49 (They supposed that sources with allowed permitmodifications were beneficiaries of cooperative-based enforcement.)50
Though this classification could provide a method for categorizingthe type of enforcement in some circumstances, for reasons notedbelow,5 1 such a comparison may be unavailable for large, general datasets.
A 1996 through 1998 statistical analysis by one of the authors ofthis Article looked at state enforcement of the CWA in two states andexamined enforcement across all industrial groups for that pro-gram. 52 The study found that although enforcement actions may have
44 Id. at 240-01 (explaining that Illinois and Nevada studies finding positivechanges in compliance did not distinguish between changes resulting from modifica-tions to compliance approaches and those resulting from various other reforms).
45 See Federal Water Pollution Control Act, 33 U.S.C. §§ 1251-1387 (2006). Sec-tion 402 of the CWA established the NPDES. Id. § 1342.
46 Glicksman & Earnhart, supra note 5, at 329-32.47 Id. at 347-52.48 Id. at 352.49 Robert L. Glicksman & Dietrich H. Earnhart, Effectiveness of Government Interven-
tions at Inducing Better Environmental Pefomance: Does Effectiveness Depend on Facility orFirm Features , 35 B.C. ENvT. AFF. L. REv. 479, 487-89 (2008).
50 Id. at 487.51 See infra Part II.B.1.52 See Flatt, supra note 11, at 21-26.
2009) 63
NOTRE DAME LAW REVIEW
been occurring at the same rate, the individual nature of each state'senforcement actions meant that actual compliance achievement wasnot uniform even for similarly situated sources.53 This finding chal-lenged the assumption that "enforcement" automatically leads to com-pliance and focuses us more on the type or kind of enforcement thatis occurring.
C. What Else Can We Learn About Enforcement?
Despite the prior empirical analyses, we still have no real idea towhat extent resource allocation is necessary for effective enforcement,or whether cooperative- or deterrence-based enforcement is moreeffective. How do we determine these answers? We know that statesare required to meet the same federal standards and implement thesame federal statutes.54 The states are also increasingly responsiblefor primary enforcement of the environmental laws, which means thattheir ability to effectively enforce the standards and the laws deter-mines if our environment is protected.55 As a result, examining theeffectiveness of various state programs might be a good way to deter-mine optimal enforcement strategy.
Particularly, it would be illuminating to analyze: (1) the effects ofbudgeting by state environmental agencies on enforcement effective-ness; (2) the effectiveness of cooperative- versus deterrence-basedenforcement; (3) the effects of budget redeployment in state environ-mental agencies; and (4) the effects of state-enacted environmentalpolicies, such as lenient audit procedures. 56 These input variancescould be used to compare numerous states or a single state with itself,if policies change temporally. Other theoretically relevant variablescould be accounted for through the inclusion of statistical controlvariables. This would produce both general data for use by a state oranyone else (e.g., this data might show that the state of Texas has ahigher percentage of noncompliant sources now than it did in 1990for type, size, and source violations), or for use to statistically praise orindict strategies (e.g., a statistical analysis of state enforcement agen-cies around the country could show that audit privilege laws are associ-ated with less compliance by permitted sources). We would not haveto measure every state, only a statistically valid sampling thereof.
53 Id. at 26-27.54 See Buzbee, supra note 21, at 1550.55 See Flatt, supra note 11, at 20.56 For reasons explained in Part II.B.1, the data are not sufficient to test all of
these questions. See infra notes 68-77 and accompanying text.
64 [VOL. 85:1
ENVIRONMENTAL ENFORCEMENT IN DIRE STRAITS
The main impediment to such analysis is acquiring the data. Inaddition to the acquisition of output-variable (i.e., dependent-varia-ble) data on environmental source compliance noted above,57 manyof the input variables (i.e., independent variables), such as state fund-ing directed to particular programs or state policies on enforcement,require extensive digging even if they can be found or are available atall. Our goal was to acquire the data necessary to answer our ques-tions empirically, or if unable to secure the data, to make suggestionson how policies should be changed to make the needed data availa-ble. Following are the interrelated stories of the construction of possi-ble statistical methods for testing our findings, and the attempt togather data to provide the raw inputs for such analyses.
II. RESEARCH BACKGROUND, METHODOLOGY, AND DATA COLLECTION
A. Outcome Measurement Issues
The underlying issue in trying to conduct the statistical analysis ofthe effectiveness of any variable, such as different environmentalenforcement strategies, is determining an outcome measurement. Inthe environmental arena this is particularly problematic because, ingeneral, there is no direct measurement of environmental quality.Even in the cases where such measurements are being developed,identical methods do not exist temporally or locationally; for exam-ple, today's analysis of water quality may be conducted differentlyfrom that of ten years ago, or measurement methodologies in Califor-nia may not be identical to those in North Carolina.58 Therefore, inthe environmental arena, there must be some effective substitute forenvironmental markers that replicates or comes close to replicatingthe actual state of the environment. Over time, the numbers ofenforcement actions and penalty amounts have been used as outcomevariables for federal environmental laws.5 9 However, each of thesevariables suffers from the problem that it is itself a varying enforce-ment strategy and thus, a varying input variable. In other words, howdoes one measure the effectiveness of stepped-up enforcement onenvironmental health if stepped-up enforcement is the outcomevariable?
As a second-best option, one can try to test whether enforcementactually alters the way that pollution sources comply with the law.6 0
57 See discussion supra Introduction.58 See Adler, supra note 6, at 49.59 RECHTSCHAFFEN & MARKELL, supra note 13, at 247.60 See Flatt, supra note 11, at 24.
2009) 65
NOTRE DAME LAW REVIEW
The average length of time violators are out of compliance may berelated to the actual harm that the environment is undergoing.6'Courts have affirmed the assumption that violating congressionallymandated standards can be reasonably assumed to harm theenvironment.62
In a 1998 article, A Dirty River Runs Through It (The Failure ofEnforcement in the Clean Water Act), one of the authors of this Articleproposed using the average time a regulated source is noncompliantas an outcome variable for environmental quality.6 3 This measureassumes that the basic laws and standards, if enforced, are markers forenvironmental health.64 Even absent this assumption, it will always atleast be a marker of how long permitted sources are in technical viola-tion of laws and standards, and thus it will at least always be an out-come variable for legal compliance with environmental standards.This variable can thus be used to test whether various administrativestrategies-such as a budget devoted to environmental protection, orcooperative- versus deterrence-based enforcement-are more likely tolead to fewer violations of environmental standards. This is an appro-priate measure because, even when the enforcement strategy changes,the sources themselves must still self report technical compliance withthe standards on a monthly basis. Its use is limited though, as it failsto capture those sources that are outside the regulatory net altogetherand so it cannot test whether we are regulating the correct things ornot.65 Nor does it determine whether the permit terms themselves areconsistent with the legal requirements of the federal regulations(another concern with administrative discretion). 66 It simply tells us
61 Id.
62 See Friends of the Earth, Inc. v. Laidlaw Envtl. Servs., 528 U.S. 167, 184-85(2000) ("Here, in contrast, it is undisputed that Laidlaw's unlawful conduct-dis-charging pollutants in excess of permit limits-was occurring at the time the com-plaint was filed. Under Lyons, then, the only 'subjective' issue here is [t]hereasonableness of [the] fear' that led the affiants to respond to that concededly ongo-ing conduct by refraining from use of the North Tyger River and surrounding areas.Unlike the dissent ... we see nothing 'improbable' about the proposition that a com-pany's continuous and pervasive illegal discharges of pollutants into a river wouldcause nearby residents to curtail their recreational use of that waterway and wouldsubject them to other economic and aesthetic harms. The proposition is entirely rea-sonable . . . ." (quoting Los Angeles v. Lyons, 461 U.S. 95, 107 n.7, 108 n.8 (1983))).
63 Flatt, supra note 11, at 24.
64 Id.65 Id. at 22.66 Glicksman and Earnhart attempt to measure this. See Glicksman & Earnhart,
supra note 49, at 504-09.
66 [VOL. 85:1
ENVIRONMENTAL ENFORCEMENT IN DIRE STRAITS
the effects of various regulatory strategies on the legal complianceissues.
Nevertheless, we propose the use of noncompliance with permitshistory, which are self reported, as the primary output variable to testthe effects of various enforcement strategies. In addition, we alsoexamine the amount of fines levied against facilities for environmen-tal violations as a second means to gauge compliance. While this sec-ond measure is somewhat crude, it is nonetheless useful becausemonetary fines can potentially act as a deterrent to polluting activitiesand thus encourage facilities' compliance with environmental laws. 67
This proxy for enforcement thus assumes that facilities fined for envi-ronmental violations are more likely to come into compliance withenvironmental regulations as a result of this enforcement strategy.
Of course we recognize that, while the size of fines appears to berelevant to whether cooperative- or deterrence-based enforcement is aprimary strategy of a jurisdiction (i.e., one might assume that lowerfines are associated with cooperative-based enforcement), it is difficultto disentangle this output variable from others. For instance, finesmight rise the longer a source is noncompliant (meaning higher fineswould be associated with longer periods of noncompliance), or con-versely, higher initial fines may be an incentive for a source to becomecompliant more quickly (meaning higher fines would be associatedwith shorter periods of noncompliance). Despite these concerns, wehope the relationship between fines levied and money spent onenforcement sheds light on whether states with larger per capita envi-ronmental program expenditures are more likely to impose higherpunishments through higher fines. However, without information onperiods of noncompliance, which we do not have for the CWA data, itmay be difficult to disentangle the relationship between fines andnoncompliance periods.
67 See, e.g., Mark A. Cohen, Empirical Research on the Deterrent Effect of EnvironmentalMonitoring and Enforcement, 30 ENvT. L. REP. 10,245, 10,250 (2000) (suggesting thatpublic awareness of sanctions may damage the value and reputation of sanctionedfirms, helping to increase general environmental deterrence); Surabhi Kadambe &Kathleen Segerson, On the Role of Fines as an Environmental Enforcement Tool, 41 J.ENVTL. PLAN. & MGMT. 217 (1998) (developing a model for analyzing the effect offine amounts on regulatory compliance); Dorothy Thornton et al., General Deterrenceand Corporate Environmental Behavior, 27 LAw & POL'Y 262, 278-83 (2005) (questioningthe "explicit" deterrent effect of fines but suggesting that they "implicitly" reinforcethe general deterrence of other informal sanctions). But see Montserrat ViladrichGrau & Theodore Groves, The Oil Spill Process: The Effect of Coast Guard Monitoring onOil Spills, 10 ENVTL. & RESOURCE ECON. 315, 322-24 (1997) (noting that relatively low
fines had no significant effect on the frequency or size of oil spills).
672009]
NOTRE DAME LAW REVIEW
B. Data
In order to conduct empirical research on environmentalenforcement, one must overcome data problems on the sources ofpollutants as well as the individual state factors that might influenceenvironmental compliance. Below, we discuss for comparison theseissues regarding federal pollution-source data from the EPA concern-ing pollution sources and individual state data concerning environ-mental funding and enforcement policies.
1. Federal Data from the EPA Concerning Pollution Sources
Historically, it has not been easy to gather information about thecompliance of particular sources with various environmental laws, letalone to find ways of comparing them.6 8 The EPA would, in theory,have monitored state actions regarding permitted sources, but it hadno way to directly compare the intensity of the resolutions.6 9 Inresponse to continuing difficulties in tracking enforcement, the EPAintroduced its Integrated Data for Enforcement Analysis (IDEA) inthe early 1990s. 70 IDEA, in theory, meant that all sources permittedunder any statute could be examined and compared with each otherand across media.7' Nevertheless, the introduction of IDEA has stillnot generally enabled outside examinations of enforcement effective-ness for several reasons.
First, IDEA is generally complex and difficult to access, even tothose dedicated to getting the data.72 Second, the entire database isnot available to the public. Compliance data are presented to thepublic through the system known as Enforcement and ComplianceSystem Online (ECHO) . ECHO purports to allow a user to acquiredata on compliance history, violations, and enforcement actions.74
The current online version also allows one to search for permittedsources using several factors such as location, compliance, and his-
68 Flatt, supra note 11, at 18-19.69 Id.70 See U.S. Envtl. Prot. Agency, Integrated Data for Enforcement Analysis, http://
www.epa.gov/compliance/data/systems/multimedia/idea (last visited Oct. 26, 2009);PeterJ. Fontaine, EPA's Multimedia Enforcement Strategy: The Struggle to Close the Environ-mental Compliance Circle, 18 COLUM. J. ENvrT. L. 31, 57-58 (1993).
71 See id.72 Vandenbergh, supra note 10, at 87.73 See U.S. Envtl. Prot. Agency, Enforcement & Compliance History Online,
http://www.epa-echo.gov/echo (last visited Oct. 26, 2009).74 See id.
68 [VOL. 85:1
ENVIRONMENTAL ENFORCEMENT IN DIRE STRAITS
tory;75 however, this is not in a format that allows for the downloadingof data to conduct comparisons across state variables.7 6 Third, at thetime we proposed this study, the public ECHO search would onlyallow the return of 1000 data hits.7 7
Further compounding those limitations, data available on ECHOdo not contain a description of the permitted source that would allowa researcher to control for source differences in making comparisonsof compliance of sources between states .7 For example, although asingle numeric indicator such as quarters of noncompliance could becompared across states, such a comparison would be a sloppy use ofdata and a meaningless comparison without accounting for source dif-ferences.7 9 Additionally, through a blocking program, the EPA pre-vents data from being downloaded from the ECHO site by a computersystem, thus requiring manual entry of data. 0
A second, more complete Online Targeting Information System8
(OTIS) allows some online queries of the full IDEA database, but isonly available to the EPA, the federal government, and state govern-ments. 8 2 By only allowing the data to be accessed through queries,data from OTIS cannot be directly downloaded into a program file.Therefore, one cannot introduce different variables, such as stateenforcement spending, in order to do statistical comparisons betweenstate enforcement actions. 3 To conduct a statistical comparisonusing IDEA data with other data, the IDEA data would have to bereentered into a spreadsheet to allow a computer program to conductthe many mathematical calculations necessary to do a statisticalcomparison. 84
75 See U.S. Envtl. Prot. Agency, ECHO Compliance Data Search (Air Program),http://www.epa-echo.gov/echo/compliance-report-air.html (last visited Oct. 26,2009).
76 See id.77 See id.78 See Memorandum from Victor B. Flatt to Member Scholars of the Ctr. for Pro-
gressive Reform on Sufficiency of IDEA Data for Proposed Analysis (May 1, 2005)[hereinafter Flatt Memorandum] (on file with the authors).
79 Id.80 Id. This is ostensibly because of the large computer time costs the EPA would
incur through such a download. Because our study has hundreds of thousands ofpieces of data, this would make analysis virtually impossible.
81 See U.S. Envtl. Prot. Agency, Online Tracking Information System, http://www.epa.gov/compliance/data/systems/multimedia/aboutotis.html (last visited Oct.26, 2009).
82 See id.83 See id.84 Because of this difficulty, in 1998, one of the authors only conducted a com-
parison of two states for one environmental program, the CWA. The summarized
2oog] 69
NOTRE DAME LAW REVIEW
Faced with this data problem, in April 2005, we contacted EPApersonnel who worked in the Office of Enforcement and ComplianceAssurance.8 5 A representative of this office confirmed that the IDEAdatabase contained all of the compliance data (including the data thatwould allow a control of extraneous factors in a state comparison) forthree major federal environmental laws: the CAA, the CWA, and theResource Conservation and Recovery Act8 6 (RCRA).
We also learned that it was possible for the public to directlyaccess the IDEA data. One would simply need to obtain an EPA main-frame user identification and account (to compensate for the costs ofsearching) and obtain remote access via a web browser.87 The EPArepresentative informed us that the amount of data that we would beusing and manipulating might not be downloadable over the Internet,and might require working at one of the mainframe computers eitherat the EPA's headquarters in Washington, D.C., or at their researchcontractor's facility in Cambridge, Massachusetts. 88
Another EPA employee in the same office, who wished to remainanonymous, sent us the description for all variables in the IDEAdatabase, specifically, which fields can be searched or downloaded. 9
We learned that the downloaded data could then be transferred intoMicrosoft Excel and thus into common statistical analysis programs.The full description of these data fields has been made availableonline.90
The description of the data fields in IDEA seemed to indicatethat if we could obtain these data, we could meet our research needs.
data was received from the states themselves, and even only two years worth of datarequired the manual entry of over 10,000 data points. See Flatt, supra note 11, at 35app. A.
85 See Flatt Memorandum, supra note 78.86 42 U.S.C. §§ 6901-6992k (2006).87 See U.S. Envtl. Prot. Agency, Integrated Data for Enforcement Analysis, http://
www.epa.gov/compliance/data/systems/multimedia/idea (last visited Oct. 26, 2009).88 See Flatt Memorandum, supra note 78.89 Id.90 These data fields were received from EPA in 2004, and are on file with the
authors and available online as research appendices. See Victor B. Flatt, ResearchAppendices, http://www.law.unc.edu/faculty/directory/flattvictorb/research.aspx(last visited Oct. 28, 2009) [hereinafter Flatt, Research Appendices]. For EPA datapertaining to the CAA [hereinafter Clean Air Data], follow the link for "Clean Air,"and for EPA data pertaining to the CWA [hereinafter Clean Water Data], follow thelink for "Clean Water." These data fields and all other research appendices are alsoavailable online through the Notre Dame Law Review. See Notre Dame Law Review,Archive: Vol. 85, No. 1, http://www.ndlawreview.org/archive/issue.php?vol=85&num=1 (follow link for "Research Appendices") (last visited Nov. 3, 2009) [hereinafterNotre Dame Law Review, Research Appendices].
[VOL. 85:170
ENVIRONMENTAL ENFORCEMENT IN DIRE STRAITS
With respect to the air data, the number of quarters that a source isnoncompliant-one of our proposed dependent variables-is listedfor the two years preceding the date of a facility's inspection.9'
There were also data fields that would help us to control for dif-ferences between sources, including: (1) which air programs are per-mitted, such as the New Source Review or Prevention of SignificantDeterioration; (2) what kind of a source is under consideration basedon the Standard Industrial Classification Code List (allowing us to cat-egorize like sources with like sources); (3) the size of source pollution(e.g., greater than a hundred tons per year of major pollutant); (4)the pollutant subject to most serious compliance violation; and (5)the source's federal regulation status.92 With respect to the use ofnumber of quarters a source is in noncompliant status, there are vari-ables that describe the kind of noncompliance more specifically (e.g.,whether it is a procedural or a permitting violation). This indicatedthat we could separate reporting violations from permit violations.There are also fields that assist in testing the dependent variables thatwe have at issue. There are fields that show the amount of penalty,the action taken (closed, fined, etc.), and the date of a completedcompliance action.9 3
By examining the field descriptions, we were able to determine atleast one possible way that we could conduct the research on compar-ative enforcement, assuming we could get the data. It seemed that therelationship between compliance amount and compliance date, andthe number of quarters in violation in the two years preceding a facil-ity's inspection date could be compared with state enforcement poli-cies (funding, etc.) while controlling for differences in the sources.Though the time divisions were gross (number of quarters in violationfor the two years preceding the inspection date), they provided somediscrimination on noncompliance information regarding a state'sdominant enforcement attitude. It also seemed that the water andRCRA data have similar markers, which would allow for similar analy-sis. Both the water and RCRA data also allowed for distinctionsbetween types of permitted facilities, and both had fields that corre-sponded to violation determination, history, and status.94
91 See Clean Air Data, supra note 90.92 See id.
93 See id.
94 See Clean Water Data, supra note 90. The units of analyses in these databasesare the facility-inspection date and the type-classification. This means that each facil-ity appears in the data on the basis of the date of the compliance inspection and thetype of compliance inspection.
200g] 71
NOTRE DAME LAW REVIEW
Despite all of the restrictions on the data usage online, an EPAemployee was willing to transfer the raw data for all three programs tous for these research purposes free of charge, allowing us to directlyload it into a spreadsheet. From there, we could input informationcorresponding to measures of state-level environmental spending andthe political orientation of a state's political elite.
Although we obtained data covering compliance with the Aero-matic Information Retrieval System (AIRS) Facility Subsystem (involv-ing compliance with the CAA), the NPDES (involving compliancewith the CWA), and the RCRA (involving compliance with hazardouswaste management provisions of RCRA), we were unable to extractinformation regarding the penalties assessed against a facility for viola-tions of RCRA or the number of quarters a facility was in violation ofRCRA requirements. Further, we were unable to extract informationrelated to the number of quarters a facility was in violation of theCWA.95 As a result, our empirical analyses focus only on the followingdependent variables: (1) the penalties assessed against facilities forviolations of CWA regulatory requirements; (2) the penalties assessedagainst facilities for violations of CAA regulatory requirements; and(3) the number of quarters (in the two years preceding the inspectiondate) that facilities were in violation of compliance with CAA regula-tory requirements. In other words, due to a lack of data availability,we exclude compliance with RCRA requirements from our empiricalanalyses.
2. Data From States for Comparison Purposes
Since we wished to examine the relationship between state fund-ing, attitudes about cooperative- versus deterrence-based enforce-ment, and a source's noncompliance status, we needed a way tooperationalize these concepts. With respect to state "attitudes," weoriginally hoped to be able to examine specific legislative, regulatory,or executive branch requirements that might direct a state environ-mental agency to choose one of these methods. Since there were no
95 Rather bewilderingly, the NPDES data codebook indicates that it contains avariable composed of the number of quarters a facility is in violation of CWA require-ments over the two years preceding a facility's inspection date (labeled Historic Non-compliance Quarter). According to the NPDES codebook, this variable takes onvalues ranging from one to eight. However, in the actual data, this variable does nottake on these values, but rather contains year-quarter entries (e.g., 20011, 20012,20013, 20014) that do not correspond to the number of quarters a facility is in viola-tion of CWA requirements in the manner described in the codebook and do notrange from one to eight (even after removing the year from the variable entries). SeeClean Water Data, supra note 90.
[VOL. 85:172
ENVIRONMENTAL ENFORCEMENT IN DIRE STRAITS
uniform words in either legislation or regulation to indicate such adirection, we believed that the most direct way to get this informationwas from the enforcement staffs of the state environmental agenciesthemselves. Similarly, because states had different methods oforganizing their state environmental organizations, we would proba-bly have to depend on the state agencies to tell us how much of eachstate's budget had gone to enforcement programs.
Because we realized that obtaining this much information on anindividual basis might be difficult and time consuming, we decided touse a selection of states in this comparison rather than examine thedata from all states. The most populous states generally have the mostsources,9 6 so the inclusion of these states allows us to both examinethe environment in which more people live, as well as increase thenumber of data points without additional work or complexity. Thus,our sample contains most of the largest states in the country. Becausewe are examining attitudes about environmental enforcement, andbecause these attitudes have at least loosely been correlated with polit-ical orientation and possibly with regional differences,9 7 we felt thatthe sample needed to include states from different regions that weregoverned by different political elites with varying ideologies. In partic-ular, in selecting the large states, it was important to select states withdifferent political orientations. Finally, some states have relativelyunique and important environmental values, and this was also used inmaking the selection.
The states selected were Alaska, Arizona, California, Colorado,Connecticut, Florida, Georgia, Indiana, Kansas, Maryland, NewJersey,New Mexico, New York, North Carolina, Ohio, Oregon, Tennessee,and Texas. Though we originally hoped to obtain data for ten years,because we only had four years of source data from the EPA(2000-2003), we focused on the overlapping time in the statessearched. Research assistants working on the project performed anextensive search of online databases to determine if any of this infor-mation had been compiled in one place.98 Without success, our atten-tion turned to individual state sources. The research assistants then
96 See sources cited infra note 101.97 See, e.g., Riley E. Dunlap et al., Politics and Environment in America: Partisan and
Ideological Cleavages in Public Support for Environmentalism, 10 ENvTL. POL. 23, 28-33(2001); David M. Konisky, Regulator Attitudes and the Environmental Race to the BottomArgument, 18J. PuB. ADMIN. RES. & THEORY 321, 323 (2007); Eugene S. Uyeki & LaniJ.Holland, Diffusion of Pro-Environment Attitudes?, 43 Am. BEHAV. SCIENTIST 646, 658-60(2000).
98 E-mail from Phillip Shotts, Research Assistant, University of Houston LawCenter, to Author (Feb. 16, 2006, 2:11 CST) (on file with the author).
20091 73
NOTRE DAME LAW REVIEW
obtained contact information for each state's environmental agency.99
With this information, and an initial round of phone calls and e-mails,they were able to obtain budget information on environmental spend-ing practices for eight of the eighteen states.100
The states' budget numbers did not contain similarly defined cat-egories. For example, the states might report budgets based onauthorizations or expenditures, and the budgets might be subdividedby medium (air, water) or by expense category (personnel, fines,etc.). 10 It seemed that the best option we had for comparing budgetnumbers was to start with the largest common categories that wereinformative. We decided that this would be total environmentalexpenditures, assuming that most states categorized "environmental"similarly.
The location of this information varied from state to state. Ourresearch assistants began using the "yellow book of state government"to locate contact persons in specific agencies for information. 102 Wereceived at least skeletal budget information from most of the statesquickly. This information was obtained either directly from the stateagency or through sources to which research assistants were directedby the state agency.103 Some information was found through onlineresearch.
99 See Jere Overdyke & Emily Buckles, Enviro Budget Contacts (May 17, 2006)(unpublished spreadsheet) (on file with author).
100 SeeJere Overdyke, Flatt Research JCO Additions (May 17, 2006) (unpublishedspreadsheet) (on file with author).
101 For full breakdowns of the states' budgets from each year, see Flatt, ResearchAppendices, supra note 90 (follow links under "State Budget Data") (last visited Oct.2, 2009) [hereinafter State Budget Data]; Notre Dame Law Review, Research Appen-dices, supra note 90.
102 E-mail from Ben Rhem, Research Assistant, University of Houston Law Center,to Author (Sept. 22, 2009, 18:01 CST) (on file with the author) [hereinafter Rhem E-mail].
103 We obtained budget information from the following sources: Arizona Depart-ment of Environmental Quality; California Environmental Protection Agency; Califor-nia State Library; Connecticut Office of Policy and Management, Budget andFinancial Management Division; Florida Department of Environmental Quality; Geor-gia Department of Natural Resources; Indiana Department of Environmental Man-agement, Office of External Affairs; Kansas Department of Health and Environment;Maryland Department of Environment; North Carolina Department of NaturalResources and Environment, Budget and Planning; Ohio Environmental ProtectionAgency, Office of Fiscal Administration; Oregon Department of Environmental Qual-ity; Texas Commission on Environmental Quality. See State Budget Data, supra note101.
[VOL. 85:174
ENVIRONMENTAL ENFORCEMENT IN DIRE STRAITS
a. State per Capita Environmental Spending
A cursory examination of the state budget data seemed to indi-cate wide swings in per capita environmental spending, 104 so we revis-ited each state's budget data to see how the budget was broken down.In several cases, we discovered that the budget numbers were notcomparable after all. The most common differences occurred inwhether broad health, agriculture, or recreation programs (such ashunting or fishing) were included in the state's "environmental" or"natural resource" category. We made adjustments to the figures ofsome of the states as appropriate.1 0 5
Ultimately, though we contacted sources in Georgia multipletimes, we received no return calls or information; therefore, Georgiawas dropped from consideration. With this data in hand, our measureof State per Capita Environmental Spending represents each of the seven-teen states' per capita environmental spending, calculated by year.This variable allows us to examine the relationship between state envi-ronmental spending and compliance with CAA and CWA regulatoryrequirements.
b. State Ideology
As noted above, we were also interested in whether the choicebetween cooperative- versus deterrence-based enforcement strategieshas a significant effect on source compliance. After conductingresearch on such state policies, we could find no uniform legislative orregulatory marker indicating whether one of these enforcement "atti-tudes" was dominant in a particular state. As an alternative, we fol-lowed Glicksman and Earnhart, who proposed using permitmodification as a marker for cooperative- versus deterrence-basedenforcement on the logical assumption that a permit modificationdemonstrated a cooperative action. 0 6 However, we realized thatbecause Glicksman and Earnhart examined only a subset of CWAdata 07 corresponding to the chemical industry, their permit-modifiedvariable exhibited much more variability than a congruent measure inour data, since our data set is more expansive. More specifically, inour CWA data, only 700 observations indicate that a permit was modi-fied, out of 101,498 total observations-less than 0.70%. Accordingly,,due to the limited variability in the permits modified for facilities in
104 See State Budget Data, supra note 101.105 For data corrections, see Flatt, Research Appendices, supra note 90; Notre
Dame Law Review, Research Appendices, supra note 90.106 Glicksman & Earnhart, supra note 49, at 487.107 Id. at 483.
200g] 75
NOTRE DAME LAW REVIEW
our data, we were unable to rigorously control for cooperative-basedenforcement using a permit-modified variable.108 Further, we wereunable to locate a similar permit-modified variable in our CAA data.
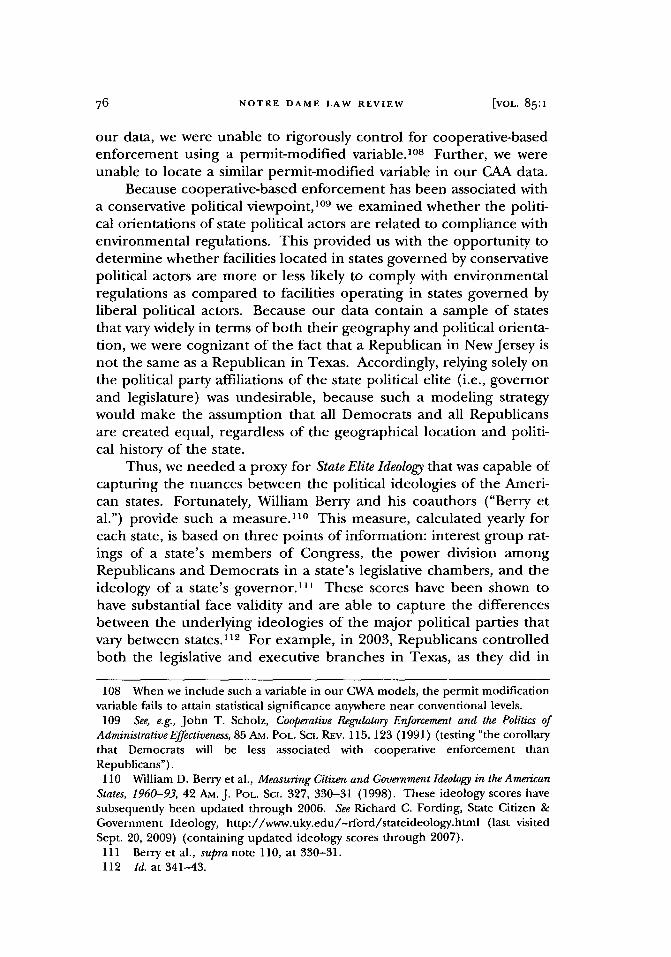
Because cooperative-based enforcement has been associated witha conservative political viewpoint,109 we examined whether the politi-cal orientations of state political actors are related to compliance withenvironmental regulations. This provided us with the opportunity todetermine whether facilities located in states governed by conservativepolitical actors are more or less likely to comply with environmentalregulations as compared to facilities operating in states governed byliberal political actors. Because our data contain a sample of statesthat vary widely in terms of both their geography and political orienta-tion, we were cognizant of the fact that a Republican in NewJersey isnot the same as a Republican in Texas. Accordingly, relying solely onthe political party affiliations of the state political elite (i.e., governorand legislature) was undesirable, because such a modeling strategywould make the assumption that all Democrats and all Republicansare created equal, regardless of the geographical location and politi-cal history of the state.
Thus, we needed a proxy for State Elite Ideology that was capable ofcapturing the nuances between the political ideologies of the Ameri-can states. Fortunately, William Berry and his coauthors ("Berry etal.") provide such a measure. 110 This measure, calculated yearly foreach state, is based on three points of information: interest group rat-ings of a state's members of Congress, the power division amongRepublicans and Democrats in a state's legislative chambers, and theideology of a state's governor.1 ' These scores have been shown tohave substantial face validity and are able to capture the differencesbetween the underlying ideologies of the major political parties thatvary between states.1 12 For example, in 2003, Republicans controlledboth the legislative and executive branches in Texas, as they did in
108 When we include such a variable in our CWA models, the permit modificationvariable fails to attain statistical significance anywhere near conventional levels.
109 See, e.g., John T. Scholz, Cooperative Regulatory Enforcement and the Politics ofAdministrative Effectiveness, 85 AM. POL. Sci. REv. 115, 123 (1991) (testing "the corollarythat Democrats will be less associated with cooperative enforcement thanRepublicans").
110 William D. Berry et al., Measuring Citizen and Government Ideology in the AmericanStates, 1960-93, 42 Am. J. POL. Sci. 327, 330-31 (1998). These ideology scores havesubsequently been updated through 2006. See Richard C. Fording, State Citizen &Government Ideology, http://www.uky.edu/-rford/stateideology.html (last visitedSept. 20, 2009) (containing updated ideology scores through 2007).111 Berry et al., supra note 110, at 330-31.112 Id. at 341-43.
76 [VOL. 85:1
ENVIRONMENTAL ENFORCEMENT IN DIRE STRAITS
2001 in New Jersey. Reflecting the fundamental differences betweenthe Republican parties in Texas and New Jersey, Berry et al. scoreTexas in 2003 as very conservative (8.93), while they score New Jerseyin 2001 as much more moderate (50.23), even though both stateswere controlled by the Republican Party. Given the power offered bythe Berry et al. scores, we utilized them to operationalize our measureof State Elite Ideology. This variable ranges from 0 to 97.5, with higherscores reflecting more liberal state elite ideologies.' 1 3
In addition to our key independent variables (State per CapitaEnvironmental Spending and State Elite Ideology), we also controlled forattributes of the facilities through the inclusion of dummy variables.In the models capturing a facility's compliance with CAA regulatoryrequirements, we include 12 dummy variables controlling for the AirProgram Code of the facility, 15 dummy variables accounting for theNational Action Type Code of the facility, and 113 dummy variablescontrolling for the Standard Industrial Code clusters of the facility. Inthe model capturing a facility's compliance with CWA regulatoryrequirements, we include 94 dummy variables controlling for theEnforcement Action Code of the facility, 31 dummy variables account-ing for the Inspection Type Code of the facility, and 97 dummy vari-ables controlling for the Standard Industrial Code clusters of thefacility.11 4 The purpose of including these controls is to allow us to"hold all else constant" in interpreting the influence of our centralexplanatory variables of interest. Accordingly, although we includethese dummy variables in the statistical models, we do not report thecoefficients associated with these variables.
113 As an alternative to the Berry et al. scores, we operationalized a measure ofelite ideology based on the political party affiliation of a state's legislative and execu-tive branches scored such that: 6 = unified Democrat (governor and legislature), 5 =Democratic governor, divided legislature, 4 = Democratic governor, Republican legis-lature, 3 = Republican governor, Democratic legislature, 2 = Republican governor,divided legislature, 1 = unified Republican (governor and legislature). This informa-tion was collected from each state's legislative website, the website of the NationalGovernor's Association, and individual contacts with the following agencies: ColoradoLegislative Council Staff; Connecticut State Library; Kansas State Library; New JerseyState Library; Maryland Department of Legislative Services; State Library of Ohio; andNew Mexico State Library. This alternative measure is correlated with the variableemployed here at the 0.8 level. Substituting it for the measure utilized in this Articledoes not alter the substance of the results.114 The number of dummy variables accounting for the Standard Industrial Code
clusters of facilities differs in the CAA and CWA models due to the fact that a smallernumber of Standard Industrial Code clusters are applicable to facilities appearing inthe CWA data.
200g] 77
NOTRE DAME LAW REVIEW
III. EMPIRCAL RESULTS
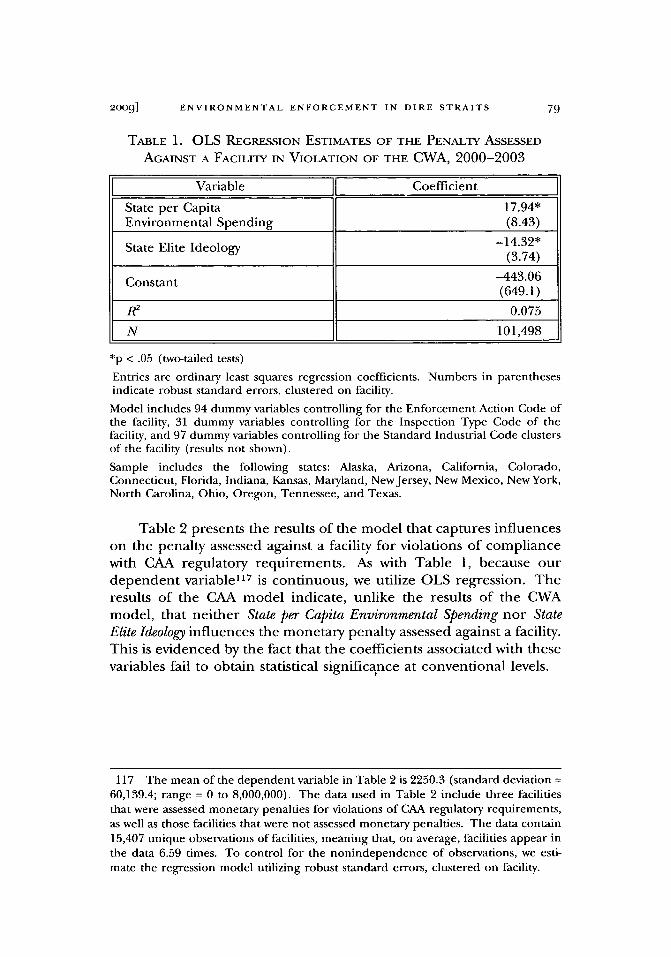
Table 1 reports the results of the model that captures the penaltyassessed against a facility in violation of compliance with CWA regula-tory requirements. As our dependent variable,' 15 the monetary pen-alty levied against a facility is a continuous variable, and we utilizeordinary least squares regression (OLS) to model the influence ofState per Capita Environmental Spending and State Elite Ideology on thepenalty assessed against a facility.' 16 This table reveals that the more astate spends per capita on its environmental budget, the higher thefines levied against polluters for violations associated with the CWA.In substantive terms, for each $1 per capita increase in state environ-mental spending, the fine levied against a facility increases by about$18, holding all else constant. A one standard deviation increase fromthe mean of state environmental spending (raising per capita spend-ing from $27.60 to $39) increases the penalty levied against a polluterby $204.50, ceteris paribus. The results of our proxy for State Elite Ideol-ogy indicates that, as a state's political elite become more liberal, thefines levied against polluters for violations of CWA regulatory require-ments decrease. All else equal, a one-unit increase in the liberalism ofthe state's political elite corresponds to a $14 decrease in the mone-tary penalty levied against a polluter. A one standard deviationincrease from the mean of State Elite Ideology (increasing State Elite Ide-ology from 43.9 to 70.4) decreases the penalty assessed against a facilityby $379.48, ceteris paribus.
115 The mean of the dependent variable in Table 1 is 903.8 (standard deviation =15,159.87; range = 0 to 792,000). The data used in Table 1 include facilities that wereassessed monetary penalties for violations of CWA regulatory requirements, as well asthose facilities that were not assessed monetary penalties. The data contain 25,282unique observations of facilities, meaning that, on average, facilities appear in thedata 3.93 times. To account for this nonindependence of observations, we estimatethe regression model employing robust standard errors, clustered on facility. See gen-erally, M. Arellano, Computing Robust Standard Errors for Within-Groups Estimators, 49OxFoRD BULL. ECON. & STAT. 431 (1987) (explaining a formula for calculating robuststandard errors).
116 See generally CHRISTOPHER H. ACHEN, INTERPRETING AND USING REGRESSION
18-34 (John L. Sullivan & Richard G. Niemi eds., 1982) (providing an overview ofOLS regressions); DAMODAR N. GujARATI & DAWN C. PORTER, BASIC ECONOMETRICS
55-80 (5th ed. 2009) (explaining the methodology behind and relative simplicity ofthe OLS regression model).
78 [VOL. 85:1
ENVIRONMENTAL ENFORCEMENT IN DIRE STRAITS
TABLE 1. OLS REGRESSION ESTIMATES OF THE PENALTY ASSESSED
AGAINST A FACILITY IN VIOLATION OF THE CWA, 2000-2003
Variable Coefficient
State per Capita 17.94*Environmental Spending (8.43)
State Elite Ideology -14.32*(3.74)
Constant -443.06(649.1)
R 2 0.075
N 101,498
*p < .05 (two-tailed tests)
Entries are ordinary least squares regression coefficients. Numbers in parenthesesindicate robust standard errors, clustered on facility.
Model includes 94 dummy variables controlling for the Enforcement Action Code ofthe facility, 31 dummy variables controlling for the Inspection Type Code of thefacility, and 97 dummy variables controlling for the Standard Industrial Code clustersof the facility (results not shown).
Sample includes the following states: Alaska, Arizona, California, Colorado,Connecticut, Florida, Indiana, Kansas, Maryland, NewJersey, New Mexico, New York,North Carolina, Ohio, Oregon, Tennessee, and Texas.
Table 2 presents the results of the model that captures influenceson the penalty assessed against a facility for violations of compliancewith CAA regulatory requirements. As with Table 1, because ourdependent variable"' 7 is continuous, we utilize OLS regression. Theresults of the CAA model indicate, unlike the results of the CWAmodel, that neither State per Capita Environmental Spending nor StateElite Ideology influences the monetary penalty assessed against a facility.This is evidenced by the fact that the coefficients associated with thesevariables fail to obtain statistical significance at conventional levels.
117 The mean of the dependent variable in Table 2 is 2250.3 (standard deviation =
60,139.4; range = 0 to 8,000,000). The data used in Table 2 include three facilitiesthat were assessed monetary penalties for violations of CAA regulatory requirements,as well as those facilities that were not assessed monetary penalties. The data contain15,407 unique observations of facilities, meaning that, on average, facilities appear inthe data 6.59 times. To control for the nonindependence of observations, we esti-mate the regression model utilizing robust standard errors, clustered on facility.
2009] 79
NOTRE DAME LAW REVIEW
TABLE 2. OLS REGRESSION ESTIMATES OF THE PENALTY ASSESSED
AGAINST A FACILITY IN VIOLATION OF THE CAA, 2000-2003
Variable CoefficientState per -2.59Capita Environmental Spending (31.90)
State Elite Ideology -2.83(6.86)
Constant 8855.30(10,435.90)
R __ 0.007
N 99,428
Entries are ordinary least squares regression coefficients. Numbers in parenthesesindicate robust standard errors, clustered on facility.
Model includes 12 dummy variables controlling for the Air Program Code of thefacility, 15 dummy variables controlling for the National Action Type Code of thefacility, and 113 dummy variables controlling for the Standard Industrial Codeclusters of the facility (results not shown).
Sample includes the following states: Alaska, Arizona, California, Colorado,Connecticut, Florida, Indiana, Kansas, Maryland, New Jersey, New Mexico, New York,North Carolina, Ohio, Oregon, Tennessee, and Texas.
Table 3 reports the results of the model that captures the numberof quarters (in the two years preceding the inspection date) that afacility was in violation of the CAA regulatory requirements. As thisdependent variable' 18 is a non-negative count, we utilized a negativebinomial regression model. 1 9 Because the parameter estimates of the
118 The mean of the dependent variable in Table 3 is 1.55 (standard deviation =2.01; range = 0 to 8). The data used in Table 3 include facilities that were in violationof CAA regulatory requirements, as well as those facilities that were not in violation ofCAA regulatory requirements. The data contain 25,282 unique observations of facili-ties, meaning that, on average, facilities appear in the data 3.93 times. To account forthis nonindependence of observations, we estimate the negative binomial regressionmodel employing robust standard errors, clustered on facility.
119 The negative binomial regression model (NBRM) is preferable to the OLSregression model given the makeup of our dependent variable. The NBRM is distinctfrom the most obvious alternative, the Poisson model, in that the NBRM does notmake the assumption that the variance is equal to the conditional mean of the depen-dent variable. Rather, the NBRM estimates a parameter, a, that accounts for theunobserved heterogeneity among observations in the data. In order to test for theappropriateness of the NBRM as compared with the Poisson model, we estimated alog likelihood test for overdispersion in the data, which indicates that the NBRM isthe more appropriate modeling strategy. For a general discussion of the NBRM, see,for example, A. CouN CAMERON & PRAVIN K. TRIVEDI, REGRESSION ANALYSIS OF COUNTDATA 70-77 (1998) (discussing generally the use of the NBRM) andJ. Scorr LONG &
80o [VOL. 85:1
ENVIRONMENTAL ENFORCEMENT IN DIRE STRAITS
TABLE 3. NEGATIVE BINOMIAL REGRESSION ESTIMATES OF THE NUMBER
OF QUARTERS A FAcILITY IS IN VIOLATION OF THE CAA, 2000-2003
Variable Coefficient A% "
State per Capita -. 006*Environmental (.003) -0.6*Spending
State Elite Ideology -. 002* +0.2*(.001)
.513Constant .5)(.225)
a 3.98 (.290)*
Wald X2 34,651.06*
N 99,428
*p < .05 (two-tailed tests)
a Indicates percentage change in the number of quarters a facility is in violation ofcompliance with Clean Air Act Regulatory Requirements corresponding to a one-unitchange in the independent variable.
Entries are negative binomial regression coefficients. Numbers in parenthesesindicate robust standard errors, clustered on facility.
Model includes 12 dummy variables controlling for the Air Program Code of thefacility, 15 dummy variables controlling for the National Action Type Code of thefacility, and 113 dummy variables controlling for the Standard Industrial Codeclusters of the facility (results not shown).
Sample includes the following states: Alaska, Arizona, California, Colorado,Connecticut, Florida, Indiana, Kansas, Maryland, New Jersey, New Mexico, New York,North Carolina, Ohio, Oregon, Tennessee, and Texas.
independent variables in the negative binomial regression model can-not be interpreted directly (as in an OLS regression model), Table 3also reports the percentage change in the number of quarters a facil-ity is in violation of CAA regulatory requirements corresponding to aone-unit change in each independent variable. This Table revealsthat as state environmental spending increases, the number ofquarters that a facility is in violation of CAA regulatory requirementsdecreases. In substantive terms, for each $1 per capita increase instate environmental spending, the number of quarters a facility is inviolation of the CAA decreases by 0.6%, ceteris paribus. For example,compared with a state that spends $28 per capita on the environment,in a state that spends $68 per capita, the number of quarters a facility
JEREMY FREESE, REGRESSION MODELS FOR CATEGORICAL AND LIMITED DEPENDENT VARI-
ABLES USING STATA 372-75 (2d ed. 2005) (explaining the advantages of NBRM com-
pared to the Poisson regression model).
812oog]
NOTRE DAME LAW REVIEW
is in violation of the CAA decreases by 0.2 quarters, as illustrated inFigure 1. Table 3 also indicates that, as a state's political elite ideologybecomes more liberal, the number of quarters a facility is in violationof CAA regulatory requirements increases. More substantively, foreach one unit increase in state elite liberalism, the number of quartersa facility is in violation of the CAA increases by 0.2%, all things beingequal. A one standard deviation increase from the mean of elite ide-ology (increasing state elite ideology from 48.1 to 80.2) increases thenumber of quarters a facility is in violation of the CAA by 6%, ceterispafibus.
FIGURE 1. THE ESTIMATED NUMBER OF QUARTERS A FACILITY IS IN
VIOLATION OF THE CAA AS A FUNCTION OF STATE PER
CAPITA ENVIRONMENTAL SPENDING
$15 20 25 30 35 40 45 50 55 60 65 70 75 80
State Per Capita Environmental Spending (In Dollars)
IV. SUMMARY OF EMPIRICAL RESULTS
Taken as a whole, the results from our analyses are both expectedand surprising. The most important finding is that, with regard to theCAA, the more a state spends per capita on its environmental budget,the shorter time a permitted source is in violation of the Act. Assum-ing that we have adequately controlled for differences in fines basedon the type of facility and type of violation (as we attempted to do),this finding supports the conclusion that funding of environmentalprograms plays a very important role in how successful an agency is in
1.2o
0.8
0.7
0.6
82 [VOL. 85:1
ENVIRONMENTAL ENFORCEMENT IN DIRE STRAITS
avoiding, catching, and/or ending violations. Both the substantiveand statistical effects of this relationship are strong. To the extentthat support for cooperative-based enforcement has been premisedon accomplishing compliance at a cost savings, we show that, at leastat this time, "cost savings" in environmental programs are stronglyassociated with less compliance, and thus, should be removed as a sup-porting reason for using more cooperative types of enforcement.While this does not reject the idea that cooperative enforcement mayassist compliance in some circumstances, or that it can be productivelypaired with deterrence-based enforcement in certain circumstances(as detailed by Rechtschaffen and Markell),120 it does indicate that, atthis time at least, whatever effective cooperative enforcement has beenused would not have resulted in significant cost savings. There are, ofcourse, substantial limitations to our conclusion. Because of the datasets, we can only measure environmental spending at its broadestlevel. This only supports our conclusion if overall spending on theenvironment is, percentage-wise, similar to CAA enforcement spend-ing. We explore this data problem more infra Part V.B.
To the extent that the standards set forth in our environmentallaws result in environmental protection, we have also shown thatincreased state environmental spending translates into better compli-ance, thus potentially improving the quality of the environment.Unfortunately, with regard to the CWA data, we were not able to showthe same correlation because the EPA incorrectly entered the data forthe important variable that measures how many quarters a source isnoncompliant. We also do not know how splitting environmentalbudgets into different categories in each state might help in more effi-cient enforcement. Nevertheless, this result is important.
We also found that for administration of the CWA, the more astate spends per capita on its environmental budget, the higher thefines levied against polluters. Though we cannot make any definitiveconclusion about how this relates to noncompliance times, if the CAAresults were replicated in the CWA context, it might indicate thathigher fines (which are associated with deterrence-based enforce-ment) spur compliance, or that higher per-capita-spending states sup-port higher fines.
Our results also indicate that facilities are assessed larger fines forviolations of the CWA and remain out of compliance with the CAA forshorter periods of time in states governed by conservative politicalelites. To the extent our other results suggest that cooperative-basedenforcement, or at least cooperative-based enforcement premised on
120 RECHTSCHAFFEN & MARKELL, supra note 13, at 251-52.
832009]
NOTRE DAME LAW REVIEW
cost savings, is not particularly effective, this result might seem surpris-ing, particularly if we believe that conservative political ideologies aremore likely to be associated with cooperative-based enforcement.
Because we do not know how ideology actually relates to coopera-tive- versus deterrence-based enforcement, we can draw no real con-clusions. However, these findings do give rise to interestingspeculation. The CWA finding could suggest that conservative ideolo-gies allow polluters to reach worse violations, which in turn supporthigher fines. Conversely, the CAA finding may suggest that conserva-tive state ideologies foster better compliance, perhaps through the useof more cooperative methods. It is possible that adding the carrot ofcooperative schemes for enforcement in certain circumstances to thestick of deterrence-based enforcement may improve results overall.This is suggested by Rechtschaffen and Markell, who note that " [a]system that is purely or primarily deterrence-based can be improvedby integrating features of the cooperative model, such as moreemphasis on agency advice and consultation, and incentives for volun-tary self-policing."121
V. IMPLICATIONS FOR ENFORCEMENT POLICY
A. Resource Allocation
Resources do matter. For purposes of enforcement policy, this is themost important finding in our research. The strong relationshipbetween per capita spending on state environmental programs andshorter noncompliance times in the CAA across many states of differ-ent sizes, environmental challenges, and political governance, sug-gests this. That "resources do matter" means that states cannotadequately do theirjobs in enforcing environmental laws without nec-essary resources. While our study does not show any "optimal" level ofresource expenditure on environmental programs, it does show that alack of spending creates noncompliance rates outside what the Ameri-can public would assume or expect for enforcement of environmentalprograms. Presumably, this implication is generalizable to federalenvironmental enforcement as well. Coupled with the results demon-strating that more resources lead to higher fines, the study also sug-gests that deterrence-based enforcement is important in actuallycreating effective compliance.
The efficacy of cooperative-based enforcement, either alone or incombination with deterrence-based enforcement, is harder to evalu-ate. We can see that at least during the time of our study, no coopera-
121 Id. at 251.
84 [VOL. 85:1
2009] ENVIRONMENTAL ENFORCEMENT IN DIRE STRAITS 85
tive-based enforcement was able to successfully produce effectiveenvironmental compliance at a significantly lower cost. We do notethat a more conservative political ideology is related to better compli-ance, and that conservative political ideologies have been more gener-ally supportive of cooperative-based enforcement. The substantiveeffect of elite ideology is not as strong as the effect of per capita statespending on the environment, but it is provocative. As noted above, itmight suggest that some combination of cooperative- and deterrent-based enforcement is the optimal formula. We do know that it doesnot suggest that "leaner" government, at least in terms of environmen-tal expenditures, will lead to better compliance. One cannot get com-pliance on the cheap. Whether one uses cooperative- or deterrence-based enforcement, one still must spend money to protect theenvironment.
B. Importance of Data to Understanding the Effectiveness ofEnvironmental Policies
The other important implication from our four-year study isrelated to the acquisition and reporting of the data. Though webelieve that this study goes further than some previous studies andprovides strong evidence as to the importance of sufficient funds topromote environmental compliance, it does not answer more subtlequestions directly. These questions can only be answered by animprovement in the availability of relevant data. For instance, tomore thoroughly test the efficacy of cooperative-based enforcement,we would need to procure data from each state about how money inenvironmental enforcement is spent in each arena. The gross percapita numbers that we were able to retrieve from the states do notgive the more tailored information of exactly how much a state spendson which program and in what way.
Of course, it is likely that data problems are themselves related tomoney spent on environmental programs. According to researchdone on EPA enforcement by Professor Joel Mintz, budget shortfallsare directly linked to poor data keeping and record collection. 1 22
According to Professor Mintz, "when faced with tight budgets,enforcement managers tend to cut record keeping first rather thancontract the size and principal responsibilities of their staffs of inspec-tors, engineers, attorneys, etc."123
122 See E-mail from Joel Mintz, Professor of Law, Nova Southeastern University, toAuthor (Dec. 26, 2008, 2:11 EST) (on file with author).
123 Id.
NOTRE DAME LAW REVIEW
Whatever the reason, given that data issues have bedeviledresearch on environmental enforcement and effectiveness from thebeginning, it seems that the time has come for the EPA to tackle thishead on. To really understand whether state programs are effectiveand which programs promote better compliance, the EPA needs toreceive enforcement data and information about resources in a uni-form manner. This could be accomplished without impinging on fed-eralism. States can create and operate their budgets in any mannerthey see fit, but they (and EPA regions) should be required to reportdata on delegated programs in a uniform manner, much as the SECrequires regulated companies to report data.12 4 One option could beto require states to organize their data to show how much money wasspent on environmental programs, how much went to enforcement,and of that, how much went to different kinds of enforcement (asspecified by the EPA), further breaking this all down among dele-gated programs. The states already have this information, and chang-ing to uniform reporting should not be too difficult. Recently, thefederal government began to require that all states use the federaldefinition of graduation and drop rates to avoid the "tangle of inaccu-rate state data."125
Additionally, the EPA's own data system also needs improvement.Although the EPA has moved in the direction of providing more datato the public, the current publicly available database, ECHO, is diffi-cult to use. Moreover, longstanding flaws in the data suggest thatthere is no effective mechanism to ensure correct reporting and entryof data.126 Funding directed to this alone would be important. It willcontinue to be difficult to understand enforcement without thesecorrections.
CONCLUSION
Although our modern environmental programs have been inexistence for decades, we have not learned all we need to know aboutwhich ways of enforcing these programs work and which do not. Overtime, diverse scholars have gathered critical data points and contrib-uted to the debate about which types of environmental enforcementprograms are most effective at the lowest cost.
124 See U.S. Sec. & Exch. Comm'n, Interactive Data for Financial Reporting, http://www.sec.gov/info/smallbus/secg/interactivedata-secg.htm (last visited on Sept. 20,2009).125 Sam Dillon, U.S. to Require States to Use a Single School Dropout Fonnula, N.Y.
TIMEs, Apr. 1, 2008, at A16.126 See, e.g., Clean Water Data, supra note 90.
86 (VOL. 85:1
2009] ENVIRONMENTAL ENFORCEMENT IN DIRE STRAITS 87
In the study we conducted, we were not able to put to rest thequestion of which is "better"-cooperative- or deterrence-basedenforcement. In fact, sweeping generalizations are currently difficultbecause most every state conducts its programs in a unique way. How-ever, we were able to empirically demonstrate that higher per capitaspending by states on environmental enforcement programs (at leastwith respect to the CAA) is strongly associated with better programcompliance, and thus, presumably better environmental results. Thisis an important finding and should spur reexamination of theoriesabout how cheaper enforcement (usually supposed to be cooperative-based) can still provide adequate environmental protection. Thestudy also creates interesting questions regarding state ideology andprogram effectiveness that will have to wait for more comprehensivedata in order to more fully untangle these relationships.
Just as importantly, our study again demonstrates the incredibledifficulty in answering such questions, primarily because of the lack ofdata in usable form or the failure to effectively monitor and give atten-tion to the data support systems. Given these ongoing problems inunderstanding how well environmental programs work, it is difficultto avoid reaching the conclusion that the lack of adequate and uni-form data is a partial function of the contentious nature of Americanpolitics in which public officials, corporations, and interest groupsmay profit from this state of affairs. The EPA is currently undergoingfundamental reorganization of enforcement because of previous diffi-culties. This Article should be a call to the EPA to compel uniformdata reporting as part of its comprehensive enforcement upgrade.