136
ENVIRONMENTAL ENGINEERING BFC 32403 Faculty of Civil Engineering & Built Environment CHAPTER 1 WATER QUALITY
ENVIRONMENTAL ENGINEERINGBFC 32403
Faculty of Civil Engineering & Built Environment
CHAPTER 1 WATER QUALITY

Topics on Water Quality (9 hours lecture)
1.1 Introduction to Water Quality1.2 Interim National Water Quality
Standards1.3 Water Quality Parameters (Physical, Chemical & Microbiology)
1.4 Sampling (River Monitoring) 1.5 DO Sag Curve

1.1 Introduction to Water Quality
❖ Municipal Uses
❖ Agricultural Uses
❖ Industrial Uses
❖ Rural Uses
1.1.1 Beneficial Water Uses

1.1 Introduction to Water Quality
❖ Snow / Rain
❖ Surface Wateri) Watershedii) Lake /River /Reservoir
❖ Groundwater
o Sub-surface water, or groundwater, is fresh water located in the pore
space of soil and rocks.
o Flowing within aquifers below the water table.
❖ Desalination
o Saline water is converted to fresh water.
1.1.2 Water Resources
1.1 Introduction to Water Quality
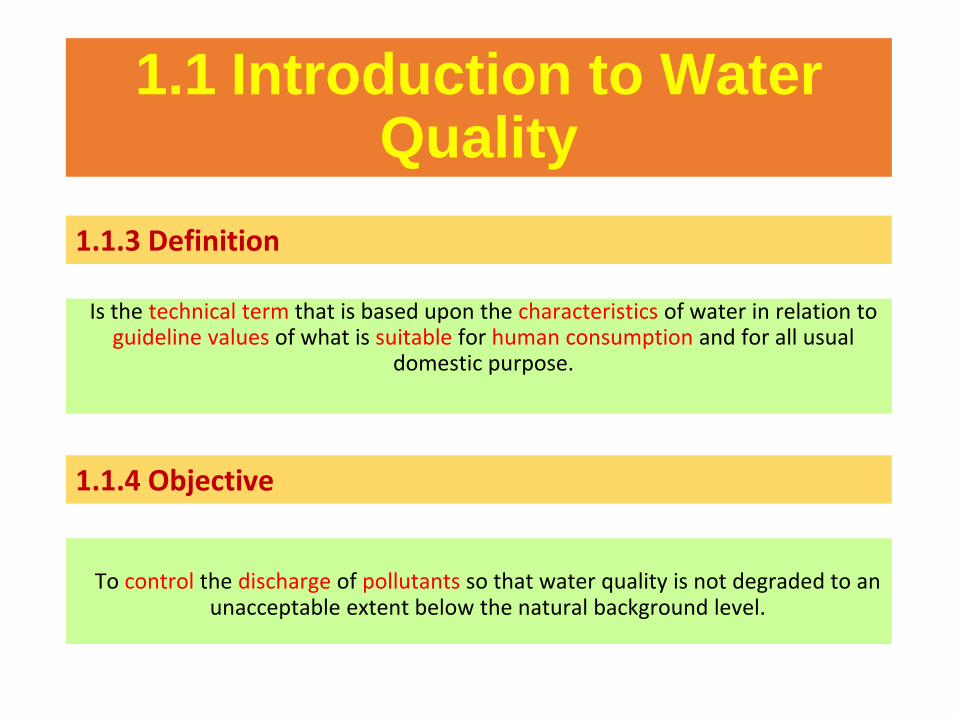
Is the technical term that is based upon the characteristics of water in relation to guideline values of what is suitable for human consumption and for all usual
domestic purpose.
1.1.3 Definition
To control the discharge of pollutants so that water quality is not degraded to an unacceptable extent below the natural background level.
1.1.4 Objective

1.1 Introduction to Water Quality
• Are the natural and man-made chemical, biological and microbiological characteristics of rivers, lakes and groundwater.
• It provides important information about the health of a water body.
- Are the natural and man-made chemical, biological and microbiological characteristics of rivers, lakes and groundwater.
- It provides important information about the health of a water body.
1.1.5 Water Quality Parameters
� Are used to find out if the quality water is good enough for drinking water, recreation, irrigation and aquatic life.

1.1 Introduction to Water Quality
POINT SOURCE▪ pollution flowing from a
single and identifiable source such as discharge pipe from a factory, roadway, or leaking underground storage tank
Two types of water pollution:
NON-POINT SOURCE▪ pollution collected by rain
falling over a larger watershed which is then carried by runoff to a nearby lake or stream, or by infiltration into the groundwater

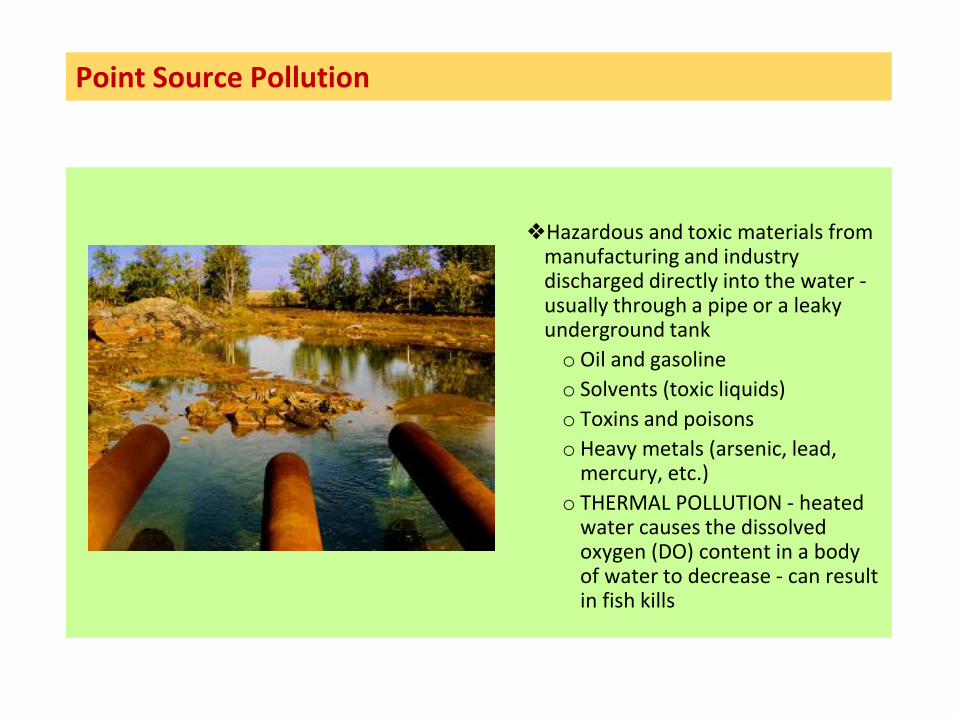
Point Source Pollution
Point Source Pollution
❖Hazardous and toxic materials from manufacturing and industry discharged directly into the water -usually through a pipe or a leaky underground tank
oOil and gasoline
o Solvents (toxic liquids)
o Toxins and poisons
o Heavy metals (arsenic, lead, mercury, etc.)
o THERMAL POLLUTION - heated water causes the dissolved oxygen (DO) content in a body of water to decrease - can result in fish kills
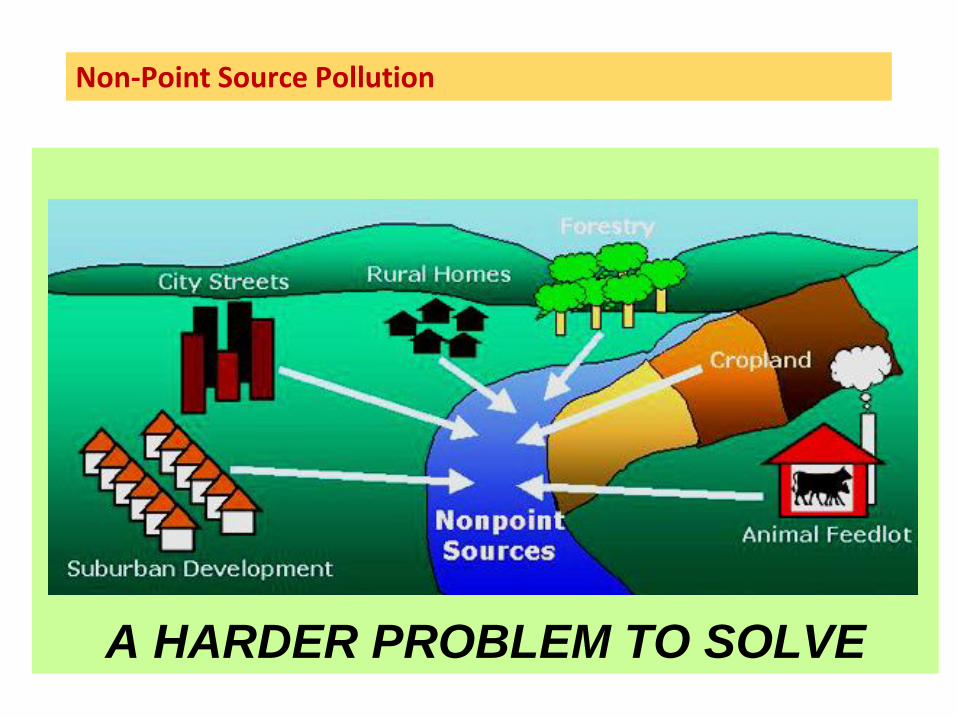
Non-Point Source Pollution
A HARDER PROBLEM TO SOLVE

Non-Point Source Pollution - THE CHANGING URBAN LANDSCAPE
• Changing the landscape changes the amount of runoff in a watershed
• NON-POINT SOURCE POLLUTION is pollutants being collected by rainwater falling over a large watershed and carried directly to a river, lake or stream
• Gas, oil, chemicals, detergents containing phosphorus, trash and other pollutants collected off driveways, roads and city streets flow directly down drains and storm sewers to a nearby body of water untreated


Non-Point Source Pollution - THE CHANGING RURAL LANDSCAPE
❖MODERN FARMING IS A MAJOR SOURCE OF NON-POINT SOURCE POLLUTION
oPesticides (bug killer) and herbicides (weed killer) can wash into nearby lakes and rivers
oCrop fields, especially after harvest, can wash large amounts of dirt and sediment into nearby lakes and rivers
oAnimal waste and manure can be a source of nutrients and harmful bacteria
oFertilizer can be a source of nutrients, such as nitrogen and phosphorus, entering nearby lakes and rivers leading to the serious problem of EUTROPHICATION
❖BIGGER FARM = BIGGER PROBLEM
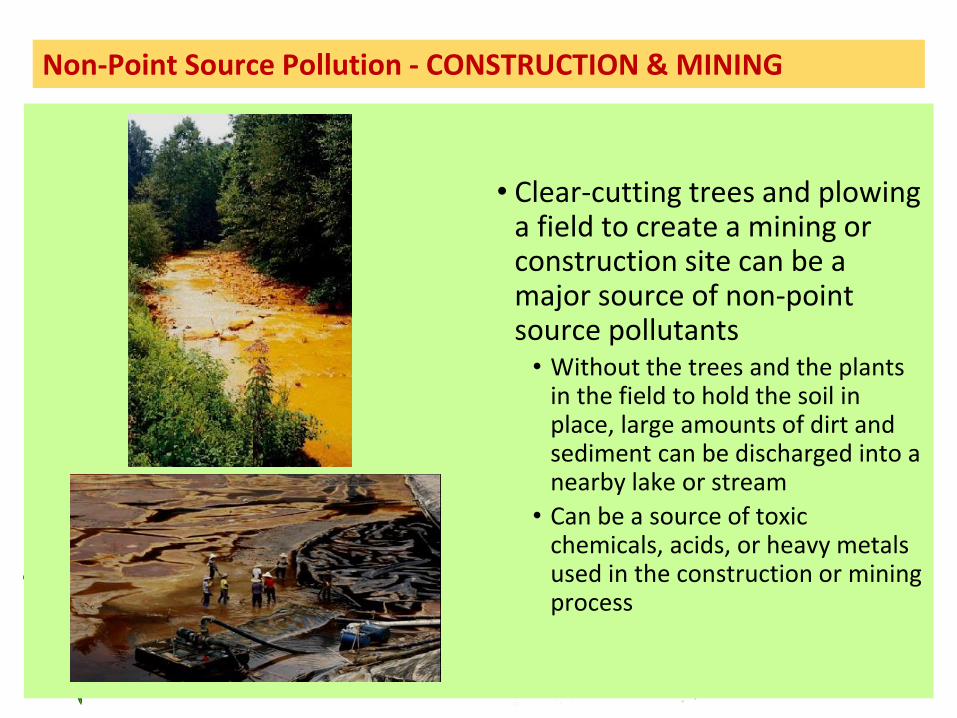
Non-Point Source Pollution - CONSTRUCTION & MINING
• Clear-cutting trees and plowing a field to create a mining or construction site can be a major source of non-point source pollutants• Without the trees and the plants
in the field to hold the soil in place, large amounts of dirt and sediment can be discharged into a nearby lake or stream
• Can be a source of toxic chemicals, acids, or heavy metals used in the construction or mining process

1.2 Interim National Water Quality Standards (INWQS)
❖ INWQS used for classification ofrivers or river segments based on 5classes of water quality.
❖ INWQS helps Department ofEnvironment (DOE) to identifyproblem areas & developappropriate strategies for waterquality management.
❖ It is important to maintain highquality level for natural water.
❖ Therefore, the DOE has set up theminimum quality standard thatreflects its beneficial uses.
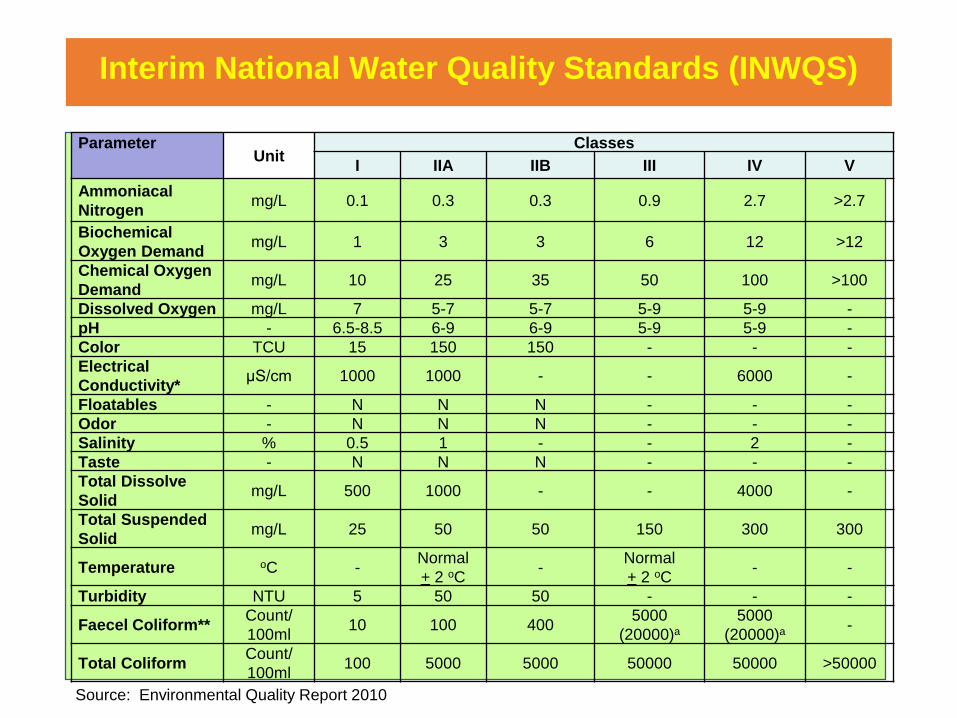
Interim National Water Quality Standards (INWQS)
ParameterUnit
Classes
I IIA IIB III IV V
Ammoniacal
Nitrogenmg/L 0.1 0.3 0.3 0.9 2.7 >2.7
Biochemical
Oxygen Demandmg/L 1 3 3 6 12 >12
Chemical Oxygen
Demandmg/L 10 25 35 50 100 >100
Dissolved Oxygen mg/L 7 5-7 5-7 5-9 5-9 -
pH - 6.5-8.5 6-9 6-9 5-9 5-9 -
Color TCU 15 150 150 - - -
Electrical
Conductivity*μS/cm 1000 1000 - - 6000 -
Floatables - N N N - - -
Odor - N N N - - -
Salinity % 0.5 1 - - 2 -
Taste - N N N - - -
Total Dissolve
Solidmg/L 500 1000 - - 4000 -
Total Suspended
Solidmg/L 25 50 50 150 300 300
Temperature oC -Normal
+ 2 oC-
Normal
+ 2 oC- -
Turbidity NTU 5 50 50 - - -
Faecel Coliform**Count/
100ml10 100 400
5000
(20000)a
5000
(20000)a -
Total ColiformCount/
100ml100 5000 5000 50000 50000 >50000
Source: Environmental Quality Report 2010

Parameter UnitClass
I II III IV V
Ammoniacal Nitrogen mg/L <0.1 0.1-0.3 0.3-0.9 0.9-2.7 >2.7
Biochemical Oxygen Demandmg/L <1 1-3 3-6 6-12 >12
Chemical Oxygen Demand mg/L <10 10-25 25-50 50-100 >100
Dissolved oxygen mg/L >7 5-7 3-5 1-3 <1
pH - >7 6-7 5-6 <5 >5
Total Suspended Solid mg/L <25 25-50 50-150 150-300 >300
Class Uses
I Conservation of natural environment.
Water Supply I – Practically no treatment necessary.
Fishery I – Very sensitive aquatic species.
IIA Water Supply II – Conventional treatment required.
Fishery II – Sensitive aquatic species.
IIB Recreational use with body contact.
III Water Supply III – Extensive treatment required.
Fishery III – Common, of economic value and tolerant species; livestock
drinking.
IV Irrigation
V None of the above
Source: Environmental Quality Report 2010
Classification of Water Based on INWQS
Water Classes and Uses
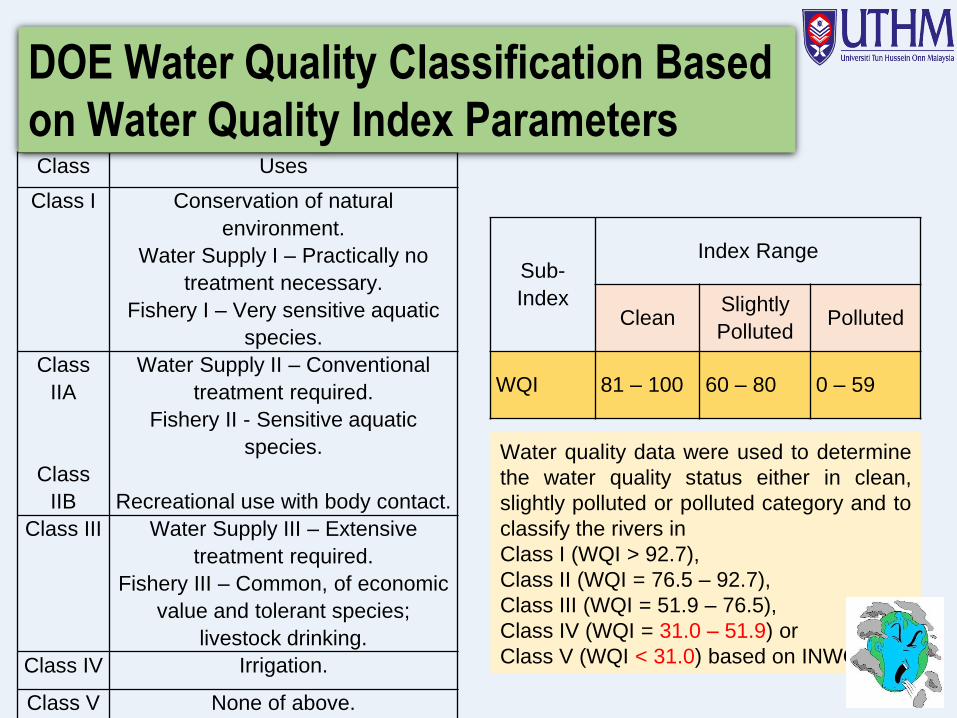
Sub-
Index
Index Range
CleanSlightly
PollutedPolluted
WQI 81 – 100 60 – 80 0 – 59
Water quality data were used to determine
the water quality status either in clean,
slightly polluted or polluted category and to
classify the rivers in
Class I (WQI > 92.7),
Class II (WQI = 76.5 – 92.7),
Class III (WQI = 51.9 – 76.5),
Class IV (WQI = 31.0 – 51.9) or
Class V (WQI < 31.0) based on INWQS.
Class Uses
Class I Conservation of natural
environment.
Water Supply I – Practically no
treatment necessary.
Fishery I – Very sensitive aquatic
species.
Class
IIA
Class
IIB
Water Supply II – Conventional
treatment required.
Fishery II - Sensitive aquatic
species.
Recreational use with body contact.
Class III Water Supply III – Extensive
treatment required.
Fishery III – Common, of economic
value and tolerant species;
livestock drinking.
Class IV Irrigation.
Class V None of above.
DOE Water Quality Classification Based
on Water Quality Index Parameters

1.3 Water Quality Parameters
1. Physical
parameters
3. Biological parameters
2. Chemical parameters
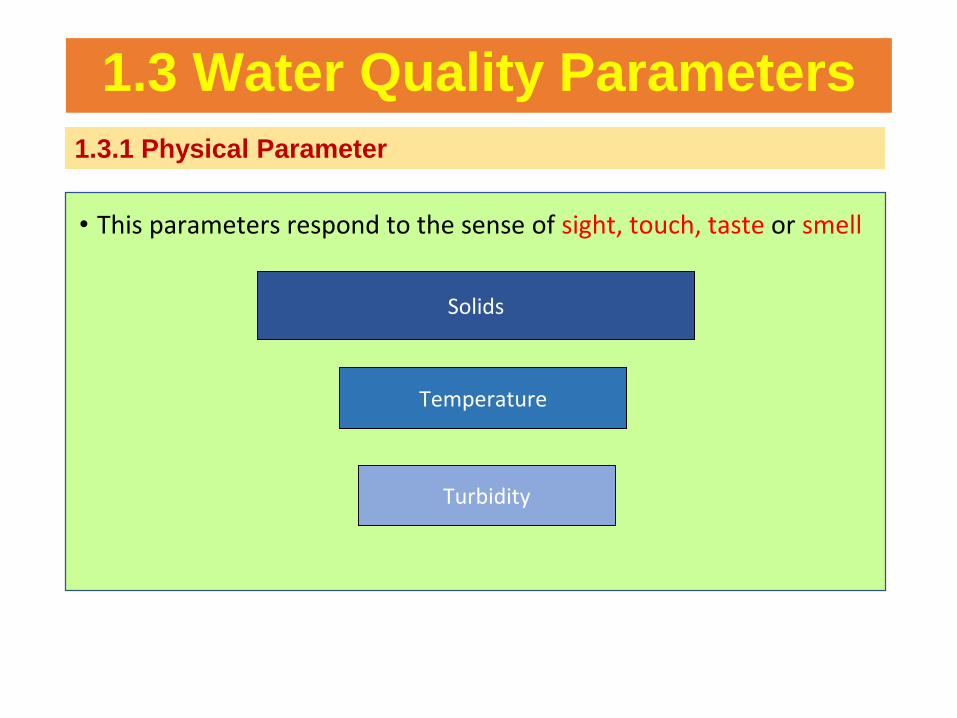
1.3 Water Quality Parameters
• This parameters respond to the sense of sight, touch, taste or smell
Solids
Temperature
Turbidity
1.3.1 Physical Parameter

1.3 Water Quality Parameters
1.3.1 Physical Parameter - SOLIDS

1.3 Water Quality Parameters
1.3.1 Physical Parameter - SOLIDS
❖ Total Solid (TS) are the total of all solids in a water sample. They include the total suspended solids, total dissolved solids, and volatile suspended solids.
❖ Dissolved solids (DS) = calcium, chlorides, nitrate, phosphorus, iron, sulfur, and other ions and particles that will pass through a 2 micron filter.
❖ Suspended solids (SS) = silt, clay, plankton, algae, fine organic debris, and other particulate matter that will not pass through a 2-micron filter

Interrelationships
of solids

Determination of Suspended Solids

1.3 Water Quality Parameters
1.3.1 Physical Parameter - SOLIDS
Example 1
The following test were obtained for a wastewater taken from a headwork to a WTP. All the test were performed using sample size of 50 mL. Determine the concentration of total solids (TS), total volatile solids (TVS), suspende solids (SS), volatile suspended solids (VSS), total dissolved solids (TDS) and volatile dissolved solids.
Data:
Tare mass of evaporating dish = 53.5433 g
Mass of evaporating dish + residue after evaporation at 105oC =53.5794 g
Mass of evaporating dish + residue after ignition at 550oC = 53.5625 g
Tare mass of Whatman GF/C filter after drying at 105oC = 1.5433 g
Mass of Whatman GF/C filter + residue after drying at 105oC = 1.5554 g
Mass of Whatman GF/C filter + residue after ignition at 550oC = 1.5476 g

1.3 Water Quality Parameters
1.3.1 Physical Parameter - SOLIDS
1) Determine total solids (TS)
TS = (mass of dish + residue, g)-(mass of dish, g)
sample size, Liter
TS = ((53.5794-53.5433) g)(103 mg/g) = 722 mg/L
0.050 L
2) Determine total volatile solids (TVS)
TVS = (mass of dish + residue, g)-(mass of dish + residue after ignition, g)
sample size, Liter
TVS = ((53.5794-53.5625) g)(103 mg/g) = 338 mg/L
0.050 L
Solution:

1.3 Water Quality Parameters
1.3.1 Physical Parameter - SOLIDS
3. Determine total suspended solids (TSS)
TS = (residue on filter after drying, g)-(tare mass of filter after drying, g)
sample size, Liter
TS = ((1.5554-1.5433) g)(103 mg/g) = 242 mg/L
0.050 L
4. Determine total volatile solids (TVS)
TVS = (residue on filter after drying, g)-(residue on filter after ignition, g)
sample size, Liter
TVS = ((1.5554-1.5476) g)(103 mg/g) = 156 mg/L
0.050 L

1.3 Water Quality Parameters
1.3.1 Physical Parameter - TURBIDITY
• Is a measure of the amount of particulate matter that is suspended in water or the measurement of water clarity.
• Measured by Turbidity meter.
• Unit-NTU (Nephlometric Turbidity Unit)
• Water that has high turbidity appears cloudy / opaque .
• High turbidity can cause increased of water temperature and decreased DO
WHY???
1.3 Water Quality Parameters
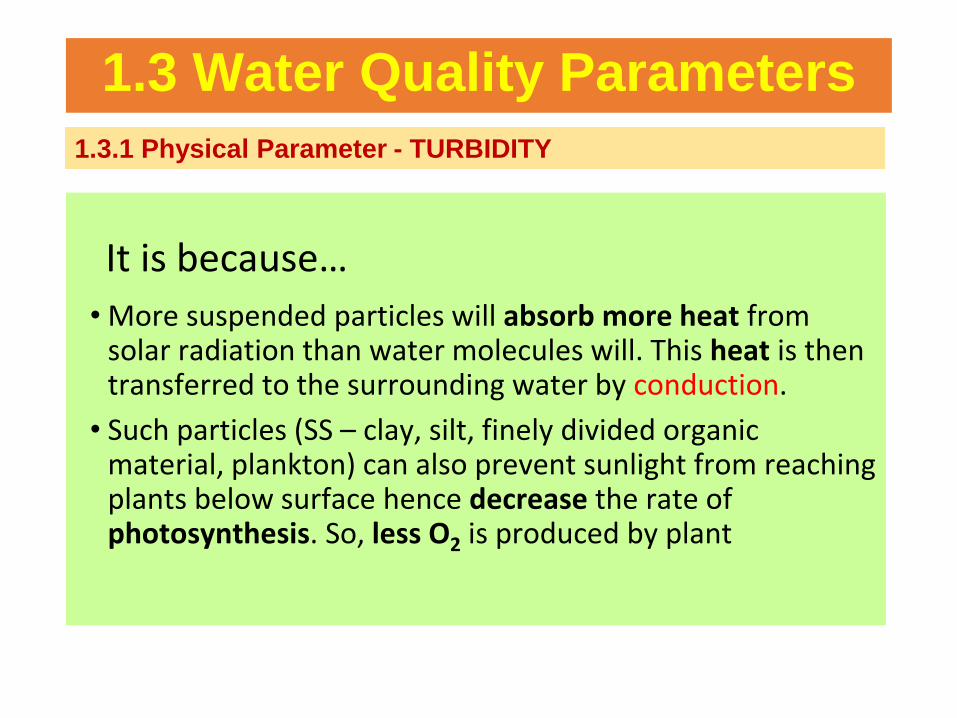
1.3.1 Physical Parameter - TURBIDITY
• More suspended particles will absorb more heat from solar radiation than water molecules will. This heat is then transferred to the surrounding water by conduction.
• Such particles (SS – clay, silt, finely divided organic material, plankton) can also prevent sunlight from reaching plants below surface hence decrease the rate of photosynthesis. So, less O2 is produced by plant
It is because…

1.3 Water Quality Parameters
1.3.1 Physical Parameter - TEMPERATURE
• It is a major factor in determining which species are present in the stream
• Temperature will impacts:(i) the rates of metabolism and growth of aquatic organism(ii) rate of plant photosynthesis(iii) solubility of O2 in water [0°C,
DO = 14.6 mg/l; 20°C, DO = 9.1 mg/l](iv) organism’s sensitivity to disease,
parasites and toxic materials• Temperature affects rate of chemical and microbiological reactions• The most suitable drinking waters are consistently cool and do not
have temperature fluctuations of more than a few degrees• Groundwater and surface water from mountain area generally meet
these criteria

1.3 Water Quality Parameters
1.3.2 Chemical Parameter
pH
Alkalinity
Hardness
Biochemical OxygenDemand (BOD)
Nitrogen & Phosphorus
Chemical OxygenDemand (COD)
1.3 Water Quality Parameters
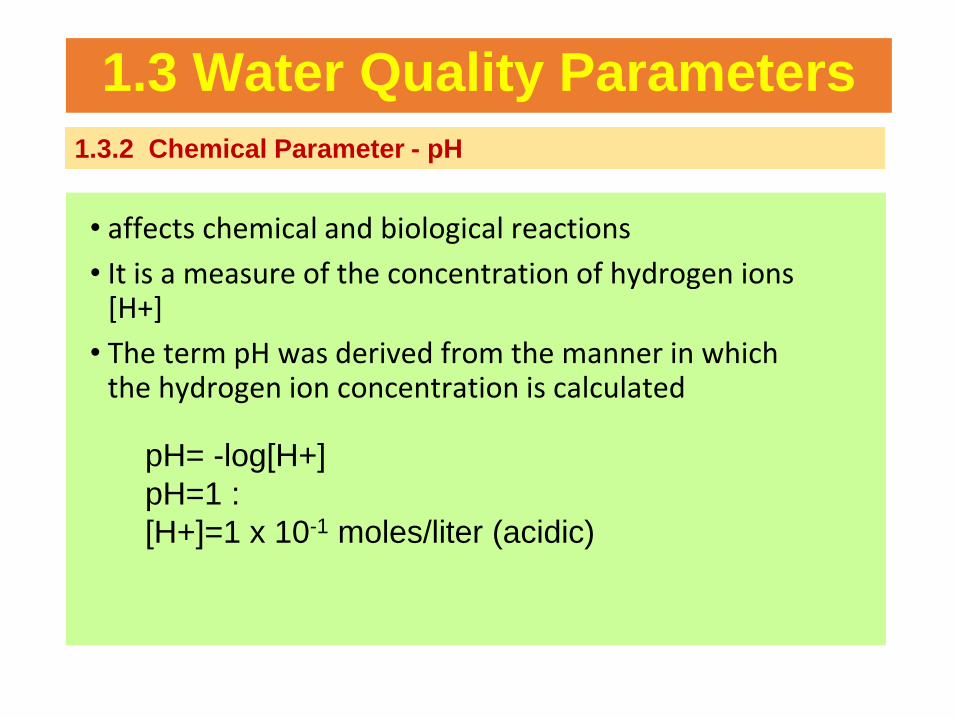
1.3.2 Chemical Parameter - pH
• affects chemical and biological reactions
• It is a measure of the concentration of hydrogen ions [H+]
• The term pH was derived from the manner in which the hydrogen ion concentration is calculated
pH= -log[H+]
pH=1 :
[H+]=1 x 10⁻¹ moles/liter (acidic)
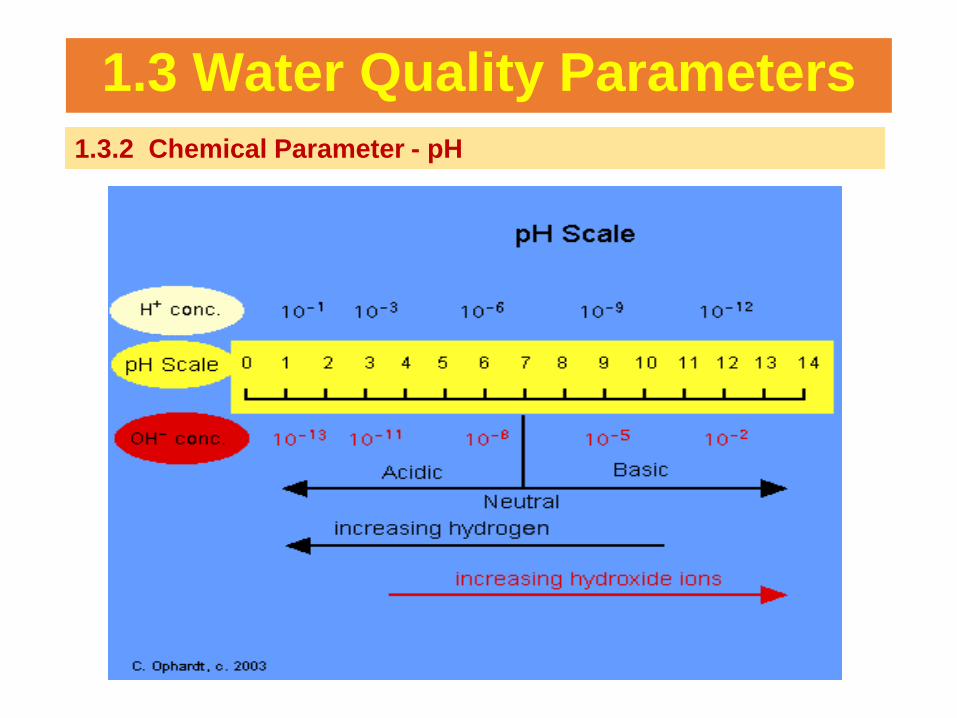
1.3 Water Quality Parameters
1.3.2 Chemical Parameter - pH
1.3 Water Quality Parameters
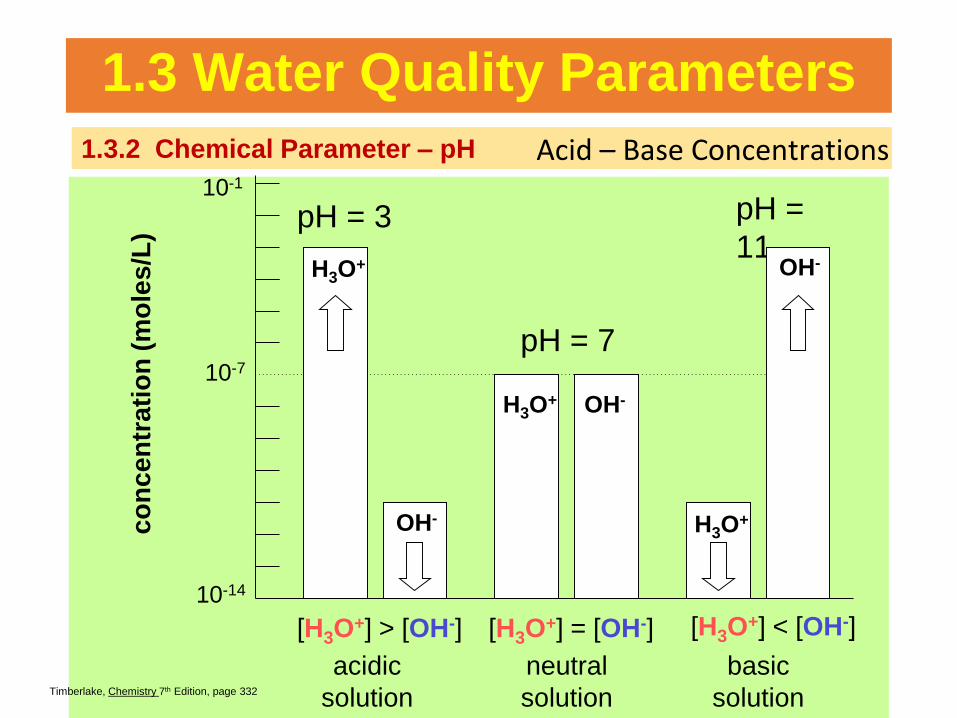
1.3.2 Chemical Parameter – pH Acid – Base Concentrations
pH = 3
pH = 7
pH =
11OH-
H3O+OH-
OH-H3O+
H3O+
[H3O+] = [OH-][H3O
+] > [OH-] [H3O+] < [OH-]
acidic
solution
neutral
solution
basic
solution
co
nc
en
tra
tio
n (
mo
les
/L)
10-14
10-7
10-1
Timberlake, Chemistry 7th Edition, page 332

1.3 Water Quality Parameters
1.3.2 Chemical Parameter - pH
Example 1
Calculate the concentration of hydrogen ion (H+) for a water sample with pH of 10.
pH = -log [H+]
10 = -log [H+]
Therefore, [H+]= antilog -10
= 10-10 mol/liter
Example 2
Calculate the pH value of a water sample which has hydrogen ion concentration of 1 x 10-6.4
mol/liter.
pH = -log [H+]
= -log (1 x 10-6.4)
= -[log 1 + log 10-6.4]
= -[0 + (-6.4)log 10]
= 6.4

1.3 Water Quality Parameters
1.3.2 Chemical Parameter - pH
Example 3
Find the hydrogen ion ( H+) concentration and the hydroxide ion (OH) concentration in tomato juice having a pH of 4.1. Prepare answer in unit mol/L and mg/L
pH = -log [H+]
4.1 = -log [H+]
Therefore,
[H+] = antilog -4.1
= 10-4.1 mol/L
pH + pOH = 14pOH = 14-4.1 = 9.9pOH = -log [OH-]9.9 = -log [OH-]
Therefore, [OH-] = antilog -9.9
= 10-9.9 mol/L


1.3 Water Quality Parameters
1.3.2 Chemical Parameter - pH
mol/L to mg/L• H+ == atomic weight = 1 g/mol ( refer Periodic Table)• OH- == atomic weight = 17 g/mol (refer Periodic Table)• mol/L (conc. ) x g/mol (atomic weight) x 1000mg/1g = mg/L
---------------------------------------------------------------------------------------------------------------------------
Therefore,
[H+] = 10-4.1 mol/L
= 10-4.1 mol/L x g/mol (1) x 1000mg/1g
= 0.0794 mg/L
[OH-] = 10-9.9 mol/L
= 10-9.9 mol/L x g/mol (17) x 1000mg/1g
= 2.14 x 10⁻⁶ mg/L

1.3 Water Quality Parameters
1.3.2 Chemical Parameter - Hardness
❖ Stream water hardness is the total concentration of cations, specifically calcium (Ca2+ ),magnesium (Mg2+), iron (Fe2+), manganese (Mn2+) in the water.
❖ Water rich in these cations is said to be ‘hard’. Stream water hardness reflects the geology of the catchment area.
❖ Sometimes it also provides a measure of the influence of human activity
❖ For instance, acid mine drainage often results in the release of iron into a stream. The iron produces extraordinarily high hardness which is a useful water quality indicator.
❖ Hardness is a reflection of the amount of calcium and magnesium entering the stream through the weathering of rock such as limestone (CaCO3).

1.3 Water Quality Parameters
1.3.2 Chemical Parameter – Hardness (Carbonate hardness)
• Source: Combination of Ca and Mg ions with ions of CO32-, or
HCO3-.• These carbonate components can be eliminated by softening
methods such as boiling, or by adding lime• When the carbonate components settled then the water have
become soft water.

1.3 Water Quality Parameters
1.3.2 Chemical Parameter – Hardness (Carbonate hardness)
Mg(HCO3)2
Ca 2+
Ca(HCO3)2 CaCO3MgCO3
Mg 2+ HCO3- CO3
2-+
1.3 Water Quality Parameters
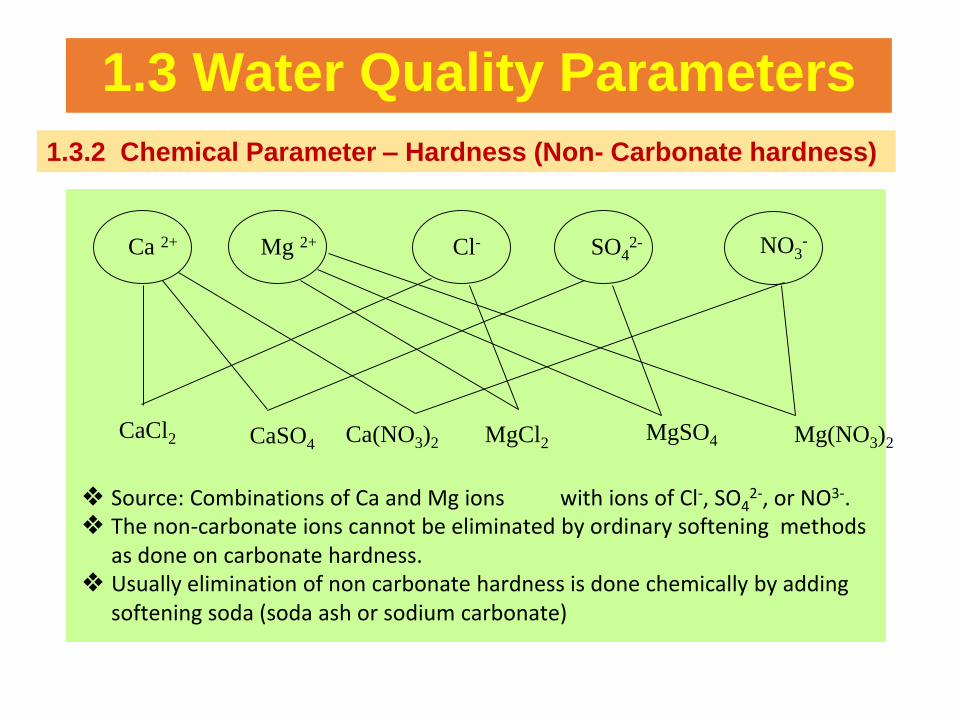
1.3.2 Chemical Parameter – Hardness (Non- Carbonate hardness)
❖ Source: Combinations of Ca and Mg ions with ions of Cl-, SO42-, or NO3-.
❖ The non-carbonate ions cannot be eliminated by ordinary softening methods as done on carbonate hardness.
❖ Usually elimination of non carbonate hardness is done chemically by adding softening soda (soda ash or sodium carbonate)
Ca 2+
CaCl2 CaSO4
Mg 2+ Cl- SO42- NO3
-
MgCl2Ca(NO3)2MgSO4 Mg(NO3)2
1.3 Water Quality Parameters
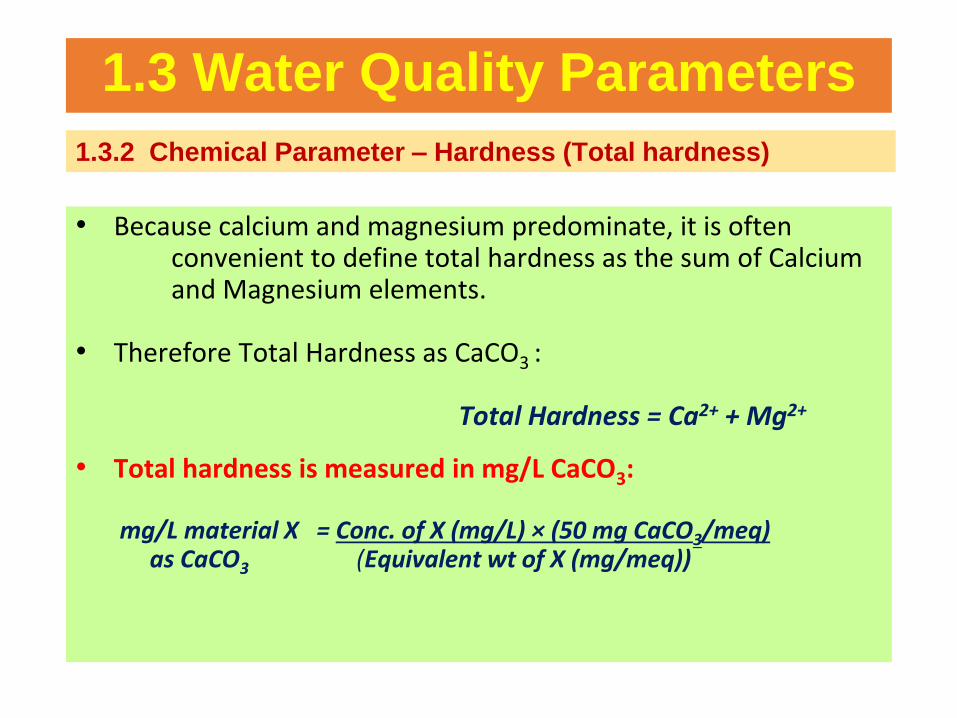
1.3.2 Chemical Parameter – Hardness (Total hardness)
• Because calcium and magnesium predominate, it is often convenient to define total hardness as the sum of Calcium and Magnesium elements.
• Therefore Total Hardness as CaCO3 :
Total Hardness = Ca2+ + Mg2+
• Total hardness is measured in mg/L CaCO3:
mg/L material X = Conc. of X (mg/L) × (50 mg CaCO3/meq)as CaCO3 (Equivalent wt of X (mg/meq))
1.3 Water Quality Parameters
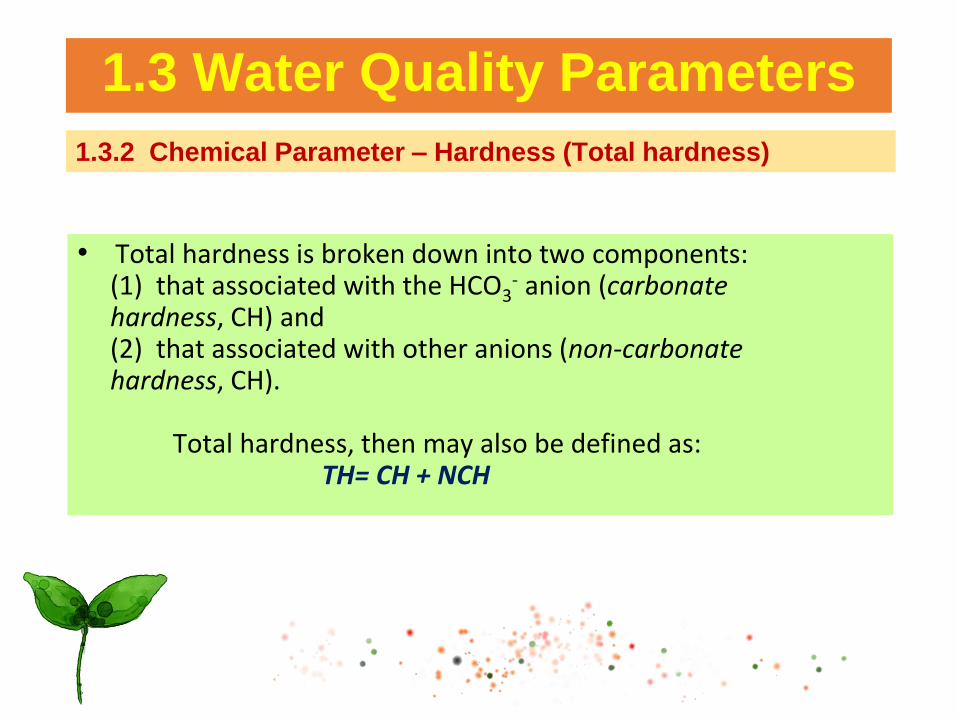
1.3.2 Chemical Parameter – Hardness (Total hardness)
• Total hardness is broken down into two components: (1) that associated with the HCO3
- anion (carbonate hardness, CH) and(2) that associated with other anions (non-carbonate hardness, CH).
Total hardness, then may also be defined as:TH= CH + NCH
1.3 Water Quality Parameters
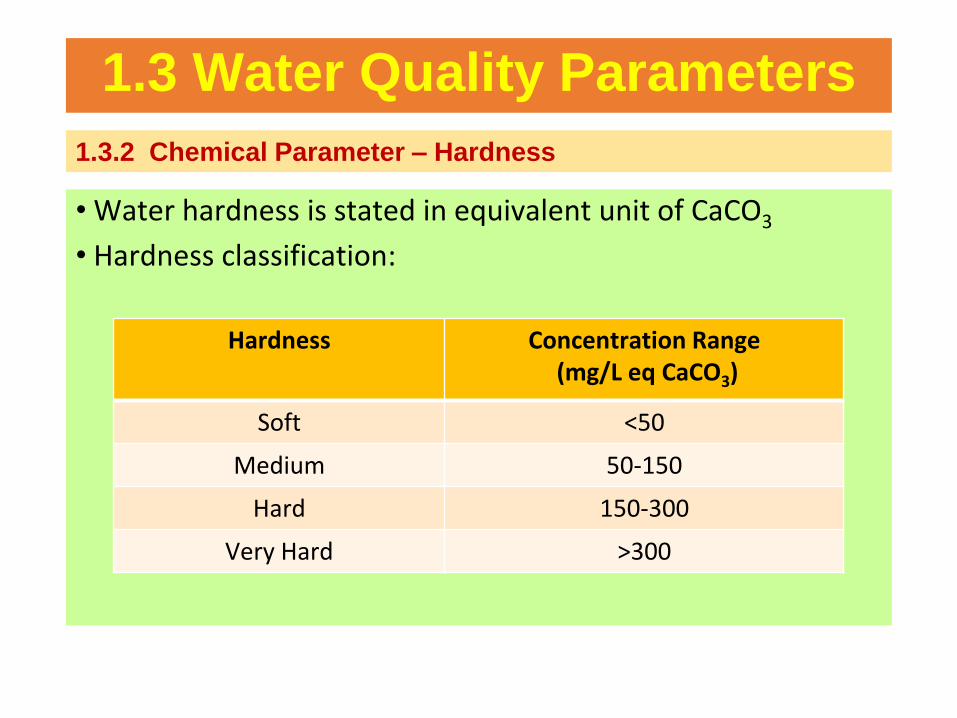
1.3.2 Chemical Parameter – Hardness
• Water hardness is stated in equivalent unit of CaCO3
• Hardness classification:
Hardness Concentration Range (mg/L eq CaCO3)
Soft <50
Medium 50-150
Hard 150-300
Very Hard >300

1.3 Water Quality Parameters
1.3.2 Chemical Parameter – Hardness
Example 1
Find the equivalent weight (EW) of each of the following:
i) Ca2+, ii) CO32-, and iii) CaCO3.
Solution:
Equivalent weight was defined as
EW = [atomic or molecular weight] / [n] (valence)
units: grams/equivalent (g/eq) or milligrams/milliequivalent (mg/meq)
i) For calcium, n=2 (valence or oxidation state in water).
Atomic weight = 40.08 ( refer Periodic table)
Therefore the EW is then
EW of Ca2+ = 40.08/2 = 20.04 g/eq or mg/meq

1.3 Water Quality Parameters
1.3.2 Chemical Parameter – Hardness
ii) For carbonate ion (CO32-), the oxidation state of 2- is used for n since
the base CO32- can potentially accept 2H+. The molecular weight (MW) is
60.01.
Therefore,
EW of CO32- = 60.01/2 = 30 g/eq or mg/meq
iii) In CaCO3, n=2 since it would take 2H+ to replace the cation (Ca2+) to form carbonic acid, H2CO3. The MW of CaCO3 is 100.
Therefore,
EW of CaCO3 = 100/2 = 50 g/eq or mg/meq

1.3 Water Quality Parameters
1.3.2 Chemical Parameter – Hardness
Example 2
A sample of groundwater has 100 mg/L of Ca2+ and 10 mg/L of Mg2+. Express it hardness in unit of mg/L as CaCO3.
Solution: Since;mg/L of X = concentration of X (mg/L) × (50 mg CaCO3/meq)as CaCO3 (equivalent weight of X (mg/meq))
1. Convert Ca2+ and Mg2+ to mg/L as CaCO3
Ca2+ : MW = 40, n=2, EW=40/2 = 20 g/eq or mg/meq
Mg2+ : MW = 24.3, n=2, EW=24.3/2 = 12.2 g/eq or mg/meq

2. Now, find the mg/L as CaCO3 of cations
Use formula;
mg/L of X = concentration of X (mg/L) × (50 mg CaCO3/meq)as CaCO3 (equivalent weight of X (mg/meq))
=>Ca2+ = 100 x 50 = 250 mg/L as CaCO3
20
=>Mg2+ = 10 x 50 = 41 mg/L as CaCO3
12.2
Total Carbonate Hardness = Ca2+ + Mg2+
= 250 + 41
= 291 mg/L as CaCO3
1.3 Water Quality Parameters
1.3.2 Chemical Parameter – Hardness

1.3 Water Quality Parameters
1.3.2 Chemical Parameter – Hardness
Example 3
From the water analysis below determine the total hardness of the water sample given the following
water composition;
Ca2+ = 95.2 mg/L HCO3 = 241.49 mg/L
Mg2+ = 13.44 mg/L SO42- = 53.77 mg/L
Na+ = 25.76 mg/L Cl- = 67.81 mg/L
Solution:
EW CaCO3 = 50 mg/meq
EW ion = Atomic wt
valence
Total Hardness (TH) = 293.37 mg/L as CaCO3
Carbonate Hardness (CH) = 198.00 as CaCO3
Non-carbonate Hardness (NCH) = TH-CH = 95.37 mg/L as CaCO3
Ion mg/L as ion
EW CaCO3/ EW ion
mg/L as CaCO3
Ca2+ 95.20 2.50 238.00
Mg2+ 13.44 4.12 55.37
Na+ 25.76 2.18 56.16
HCO3 241.46 0.82 198.00
SO42- 53.77 1.04 55.92
Cl- 67.81 1.41 95.61
(50/(40/2))
(50/(24.3/2))
(50/61)
(50/(96/2))

1.3 Water Quality Parameters
1.3.2 Chemical Parameter – Alkalinity
• Alkalinity is defined as the quantity of ions in water that will react to neutralise hydrogen ions (H+). Alkilinity is thus the measure of the ability of water to neutralise acids.• Therefore alkalinity is the buffer capacity of the water to
remain neutral.• The carbonate species that contribute to alkalinity are:• Hydroxyl ions (OH-), Carbonate ions (CO3
2-), Bicarbonate ions (HCO3
-), Alkalinity (mol/L) = [HCO3
-] + 2[CO32-] + [OH-] – [H+]
Alkalinity (mg/L as CaCO3) = (HCO3-) + (CO3
2-) + (OH-) – (H+)

1.3 Water Quality Parameters
1.3.2 Chemical Parameter – Alkalinity
• Is measured to determine the ability of a stream to resist changes in pH.
• Alkalinity results from the dissolution of calcium carbonate (CaCO3) from limestone bedrock which is eroded during the natural processes of weathering
• Alkalinity values of 20-200 ppm are common in freshwater ecosystems. Alkalinity levels below 10 ppm indicate poorly buffered streams.
• In large quantities, alkalinity imparts bitter taste to water.
• Reactions that can occur between alkaline water and certain ions resulting in precipitation of solids which can foul pipes and other water system appurtenances.

1.3 Water Quality Parameters
1.3.2 Chemical Parameter – Alkalinity
Example 1
A sample of water having a pH of 7.2 has the following concentrations of ions:
Ca2+ 40 mg/L Mg2+ 10 mg/L
Na+ 11.8 mg/L K+ 7.0 mg/L
HCO3- 110 mg/L SO4
2- 67.2 mg/L
Cl- 11 mg/L
Calculate the TH, CH, NCH, Alkalinity, and construct a bar chart of the constituents.

1.3 Water Quality Parameters
1.3.2 Chemical Parameter – Alkalinity
Ion Conc.
(mg/L)
M.W.
(mg/mole)⎮n⎮
Eq. Wt.
(mg/meq)
Conc.
(meq/L)
Conc. of X
mg/L as CaCO3
Ca2+ 40.0 40.1 2 20.05 1.995 99.8*
Mg2+ 10.0 24.3 2 12.15 0.823 41.2
Na+ 11.8 23.0 1 23.0 0.513 25.7
K+ 7.0 39.1 1 39.1 0.179 8.95
HCO3- 110.0 61.0 1 61.0 1.803 90.2
SO42- 67.2 96.1 2 48.05 1.398 69.9
Cl- 11.0 35.5 1 35.5 0.031 15.5
Solution1 2 3 4 5 6 7
(3/4) (6 x 50)(2/5)
mg/L of X as CaCO3 = concentration of X (mg/L) × (50 mg CaCO3/meq)
(equivalent weight of X (mg/meq))

1.3 Water Quality Parameters
1.3.2 Chemical Parameter – Alkalinity
Sample Calculation:
Conc in meq/L ( refer to Ca2+)
meg/L = mg/L x meq/mg
= 40.0 /20.05
= 1.995
Concentration of Ca2+ in mg/L as CaCO3
= (Concentration in meq/L)*(Equivalent Weight of CaCO3)
= (1.995 meq/L) X (50 mg/meq)
= 99.8 mg/L as CaCO3
Check Solution
Σ(Cation) s = Σ(Anion)s
175.6 = 175.6
Note: to within ± 10% mg/L as CaCO3
Total Hardness
= Σ of multivalent cations
= (Ca2+) + (Mg2+)
= 99.8 + 41.2
= 141 mg/L as CaCO3
1.3 Water Quality Parameters
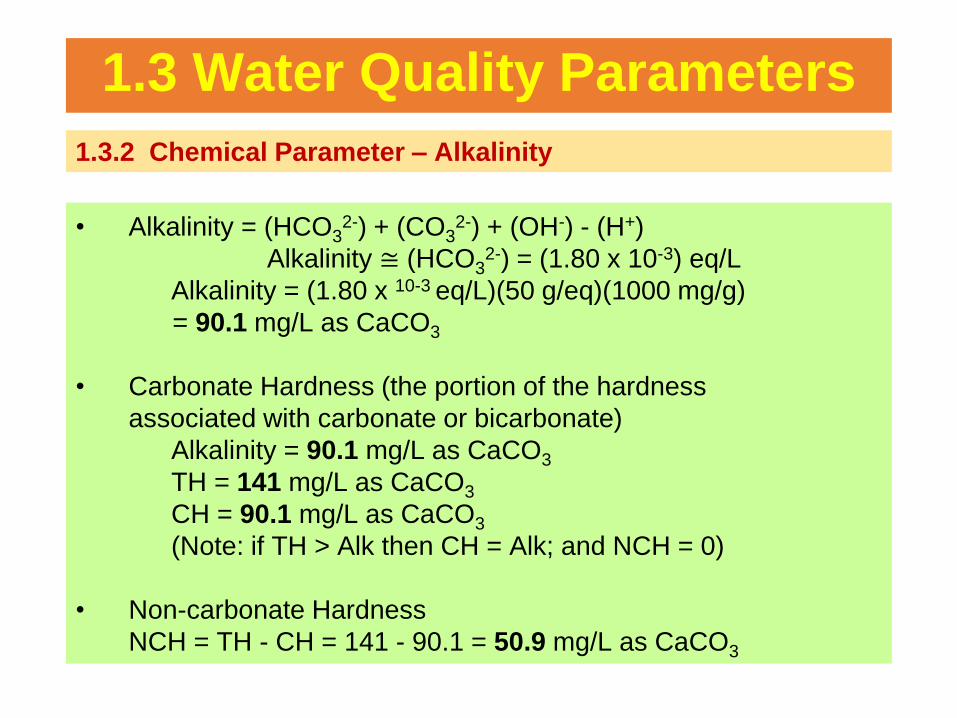
1.3.2 Chemical Parameter – Alkalinity
• Alkalinity = (HCO32-) + (CO3
2-) + (OH-) - (H+)
Alkalinity ≅ (HCO32-) = (1.80 x 10⁻³) eq/L
Alkalinity = (1.80 x 10⁻³ eq/L)(50 g/eq)(1000 mg/g)
= 90.1 mg/L as CaCO3
• Carbonate Hardness (the portion of the hardness
associated with carbonate or bicarbonate)
Alkalinity = 90.1 mg/L as CaCO3
TH = 141 mg/L as CaCO3
CH = 90.1 mg/L as CaCO3
(Note: if TH > Alk then CH = Alk; and NCH = 0)
• Non-carbonate Hardness
NCH = TH - CH = 141 - 90.1 = 50.9 mg/L as CaCO3

1.3 Water Quality Parameters
1.3.2 Chemical Parameter – Alkalinity
Bar chart

1.3 Water Quality Parameters
1.3.2 Chemical Parameter – Oxygen Demand
Measurements in form of
i) Biochemical oxygen demand
ii) Chemical oxygen demand
iii) Nitrogenous oxygen demand
Oxygen Demand
ThOD
(Theoretical oxygen demand )

1.3 Water Quality Parameters
1.3.2 Chemical Parameter – Oxygen Demand
ThOD – theoretical oxygen demand
(i) It is the amount of O2 required to oxidize a substance to CO2 and H2O
(ii) Calculated by stoichiometry if the chemical composition of the substance is known
(iii) The ThOD of X in mg/L
1.3 Water Quality Parameters
1.3.2 Chemical Parameter – Oxygen Demand
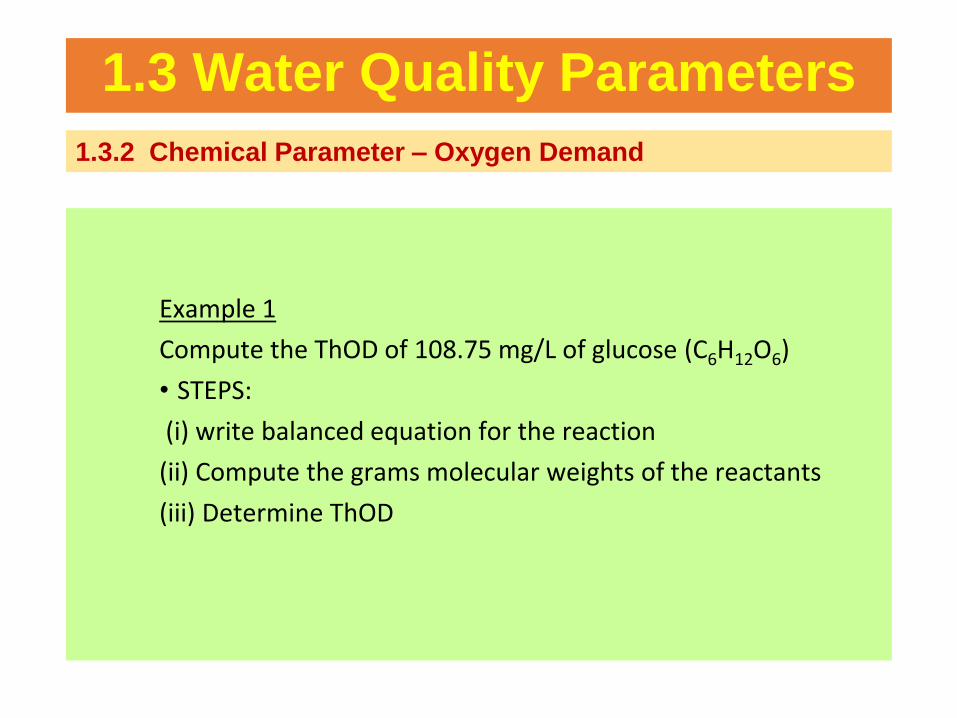
Example 1
Compute the ThOD of 108.75 mg/L of glucose (C6H12O6)
• STEPS:
(i) write balanced equation for the reaction
(ii) Compute the grams molecular weights of the reactants
(iii) Determine ThOD
1.3 Water Quality Parameters
1.3.2 Chemical Parameter – Oxygen Demand
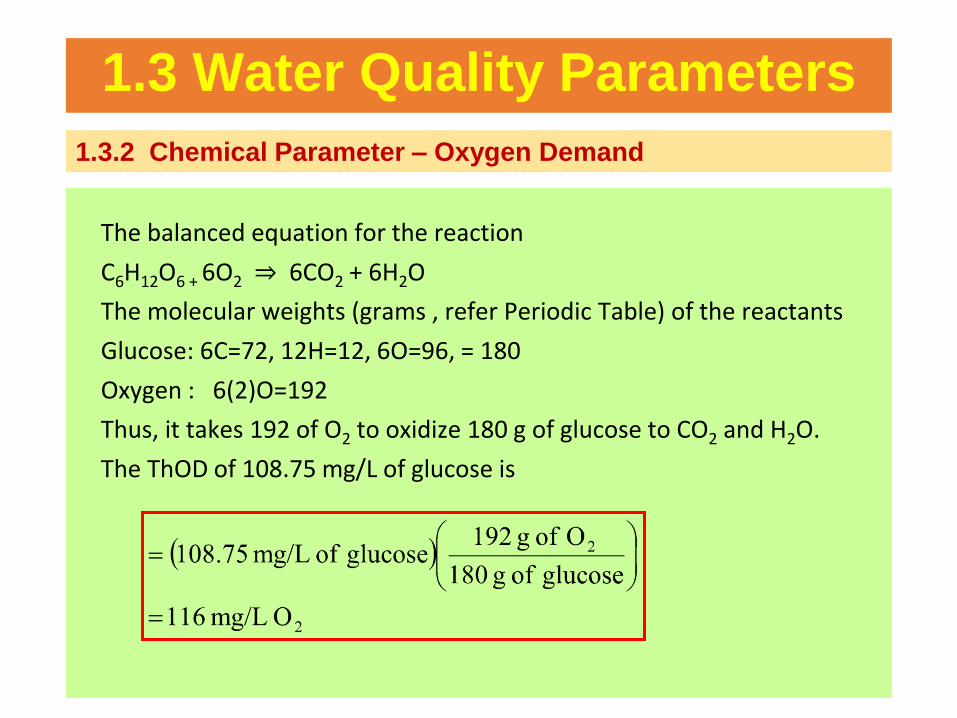
The balanced equation for the reaction
C6H12O6 + 6O2 ⇒ 6CO2 + 6H2O
The molecular weights (grams , refer Periodic Table) of the reactants
Glucose: 6C=72, 12H=12, 6O=96, = 180
Oxygen : 6(2)O=192
Thus, it takes 192 of O2 to oxidize 180 g of glucose to CO2 and H2O.
The ThOD of 108.75 mg/L of glucose is

1.3 Water Quality Parameters
1.3.2 Chemical Parameter – Oxygen Demand
Example 2If concentration of glucose is 10 mg/L what is the theoretical oxygen demand (amount of DO required?)

1.3 Water Quality Parameters
1.3.2 Chemical Parameter – Biochemical Oxygen Demand
❖ It is a measure of the quantity of oxygen used by microorganisms (eg.aerobic bacteria) in the oxidation of organic matter.
❖ In other words: BOD measures the change in dissolved oxygen concentration caused by the microorganisms as they degrade the organic matter.
❖ High BOD is an indication of poor water quality
❖ The term “decomposable” may be interpreted as meaning that the organic matter can serve as food for bacteria, and energy is derived from its oxidation.
❖ The standard oxidation (or incubation) test period for BOD is 5 days at 20°C or stated as a BOD5 and can be referred by using the Standard Methods for the Examination for Water and Wastewater (5210 B. 5- Day BOD Test).

1.3 Water Quality Parameters
1.3.2 Chemical Parameter – Biochemical Oxygen Demand
• Take sample of waste; dilute with
oxygen saturated water; add nutrients
and microorganisms (for seeded BOD test)
• Measure dissolved oxygen (DO) levels over 5 days
• Temperature 20° C
• In dark (prevents algae from growing)
• Need at least 2 mg/L change in DO over 5 days
• Maximum allowable DO depletion over the test period is 5mg/L
1.3 Water Quality Parameters
1.3.2 Chemical Parameter – Biochemical Oxygen Demand
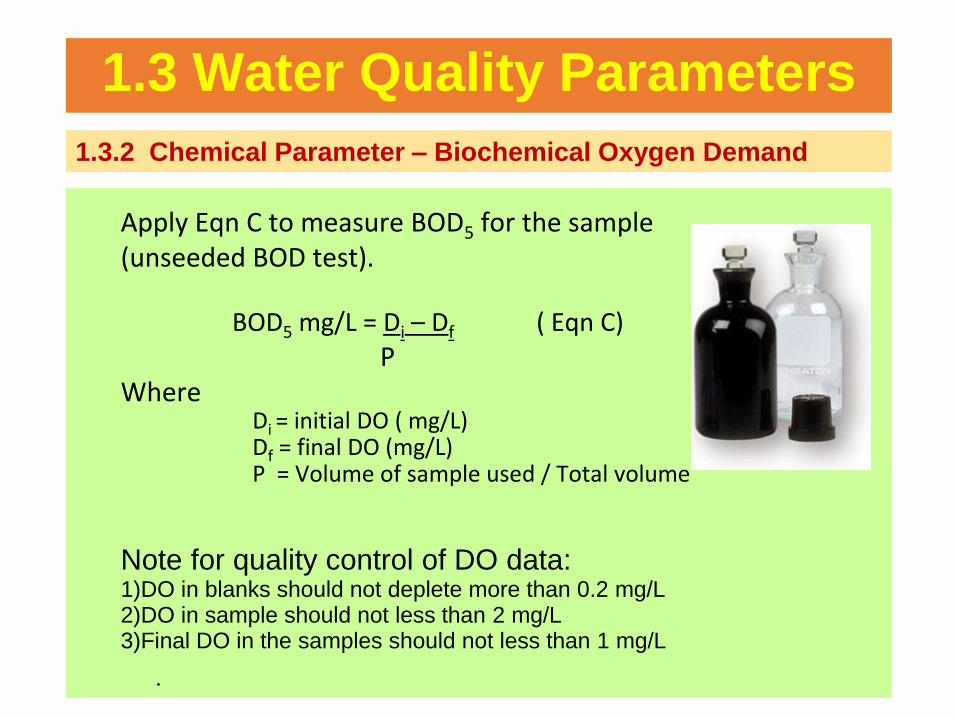
Apply Eqn C to measure BOD5 for the sample (unseeded BOD test).
BOD5 mg/L = Di – Df ( Eqn C)
PWhere
Di = initial DO ( mg/L)Df = final DO (mg/L)P = Volume of sample used / Total volume
•
Note for quality control of DO data: 1)DO in blanks should not deplete more than 0.2 mg/L2)DO in sample should not less than 2 mg/L3)Final DO in the samples should not less than 1 mg/L

1.3 Water Quality Parameters
1.3.2 Chemical Parameter – Biochemical Oxygen Demand
A BOD measurement is to carried out for wastewater sample. The wastewater sample inserted to BOD bottle is 10 mL. The 300 mL BOD bottle is filled up with dilution water. Calculate the BOD5 for the wastewater by using the given data:Concentration of DO (mg/L) Day 1 Day 5
7.5 5.0
•
Solution:
For each test bottle meeting the 2.0 mg/L minimum DO depletion
and the 1.0 mg/L residual DO, then the;

1.3 Water Quality Parameters
1.3.2 Chemical Parameter – Biochemical Oxygen Demand
Modeling BOD as a First-order Reaction
Organic matter oxidized
Organic matter remaining

1.3 Water Quality Parameters
1.3.2 Chemical Parameter – Biochemical Oxygen Demand
Modeling BOD Reactions
Assume rate of decomposition of organic waste is proportional to the waste that is left in the flask.
1.3 Water Quality Parameters
1.3.2 Chemical Parameter – Biochemical Oxygen Demand
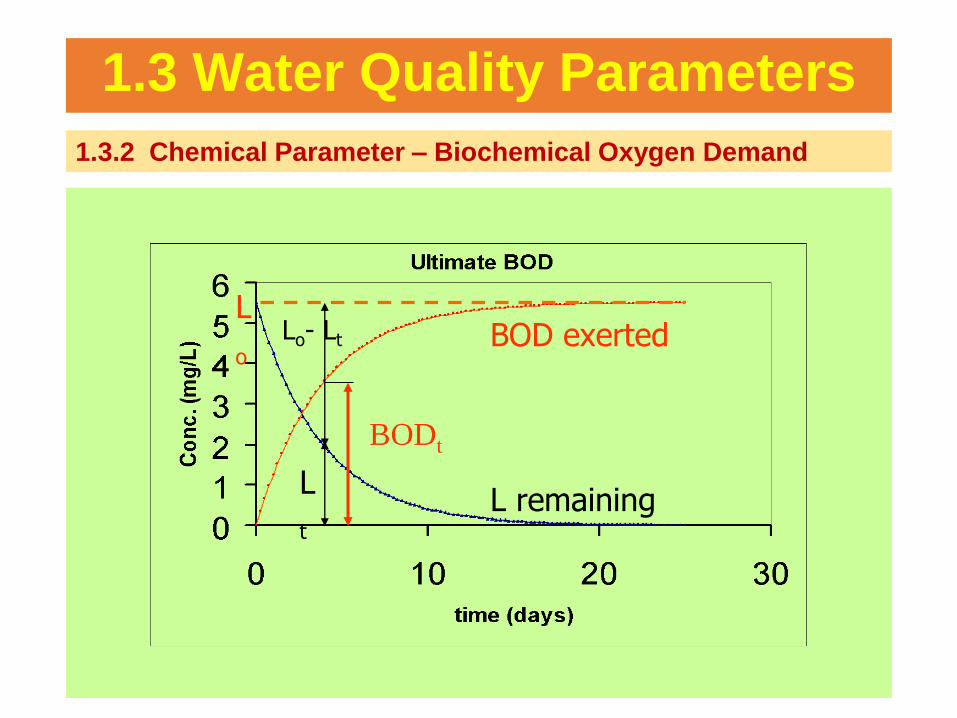
L
t
L
oLo- Lt BOD exerted
L remaining
BODt
1.3 Water Quality Parameters
1.3.2 Chemical Parameter – Biochemical Oxygen Demand
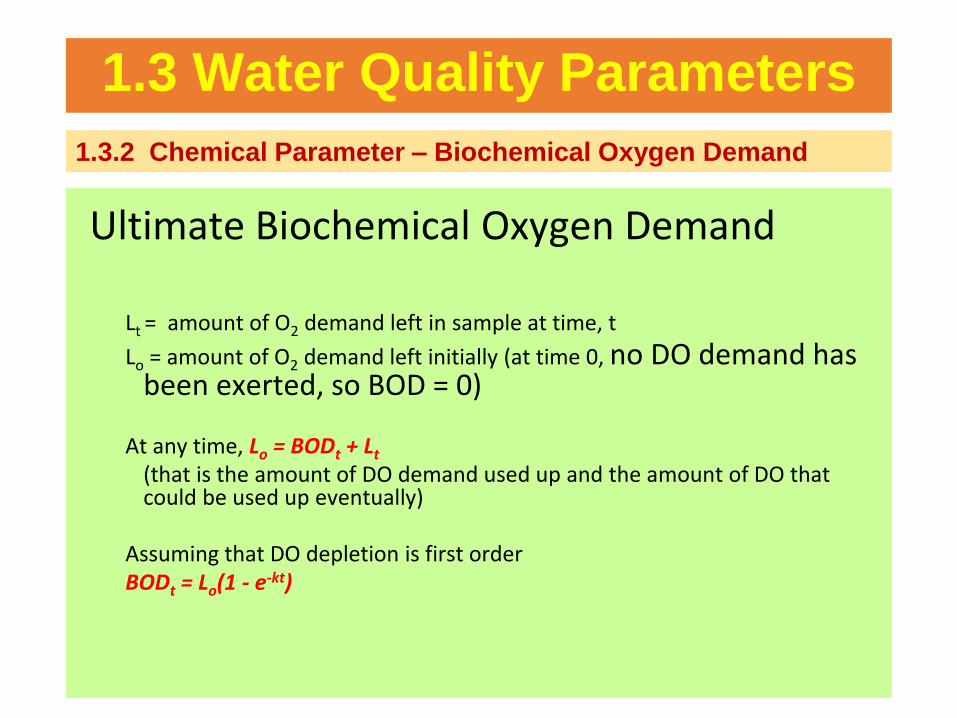
Ultimate Biochemical Oxygen Demand
Lt = amount of O2 demand left in sample at time, t
Lo = amount of O2 demand left initially (at time 0, no DO demand has been exerted, so BOD = 0)
At any time, Lo = BODt + Lt
(that is the amount of DO demand used up and the amount of DO that could be used up eventually)
Assuming that DO depletion is first orderBODt = Lo(1 - e-kt)

1.3 Water Quality Parameters
1.3.2 Chemical Parameter – Biochemical Oxygen Demand
BOD Rate ReactionExample 1
If the BOD5 of a waste is 102 mg/L and the BOD20
(corresponds to the ultimate BOD) is 158 mg/L, what is k (base e)?
1.3 Water Quality Parameters
1.3.2 Chemical Parameter – Biochemical Oxygen Demand
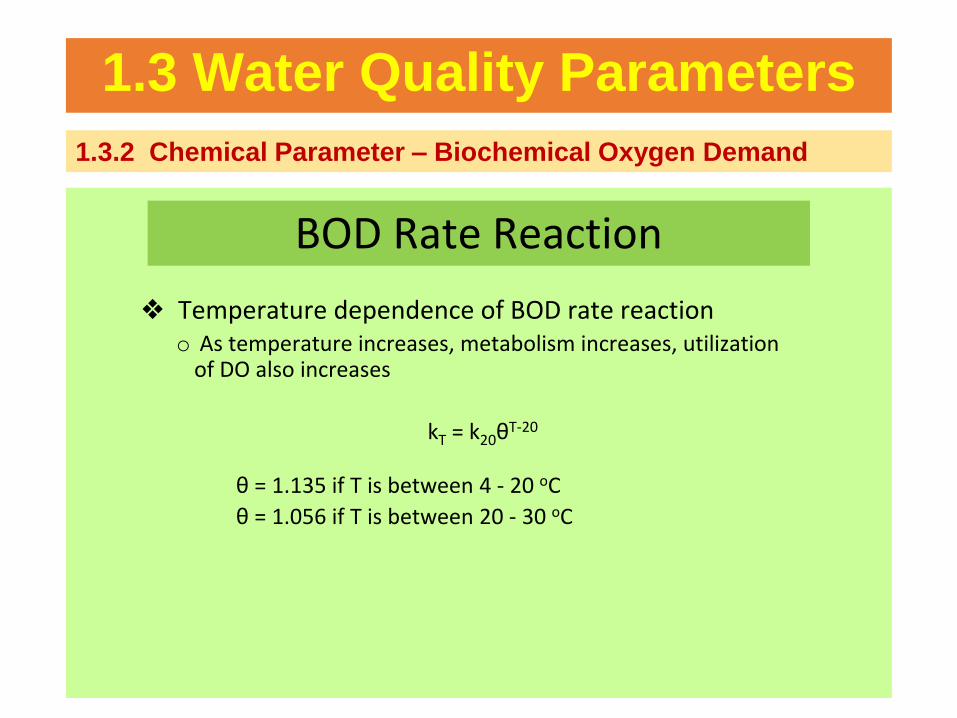
BOD Rate Reaction
❖ Temperature dependence of BOD rate reactiono As temperature increases, metabolism increases, utilization
of DO also increases
kT = k20θT-20
θ = 1.135 if T is between 4 - 20 oC
θ = 1.056 if T is between 20 - 30 oC

1.3 Water Quality Parameters
1.3.2 Chemical Parameter – Biochemical Oxygen Demand
BOD Rate ReactionExample 1
The BOD rate constant, k, was determined empirically to be 0.20 days-1 at 20 oC.
What is k if the temperature of the water increases to 25 oC?
What is k if the temperature of the water decreases to 10 oC?

1.3 Water Quality Parameters
1.3.2 Chemical Parameter – Biochemical Oxygen Demand
BOD Rate ReactionGraphical determination of BOD rate Constants
According to Thomas,
(1-e-kt) = kt (1+kt/6)-3
Therefore
BODt=Lo(1-e-kt)
BODt=Lo(kt)[1+(1/6)kt]-3 .....(1)
• By rearranging terms & taking the cube root of both sides, equation (1) can be transformed to:
(t/BODt)1/3=(kLo)-1/3 + (k)2/3/6(Lo)1/3 (t) ....(2)
• A plot of (t/BODt)1/3 versus t is linear. The intercept is defined as:
A = (kLo)-1/3 ….(3)

1.3 Water Quality Parameters
1.3.2 Chemical Parameter – Biochemical Oxygen Demand
BOD Rate Reactiona slope is defined by:
B = (k)2/3/6(Lo)1/3 ….(4)y=(t/BOD) 1/3
• Recalled , y = c + mx
x=t
A =(kLo)-1/3
b
a
m=a/b = (k2/3/6Lo1/3)

1.3 Water Quality Parameters
1.3.2 Chemical Parameter – Biochemical Oxygen Demand
BOD Rate Reaction
• Solving Lo1/3 in Eq.(3) substituting into Eq. (4) and solving for k yields:
k= 6(B/A) …(5)
• Likewise, substituting Eq. (5) into Eq.(3) and solving for Lo yields:
Lo = 1/(6A2B) …(6)
1.3 Water Quality Parameters
1.3.2 Chemical Parameter – Biochemical Oxygen Demand
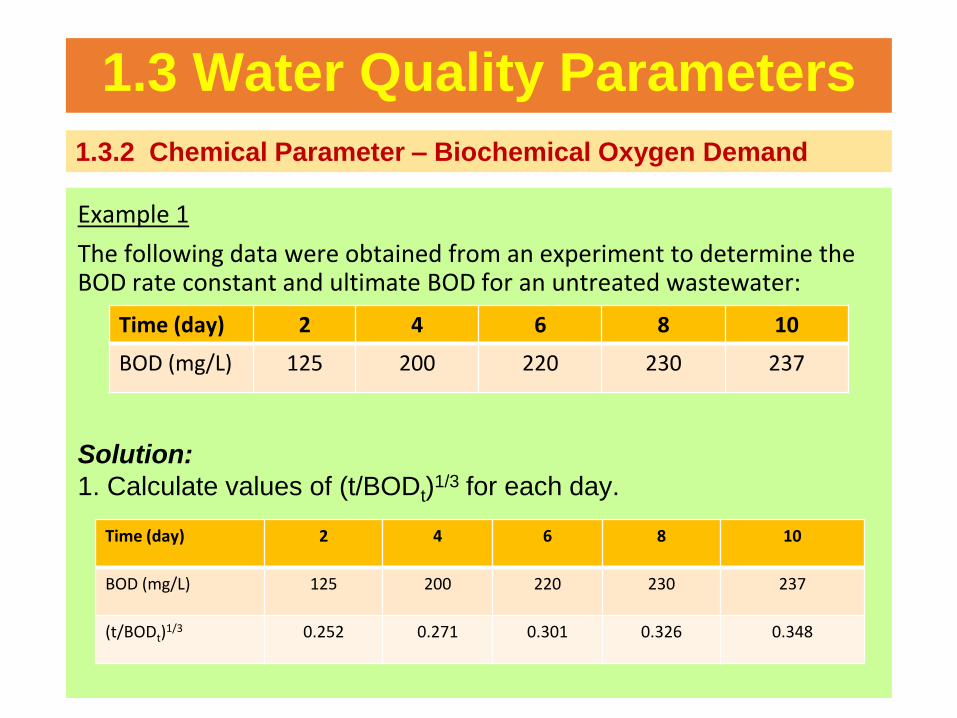
Example 1
The following data were obtained from an experiment to determine the BOD rate constant and ultimate BOD for an untreated wastewater:
Time (day) 2 4 6 8 10
BOD (mg/L) 125 200 220 230 237
Solution:
1. Calculate values of (t/BODt)1/3 for each day.
Time (day) 2 4 6 8 10
BOD (mg/L) 125 200 220 230 237
(t/BODt)1/3 0.252 0.271 0.301 0.326 0.348

1.3 Water Quality Parameters
1.3.2 Chemical Parameter – Biochemical Oxygen Demand
2. Plot (t/BODt)1/3 versus t on graph paper and draw the line
of best fit by eye.
3. Determine the intercept (A) and slope (B) from the plot.
Time (t)
A= 0.224
02 4 6 8 10
0.1
0.2
0.3
0.4
0.5
Slope, B= (0.348-0.224)/(10-0)
=0.0125
Y =
(t/
BO
Dt)
1/3

1.3 Water Quality Parameters
1.3.2 Chemical Parameter – Biochemical Oxygen Demand
4. Calculate k and Lo using the following formula
k = 6 (B/A) Lo = 1/ 6(A)2(B)
k = 6(B/A)
= 6(0.0125/0.224)
= 0.335 / day
Lo = 1/(6A2B)
= 266 mg/L

1.3 Water Quality Parameters
1.3.2 Chemical Parameter – Chemical Oxygen Demand (COD)
• It is based on the fact that all organic compounds, with a few exception, can be oxidized by the action of strong oxidizing agents under acid condition (=Value usually about 1.25 times BOD)
• Chemical oxygen demand is to measure the oxygen requirement of a sample that is likely to oxidation by strong chemical oxidant ( potassium dichromate).
• Organic matter in aqueous samples could be determined by oxidation with dichromate.
• The amount of O2 that is chemically equivalent to the dichromate consumed is defined as the COD of the sample.
• During the oxidation in which sample is heated with the known excess of dichromate, organic matter is converted to carbon dioxide and water while dichromate is reduced to Cr 3+.
• The excess dichromate is determined by means of an oxidation-reduction titration with ferrous ammonium sulfate (FAS).

1.3 Water Quality Parameters
1.3.2 Chemical Parameter – Nitrogenous Oxygen Demand
❖ The total BOD of a wastewater is composed of two components – a carbonaceous oxygen demand and a nitrogenous oxygen demand.
❖ Traditionally, because of the slow growth rates of those organisms (nitrosomonas and nitrobacter) that exert the nitrogenous demand, it has been assumed that no nitrogenous demand is exerted during the 5-day BOD5 test.

1.3 Water Quality Parameters
1.3.2 Chemical Parameter – Nitrogenous Oxygen Demand
1.3 Water Quality Parameters
1.3.2 Chemical Parameter – Nitrogenous Oxygen Demand
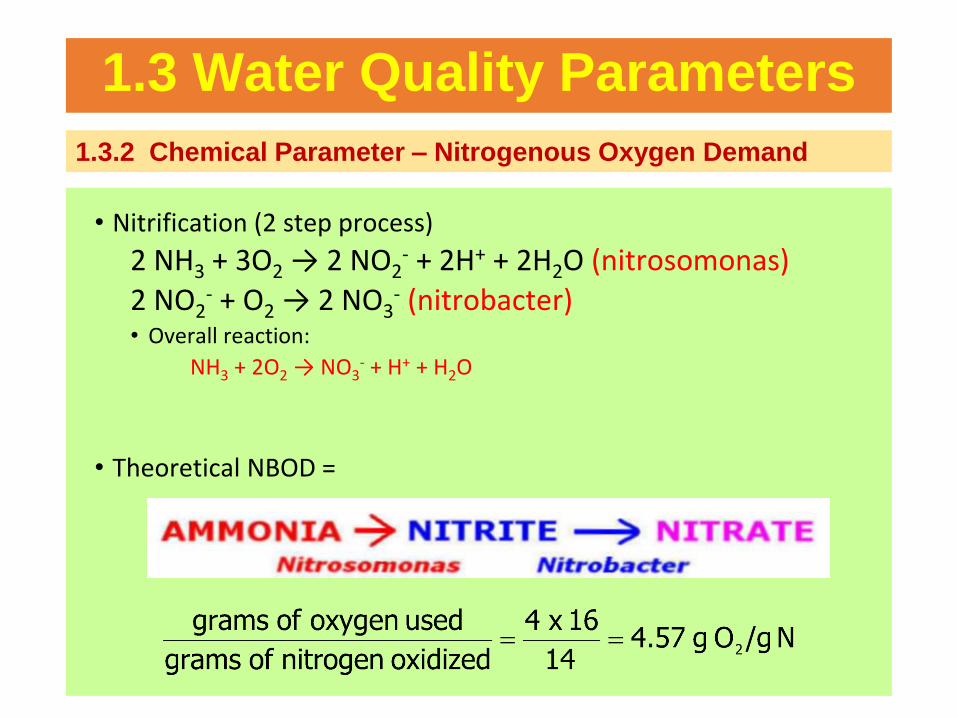
• Nitrification (2 step process)
2 NH3 + 3O2 → 2 NO2- + 2H+ + 2H2O (nitrosomonas)
2 NO2- + O2 → 2 NO3
- (nitrobacter)• Overall reaction:
NH3 + 2O2 → NO3- + H+ + H2O
• Theoretical NBOD =

1.3 Water Quality Parameters
1.3.2 Chemical Parameter – Nitrogenous Oxygen Demand
Untreated domestic wastewater
ultimate-CBOD = 250 - 350 mg/L
ultimate-NBOD = 70 - 230 mg/L
Ultimate NBOD ≈ 4.57 x TKN
TKN = is the sum of ammonia-nitrogen (NH3-N)
plus organic nitrogen ( protein and urea)
= 15 - 50 mg/L as N
(Total Kjeldahl Nitrogen = TKN)

1.3 Water Quality Parameters
1.3.2 Chemical Parameter – Nitrogen
❖ Nitrogen is often the limiting nutrient in ocean waters and some streams
❖ Nitrogen can exist in numerous forms, but nitrate (NO3-), nitrite (NO2
-), ammonia (NH3) are most commonly measured
❖ Sources are primarily from fertilizers and acid deposition
❖ Human intervention in the nitrogen cycle
1. Additional NO and N2O in atmosphere from burning fossil fuels; also causes acid rain
2. N2O to atmosphere from bacteria acting on fertilizers and manure
3. Destruction of forest, grasslands, and wetlands
4. Add excess nitrates to bodies of water
5. Remove nitrogen from topsoil

Nitrogen Cycle in a Terrestrial Ecosystem with Major Harmful Human Impacts
1.3 Water Quality Parameters
1.3.2 Chemical Parameter – Nitrogen
❖ Cycles through water, the earth’s crust, and living organisms
❖ Limiting factor for plant growth
❖ Impact of human activities1. Clearing forests
2. Removing large amounts of phosphate from the earth to make fertilizers
3. Erosion leaches phosphates into streams

Phosphorus Cycle with Major Harmful Human Impacts

Nitrogen & Phosphorus global concern
Eutrophication
1.3 Water Quality Parameters
1.3.3 Biological Parameter
Microbial Indicator
Macro-invertebrate indicators
1.3 Water Quality Parameters
1.3.3 Biological Parameter – Microbial indicators
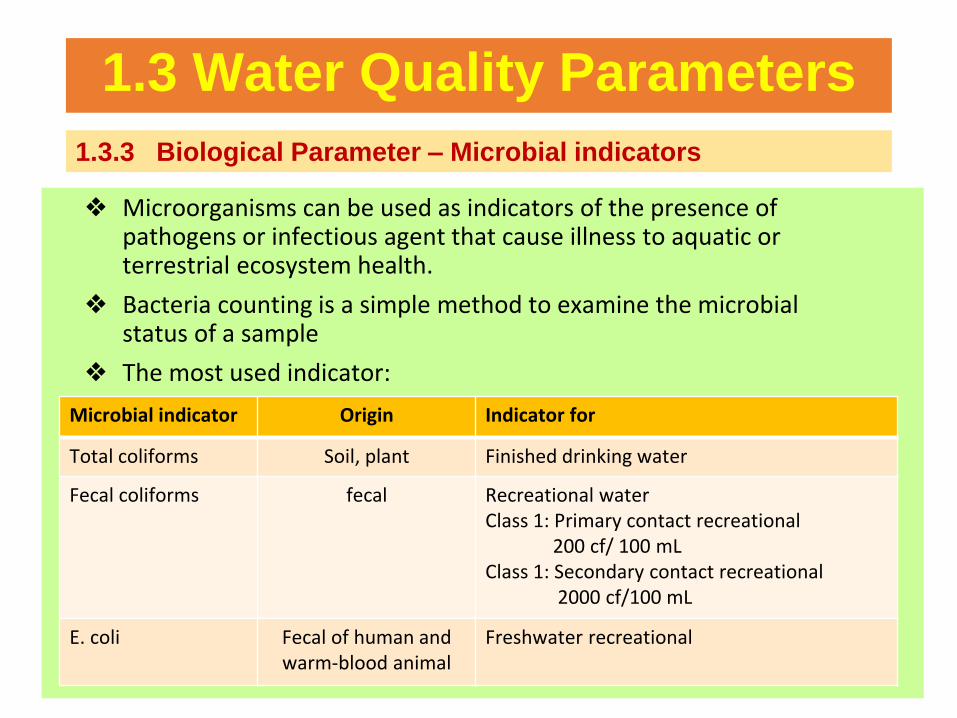
❖ Microorganisms can be used as indicators of the presence of pathogens or infectious agent that cause illness to aquatic or terrestrial ecosystem health.
❖ Bacteria counting is a simple method to examine the microbial status of a sample
❖ The most used indicator:
Microbial indicator Origin Indicator for
Total coliforms Soil, plant Finished drinking water
Fecal coliforms fecal Recreational waterClass 1: Primary contact recreational
200 cf/ 100 mLClass 1: Secondary contact recreational
2000 cf/100 mL
E. coli Fecal of human and warm-blood animal
Freshwater recreational

1.3 Water Quality Parameters
1.3.3 Biological Parameter – Microbial indicators
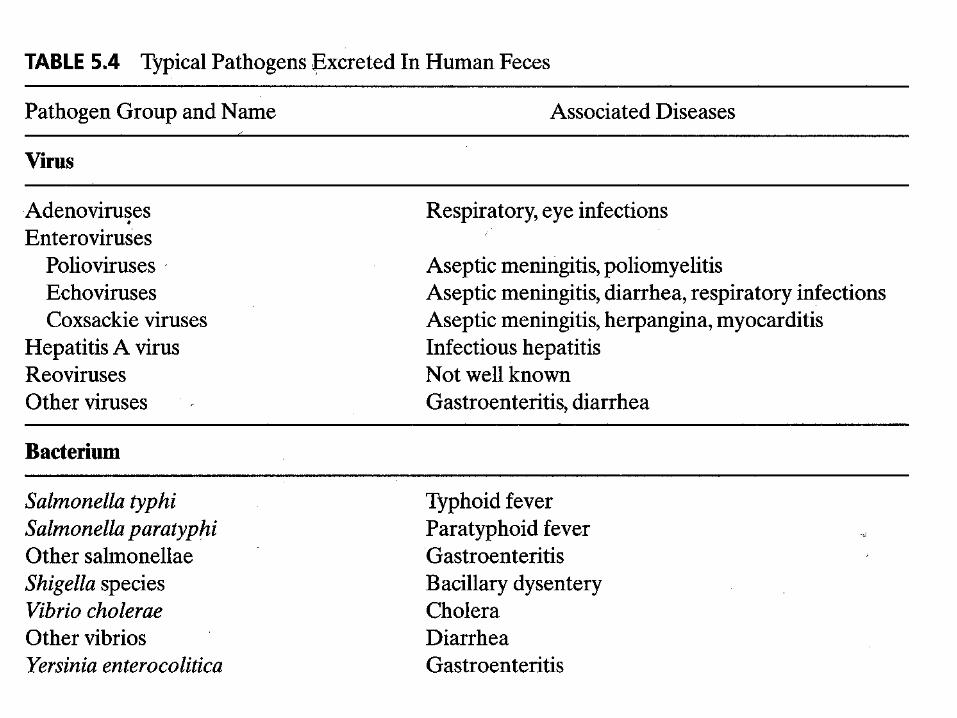
Pathogenic Organisms
❖ Many organims that cause human or animal diseases colonize the instinal tract but can live for a period of time outside the body
❖ Carriers (who may or may not exhibit disease symptoms) excrete these intestinal tract organisms in very large numbers
❖ When water is contaminated by excreta, the organisms can be transmitted to those who contact the water


1.3 Water Quality Parameters
1.3.3 Biological Parameter – Macro-invertebrate indicators
❖Macroinvertebrate are useful and convenient indicators of the ecological health of a waterbody or river. They are almost always present, and are easy to sample and identify
❖Benthic refers to the bottom of a waterway. Example of benthic macro-invertebrates include insects in their larval or nymph form, crayfish, claims, snails and worms.
❖Most live part or most of their life cycle attached to submerged rocks, logs and vegetation.

1.3 Water Quality Parameters
1.3.3 Biological Parameter – Microbial indicators

1.3 Water Quality Parameters
1.3.3 Biological Parameter – Microbial indicators

99
ContentPART 1: INTRODUCTION TO WATER QUALITY
i) Beneficial Water Use
ii) Water Resources
iii)Definition
iv) Objectives
v) Water Quality Parameters
PART 2:INTERIM NATIONAL WATER QUALITY STANDARDS
PART 3: WATER QUALITY PARAMETERS
i) Physical (Suspended Solids, Turbidity and Temperature)ii) Chemical (pH, Alkalinity, Hardness, Dissolved Oxygen (DO), Biochemical Oxygen Demand (BOD), Chemical Oxygen Demand
(COD), Nitrogen and Phosphorus)
iii) Microbiological (Total Coliforms, Fecal Coliforms, E.Coli, Macroinvertebrate Bioindicator)
PART 4: SAMPLING (RIVER MONITORING)
PART 5: DO SAG CURVE

1.4 Water Sampling (River Monitoring)
Why we sample??
• To verify compliance for INWQS, to classify the water body
1.4 Water Sampling (River Monitoring)
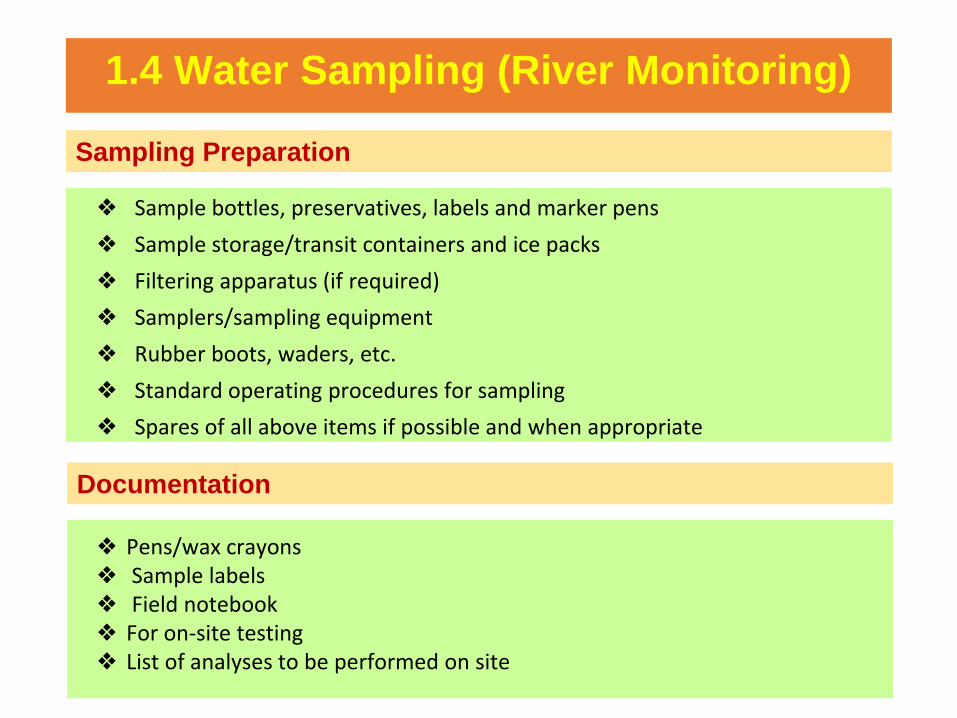
Sampling Preparation
❖ Sample bottles, preservatives, labels and marker pens
❖ Sample storage/transit containers and ice packs
❖ Filtering apparatus (if required)
❖ Samplers/sampling equipment
❖ Rubber boots, waders, etc.
❖ Standard operating procedures for sampling
❖ Spares of all above items if possible and when appropriate
Documentation
❖ Pens/wax crayons❖ Sample labels❖ Field notebook❖ For on-site testing ❖ List of analyses to be performed on site

1.4 Water Sampling (River Monitoring)
Collection &Preservation Of Water Samples
Standard Methods for the Examinations of Water and
Wastewater

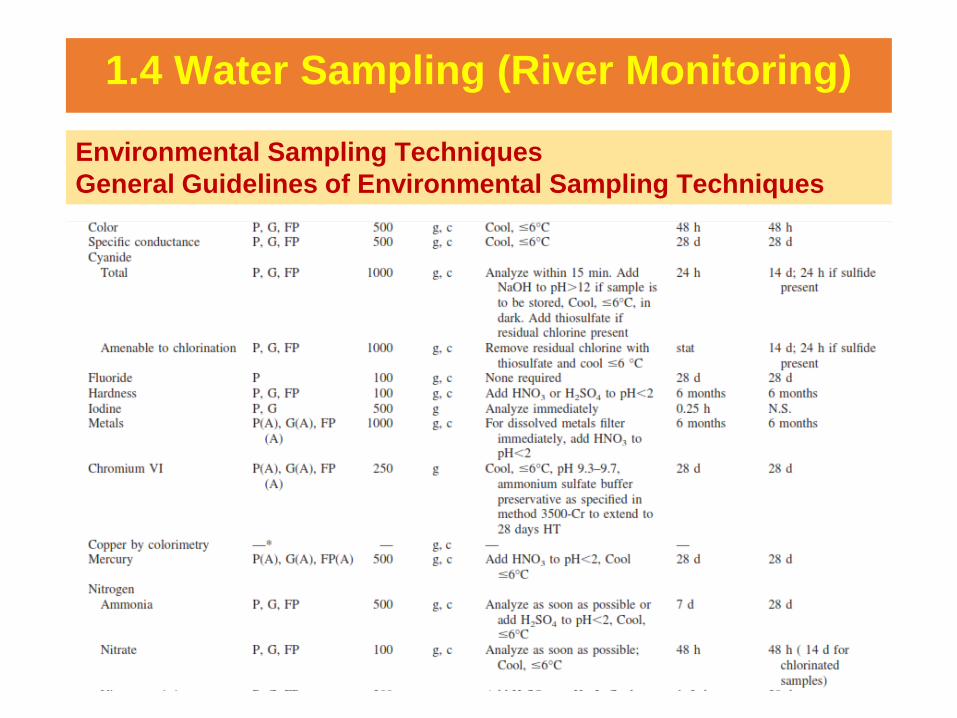
1.4 Water Sampling (River Monitoring)
Environmental Sampling Techniques
General Guidelines of Environmental Sampling Techniques
Sequence of Sampling Matrices and Analytes
❖Project deals with multimedia and/or multiple parameters use following sequence:
o Collect from least to most contaminated sampling locations
o If sediment and water is being collected, collect water first to minimize
effects from suspended bed materials
o For shallow streams, start downstream and work upstream to minimize
sediment effects due to sampling disturbances
o If sampling at different depths, collect surface samples first and then proceed
deeper
o Always collect VOCs first, followed by SVOCs (e.g. pesticides, PCBs, oil, etc.),
then total metals, dissolved metals, microbiological samples, and inorganic
nonmetals

1.4 Water Sampling (River Monitoring)
Environmental Sampling Techniques
General Guidelines of Environmental Sampling Techniques
Sample Amount
❖Minimum sample required depends on the concentration of the analytes present
❖ Should take enough for all analyses and additional for any QA/QC work required
❖ Heterogeneous samples generally require larger amounts to be representative of sample variations
❖ Taking too much sample can lead to problems with storage and transportation

1.4 Water Sampling (River Monitoring)
Environmental Sampling Techniques
General Guidelines of Environmental Sampling Techniques
Sample Amount - Water
• 5 mL for total petroleum hydrocarbons (TPHs), 100 mL for metals, 1 L for trace organics (pesticides)
• As a general rule the minimum volume collected should be 3-4 times the amount required for analysis (EPA, 1995)

1.4 Water Sampling (River Monitoring)
Environmental Sampling Techniques
General Guidelines of Environmental Sampling Techniques
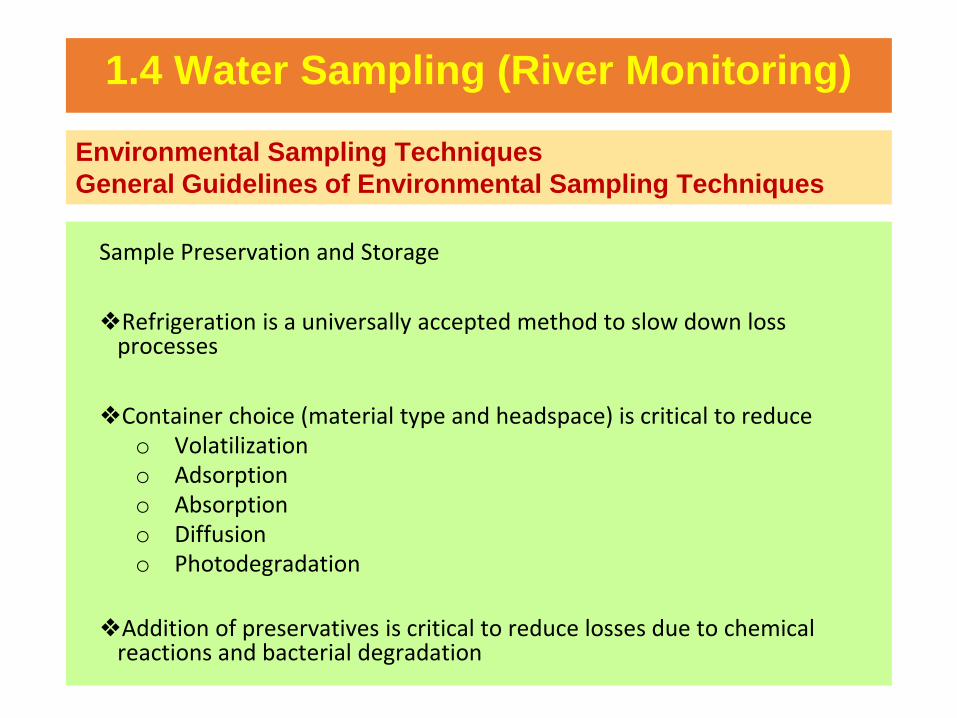
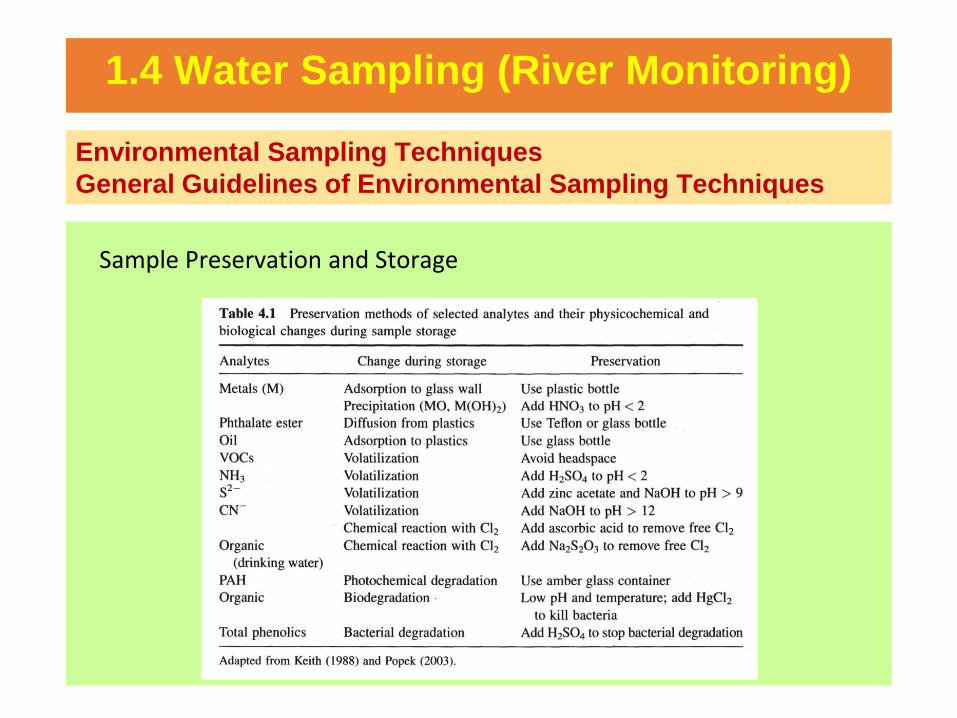
Sample Preservation and Storage
❖ Purpose – minimize physical, chemical and biological changes
❖ 3 approaches:
oRefrigeration
oUse of proper sample container
oAddition of preserving chemicals
1.4 Water Sampling (River Monitoring)
Environmental Sampling Techniques
General Guidelines of Environmental Sampling Techniques
Sample Preservation and Storage
❖Refrigeration is a universally accepted method to slow down loss processes
❖Container choice (material type and headspace) is critical to reduceo Volatilizationo Adsorptiono Absorptiono Diffusiono Photodegradation
❖Addition of preservatives is critical to reduce losses due to chemical reactions and bacterial degradation
1.4 Water Sampling (River Monitoring)
Environmental Sampling Techniques
General Guidelines of Environmental Sampling Techniques
Sample Preservation and Storage

1.4 Water Sampling (River Monitoring)
Environmental Sampling Techniques
General Guidelines of Environmental Sampling Techniques
Sample Preservation and Storage
• Maximum Holding Time (MHT) is the length of time a sample can be stored after collection and prior to analysis
• Immediate: pH, temperature, salinity, DO
• Within 1-2 days: careful pre-planning is required to avoid sampling on Friday, Saturday or near holidays

1.4 Water Sampling (River Monitoring)
Environmental Sampling Techniques
General Guidelines of Environmental Sampling Techniques
Selection of Sample Containers
Water
❖ Glass vs. Plastics: o Glass may leach boron and silica, metals may stick to wallso Glass is generally used for organics and plastic for metals, inorganics and physical
propertieso For trace organics cap and liner should be made of inert materials (teflon)
❖ Headspace vs. no Headspace:o No headspace is allowed for VOC samples/DOo 40 mL vial with a teflon-lined septumo Oil and grease should only be half-filled in wide mouthed
glass bottles
❖ Special containers:o e.g. BOD/DO bottles and VOC vials

1.4 Water Sampling (River Monitoring)
Environmental Sampling Techniques
General Guidelines of Environmental Sampling Techniques
1.4 Water Sampling (River Monitoring)
Environmental Sampling Techniques
General Guidelines of Environmental Sampling Techniques

1.4 Water Sampling (River Monitoring)
Environmental Sampling Techniques
General Guidelines of Environmental Sampling Techniques

114
PART 5
DO SAG CURVE

1.4 Water Sampling (River Monitoring)
Water purification system and DO sag curve
❖ The concentration of DO in river is an indicator of the general health of the river.
❖ All river have CAPACITY for water purification (self purification)o As long as the discharge of oxygen demanding wastes is well within the self
purification capacity, the DO level remain HIGH and a diverse population of plants and animals
o As the amount of waste increase, the self purification capacity can be exceeded, causing detrimental changes in plant and animal life
o then, the stream losses its ability to clean itself and the DO level DECREASES.
o when the DO drops below 4 to 5 mg/L, most game fish will have been driven out.
o If the DO is completely removed, fish and other higher animals are killed or driven
o The water become blackish and foul smelling as the sewage and dead animal life decompose under anaerobic condition (without O₂)

1.4 Water Sampling (River Monitoring)
Dissolved Oxygen Depletion
(From: Environmental Science: A Global Concern, 3rd ed. by W.P Cunningham and B.W. Saigo, WC Brown Publishers, © 1995)

1.4 Water Sampling (River Monitoring)
Dissolved Oxygen Sag Curve

1.4 Water Sampling (River Monitoring)
Mass Balance Approach
• Originally developed by H.W. Streeter and E.B. Phelps in 1925
• River described as “plug-flow reactor”
• Mass balance is simplified by selection of system boundaries
• Oxygen is depleted by BOD exertion
• Oxygen is gained through reaeration

1.4 Water Sampling (River Monitoring)
Steps in Developing the DO Sag Curve
1. Determine the initial conditions
2. Determine the reaeration rate from stream geometry
3. Determine the deoxygenation rate from BOD test and stream geometry
4. Calculate the DO deficit as a function of time
5. Calculate the time and deficit at the critical point

1.4 Water Sampling (River Monitoring)
Selecting System Boundaries

1.4 Water Sampling (River Monitoring)
Initial Mixing
Qr = river flow (m3/s)
DOr = DO in river (mg/L)
Lr = BOD in river (mg/L)
Qmix = combined flow (m3/s)
DO = mixed DO (mg/L)
La = mixed BOD (mg/L)
Qw = waste flow (m3/s)
DOw = DO in waste (mg/L)
Lw = BOD in waste (mg/L)
1.4 Water Sampling (River Monitoring)
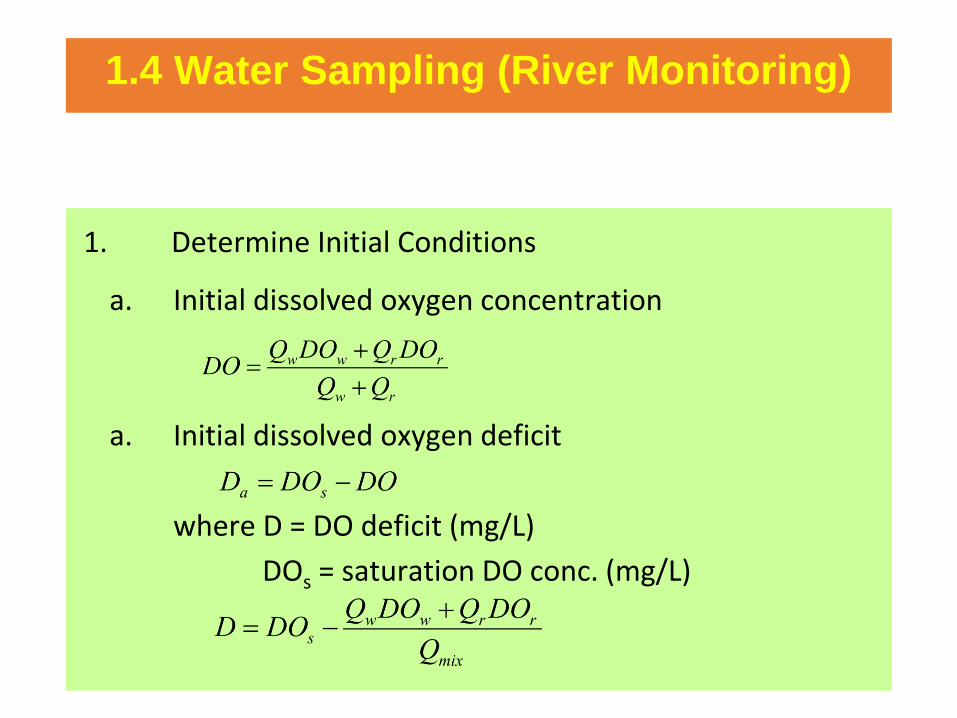
1. Determine Initial Conditions
a. Initial dissolved oxygen concentration
a. Initial dissolved oxygen deficit
where D = DO deficit (mg/L)
DOs = saturation DO conc. (mg/L)

1.4 Water Sampling (River Monitoring)
1. Determine Initial Conditions
DOsat is a function of temperature. Values can be found in Table A-3.
c. Initial ultimate BOD concentration

1.4 Water Sampling (River Monitoring)
Table A-3: Saturation values of DO in freshwater exposed to
saturated atmosphere containing 20.9% O2 under a pressure of
101.325kPa (Davis & Cornwell, 2013)

1.4 Water Sampling (River Monitoring)
2. Determine Re-aeration Ratea. O’Connor-Dobbins correlation
where kr = reaeration coefficient @ 20ºC (day-1)
u = average stream velocity (m/s)
h = average stream depth (m)
b. Correct rate coefficient for stream temperature
where Θ = 1.024

1.4 Water Sampling (River Monitoring)
3. Determine the Deoxygenation Rate
a. rate of deoxygenation = kdLt
where kd = deoxygenation rate coefficient (day-1)
Lt = ultimate BOD remaining at time (of travel downdstream) t
b. If kd (stream) = k (BOD test)
and

1.4 Water Sampling (River Monitoring)
3. Determine the Deoxygenation Rate
c. However, k = kd only for deep, slow moving streams. For others,
where η = bed activity coefficient (0.1 – 0.6)
d. Correct for temperature
where Θ = 1.135 (4-20ºC) or 1.056 (20-30ºC)

1.4 Water Sampling (River Monitoring)
4. DO as function of time
• Mass balance on moving element
• Solution is
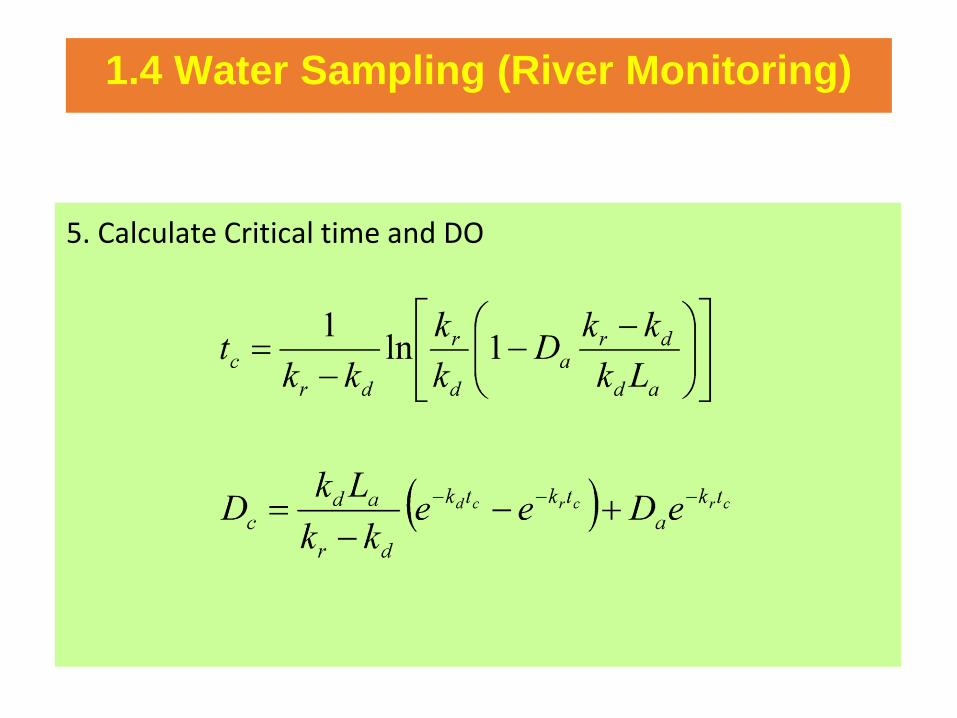
1.4 Water Sampling (River Monitoring)
5. Calculate Critical time and DO
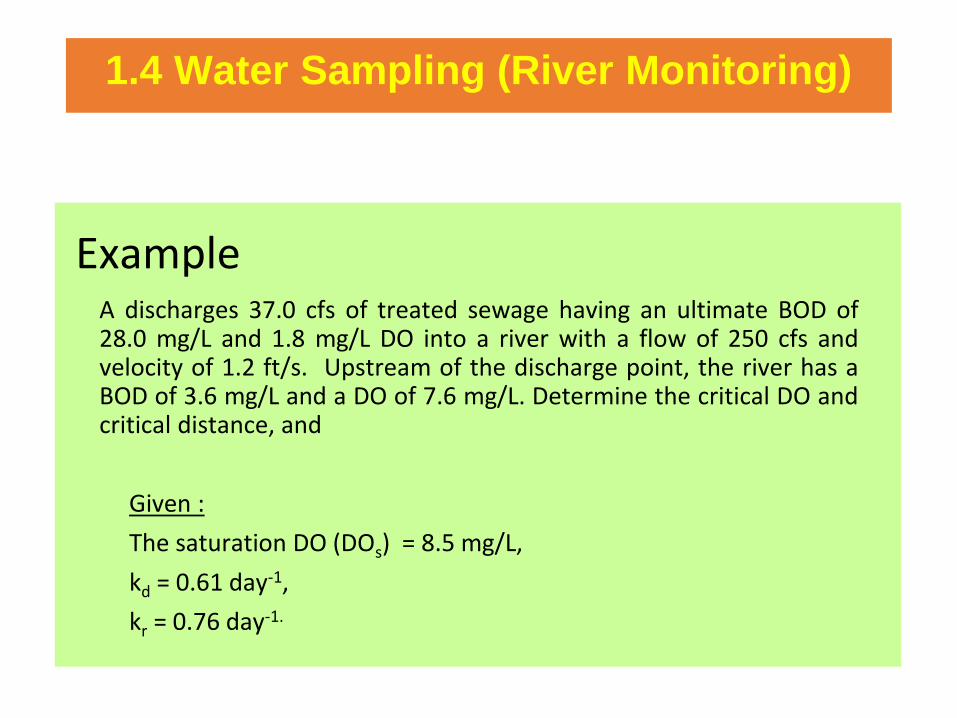
1.4 Water Sampling (River Monitoring)
ExampleA discharges 37.0 cfs of treated sewage having an ultimate BOD of28.0 mg/L and 1.8 mg/L DO into a river with a flow of 250 cfs andvelocity of 1.2 ft/s. Upstream of the discharge point, the river has aBOD of 3.6 mg/L and a DO of 7.6 mg/L. Determine the critical DO andcritical distance, and
Given :
The saturation DO (DOs) = 8.5 mg/L,
kd = 0.61 day-1,
kr = 0.76 day-1.

1.4 Water Sampling (River Monitoring)
1. Determine Initial Conditions
a. Initial dissolved oxygen concentration
b. Initial dissolved oxygen deficit

1.4 Water Sampling (River Monitoring)
1. Determine Initial Conditions
c. Initial ultimate BOD concentration

1.4 Water Sampling (River Monitoring)
2. Determine Re-aeration Rate
• kr = 0.76 day-1 given
• no need to calculate from stream geometry
• assume given value is at the stream temperature (since not otherwise specified), so no need to correct
• kd = 0.61 day-1 given• no need to calculate corrections from stream geometry • assume given value is at the stream temperature (since not
otherwise specified), so no need to correct
3. Determine the Deoxygenation Rate
1.4 Water Sampling (River Monitoring)
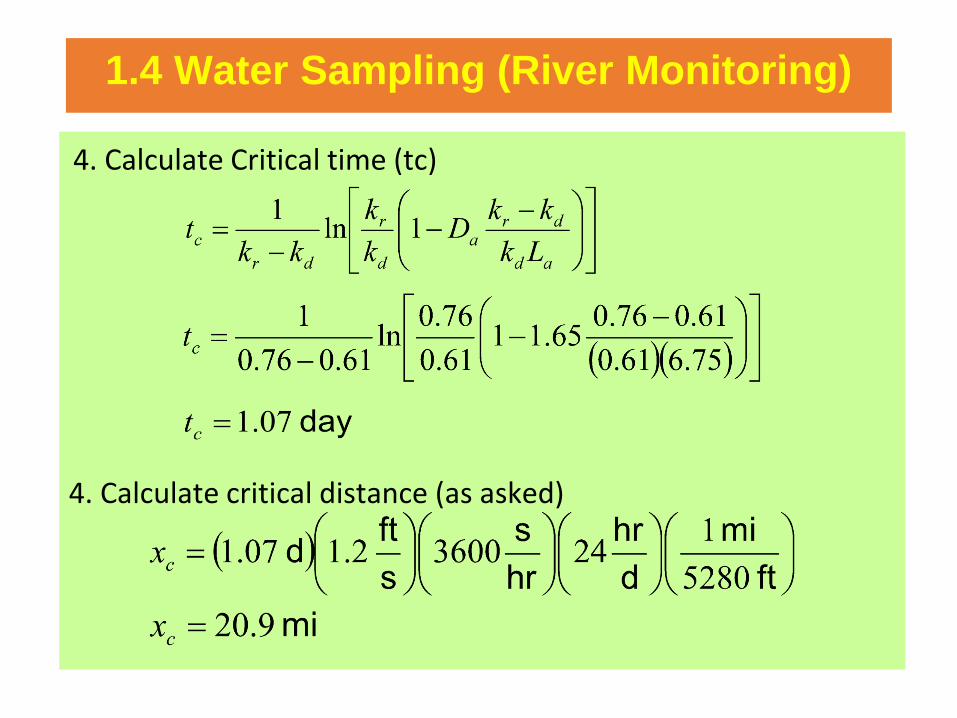
4. Calculate Critical time (tc)
4. Calculate critical distance (as asked)

1.4 Water Sampling (River Monitoring)
5. Calculate DO critical (Doc) (as asked)
6. Calculate DO deficit (Da) during critical

1.4 Water Sampling (River Monitoring)
Try this!!
1.The town of State College discharges 17,630m3/d of treated wastewater into the Bald Eagle Creek. The treated wastewater has a BOD5 of 12 mg/L and a k of 0.12d-1 at 20°C. Bald Eagle creek has a flow rate of 0.43 m3/s and an ultimate BOD of 5.0 mg/L. the DO of the river is 6.5 mg/L and the DO of the wastewater is 1.0 mg/L. the stream temperature is 10°C and the wastewater temperature is 10°C. Compute the DO and initial ultimate BOD after mixing.
2.Calculate the initial deficit of the Bald Eagle Creek after mixing with the wastewater from the town of State College. The stream temperature is 10°C and the wastewater temperature is 10°C.
3.Determine the deoxygenation rate constant for the reach of Bald Eagle Creek below the wastewater outfall (discharge pipe). The average speed of the stream flow in the creek is 0.03 m/s. the depth is 5.0 m and the bed-activity coefficient is 0.35.
4.Determine the DO concentration at a point 5km downstream from the State College discharge into the Bald Eagle Creek. Also determine the critical DO and the distance downstream at which it occurs.


