CIVIL & ENVIRONMENTAL ENGINEERING RESEARCH REPORT EFFECT OF SCC MIX PROPORTIONING ON TRANSFER AND DEVELOPMENT LENGTH OF PRESTRESSING STRANDS by Mahmoodul Haq Rigoberto Burgue~o Report No. CEE-RR- 2008/03 September 2008 Research Report for PCI under a 2003-2004 Daniel P. Jenny Research Fellowship Department of Civil and Environmental Engineering Michigan State University East Lansing, Michigan Conclusions or recommendations in this report are the opinions of the authors. PCI assumes no responsibility for the interpretation or application of the information contained herein.
Transcript
CIVIL & ENVIRONMENTALENGINEERING
RESEARCH REPORT
EFFECT OF SCC MIX PROPORTIONINGON TRANSFER AND DEVELOPMENT LENGTH
OF PRESTRESSING STRANDS
by
Mahmoodul Haq
Rigoberto Burgue~o
Report No. CEE-RR- 2008/03
September 2008
Research Report for PCI under a2003-2004 Daniel P. Jenny Research Fellowship
Department of Civil and Environmental EngineeringMichigan State UniversityEast Lansing, Michigan
Conclusions or recommendations in this report are the opinions of the authors. PCI assumes no responsibility for the interpretation or application of the information contained herein.
Report No. CEE-RR - 2008/03
EFFECT OF SCC MIX PROPORTIONINGON TRANSFER AND DEVELOPMENT LENGTH
OF PRESTRESSING STRANDS
by
l~Iahmoodul ItaqGraduate Research Assistant
Rigoberto BurguefioAssociate Professor of Structural Engineering
Research Report to PCI under a2003-2004 Daniel P. Jenny Research Fellowship
Department of Civil and Environmental EngineeringMichigan State University
East Lansing, MI 48824-1226
September 2008
Conclusions or recommendations in this report are the opinions of the authors. PCI assumes no responsibility for the interpretation or application of the information contained herein.
DISCLAIMER
The opinions, findings, conclusions and recommendations presemed in this report are those
of the authors alone and do not necessarily represent the views and opinions of Michigan State
University or the Precast/Prestressed Concrete Institute.
ii
Conclusions or recommendations in this report are the opinions of the authors. PCI assumes no responsibility for the interpretation or application of the information contained herein.
ABSTRACT
Self-consolidating concrete (SCC) is quickly moving from a potential transformative
technology to a mainstream example or’high-performance concrete. Its unique flowable behavior
without seggregation is obtained by careful mixture proportioning and Lhe use of chemical
admixtures. This approach, however, deviates from the traditional ideal mix approach for
concrete, which has raised concerns regarding material and structural performance. One of such
concerns is the bond performance of strand on precast/prestressed beams built using SCC.
This PCI Jenny Research project allowed an investigation on the effect of SCC mix
proportioning on the bond performance of prestressing strand. The study was based on the
experimental evaluation of transfer (Lt) and development lengths (Ld) of ½-in.-diameter seven-
wire strands on small-scale precast/prestressed T-beams. Three SCC mix designs that bound the
accepted methods towards SCC mix proportioning were designed. SCC1, with low w/c ratio
relied on high-fines content and high HRWR dosage for high-fluidity. SCC3, with high w/c ratio
and high aggregate content, relied on free-water content and moderate HRWR dosage for fluidity
and VMA for stability. SCC2 was a balanced design obtained from combining the two prior mix
approaches. A normally consolidated concrete (NCC) mix was used as a reference mix design.
The strand bond parameters were experimentally studied by: (a) pull-out tests on unstressed
strand, (b) determination of transfer length through compressive strain profile and strand draw-in
measurements, and (c) assessment of development lengths through iterative flexural testing.
Transfer and development lengths for strand in the SCC mixes of this study were found
to be within the ACI-318/AASHTO code estimates. However, in general, the bond performance
of strand on SCC was lower than for NCC. SCC mix designs had lower peak pull-out strength
(12%), longer transfer lengths (35%) and marginally longer development lengths (3%). The
SCC1 mix had the lowest bond performance, with lower pull-out strengths, and longer Lt and Ld.
The SCC3 mix had the best bond performance with the highest pull-out strengths, and shortest Lt
and Ld. Performance of the balanced SCC mix, SCC2, was between the noted extreme SCC mix
designs. Thus, the approach of setting bounds on bond peformance by considering limiting
approaches to SCC mix proportioning was successful. Further, SCC mix proportioning has
distinctive effects on the different bond mechanisms. Strand quality was found to be particularly
important for SCC. Overall, results indicate that strand bond performance on SCC is adequate.
iii
Conclusions or recommendations in this report are the opinions of the authors. PCI assumes no responsibility for the interpretation or application of the information contained herein.
ACKNO’WLEDGEMENTS
The research described in this report was carried out under funding from the
Precast/Prestressed Concrete Institute (PCI) under a 2003..2004 Daniel P. Jenny Research
Fellowship, which is thankfully acknowleged. The support and encouragement of Mr. Paul Johal,
as Director of PCI’s Research and Development, and Prof. Duglas Sutton (Purdue University), as
Chair of PCI’s Committee on Research and Development is greatly appreciated. Their support
and encouragement during unforeseen setbacks to this project was unwavering
Additional funding for this effort was provided by the Department of Civil and
Environmental Engineering at Michigan State University. The in-kind financial and technical
support from our industry partners Premarc Corporation (Grand Rapids, MI), Degussa
Admixtures Inc. (now BASF Admixtures, Cleveland, OH), and Stresscon Corporation (Colorado
Springs, Colorado) is also thankfully acknowledged.
The advisory panel for this project was composed of Prof. Mario Rodriguez (National
Autonomus University of Mexico), Mr. Stephen Seguirant (Concrete Technology Corporation,
Tacoma, WA) and Dr. Charles Nmai (BASF). Their helpful suggestions and encouragement is
greatly appreciated. Special thanks are due to Dr. Charles Nmai, Mr. Thomas Grumbine
(Premarc Corp.) and Mr. Donald Logan (Stresscon Corp.) for their multifaceted role in this
project as advisors, in-kind donors and personal advocates, through their persona! commitment
and time investment. Their honest and friendly disposition of help was invaluable and
instrumental to the success of this research.
The experimental work described in this report was carried out at MSU’s Civil
Infrastructure Laboratory. This work could have not been possible without the assistance of its
technical staff and student researchers, including: Siavosh Ravanbakhsh, James Brenton, Dana
Nuffer, David Bendert, and Andrew Pauly.
iv
Conclusions or recommendations in this report are the opinions of the authors. PCI assumes no responsibility for the interpretation or application of the information contained herein.
TABLE OF CONTENTS
CHAPTER 1
1.1
1.2
1.3
1.4
1.5
INTRODUCTION AND BACKGROUND ................................................!
Background and Problem Definition .............................................................................1
Organization of the Report ..............................................................................................5
CHAPTER 2 LITERATURE REVIEW .......................................................................... 6
2.1 SCC Material Technology ................................................................................................62.1.1 SCC Mix Behavior and Parameters ................................................................................72.1.2 SCC Fresh Property Evaluation and Quality Control: ..................................................102.1.3 SCC Hardened Properties .............................................................................................142.1.4 Structural Performance of Elements Constructed with SCC ........................................15
2.2 Importance of Bond in Prestressed Concrete ..............................................................192.2. ! Bond Stresses and Mechanisms ....................................................................................192.2.2 Transfer Bond Stresses (At release of prestress) ..........................................................202.2.3 Flexural Bond Stresses at Ultimate Strength ................................................................21
2.3 The Concept of Transfer and Development Length ....................................................242.3.1 Definitions .....................................................................................................................252.3.2 ACI-318 [3] / AASHTO- LRFD [2] Code Recormnendations .....................................26
2.4 Determination of Transfer and Development length of Prestressing Strand ............27
2.5 Studies on Transfer and Development Length .............................................................282.5.1 Outstanding issues ........................................................................................................34
2.6 Studies on Strand Bond Performance ...........................................................................35
2.7 Strand Bond Performance in SCC ................................................................................40
Conclusions or recommendations in this report are the opinions of the authors. PCI assumes no responsibility for the interpretation or application of the information contained herein.
3.23.2.13.2.23.~.~3.2.43.2.5
Effective Prestress (fse) .................................................................................................45fia,.ehorage Set Losses (AfpA) [7] .................................................................................46Losses due to Elastic Shortening of Concrete (AfpES) t7] ...........................................46Losses due to Concrete Shrinkage (AfpSR) [7] ............................................................47Losses due to Creep of Concrete (AfpCR) [7] ..............................................................47Losses due to Steel Relaxation (AfpR) [7] ....................................................................48
3.3 Draw-in Value (A~) ..........................................................................................................493.3.1 Transfer Length by Draw-in .........................................................................................49
3.4 Moment Capacity (Mn) and strand stress at Ultimate (fps) .........................................S0
4.3 Fresh Property Evaluation .............................................................................................604.3.1 Slump Spread and Visual Stability Index (VSI) ...........................................................604.3.2 J-Ring Test ....................................................................................................................624.3.3 L- Box Test ..................................................................................................................64
4.4 Challenges in SCC Quality Control and Quality Assurance ......................................65
4.5 Hardened Concrete Property Evaluation ....................................................................674.5.1 Compressive Strength (f’c) ............................................................................................674.5.2 Elastic Modulus Test .....................................................................................................714.5.3 Split Tensile Strength ....................................................................................................744.5.4 Discussion of Results - Hardened Test properties ........................................................77
CHAPTER 5 TEST PROGRAM- INTRODUCTION .................................................. 80
Conclusions or recommendations in this report are the opinions of the authors. PCI assumes no responsibility for the interpretation or application of the information contained herein.
CHAPTER 6 STRAND BOND PERFORMANCE EVALUATION ..............................93
6.3 Pull-out Block Test Details ............................................................................................94
6.4 Pull-out Test Procedure ...............................................................................................976.4. ! Variation in pull-out test procedures .............................................................................976.4.2 Pull-out test procedure ..................................................................................................98
6.5 Pull-out Test Results .....................................................................................................1006.5.1 Phase-1 Pull-out Results .............................................................................................1006.5.2 Phase-2 Pull-out Test Results .....................................................................................108
6.6 Discussion .......................................................................................................................1136.6.1 Effect of Strand Quality on Bond Performance ..........................................................1136.6.2 Effect of Mix Proportioning on Strand Bond Performance ........................................1146.6.3 Effect of Strand Surface Condition (NCC - Phase-1) ................................................120
6.6.3.1 Effect of Rust on First slip Pull-out Force: .........................................................1206.6.3.2 Effect of Rust on Peak Pull-out Force: ...............................................................1216.6.3.3 Effect of Rust -Comparison with Literature: ......................................................122
6.6.4 Strand Quality and Surface Condition corrected Pull-out forces ................................1226.6.5 Overall Effect of SCC on pull-out Forces ...................................................................126
6.7 Summary and Conclusions ...........................................................................................126
CHAPTER 7 TRANSFER LENGTH EVALUATION ............................................. 129
Concrete Strains Method .............................................................................................129Test Unit Preparation ..................................................................................................130Concrete Surface Strain Measurements ......................................................................131Construction of Surface Compressive Strain Profile ..................................................132Determination of Average Maximum Strain (AMS) ..................................................134Phase-1 Results - Concrete Strains Method ................................................................134Phase-2 Results - Concrete Strains Method ................................................................141Precision of Results from Concrete Surface Strains (DEMEC) measurements [23] .. 146
7.3 Strand Draw-In Method ..............................................................................................1477.3.1 Test Procedure ............................................................................................................1477.3.2 Determination of Draw-In Value and Transfer Length - Phase-1 ..............................1497.3.3 Determination of Draw-In Value and Transfer Length - Phase-2 ..............................154
7.4 Comparison of Experimentally Measured Transfer Lengths with ACI 318Recommendations .....................................................................................................................159
vii
Conclusions or recommendations in this report are the opinions of the authors. PCI assumes no responsibility for the interpretation or application of the information contained herein.
7.4.1 Comparison of Phase- 1 Results with ACI 318 Recommendations ............................160774.2 Comparison of Phase-2 Results with ACI 318 Recommendations ............................162
7.57.5.17.5.27.5.37.5.47.5.5
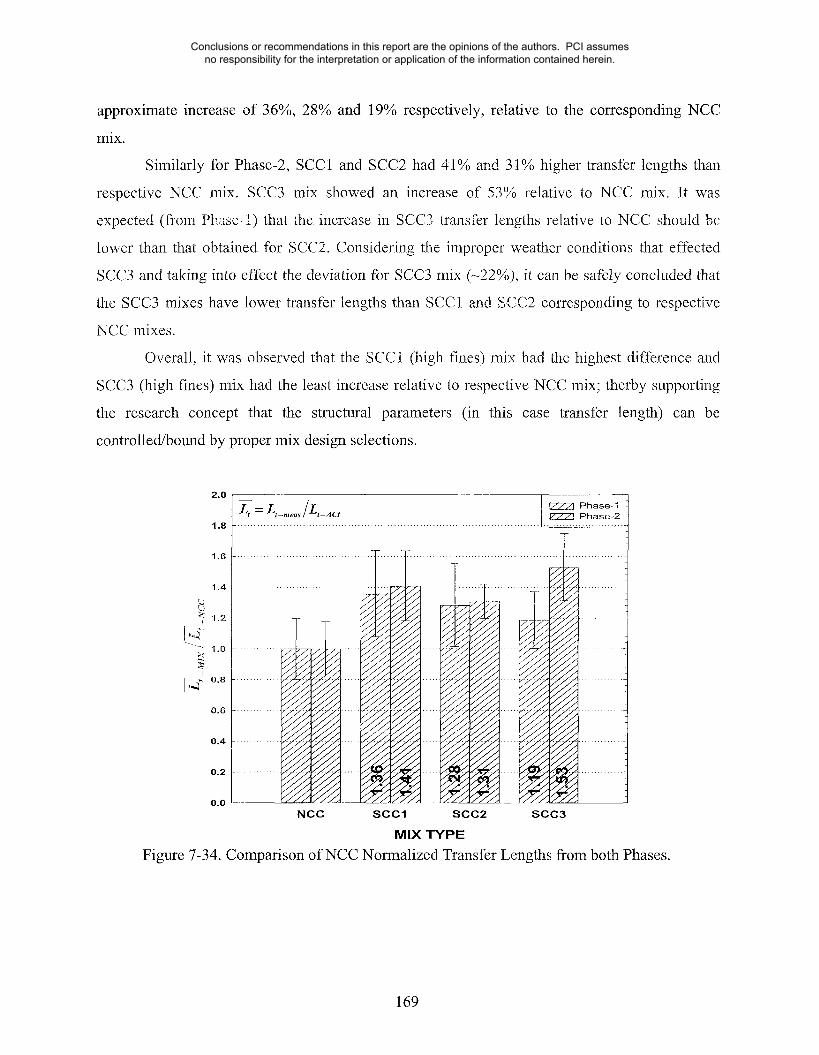
Discussion ...................................................................................................................164Effect of Strand Bond Quality on Transfer Length ....................................................164Effect of Mix Proportioning on Transfer Length ........................................................167Effect of Strand Surface Condition (NCC- Phase-1) on Transfer Length ..................170Strand Quality and Surface Condition corrected Transfer Lengths ............................171Overall Effect of SCC on Transfer Length .................................................................172
7°6 Summary and Conclusions .........................................................................................173
8.5 Development Length Results .......................................................................................191
8.6 Development Length Test Results as per ACI-318 Method [3] - Phase-1 ...............194
8.7 Development Length Test Results as per ACI-318 Method [3] - Phase-2 ...............197
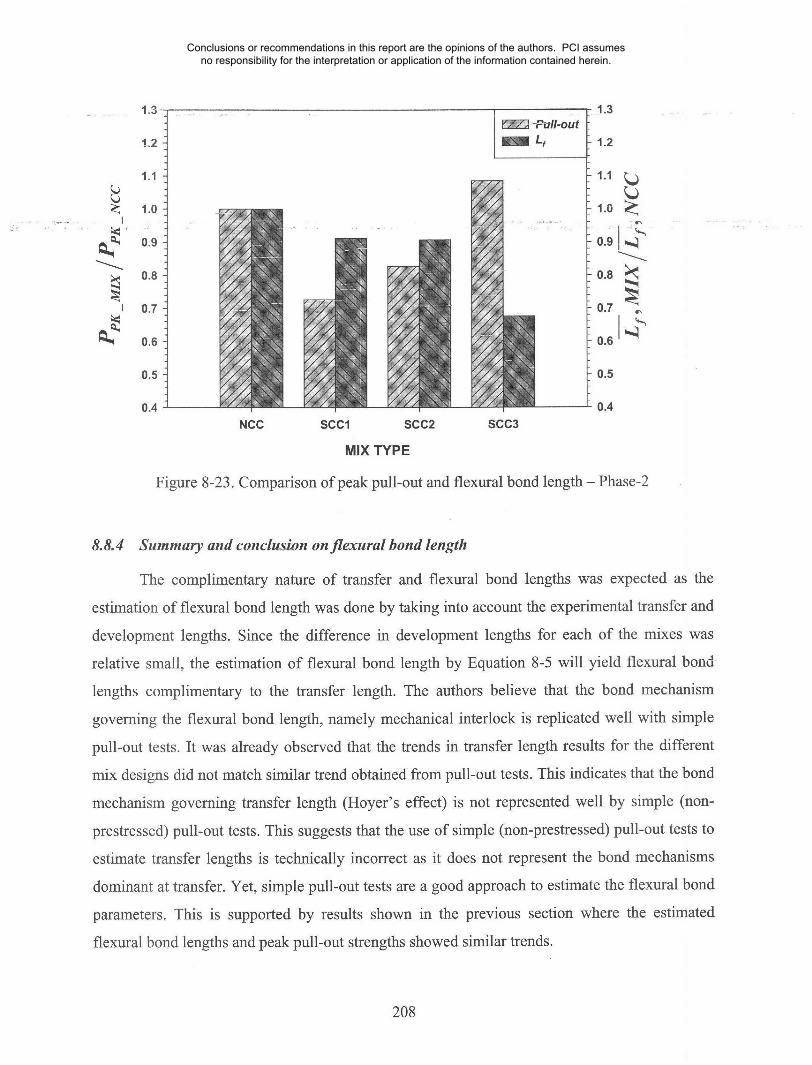
8.8 Flexural Bond length ....................................................................................................2008.8.1 Comparison of flexural bond lengths with ACI recommendations ............................2028.8.2 Effect of mix proportioning on flexural bond lengths ................................................2048.8.3 Comparison of flexural bond length and pull-out test data .........................................2078.8.4 Summary and conclusion on flexural bond length .....................................................208
8.98.9.18.9.28.9.38.9.48.9.5
Discussion on Development Length .............................................................................209Effect of Strand Bond Quality on Development Length ............................................209Effect of Mix Proportioning on Development Length ................................................211Effect of Strand Surface (rust of NCC- Phase-1) on Development Length ................213Strand Quality and Surface Condition corrected Development Lengths ....................214Overall Effect of SCC .................................................................................................216
8.10 Summary and Conclusions ...........................................................................................217
viii
Conclusions or recommendations in this report are the opinions of the authors. PCI assumes no responsibility for the interpretation or application of the information contained herein.
Conclusions or recommendations in this report are the opinions of the authors. PCI assumes no responsibility for the interpretation or application of the information contained herein.
-- LIST OF TABLES
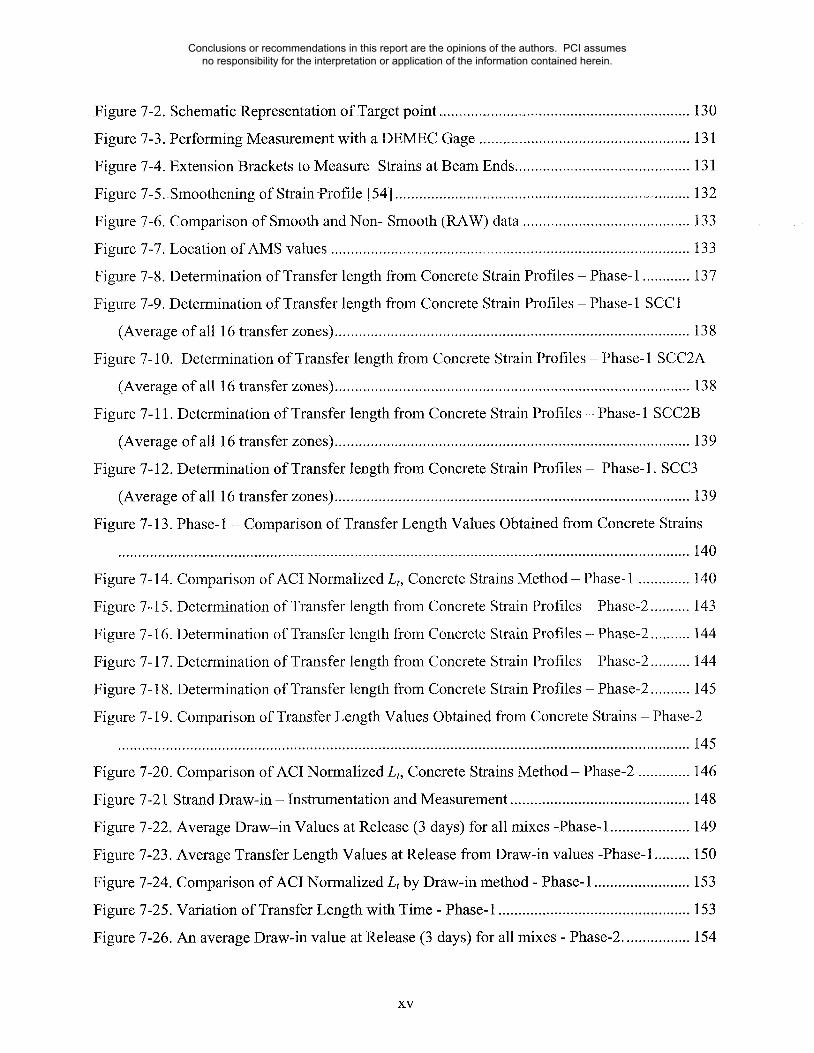
Table 4-1.
Table 4-2.
Table 4-3.
Table 4-4.
Table 4-5.
Table 4-6.
Table 4-7.
Table 4-8
Table
Table
Table
Table
Table
Table
Table
Table
Table
Table
Table
Table
Table
Table
Table
Table
Table
Table
Table
Table
Table
Table
Changes in Admixtures for Actual Project Mixes - Phase-1 .....................................
Changes in Admixtures t6r Actual Project Mix Designs - Phase-2 ..........................
Actual Project Mix Designs - Phase-1 .......................................................................
Actual Project Mix Designs - Phase-2 .......................................................................
Slump Spread and VSI rating of SCC mixes ..............................................................
and J - Ring Slump Spread and J-Ring Values - Phase- 1 .........................................
4-9 L- Box Blocking Ratio ................................................................................................
4-10. Compressive Strength
4-11. Compressive Strength
4-12. Compressive Strength
4-13. Elastic Modulus Tests
4-14. Elastic Modulus Tests
Mix Design Matrix - Binding of Performance by w/c ratio ........................................56
6-7. Pull-out Forces at First Slip - Phase-2 -Release (3 days) .........................................109
6-8 Average Maximum Bond Strengths from Peak Pull-out Forces - Phase-2 ...............110
6-9. Comparison of Phase-1 and Phase-2 Pull-out Strengths ...........................................114
6-10. Comparison of Relative Pull-out Strengths .............................................................115
6-11. Experimental pull-out strengths corrected for effects of strand quality and rust ....123
x
Conclusions or recommendations in this report are the opinions of the authors. PCI assumes no responsibility for the interpretation or application of the information contained herein.
Table 6-!2o Summary of Pull-out Test Results ...........................................................................128
Table 7-1. Average Transfer Length per Mix Type - Concrete Strains - Phase- 1 .....................136
Table 7-2. ACI -Normalized Transfer Length Ratios by Concrete Strain Method - Phase-1 ....137
Table 7-3. Average Transfer Length per Mix Type - Concrete Strains - Phase-2 .....................142
Table 7-4. ACI -Normalized Transfer Length Ratios by Concrete Strain Method - Phase-2 ....142
Table 7-5. Draw-in and Transfer Length Values a~t Various Concrete Ages (Phase-1) .............151
Table 7-6. ACI -Normalized Transfer Length Ratios by Draw-in method- Phase-1 ...............152
Table 7-7. Draw-in and Transfer Length Values at Various Concrete Ages - Phase-2 ..............156
Table 7-8. ACI -Normalized Transfer Length Ratios by Draw-in method - Phase-2 ................157
Table 7-9 Transfer Length values from ACI 318 / AASHTO equation - Phase-1 .....................159
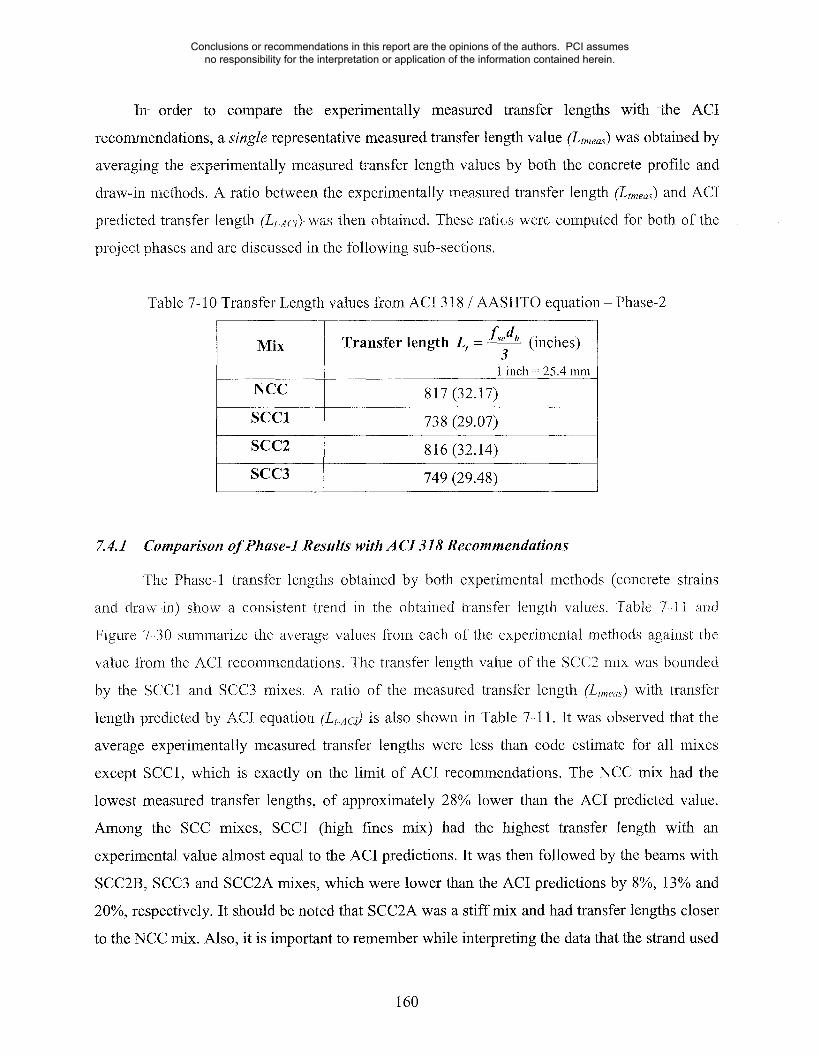
Table 7-10 Transfer Length values from ACI 318 / AASHTO equation - Phase-2 ...................160
Table 7-11. Summary of Average Transfer Lengths - Phase- 1 ..................................................161
Table 7-12. Summary of Transfer Lengths - Phase-2 .................................................................162
Table 7-13. Comparison of Measured Transfer Lengths, Phase- 1 vs. Phase-2 ..........................165
Table 7-14. Comparison of ACI Normalized Average Experimental Lt - Both Phases ............167
Table 7-15. Comparison of ACI Normalized Average Experimental Lt - Both Phases ............168
Table 7-16. Experimental transfer lengths corrected for effects of strand quality and rust ........171
Table 8-1 Test Configurations for Development Length Studies - Phase-1 ..............................180
Table 8-2 Test Configurations for Development Length Studies - Phase-2 ..............................181
Table 8-3 Development Length Test Results - Phase-1 .............................................................192
Table 8-4 Development Length Test Results - Phase-2 .............................................................193
Table 8-5. Representative Development Lengths and ACI Normalized Ratios - Phase-1 ........195
Table 8-6. Representative Development Lengths and ACI Normalized Ratios - Phase-2 ........198
Table 8-7. Estimate of flexural bond length ...............................................................................202
Table 8-8. Comparison of Phase-1 and Phase2 flexural bond lengths .......................................203
Table 8-9. Comparison of pull-out and flexural bond lengths ....................................................207
Table 8-10 Comparison of Experimental Development Lengths from both phases ...................210
Table 8-11 Effect of Mix Proportioning on Devlopment Length- Both Phases ........................212
Table 8-12. Experimental development lengths corrected for effects of strand quality and rust.
Conclusions or recommendations in this report are the opinions of the authors. PCI assumes no responsibility for the interpretation or application of the information contained herein.
Table B- 1. Maximum_(Peak) Pull, out Force _-- Phase-1 - Release (3 days) ..............................275_
Table B- 6. Pull-out Forces at First Slip - Phase-2 -Release (3 days) .......................................277
Table C- 1. Transfer Length from Concrete Strain Profiles - Phase-1 .......................................287
Table C- 2. Transfer Length from Concrete Strain Profiles - Phase-2 .......................................288
Conclusions or recommendations in this report are the opinions of the authors. PCI assumes no responsibility for the interpretation or application of the information contained herein.
Figure
Figure
Figure
Figure
Figure
Figure
Figure
Figure
Figure
Figure
Figure
Figure
Figure
Figure
Figure
Figure
Figure
Figure
Figure
Figure
Figure
Figure
Figure
Figure
Figure
Figure
Figure
Figure
Figure
Figure
LIST OF FIGURES
2-1
2-2
2-3
2-4
2-5
2-6.
2-7.
SCC Parameters and Behavior [29] ................................................................................9
Slump Spread Test and VSI ........................................................................................11
J-Ring Value [46] ........................................................................................................t2
Schematic of L- Box Test [46] ....................................................................................13
5-5. Results from LBPT performed by Logan according to [36] ......................................86
5-6. Formwork and Casting Layout ...................................................................................88
Xlll
Conclusions or recommendations in this report are the opinions of the authors. PCI assumes no responsibility for the interpretation or application of the information contained herein.
Figure
Figure
Figure
Figure
Figure
Figure
Figure
Figure
Figure
Figure
Figure
Figure
Figure
Figure
Figure
Figure
Figure
Figure
Figure
Figure
Figure
Figure
5_-7_Schematic .Layout of the casting bed ..........................................................................88
5-8. Strand Pretensioning with Post-Tensioning Jack .......................................................90
5-9. Release of Prestress - Both Beam Ends being Cut Simultaneously ..........................91
6-1 Pull-out~B!ock Geometry and Reinforcement Details ................................................95
6-2, Casting of a SCC Mix Pull-out Test Block ................................................................96
6-3. Overview of Typical Pull-out Test Setup ...................................................................96
6-4. Schematic of Pull Out Test Setup ..............................................................................98
6-5 Measurement of Displacements - Pull-Out Test ........................................................99
6-6. Typical Pull-out Test Responses - At Release - Phase-1 ........................................103
6-7. Typical Pull-out Test Responses - At 7 days - Phase- 1 ..........................................103
6-8. "Close-Up" of First slip occurrence - At Release - Phase- 1 ...................................104
6-9. "Close-Up" of First slip occurrence - At 7 days - Phase- 1 .....................................104
6-10. Comparison of Peak Pull-out forces - Phase- 1 ......................................................105
6-11.
6-12.
6-13.
6-14.
6-15.
6-16.
6-17.
6-18.
6-19.
Comparison of Pull-out forces at First Slip - Phase-1 ...........................................105
Comparison of NCC Normalized Relative Bond Strengths - Phase-1 ..................108
Typical Pull-out Test Response - At Release - Phase-2 .......................................111
"Close-Up" of First Slip Occurrence - At Release - Phase-2 ...............................111
Comparison of Pull-out Results - Phase-2 .............................................................112
Comparison of NCC Normalized Relative Bond Strengths - Phase-2 ..................112
Comparison of Peak Pull-out forces of Strands from both Phases ........................l 18
Comparison of First Slip Pull-out Forces of Strands from both Phases ................118
Comparison of NCC Normalized Relative Peak Bond Strengths - both Phases ....119
Figure 6-20. Comparison of NCC Normalized Relative First Slip Bond Strengths - both Phases
Figure 6-24. Effect of mix proportioning on first slip pull-out forces corrected for strand quality
and rust ..................................................................................................................................125
Figure 7-1. Actual Picture of the DEMEC Gage ........................................................................130
xiv
Conclusions or recommendations in this report are the opinions of the authors. PCI assumes no responsibility for the interpretation or application of the information contained herein.
Figure
Figure
Figure
Figure
Figure
Figure
Figure
7-2. Schematic Representation of Target point ................................................................130
7-3. Performing Measurement with a DEMEC Gage .....................................................131
7-4. Extension Brackets to Measure Strains at Beam Ends ............................................131
7-5._Smoothening of Strain Profile [54] ..........................................................................132
7-6. Comparison of Smooth and Non- Smooth (RAW) data ..........................................133
7-7. Location of AMS values ..........................................................................................133
7-8. Determination of Transfer length from Concrete Strain Profiles - Phase-1 ............137
Figure 7-9. Determination of Transfer length from Concrete Strain Profiles - Phase-1 SCC 1
(Average of all 16 transfer zones) .........................................................................................138
Figure 7-10. Determination of Transfer length from Concrete Strain Profiles - Phase-1 SCC2A
(Average of all 16 transfer zones) .........................................................................................138
Figure 7-11. Determination of Transfer length from Concrete Strain Profiles - Phase- 1 SCC2B
(Average of all 16 transfer zones) .........................................................................................139
Figure 7-12. Determination of Transfer length from Concrete Strain Profiles - Phase-1. SCC3
(Average of all 16 transfer zones) .........................................................................................139
Figure 7-13. Phase-1 - Comparison of Transfer Length Values Obtained from Concrete Strains
7-21 Strand Draw-in - Instrumentation and Measurement .............................................148
7-22. Average Draw-in Values at Release (3 days) for all mixes -Phase-1 ....................149
7-23.
7-24.
7-25.
7-26.
Average Transfer Length Values at Release from Draw-in values -Phase-1 .........150
Comparison of ACI Normalized L¢ by Draw-in method - Phase-1 ........................153
Variation of Transfer Length with Time - Phase- 1 ................................................153
An average Draw-in value at Release (3 days) for all mixes - Phase-2 .................154
xv
Conclusions or recommendations in this report are the opinions of the authors. PCI assumes no responsibility for the interpretation or application of the information contained herein.
Figure
Figure
Figure
Figure
Figure
Figure
Figure
Figure
Figure
7-27. Average. Transfer Length Values at Release from Draw-in values - Phase-2 ........155
7-28. Comparison of ACI Normalized Lt by Draw-in method - Phase-2 ........................158
7-29. Variation of Transfer Length with Time - Phase-2 ................................................!58
7-30 Comparison of Measured Transfer Length with ACI Equation -Phase-1 .............16 i
7-31 Comparison of Measured Transfer Length with ACI Equation - Phase-2 .............163
7-32.
7-33.
7-34.
7-35.
Comparison of Measured Transfer Lengths - Both Phases ....................................165
Comparison of ACI Normalized Experimental Lt - Both Phases ..........................166
Comparison of NCC Normalized Transfer Lengths from both Phases ..................169
Experimental transfer lengths corrected for strand quality and surface effects - both
Flexural Failure - Final Condition (Tension) .........................................................189
Test Response for a Typical Flexural Failure .........................................................!89
Test Response for a Typical Bond-Slip failure .......................................................191
8-15 Representative Development Lengths and ACI Normalized Ratios - Phase- 1 ......196
8-16. ACI Mn- Normalized Development Length Ratios - Phase-1 ...............................197
8-17 Representative Development Lengths and ACI Normalized Ratios - Phase-2 ......198
8-18.
8-19.
8-20.
8-21.
ACI Mn- Normalized Development Length Ratios - Phase-2 ...............................199
Comparison of estimated flexural bond lengths with ACI predictions ..................204
Comparison of flexural bond lengths with NCC mix - both phases ......................205
Effect of SCC mix proportioning on flexural bond length - both phases ..............206
xvi
Conclusions or recommendations in this report are the opinions of the authors. PCI assumes no responsibility for the interpretation or application of the information contained herein.
Figure 8-22. Comparison of peak pull-out and flexural bond length - Phase-1 .........................207 .........
Figure 8-23. Comparison of peak pull-out and flexural bond length - Phase-2 .........................208
Figure 8-24. Comparison of Experimental Development Lengths - Both Phases .....................210
Figure 8-25 Comparison of ACI Normalized Development Lengths - Both Phases .................211
Figure 8-26 Comparison of NCC Normalized Development Lengths - Both Phases ................213 ,
Figure 8-27. Experimental development lengths corrected for strand quality and rust effects -
both phases ............................................................................................................................215
Figure 8-28. Effect of mix proportioning on development lengths corrected for rust and strand
quality effects - both phases ..................................................................................................215
Figure
Figure
Figure
Figure
Figure
Figure
Figure
Figure
Figure
Figure
Figure
Figure
Figure
Figure
Figure
Figure
A-1
A-2
A-3
A-4
A-5
A-6
A-7
A-8
Elastic Modulus Test - Transfer - NCCB - Testl ..................................................236
Elastic Modulus Test - Transfer - NCCB - Test2 ..................................................236
Elastic Modulus Test - Transfer - SCC2B - Testl ................................................237
Elastic Modulus Test - Transfer - SCC2B - Test2 ................................................237
Elastic Modulus Test - Transfer - SCC2B - Test3 ................................................238
Elastic Modulus Test - Transfer - SCC3 - Testl ...................................................238
Elastic Modulus Test - Transfer - SCC3 - Test2 ...................................................239
Elastic Modulus Test - 28 Days - NCCB - Testl ..................................................239
A- 9 Elastic Modulus Test - 28 Days - NCCB - Test2 ..................................................240
A- 10 Elastic Modulus Test - 28 Days - SCC1 - Testl .................................................240
A- 11 Elastic Modulus Test - 28 Days - SCC1 - Test2 .................................................241
A- 12 Elastic Modulus Test - 28 Days - SCC2A - Testl ..............................................241
A-13
A- 14
A-15
A-16
Elastic Modulus Test - 28 Days - SCC2A - Test2 ..............................................242
Elastic Modulus Test - 28 Days - SCC2A - Test3 ..............................................242
Elastic Modulus Test - 28 Days - SCC3 - Testl .................................................243
Elastic Modulus Test - 28 Days - SCC3 - Test2 .................................................243
Conclusions or recommendations in this report are the opinions of the authors. PCI assumes no responsibility for the interpretation or application of the information contained herein.
Conclusions or recommendations in this report are the opinions of the authors. PCI assumes no responsibility for the interpretation or application of the information contained herein.
Conclusions or recommendations in this report are the opinions of the authors. PCI assumes no responsibility for the interpretation or application of the information contained herein.
Moment vs. Displacement- NCCB-PI-I-A - La =63.75 in ...................................290
Moment vs. Displacement- NCCB-PI-I-B - La =64.00 in ...................................290
Moment vs. Displacement- NCCB-P1-2-A - La =103.50 in .................................291
Moment vs. Displacement- NCCB-P1-2-B - La =93.50 in ...................................291
Moment vs. Displacement- SCC1-PI-I-B - La =72.38 in ...................................... 292
Moment vs. Displacement- SCC1-PI-I-B - L~ =137.75 in ....................................292
Moment vs. Displacement- SCC1-P1-2-A - L~ =122.00 in ..................................293
Moment vs. Displacement- SCC1-P1-2-B - Lc, =118.50 in ...................................293
Moment vs. Displacement- SCC2B-PI-I-A - L~ =70.50 in ..................................294
D- 10. Moment vs. Displacement- SCC2B-PI-I-B- L~ =102.75 in .............................294
D- 11. Moment vs. Displacement- SCC2B-P1-2-A- La =126.75 in ............................. 295
D- 12. Moment vs. Displacement- SCC2B-P1-2-B - L~ =124.50 in ..............................295
D- 13. Moment vs. Displacement- SCC3--PI-I-A-L~ =58.50 in ..................................296
D- 14. Moment vs. Displacement- SCC3-PI-I-B -L~ =97.75 in ..................................296
D- 15. Moment vs. Displacement- SCC3-P1-2-A - La =106.50 in ................................297
D- 16. Moment vs. Displacement- SCC3-P1-2-B - L~ =103.00 in .................................297
D- 17. Moment vs. Displacement- NCC-P2-1-A -L~ =67.00 in ....................................298
D- 18. Moment vs. Displacement- NCC-P2-1-B - L~ =60.00 in ....................................298
D- 19. Moment vs. Displacement- SCC1-P2-1-A - La =75.50 in ..................................299
D- 20. Moment vs. Displacement- SCC1-P2-1-B - L~ =68.00 in. ..............................299
xx
Conclusions or recommendations in this report are the opinions of the authors. PCI assumes no responsibility for the interpretation or application of the information contained herein.
Figure.D._21. Moment vs. Displacement-~SCC2-P2-1-A- La =66.00 in ..................................300
Figure D- 22. Moment vs. Displacement- SCC2-P2Zl-B - La =66.50 in ...................................300
Figure D- 23. Moment vs. Displacement- SCC3-P2-1-A - La =72.50 in ..................................301
Figure D- 24. Moment vs. Displacement- SCC3-P2-1-B - L~ =65.25 in ...................................301
xxi
Conclusions or recommendations in this report are the opinions of the authors. PCI assumes no responsibility for the interpretation or application of the information contained herein.
CHAPTER 1 iNTRODUCTION ANDBACKGROUND
1.1 Background and Problem Definition
First introduced in Japan in the early 1980s (Okamura, 1999), self-consolidating, or self-
compacting concrete (SCC) has been gaining increased attention due its unique behavior to fill
formwork and flow around obstructions without blocking or segregating. This behavior, obtained
by tailoring the selection of materials and mix proportioning has allowed it to be classified as a
kind of high-performance concrete, offering the possibility of designing for both the fresh and
hardened properties of concrete to specific project needs.
Much work has been done since the development of SCC, particularly in the development
of mix designs, characterization of its rheology and mechanical properties, and evaluation its in-
situ properties. The underlying principles governing the development of SCC-type behavior, i.e.,
a stable highly flowable concrete mix, are now generally well accepted and a great variety of
SCC mixes have been developed using differentmaterials and optimized for different purposes.
Compared to the progress made on the material characterization of SCC, very limited
information exists on construction and design specifications to guide industry, designers, and
highway transportation authorities. If this trend continues, it is likely that even the most
extensive and detailed material characterization efforts on SCC will not address the concerns of
the state DOT’s, whose ultimate interest lies on the structural performance and durability of the
built structure.
The underlying principles governing the development of SCC-type behavior, i.e., a stable
highly f!owable concrete mix, are now generally well accepted and a great vaxiety of SCC mixes
have been developed using different materials and optimized for different purposes (Khayat,
1999). However, the special mix designs that give SCC its unique fresh-property advantages
significantly deviate from what is currently considered as ideal and developed through many
years of experience and research. This has raised concerns regarding material and structural
performance issues. Among them are material properties such as creep and shrinkage; structural
issues such as prestress losses and bond; and durability issues such as freeze-thaw behavior.
These concerns have limited the acceptance of SCC in the United States, despite of its increased
use in Japan, Canada and Europe.
Conclusions or recommendations in this report are the opinions of the authors. PCI assumes no responsibility for the interpretation or application of the information contained herein.
Self-consolidating concrete (SCC) has become of high interest to the p~ecast concrete_
industry due to the benefits it offers in enhancing construction productivity. In spite of this
interest and rapid developments on SCC technology, its acceptance in the U.S. is lagging due to
material and structural performance concerns; among these is the issue of bond. The issue of
bond for prestressed concrete members has been debated from the past six decades. Considerable
work has been done regarding the development of a better understanding of bond and its
relationship with transfer and development length for conventionally consolidated concrete.
Consequently, several theories for transfer and development length have been formulated. In
spite of the multiple efforts, current provisions by the ACI Code (318) [3] and AASHTO [2] are
primarily based on the pioneering work of Hanson and Kaar [24]. However, in general, it has
been found that these guidelines underestimate the actual transfer and flexural bond lengths, and
their validity has been questioned for over 25 years [9][13][27][34][47][49][52][59]. Thus, large
deviations on results related to bond issues are still being debated even for conventional
concrete, which is well developed and understood. In such a scenario, with the absence of
specific design codes and guidelines for SCC, the study of bond in SCC has become inevitable.
1.2 Objectives
The tailoring of a concrete mix for specific fresh behavior on a construction project needs
grants SCC its quality as a high-performance material. However, this advantage can also limit
the development of all-inclusive guidelines. It is now generally agreed that SCC can be obtained
by two general approaches or the combination thereof: (a) mixtures with high fines content and
high-range-water-reducing admixtures, and (b) mixtures with high-range-water-reducing
admixtures and viscosity-modifying admixtures.
The current study thus focuses on bounding the parameters that allow the development of
SCC-type behavior and on investigating the bond performance of SCC in precast/pretensioned
bridge elements with the objective of providing guidance on the construction and design of these
elements when using self-consolidating concrete.
The specific aims will were:
¯ To investigate the material properties of three types of SCC mixes that bound current
mix design approaches through small-scale tests.
2
Conclusions or recommendations in this report are the opinions of the authors. PCI assumes no responsibility for the interpretation or application of the information contained herein.
¯ To experimentally-investigate the development and transfer lengths for ½"
prestressing strands in SCC through small, scale tests.
The constitutive hardened concrete properties including the compressive strength, split
tensile strength and modulus of elasticity were also evaluated at various ages of concrete. The
results from SCC mixes were compared with a reference normally consolidated concrete (NCC)
mix.
1.3 Self Compacting Concrete (SCC) Vs. Normally Consolidated Concrete (NCC)
The unique self-consolidation behavior of SCC and its tailorable nature to suit specific
project needs has allowed it to be classified as a kind of high-performance concrete. SCC offers
many advantages for the precast/prestressed industry, among them are:
a) It can be placed with no mechanical vibration, resulting in savings in placement costs.
b) Improved and more uniform architectural surface finish with little to no remedial surfacework
c) Ease of filling restricted sections and hard to reach areas
d) Opportunities to create structural and architectural shapes and finished not achievablewith conventional concrete.
e) Improved consolidation around reinforcement and bond with reinforcement.
f) Improved pumpability
g) Improved uniformity of in-place concrete by eliminating variable operator - related effortof consolidation,
h) Labor savings,
i) Shorter construction periods and resulting cost savings and
j) Quicker concrete turn-around times enabling the producer to service the project more
efficiently.
In order to completely utilize the advantages SCC offers, specifically to the
precast/prestressed industry, bond parameters need to be carefully evaluated. Considering the
3
Conclusions or recommendations in this report are the opinions of the authors. PCI assumes no responsibility for the interpretation or application of the information contained herein.
. :extensive mix designs of SCC available, the present work focused on bounding the effects .of
SCC mix.designs through carefully selected and boundary proportions.
1.4 Project Phases
Due to unplanned complications, the research project had two
follow from the type of pretensioning reinforcement used; hence the
Phases of this project were different (Chapter 5). Upon completion
project, it was observed that the obtained experimental development
much higher and pull-out strengths (Chapter 6) were much lower than
Phases. The two Phases
strands used for the two
of the first Phase of the
lengths (Chapter 9) were
expected. Based on these
results, the bond quality of the strand was questioned. To evaluate the quality of the strand used
in the first Phase of the project, strand samples were independently tested by Logan through the
large block pull-out tests (LBPT)[34]. Results showed that the strand used in the first Phase of
this research did not meet the recommended bond quality requirements with respect to the
criteria prescribed by LBPT [34]. Unfortunately, the LBPT evaluation by Mr.Logan came as an
afterthought to the research team upon noticing the low pull-out values (Chapter 6) and longer
development lengths (Chapter 9) observed in this research. The research team did not pursue this
qualification tests earlier as they had no reason to doubt the quality of the strand being used.
Hence, the second phase to this research project consisted of a partial repetition of the
experimental program with a pre-qualified strand. The projects second Phase allowed to have a
more reliable measure of SCC proportioning on strand bond performance while also providing
valuable information about the effect of strand quality on bond related parameters. Each of the
research Phases used a similar strand for all the mixes in that particular Phase, thereby a study on
the relative effect of SCC mix proportioning on structural parameters (in our case, "bond of
prestressing strand") was achieved. Theoretically, the effect of mix proportioning on structural
parameters must be the same for a particular type of strand. This was supported by the results of
the experimental program from both phases, thereby supporting the hypothesis of this research
that the effect of mix proportioning on structural performance (i.e. strand bond) can be bound by
extremes and reference mix designs.
It should be noted that the two Phases of experimental program were performed during
very different weather conditions. Only the prestressing strands were changed but similar mix
designs were used in both phases. However, Phase-1 casting was conducted during the summer
Conclusions or recommendations in this report are the opinions of the authors. PCI assumes no responsibility for the interpretation or application of the information contained herein.
while Phase-2 was cast during wintermonths. Thus, the Phase-2 concrete mixes were subjected
to extreme cold weather conditions that might have hampered the curing conditions of the testing
cylinders. As a result, the compressive strength-values at 28 days from the testing cylinders of
Phase-2 showed lower values than the target design value. Nevertheless, the research I~m does
not suspect-any significant effect on the transfer and development lengths because of these
slightly lower strengths of the Phase,2 mix designs. In addition, the target compressive strength
for the release of prestress was consistent in both phases and hence the transfer length values at
prestress release were unaffected by the relatively lower 28 day strengths of the Phase-2 mix
designs.
1.5 Organization of the Report
This report has been organized into 9 chapters. Chapter 2 includes a brief review on the
literature related to both SCC and bond issues. Definitions of important parameters related to this
project have also been included. Chapter 3 provides a brief introduction to the theory and
approaches behind the specific calculations used in this particular project. Chapter 4 documents
the mix designs used in the project as well as the studies made on their fresh and hardened
properties. Chapter 5 provides the test unit details, their fabrication and the details about the
strands used in both Phases of the project. Chapter 6 gives details about the strand pull-out
testing program. Transfer length measurement, methods and results are discussed in Chapter 7.
Development length testing, measurement and discussion of results are presented in Chapter 8.
Chapter 9 gives a brief summary of the entire project and provides the conclusions drawn from
this research. Detailed plots from each of these chapters are provided in the appendices at the end
of the report.
Conclusions or recommendations in this report are the opinions of the authors. PCI assumes no responsibility for the interpretation or application of the information contained herein.
CHAPTER 2 LITERATURE REVIEW
In order to gain a perspective on the development and use of self consolidating concrete
(SCC) and to understand the different issues related to bond performance of prestressing strands,
a literature review was carried out. This chapter provides a brief overview of pertinent work
related to this research. This chapter is subdivided into four sections: (1) SCC material
technology, (2) concept of transfer and development length, (3) studies on transfer and
development length of prestressing strands and (4) concluding remarks.
2.1 SCC MaterialTechnology
Self-consolidating concrete (SCC), or "vibration-free" concrete, was developed in Japan in
the 1980’s in response to the gradual reduction in the numbers of skilled workers required for
quality construction work [42]. The unique self-consolidation behavior of SCC has allowed it to
be classified as a kind of high-performance concrete [1][42]. The design of SCC involves
tailoring the selection of materials and mix proportioning to ensure high deformability and
adequate resistance to segregation, to achieve high filling capability and f!ow around
obstructions without blocking [29]. Such requirements require different opposing measures, such
as reduction in coarse aggregate volume and reduction of free water content to limit inter-particle
friction among coarse aggregate, sand and cement. Although there is no common definition for
SCC, a common understanding is that a self consolidating concrete is a one that:
a) has the fluidity that allows self-consolidation without external vibration,
b) remains homogeneous during and after placement, and
c) flows easily through reinforcement
Thus, the most important criteria that differentiates SCC from conventional concrete are those
that are related to the properties of fresh concrete. These requirements are [28]:
¯ Self-placing and self-consolidation
¯ Retention of deformability throughout transportation and placement
¯ High stability during transportation and placement
¯ Resistance to segregation, bleeding, and surface settlement (i.e., stability) after
casting
¯ Limited bleeding and settlement
6
Conclusions or recommendations in this report are the opinions of the authors. PCI assumes no responsibility for the interpretation or application of the information contained herein.
_. * Uniform surface quality
¯ Homogeneous distribution ofin-situ properties.
Achieving all of the above performance requirements is riot easy and requires a
compromise between the many parameters influencing the mixture proportioning [29]. In order
to understand SCC material technology, a review is presented in four different topics: (1) SCC
mix behavior and parameters (2) SCC fresh property evaluation and quality control, (3)
Hardened properties, and (4) structural performance. Each of these topics is discussed in a
specific sub-section in the following subsections:
2.1.1 SCC Mix Behavior and Parameters
In rheological terms, SCC is often described as a Bingham fluid (viscoelastic) where the
linear relation between the stress and the shear rate ratio is characterized by two constants -
viscosity and yield stress. The yield stress primarily governs the self-consolidation behavior,
while the viscosity affects the homogeneity (stability) and flowability [29]. While the viscosity
may be modified depending on the application (flowability requirements), the yield stress must
remain much lower than conventional concrete mixes in order to achieve self-consolidation [56].
It is clear that the flesh properties of SCC are particularly important for its ability to flow under
its own weight without segregation and to fill congested structural sections. Thus it is very
important to ensure the following three main parameters:
¯ Fluidity / Deformability
¯ Easy Flow / Low Blockage, and
¯ Homogeneity / Stability.
The above primary parameters need to be properly adjusted to satisfy all the requirements of
SCC. These three primary parameters can be adjusted (as shown in Figure 2-1 [29]) and achieved
by varying the mix proportions of SCC. Thus, the mix design factors that affect these three basic
parameters are as follows:
¯ Water to cement ratio (w/c)
¯ Amount of high-range-water-reducers (HRWR)
¯ Use of viscosity modifying admixtures (VMA)
7
Conclusions or recommendations in this report are the opinions of the authors. PCI assumes no responsibility for the interpretation or application of the information contained herein.
¯ Coarse aggregate content (CAC)
¯ Sand to paste content (S/Pt)
¯ Entrained air (EA).
Proper proportioning of these parameters is essential to achieve SCC and to obtain the
required primary parameters of deformability, passing ability and stability. The effects of the
various mix proportioning on the basic parameters of SCC are explained in detail below:
The deformability of concrete is closely dependei~t on the quantity of cement paste, which
can be increased with the use of high-range water reducers (HRWR) that allow lowering of the
yield value with only moderate drops in viscosity. Thus, highly flowable concrete can be
obtained without significant reduction in cohesiveness. Deformability can also be increased by
increasing the water to cement (w/c) ratio, which controls the deformability of the cement paste.
However, high w/c ratios reduce the cohesiveness of the paste and mortar and lead to fine and
coarse aggregate segregation. This means that care must be taken when lowering w/c ratios to
ensure that, it does not lead to large reductions in cohesiveness. Another factor affecting
deformability is the friction between the various solid particles (sand, gravel, cement, and
mineral additives). The inter-particle friction increases the internal resistance to flow thus
reducing the deformability and rate of flow of the concrete. This effect can be reduced with the
use of HRWR, which, by dispersing cement grains, enable water content reduction with limited
drops in viscosity. Reducing the coarse aggregate and sand volumes and increasing the paste
volume also enhances deformability. I_n_ addition, the use of continuously graded cementitious
materials and fillers can also help reduce inter-particle friction.
The second main parameter necessary for SCC properties is that this highly flowable
concrete has proper stability during transportation, placement, and after casting. As shown in
Figure 2-1 [29], enhanced stability requires reduction in coarse aggregate content and reduction
of the maximum aggregate size. Cohesion must also be improved by enhancing bond between
the mortar paste and the coarse aggregate. This can be achieved by reducing the w/c ratio and the
use of viscosity modifier admixtures (VMA). Stability must also be ensured after concrete
placement to avoid water migration (bleeding) that can lead to weak interface between the
aggregate and the cement paste, accumulation of cement paste in the bottom half of horizontal
reinforcement, and segregation of suspended solid particles. Decrease in bleeding can be
Conclusions or recommendations in this report are the opinions of the authors. PCI assumes no responsibility for the interpretation or application of the information contained herein.
achieved by reducing the w/c ratio, addition of HRWR, and the use of VMA and!or increased
volume of cementitious and filler materials (i.e., low w/c ratio) to bind some of the excess water
[29].
/A.Enlrance cotieSiveness
* low w/exatio* use of VMA
B.Compatible flow space andaggregate size* low coarse aggregate volume
The third essential property for a successful SCC mix is its ability to easily flow through
reinforcement or reduction of the risk of blockage when flowing through narrow spaces. Such
risk can be minimized by providing adequate viscosity, to ensure good suspension of the solid
particles during flow and reducing inter-particle friction. However, increase in viscosity reduces
deformability [29]. Thus, to allow SCC to easily flow through reinforcement it should have
appropriate cohesiveness by reducing the w/c ratio and/or using VMA. In addition, as the free
space between obstacles and reinforcement reduces, the coarse aggregate volume and the
maximum size aggregate should be reduced.
As discussed earlier, successful SCC mixes can be achieved by varying the three
parameters discussed above and hence no commonly accepted procedure to proportion SCC
9
Conclusions or recommendations in this report are the opinions of the authors. PCI assumes no responsibility for the interpretation or application of the information contained herein.
mixtures has been reached and several methods hav.e been developed in research centers around
the world [ 15] [ 16] [29] [57]. The mix designs selected for this project and the concept of choosing
the particular mix designs are presented in CHAPTER 4.
2.1.2 SCC Fresh Property Evaluation and Quality Control:
As stated above, various mix design methods for SCC have been proposed. However, it is
clear that the performance criteria to have a highly flowable and stable mix remain the same.
This indicates that qualiV~,~ control and acceptance criteria for SCC should be based on a
performance-based approach. Performance requirements for the hardened concrete are well
established for use of precast/prestressed bridge elements. However, the performance
requirements for the fresh SCC mix can only be evaluated at the time of placement.
Considerable work has been done around the world in developing and evaluating the self-
compactability of SCC, including deformability, stability, and filling capacity. The most
commonly used tests are [45] [46] [56]:
Concrete Rheometer. A device applies a range of shear rates and monitors the force needed
to maintain these shear rates in a plastic material; later converting the force into stress.
However, only a few concrete and mortar rheometers are available since this type of
equipment is very expensive and not easy to use in the job site. Thus, these devices have
been limited for use in large research centers.
Spread Test. The slump spread test also called as Slump flow test is used to asses the
horizontal free flow of SCC in absence of obstructions [46]. This procedure uses the
conventional Abram’s cone (Figure 2-2). The cone is filled in one layer without rodding and
the diameter, instead of the slump, of the concrete sample is measured after the cone is lifted.
The test evaluates self-comp~ctibility as it mainly relates to yield stress. An evaluation of
viscosity can be made by monitoring the time it takes for the concrete to reach a spread of 50
mm (2 in.). This test was performed in this study and the results are discussed in CHAPTER
10
Conclusions or recommendations in this report are the opinions of the authors. PCI assumes no responsibility for the interpretation or application of the information contained herein.
Figure 2-2 Slump Spread Test and VSI
J-Ring. This apparatus is used to force the SCC flow through reinforcement in conjunction
with an Abrams cone or the Orimet setup. The size and the spacing between the bars can be
adjusted to simulate any reinforcement configuration. A "J-Ring value" is obtained from the
differences between the spread with and without the ring or base height differences between
the concrete spread inside and outside the ring. The J-Ring value is calculated as follows
(Figure 2-3) [46]:
a) Measure the values dr (Figure 2-3) in the center of the J-Ring and also 4 values of
da and d~ just inside and outside the ring (measurements in mm)
b) Calculate hl=125-dl and all h values ho~=125-d~ (x=l to 4)
c) Calculate 4 values h¢-h~; calculate median value h~m-ham.
d) Calculate 4 values hax-hbx; calculate median value ham-hbm.
e) Calculate 2(ham-hbm)-(hlm-ham). This is J-Ring value.
11
Conclusions or recommendations in this report are the opinions of the authors. PCI assumes no responsibility for the interpretation or application of the information contained herein.
~2
_ 1"
I
hb2 .[ ha2 h1 ha4
D
hb4
Figure 2-3 J-Ring Value [46]
In general, greater J-ring spread flow results in greater passing ability. Satisfactory passing
ability without blockage is attained when the value 2(ham-hbm)-(hlm-ham) is less than 15mm
(0.59 in.). Generally acceptable pa~ssing ability is achieved when this value is around 10 mm
(0.39 in.). This test was performed in this study and the results are given in CHAPTER 4.
Visual Stabili _ty Index. This method involves the visual evaluation of the SCC patty resulting
from observation of the SCC just prior to placement and after the performance of the spread
(slump flow) test. It is used to evaluate the relative stability of batches of the same or similar
SCC mixes. The test requires the development of considerable judgment and may thus be
subjective. This test was performed in this study and the results are discussed in CHAPTER
12
Conclusions or recommendations in this report are the opinions of the authors. PCI assumes no responsibility for the interpretation or application of the information contained herein.
L-Box and U-Box. These tests simulate the _casting process by forcing an SCC sample to
flow through obstacles under static pressure. They provide and indication on the static and
dynamic segregation resistance of SCC as well as its ability to flow through reinforcement.
,ar 3 - #4 With Gap Of 1 3/8" (35) Between
Figure 2-4 Schematic of L- Box Test [46]
L-Box test (Figure 2-4) assesses the flow of SCC and also the extent to which it is subjected
to blocking by reinforcement [46]. The test apparatus comprises of a rectangular cavity in the
shape of "L" with reinforcement. The level of reinforcement can be changed to enforce
severe or light restraints depending on the actual reinforcement blocking of the structure.
This opening is controlled by a gate. The SCC is placed in the vertical cavity without any
vibration and held there for a minute. The gate is then opened for the SCC to flow into the
horizontal cavity. After the flow is complete the heights of SCC in the vertical chamber (H1)
and the horizontal chamber (H2) are measured. The ratio of H2/H1 is termed as the blocking
ratio. If the SCC flows as freely as water, at rest, it will be horizontal, so H2/HI=I. Thus, the
closer the blocking ratio is to unity, the better is the passing ability. The segregation of
13
Conclusions or recommendations in this report are the opinions of the authors. PCI assumes no responsibility for the interpretation or application of the information contained herein.
aggregates, if any can be easily noted in the vertical chamber. This test was performed in this
study and the results are discussed in CHAPTER 4.
¯ V-Funnel and Orimet. These tests measure the time it takes for the SCC concrete to flow
through an orifice under its own weight, these tests give an indication of its viscosity.
Sieve Stability_-. This test is used to evaluate the resistance of SCC to static segregation. It
consists of pouring a concrete sample over a 5-mm sieve and measuring the amount of
mortar passing through the sieve in a two-minute period.
The last two methods are not exclusive and while different research groups around the world
have evaluated these concepts, dimensions and measurement specifications have not been
standardized and/or commonly accepted [46].
2.I.3 SCC Hardened Properties
Since the target engineering properties of hardened SCC should be the same as those for
conventional concrete, the same test and procedures that are used for conventional concrete are
used for SCC. As previously mentioned, most of the research work to-date on SCC has been
focused on three fronts: (1) development of self-compacting mix designs[15][16][41][51] [57],
(2) comparison of mechanical properties of SCC against well compacted regular concrete [1]
[20][43], and (3) evaluation of in- situ properties of SCC in full~scale structural elements
[30][58]. In spite of the significant scatter of reported data, due to the wide variety of materials
and admixtures used in manufacturing SCC, the above-mentioned efforts have shown (a) the
feasibility of mix designs with self-compacting behavior and the development of simple and
optimized combinations and (b) that, overall, the uniformity and value of the mechanical
properties of SCC do not vary significantly from that of normal well-compacted concrete
[5][20][51]. The only negative parameter that emerges from on hardened material properties is
that SCC seems to have, in general, a lower elastic modulus. SCC has also been found to exhibit
higher early age creep coefficients [43] and not much has been reported on fracture strength.
These observations at the material level are consistent with the results on structural testing on
SCC elements over the past five years as reported in the next section.
14
Conclusions or recommendations in this report are the opinions of the authors. PCI assumes no responsibility for the interpretation or application of the information contained herein.
2.1.4 Structural Performance of Eleme~nts Constructed with SCC
In spite of the above-mentioned research developments on mix proportioning and
material properties, much less is known on the performance of structural elements caste using
SCCo While similar performance might be expected based on the similitude of mechanical
properties be~veen SCC: and normal concrete, the studies performed thus far have mainly
focused on compressive strength, elastic modulus, and to a lesser extent on creep and shrinkage
[43]. These statements were very tree at the beginning of this research work. However, much
work has been done since in evaluating the structural performance of elements constructed with
SCC. Nonetheless, in spite of the increased information recently gained on the structural
behavior of SCC elements, the data is scattered and a thorough understanding of the
compromises, if any, made with using this new form of high performance concrete is still
lacking. An overview of representative work on structural performance follows.
Khayat et al. [30] [31] (University of Sherbrooke, Canada) evaluated the uniformity of in-
situ mechanical properties of wall elements using eight different mixes of SCC. Cores were
obtained at various heights of the wall and normal hardened properties like compressive strength
and elastic modulus were evaluated. Results from this study show very slight or no variation in
the compressive strength and modulus of elasticity values obtained from the top and bottom
portions of the ~vall.
Khayat et al. [30][31] also compared the mechanical performance of highly confined
columns cast using normally consolidated concrete (NCC) and self compacting concrete (SCC)
with stirrup configurations representing different degrees of confinement. The cores were cut at
various heights of the column. Results from these cores were compared with those of normally
cast specimens. The test results showed that the SCC columns developed similar stiffness but
approximately 7% lower load carrying capacity. Also the SCC showed 10% lower cylinder
compressive strength relative to NCC. Depending on the reinforcement configuration SCC
columns exhibited 62% to 23% more ductility than corresponding NCC columns. The
distribution of in-place properties was found to be more homogeneous in SCC than in NCC.
As previously mentioned, the nature of SCC proportioning is to deviate from well-
understood mix designs developed over many years of experience. This implies that
compromises must be made with respect to performance. Highly fluid mixes, or high-rate
discharge, can compromise the stability of the concrete mix, which can lead to bleeding and
15
Conclusions or recommendations in this report are the opinions of the authors. PCI assumes no responsibility for the interpretation or application of the information contained herein.
o . segregation around reinforcement that can adversely affect the bond characteristics of
conventional and prestressed reinforcement such as transfer and development length. Issues
related to the bond of prestressing strand are discussed in detail in Section 2.7 and only issues
reltated to bond on passive deformed reinforcement bars are discussed in this section.
Among the several studies on the evaluation of bond between deformed steel
reinforcement and SCC, we cite the work of De Almeida Filho et al. [ 18] (Sao Carlos School of
Engineering, Brazil). Two SCC and two normal concrete (NC) mixes with design strengths of 30
MPa and 60 MPa were studied. Ribbed bars with diameters of 10 mm and 16 mm were used.
Bond performance was evaluated using simple pull-out tests and beam tests. The pull-out test
cylinders had diameters of 100 rnm and 160 mm for 10 mm and 16 m diameter bars,
respectively. The beam tests consisted on two rectangular blocks joined together on the top with
a steel hinge. The test consisted on bending the beam so as to pull-out the bar in tension. Overall
the pull-out behavior on the SCC and NC mixes was reported to be similar, and in some cases
SCC performed better. The authors concluded that the bond properties of deformed bars in SCC
were similar to those in normal concrete.
Clearly, one of the main design objectives of a structural element is its flexural strength.
Naito et al. [40] (Lehigh University, Bethlehem, USA) studied the performance of large scale
bulb-tee girders made with SCC. Four 10 m (35 ft.) long bulb-tee girders were produced. Two
girders were made using a single SCC mixture and other two girders were made with
conventional early high strength concrete. The girders were tested to flexural failure (one test per
beam end) and their performance was compared. The large scale testing revealed that test units
from SCC and conventional concrete exceed the nominal strengths for all conventional girder
failure modes. The girders were reported to achieve 101% to 104% of predicted moment
capacities and from 106% to 107% of the predicted shear capacities. Strar~d end-slip was
observed in all specimens. The progression of damage during large scale testing was found to be
similar for the SCC and conventional concrete test units. The SCC beams were found to have
higher ductility, which was consistent with material tests that indicted a lower elastic modulus
for SCC. The overall performance of the specific SCC mix used in this research outperformed
the existing industry recommendations. The authors note that the conclusions drawn from this
work are limited to a specific SCC mix and that independent investigations are essential for other
SCC mix designs. The bond performance of strand through pull-out tests and the measurements
16
Conclusions or recommendations in this report are the opinions of the authors. PCI assumes no responsibility for the interpretation or application of the information contained herein.
o5 transfer lengths were also. evaluated as part of this study. These results are discussed in the .........
Section 2.7 related to strand bond performance in SCC.
The promising performance of SCC in research projects as well as in private projects,
such as parking structures, has motivated State Departments of Transportation to assess SCC for
use in highway bridges. Burguefio and Bendert [10] report on a demonstration bridge project in
Michigan that allowed the state’s Department of Transportation to evaluate the short- and long-
term structural performance of self-consolidating-concrete (SCC) in bridge beams. The M-
50/US-127 Bridge over the Grand River (Jackson, MI) features SCC prestressed box beams in 3
of its 6 beams. Three SCC mixture proportions were being evaluated against a reference
normally consolidated concrete mixture (NCC). Before implementation, performance of the SCC
beams was evaluated through full-scale flexure and shear testing to ensure similar performance
to the NCC beams. Flexural tests showed that the overall behavior of the SCC beams was very
similar to that of the conventional beam (NCC) and that the absolute capacities of the SCC
beams were only marginally lower. The flexural capacities of all three SCC beams exceeded the
required design capacity by 6 to 9 percent. The shear behavior and capacities of the SCC beams
were also found to be adequate and very similar to that of the NCC beam. Damage patterns were
consistent in all beams and the failure levels closely matched analytical predictions. The shear
capacity of SCC beams was 8 to 22 percent higher than the calculated nominal design shear
value. With this validation, the detnonstration bridge with its SCC beams was completed in
October 2005. A strain and temperature continuous monitoring system was placed on the SCC
beams and one NCC beam to evaluate long-term performance. Collected data since December
2005 indicates that the field performance of the SCC beams is similar to the NCC beams.
A potential adverse effect of SCC on structural performance is that related to the ability
to transfer shear stresses across cracks, or the so-called "aggregate interlock." This follows from
the potential deviations on aggregate ratios used to enhance fluidity compared to those used in
normally consolidated concrete. Thus, it has been foreseen that bond and aggregate interlock are
two types of hardened behavioral mechanisms that could affect the design and performance of
precast/prestressed bridge elements using SCC. This has brought about interest on the
performance of SCC elements in shear. The effort by Burguefio and Bendert was described
above. Other relevant research on evaluating the shear performance of elements built using SCC
follows.
17
Conclusions or recommendations in this report are the opinions of the authors. PCI assumes no responsibility for the interpretation or application of the information contained herein.
Choulli et al. [12] (Politecnic University of Catalunya, Spain) studied the shear behavior
of full-scale prestressed I-beams made with high strength_ SCC and normal concrete (NC) with
compressive strengths around 90 MPa. Concrete type (SCC or NC), the existence of shear
reinforcement, the amount of horizontal web reinforcement and level of prestress were studied.
Twelve beam.s were tested. Results showed the. SCC beams had lower shear capacity than the NC
beams. However, the overall ultimate shear capacity was higher than theoretical predictions. The
reduction of shear capacities in SCC relative to normal concrete was found to be approximately
12%-18%. The initial linear stiffness of beams with SCC was similar to that of NC, but after
cracking the stiffness of SCC was lower than that of NC. High strength SCC beams showed
smaller crack widths than NC. The contribution of longitudinal web reinforcement was found to
be about 5.3% of ultimate shear load. Finally, all codes were found to be theoretically
conservative in estimating ultimate shear capacities.
Hassan et al. [25] (Ryerson University, Canada) studied the shear strength and cracking
behavior of full-scale beams made with SCC and conventional normal concrete. The
performance of these units was compared with American (ACI-3 i 8) and Canadian codes (CSA-
CAN3). Twenty flexure-reinforced beams with no shear reinforcement were tested in flexure
until shear failure. The testing program studied the effect of concrete type, aggregate content,
beam depth, and longitudinal steel reinforcing ratio. Performance was analyzed based on the
ultimate shear resistance, failure modes, crack patterns, crack widths and loads at first
flexure/diagonal cracking. The test units made of SCC were found to have similar shear
resistance characteristic as normal concrete at pre-cracking stage. Also, no significant difference
in the overall performance including crack widths, angles or failure modes were observed
between the SCC and normal concrete beams. Overa!!, the SCC beams were found to have a
lower ultimate shear load compared to the normal concrete test units. The lower shear strength of
SCC was attributed to lower aggregate interlock in SCC mixes due to the lower coarse aggregate
content relative to normal concrete. CSA based equations were found to be conservative for all
mixes. Finally, ACI based equations were found to be conservative only for normal concrete test
units with 2% longitudinal reinforcement and were found to be un-conservative for deeper NCC
beams and all SCC beams irrespective of percentage of longitudinal reinforcement.
This brief literature review on the structural performance of SCC elements indicates broad
activity in evaluating the influence of SCC on structural performance. It can be seen as a good
18
Conclusions or recommendations in this report are the opinions of the authors. PCI assumes no responsibility for the interpretation or application of the information contained herein.
sign that the overa!l observations and conclusions from these studies are consistent. Ho~vever,
there is scatter in the available published data, indicative of the diversi~ of SCC mix designs.
Thus, the conclusions from works that considered only a single SCC mix should be taken with
caution as they cannot be generalized to appb, to all SCC mix designs but rather they only apply
to the s~g.le SCC mix evaluated in that research project. This is a basic flaw in the approach
most commonly taken in conducting research on the structural performance of SCC elements.
This supports, by contrast, the approach taken to this research where no attempt was made to
perform studies on a single SCC mix but rather to bound the effects of SCC mix proportioning
on bond parameters.
2.2 Importance of Bond in Prestressed Concrete
The importance of bond between prestressing steel and concrete has been studied
considerably during the development of prestressed concrete [33]. The concept behind
prestressing and reinforced concrete clearly relies on the ability to transfer tensile forces from the
strands into the hardened concrete both during service as well as at ultimate response. This
parameter (bond) thus forms part of the design considerations of precast/prestressed members
through semi-empirical formulations of transfer and development length to properly account
prestressing effects and to ensure proper anchorage of the prestressing strand when relying only
on the interaction between the strand and the surrounding concrete. Thus, the behavioral
mechanism and importance of bond, both at transfer and at ultimate should be understood if a
suitable measure of this parameter (bond) is to be performed.
2.2.1 Bond Stresses and Mechanisms
The transfer of stresses from the strand to the concrete by bond can be classified into
three distinct mechanisms: (1) adhesion, (2) Poisson’~ (Hoyer’s) effect, and (3) mechanical
interlock. Much debate still exists on the nature and mechanisms behind the bond behavior of
prestressing strand in concrete. Each of these mechanisms is explained briefly in the following:
1. Adhesion: This refers to the chemical bond resisting mechanism by which the concrete
bonds to the strands. Adhesion helps in the bond transfer only when there is no relative
slip of the strand with concrete. This mechanism is relatively small and hence often
neglected [23].
19
Conclusions or recommendations in this report are the opinions of the authors. PCI assumes no responsibility for the interpretation or application of the information contained herein.
2. HoFer’s Effect: When the strand is prestressed there is a lateral contraction in the strand
diameter due to the steel’s Poisson’s ratio, x,Vhen the strand is released, this lateral
contraction is recovered and the strand swells. This swelling is prevented by the
surrounding hardened concrete, preventing the strand to return to its original diameter.
This restraint is in the form o.f a radial normal force on the strand inducing frictional force
along the axis of the strand (Figure 2-5). At the end of the beam, where the surrounding
concrete does not exist, the strand is free to expand, and hence the strand at the end has a
relatively larger diameter than the portion embedded in concrete. This produces a wedge
action. This anchorage mechanism was first described by Hoyer in 1939 [54:] and thus is
commonly referred to as Hoyer’s effect. The concrete resists this wedging effect
transferring part of the stress from the strand to concrete.
3. Mechanical Interlock: Due to the match casting between the concrete and strand, the
concrete resists the unwinding of the strand providing slip resistance. Mechanical
interlock is the main contributor to bond when the stresses are increased beyond the
initial transfer stresses [54].
O’z=O
Figure 2-5 Hoyer’s Effect [50]
2.2.2 Transfer Bond Stresses (At release of prestress)
A schematic showing the approximate distribution of the bond stress ~" at transfer due to
all of the mechanisms cited above is shown in Figure 2-6 [33], where "r becomes zero, the stress
in the strand becomes equal to the stress due to prestressing (~ = constant). The length
20
Conclusions or recommendations in this report are the opinions of the authors. PCI assumes no responsibility for the interpretation or application of the information contained herein.
associated with this is termed the bond length, u. This length will depend on the quality of the
bond and on the transverse pressure provided by the member geometry and transverse
reinforcement. The prestressing force is introduced into the member until the concrete stresses
exhibit a linear distribution over the section [33]: The distance along the length of the member,
.after which strain compatibility between the strand and concrete is achieved,-~and the stresses in
the strand become a constant is referred to as the transfer length, Lt. Of all of the above-
mentioned mechanisms, the Hoyer effect is the greatest contributing mechanism to "bond" upon
prestress release [50][54].
Slopedepending on max
Average
I
I Transmission lengtN
SteelStress
concretestress
Figure 2-6. Bond Stress Distribution at Strand End [33]
2.2.3 Flexural Bond Stresses at Ultimate Strength
The importance of bond on ultimate strength is better understood by considering the
failure behavior with and without bond. Upon first cracking, there will be a sudden increase of
tensile stress in the strand. Without bond, this increase will extend over the entire length of the
tendon, leading to considerable deformations and wide crack spacing. New flexural cracks will
be widely spaced, which will tend to decrease the depth of the compression zone and eventually
lead to early failure of the compression flange. Thus, in the absence of bond the ultimate capacity
is reduced and the strength of the steel strand cannot be fully utilized.
Early failure is thus avoided by establishing a shear-resisting mechanism, i.e., bond,
between the steel and the concrete (see Figure 2-7). The bond stresses between the tendon and
the surrounding concrete, z’l, have the effect of immediately reducing the increased stress that
21
Conclusions or recommendations in this report are the opinions of the authors. PCI assumes no responsibility for the interpretation or application of the information contained herein.
develops in the steel at the crack location a short distance next to it [33]._Depending on the bond
quality, the increased steel stress o-z is limited to a short length, which leads to only slight local
elongation of the stran_d and narrow crack spacing.
bond stress
concrete tensile stress
steel stress
Figure 2-7. Stress Distributions at a Crack Front [33]
The presence of bond will permit the tensile concrete stresses o-bz to continue_ to exist
besides the crack location, which can increase further upon further loading (see Figure 2-7).
This will lead t-o closely spaced cracks and a failure pattern with a large number of cracks that
slowly grow upwards. The neutral axis depth is thus slowly reduced, allowing development of
large steel stresses. Consequently, bond allows for a safe failure mode and better use of the steel
reinforcement [33].
At flexural cracks the bond stress beside it will locally increase up to the bond strength as
shown in Figure 2-7 and Figure 2-8 [33]. Beyond this peak, the bond stress quickly decreases
and in some cases it even changes into a stress of opposite sign. If there are a number of cracks
in succession, the distribution of bond stresses follows a "saw-tooth" pattern [33]. Although not
22
Conclusions or recommendations in this report are the opinions of the authors. PCI assumes no responsibility for the interpretation or application of the information contained herein.
..... described in this manner, this same phenomer~on was identified by Hanson and Kaar [24] as a
"bond stress wave."
The development of new flexural cracks towards the end of the member wil! continue
with increasing load demands due to load ~:edistribution. As seen in Figure 2-8, the bond stress
demands will follow along with localized high steel stress demands at the crack [33]. Increased
tensile stresses in the strand will cause a reduction of cross sectional area due to Poisson’s effect.
Thus, if cracking extends into the transfer zone region, the reduced cross-section tendon area will
compromise the Hoyer effect. Relative slip of the strand can then occur leading to a reduction in
prestressing force and thus limiting the attainment of the section full flexural capacity, in
addition, the reduced compression stress state at the beam end will decrease the section shear
capacity. Bond failures and shear failures at end supports are thus clearly related, an issue that
has been identified for some time but yet continues to be topic of debate as to the precedence of
each effect [9][49][52].
I
midspan
restrained attransfer zone
cracks
6ondstresses
fps
Figure 2-8. Bond Stresses at Flexural Cracks [50]
23
Conclusions or recommendations in this report are the opinions of the authors. PCI assumes no responsibility for the interpretation or application of the information contained herein.
2.3 The Concept of Transfer and Development Length
Bond is of importance to the design of prestressed members for both initial, or se~Ace, as
well as ultimate, or overload conditions. The bond strength between prestressing strands and
concrete depends on the concrete’s ability to transfer shear forces along the material interface.
The distance lover which the effective prestress f.~ is developed in the strand has been
traditionally called the transfer length, Lt. An additional bond length is required so that the stress
fp, may be developed in the strand at ultimate flexural strength of the member. This additional
length is termed hhe flexural bond length, L~ The sum of these two lengths is commonly referred
to as the development length, Ld, of the strand (Figure 2-9).
Development Length
TransferJ, Flexural Bond_~_~
Distance from the free end
Figure 2-9 Variation of stresses - ACI-318 equation representation [2][3].
Considerable work has been done regarding the development of a better understanding of
bond and its relationship with transfer and development length for conventionally consolidated
concrete. Consequently, several theories for transfer and development length have been
24,
Conclusions or recommendations in this report are the opinions of the authors. PCI assumes no responsibility for the interpretation or application of the information contained herein.
formulated [9][14][19][38][39][50]. In spite of the multiple efforts, current provisions by the
ACI-318 Code (318-08) [3] and AASHTO [2] (see Figure 2-9) are primarily based on the work
of Hanson and Kaar [24]. However, in general, it has been-found that these guidelines
underestimate the actual transfer and flexural bond lengths, and their validity has been
questioned for over 25 years [9][13][27][34][47][48][49][52][59]. In this time, several
approaches have been developed. In the following, a brief account of some of these efforts is
given and then the approach considered for this study is described in detail.
Although strand development seldom governs the design of prestressed concrete
members, with the exception of cantilevers and short span members, several bond-related
failures have been reported with members using conventionally consolidated concrete and the
current criteria [9]. In addition, the relationship between development length and shear failures at
beam supports has been clearly documented [50] and has become a recent concern, particularly
as it relates to the response of prestressed beams due to earthquake-induced vertical loading. It is
then clear that the issues related to bond between hardened SCC and prestressing strand will be
reflected in design practice through these parameters
2.3.1 Definitions
Some of the basic definitions that describe the behavior of bond in the prestressing strand
are described below:
Transfer Length (Lt):
Transfer length is defined as the bonded length of the strand required to fully transfer the
effective prestress ~e) from the strand to concrete. In other words, transfer length is the length
from the end of the beam to the point where the prestressing force is fully effective [50].
Flexural Bond Length (Lf):
Flexural bond length is defined as the distance, in addition to the transfer length over
which the tendon must be bonded to the concrete to develop the full design strength of the
tendons (fps) to resist flexural stresses at nominal resistance of the member.
Development Length (Ld):
Development length is defined as the total length of bond required to develop the steel
stress fps at the ultimate strength of the member. Development length is the sum of the transfer
and flexural bond lengths. In other words, Development length can be defined as the shortest
25
Conclusions or recommendations in this report are the opinions of the authors. PCI assumes no responsibility for the interpretation or application of the information contained herein.
bonded length ~.of tendon along which.the tendon stress can increase from zero to the_ stress
reqnired for achievement of the full nominal strength at the section under consideration.
where, db is the diameter of the strand andf~e andfp~, are the effective and nominal stresses in the
tendon respectively.
The first term of the Equation 2-2 represents the transfer length and the second term
represents the flexural bond length. In Figure 2-9, the steel stress is shown to vary, linearly along
the transfer length. Along the flexural bond length, the slope of this curve decreases. AASHTO-
LRFD specifications state that the flexural bond may be assumed to vary parabolically [3][8].
The shear provisions of each code (ACI 318 and AASHTO) assume a transfer length of 50 times
the diameter of the strand [23][54]. Some of the other proposed equations and models for
estimation of transfer and development length are given in the following section.
The validity of the current guidelines has been questioned for over 25 years
[9] [ 13] [27] [34] [47] [48] [49] [52] [59]. In many cases, the pretensioned strand can be developed in
shorter distances than that required by the code. On the other hand, many designs using current
provisions may be unsafe as the current code provisions do not reflect the actual beam behavior
[50]. The code equation for development length (Eq. 2-1 & 2-2) is based on the results of the
26
Conclusions or recommendations in this report are the opinions of the authors. PCI assumes no responsibility for the interpretation or application of the information contained herein.
pioneeri-ng work by Hanson and Kaar [24]. The pr.etensioning strand used in the. work of Hanson
and Kaar was a stress relieved strand with a specific tensile strength of 1723 MPa (250 ksi). In
current practice, tow relaxation strands with bSgher yield strengths such as 1860 MPa (270 ksi)
are used. These changes allow higher effective stresses and !arger diameters of strands than those
tested by Hanson and Kaar has raised many questions on the validity of the equations [9].
The current code provisions also do not incorporate the concrete strength in the equations
for transfer and development length. The increased use of high strength concrete mixes, which
differ significantly from those used by Hanson and Kaar, introduces more concerns to the code-
recommended equations. As discussed later in this chapter, Zia and Mostafa [59] proposed
equations that incorporate the concrete strength in the equation for development length. It should
be noted that the above mentioned concerns for bond and validity of code-recommended
equations are discussed with respect to conventional concrete which is considered to be
relatively well understood. The use of SCC mix which incorporates relatively large amount
admixtures will thus require a detailed evaluation of bond related parametes to better understand
the behavior of structural units made from SCC.
2.4 Determination of Transfer and Development length of Prestressing Strand.
The previous discussions have presented the mechanisms and the importance of bond
between prestressing strands and concrete for the design and performance of prestressed concrete
beams. Determining the bond strength, or slip resistance, is however, not a straightforward task.
The reason is that the "bond" phenomena that have been described for both transfer and ultimate
strength rely on different mechanisms to transfer the shear stresses between concrete and strand.
It was explained how the bond shear stresses follow complex distributions at the member ends
and at flexural cracks. Thus, appropriate determination of bond strength must replicate actual
conditions as close as possible.
It has been found that bond mechanisms are affected by many parameters [59]. Among
them are:
¯
¯
¯
The type of steel
The diameter of the strands
The level of stress in the strand
27
Conclusions or recommendations in this report are the opinions of the authors. PCI assumes no responsibility for the interpretation or application of the information contained herein.
¯ The surface condition of the strand
¯ The concrete strength
¯ The type of loading (staticvrepeated, imp~t)
¯ The type of prestress release (sudden, gradual)
¯ Confinement reinforcement
¯ Time-dependent effects (losses due to creep, shrinkage etc.,)
¯ Concrete cov-er and spacing of strands
¯ Amount of shear reinforcement in the critical zone
As discussed earlier, the phenomenon of bond between concrete and the prestressing strand
is quite complex and several studies have been performed to understand this behavior. The bond
between the strand and concrete has been treated empirically and many formulae have been
presented throughout the literature to fit the experiment results [50]. Some of these results and
proposed equations are provided in the following section.
2.5 Studies on Transfer and Development Length
Significant research has been done in the past to investigate the bond mechanisms of
prestressing strand in concrete as it relates to transfer and development length. Existing code
provisions for the development length of fully bonded strands are based on the results of two
studies conducted in the Research and Development Laboratories of Portland Cement
Association (PCA) [8]. The results of these studies were reported in papers by Hanson and Kaar
[24] and Kaar, LaFraugh and Mass [27]. An overview of the research including the work
conducted at PCA is described in brief in the following:
a) Kaar, LaFraugh and Mass [2 7]
This study was presented at the Ninth Annual Convention of the Prestressed Concrete
Institute in 1959. This study investigated the influence of concrete strength on the stress transfer
length of seven-wire strand at the time of prestress transfer. Strands of 6.35mm (0.25 in.), 9.53
mm (0.375in.), 12.7 mm (0.5 in.), and 15.24 mm (0.6 in.) diameter strands were used to prestress
rectangular prisms having various concrete strengths. For all strands except the 15.24 mm (0.6
in.) diameter strands, smooth, unrusted strands were used. The length of the prisms was 2.44 m
28
Conclusions or recommendations in this report are the opinions of the authors. PCI assumes no responsibility for the interpretation or application of the information contained herein.
(8 ft) for all specimens except for the 15 mm (0.6 in.) diameter strand which had a length of 3.05
m (10 ft). The cross section of the prisms varied with the size of the strand.
The researchers concluded that concrete strength has little influence on the transfer length
for strands up to 12.7 mm (0.5 in.) diameter. The 15.24 mrn (0.6 in.) strands had a smaller
transfer length for concrete with higher compressive strength and vice-versa. The influence of
strand diameter was also studied in this research. The researchers found that transfer length
varied linearly with respect to _strand diameter. They also found that the average increase in
transfer length over a period of one year following prestress transfer was 6% for all strand sizes
and that the increase in transfer length was independent of the concrete strength at transfer.
The method of measurement of transfer length used in this project was by means of the
DEMEC (DEtachable MEChanical) gauge method which has also been used in many other
research programs to measure transfer length of prestressing strands. This method is described in
detail in Section 7.2.2.
b) Hanson and Kaar [24]
This study was performed at the Portland Cement Association (PCA) laboratories in 1959
and is considered to be the backbone for the current approaches to development length testing
and code provisions. The test program involved 47 beam tests, with varying diameter of the
strands and were tested in a series of flcxural tests. The main variable in the study was the strand
diameter. Secondary variables included the percentage of steel reinforcement, the concrete
strength, the strand surface condition and the use of embedded end anchorages on pretensioned
strands. The authors proposed a hypothetical shape of the bond wave from the flexural test
results before slip.
The researchers found that strand size and embedment length have a considerable
influence on the value of average bond stress at which general bond slip occurs. From the test
results, the researchers determined curves that could be used for design such that general bond
slip could be avoided. They also found out that the increase in percentage of reinforcement or a
reduction in concrete strength reduces the possibility of general bond slip, since the steel stress at
flexural failure, and the corresponding bond stresses are reduced. The results of this research are
the basis for the current ACI-318 recommendations (Equation 2-1 and 2-2) for development
length of prestressing strands.
29
Conclusions or recommendations in this report are the opinions of the authors. PCI assumes no responsibility for the interpretation or application of the information contained herein.
c) Zia and Mostafa [59]
This study-was performed at North Carolina State University, Raleigh, United States. The
authors proposed a new equation for transfer length of prestressing strands that accounts for the
effects of strand size, initial prestress and concrete :strength at transfer. This equation is
applicable to concrete strengths ranging from 13.8 MPa (2000 psi) to 55.2 MPa (8000 psi.). The
researchers also studied~the various parameters affecting the transfer and development length and
reviewed the experimenta! results of previous work by other groups.
The researchers found that the use of reinforcement to resist the bursting stress near the
end of prestressing steel slightly reduced the transfer length, although the effect was not
significant. Based on the review of the then available research information, the researchers
proposed new equations for the transfer (Lt) (Equation 2-3) and development length ( Ld )
(Equation 2-4), which are applicable for concrete strengths varying from 13.8 MPa (2000 psi) to
where, fsi is the initial prestress force, f~- is the concrete strength at transfer, db is the nominal
diameter of the strand,.~, is the ultimate stress in the strand andf~e is the effective stress in the
strand after transfer.
d) Hwan and Kim. HI]
This study was performed at the Seoul University, Korea. The main objective of the
research was to study the effects of various important parameters on the transfer length on
pretensioned, prestressed concrete girders. The principal test variables were strand diameter,
concrete strength, concrete cover and strand spacing. Results of this research showed that the
current ACI-318 code equation for transfer length overestimates the actual measured transfer
length. This overestimation is more significant in high strength concrete with larger concrete
cover, which is not considered in the current equation.
30
Conclusions or recommendations in this report are the opinions of the authors. PCI assumes no responsibility for the interpretation or application of the information contained herein.
The experimentaL program included testing of 36 pretensioned, prestressed concrete
beams. The transfer length was determined by measuring concrete strains and end-slip
measurements. The experimental program studied the effect of various parameters such as strand
diameter, concrete strength, strand spacing, concrete cover and time dependent effects. The
effect of gradual and instantaneous release of prestress effect was also studied by comparing the
transfer lengths measured at the cut end and the dead end of the member.
e) Shahawy [52]
In this work the author performed a critical evaluation of the existing proposals of
calculating the development length of prestressing strands. He also discusses on the extensive
test programs on variety of prestressed concrete members and the modifications to the existing
equation made by various researchers over the past 10 years (since 2001). The objectives of this
research were to compare and contrast the development length equations given by the AASHTO
specifications (Equations 2-1 and 2-2) and the equations proposed by other researchers, compare
results from the Federal Highway Administration (FHWA) results with those of the Florida
Department of Transportation Structures Research Center (FSRC) and to present a rational
method for calculating development length of prestressing strands. Based on the study, the
author proposed two equations for development length, depending on the depth of the girder:
(a) For members with depth equal to or less than 610 mm (24 in.)
Ld = d~ + , (fsi, f~,,f~e) (ksi) and do (in.) (2-5)1.2
(b) For members with depth greater than 6 ! 0 mm (24 in.)
(f+ "" s" ’-~ + 1.47h, (f~i,f~,,f~e) (ksi) and do, h (in.)
1.2(2-6)
where, d~, is the nominal diameter of the strand, f~u is the stress in the strand (in ksi) at nominal
strength of the critical section, fii is the stress in the strand at time of initial prestress (ksi) and h
is the overall depth (in.) of the member.
The brief features and results from this investigation are as follows:
Shear - flexural interaction affects the development length of prestressing strands
and that it should be included in the design recommendations.
31
Conclusions or recommendations in this report are the opinions of the authors. PCI assumes no responsibility for the interpretation or application of the information contained herein.
The effects of shear are more pronounced in deeper members and the author
proposes his new equation (Equations 2-6 and 2-7) taking this effect into
consideration
For prestressed concrete members with depth equal or greater than 6!0 mm (24
in.), the existing AASHTO [2} eqaation and the proposed equation (Equation 2-
3) yields the closest prediction, while those predicted by the FHWA [52] or
Buckner’s recommendations [9] are too conservative.
For prestressed concrete members with a depth greater than 24 in. the AASHTO
equation [2] yields unacceptable low values for most cases and the new proposed
This study was performed at the University of Tennessee, Knoxville. Twenty full scale
AASHTO Type-I girders with large strand diameters: 12.7 mm (1/2 in.), 14.3 mm (9/16 in.) and
15.2 mm (0.6 in.) were statically tested to failure. Transfer and development lengths were
measured and factors affecting both transfer and development length are discussed and
evaluated. Based on the test data, new equations for Lt and Ld are proposed. From the existing
equation, the authors proposed replacing the initial stress instead of the effective stress in the
transfer length term and introduce a conservative factor of 1.5 in the flexural bond length term.
The proposed equation is given as follows:
Za = !~idb + 1.5(f~,s- fse)db (2-5)
Based on the study, the authors concluded that the 15.2 mm (0.6 in.) strand should be
accepted as a common practice. The authors found that 15.2 mm (0.6 in.) strands have much
shorter transfer lengths relative to any other strand diameter used in their research. Also, the
measured development lengths from 15.2 mm (0.6 in.) strand were comparable with those of
other diameter strands used. The ultimate capacities of members with 15.2 mm (0.6 in.) were
substantially higher relative to all other strands used in the study.
32
Conclusions or recommendations in this report are the opinions of the authors. PCI assumes no responsibility for the interpretation or application of the information contained herein.
J) Russel and Burns [50] :
Researchers at University of Austin at Texas performed an extensive study on the transfer
length of 12.7 mm (0.5 in.) and 15 mm (0.6 in.) diameter strands. Many variables affecting
transfer length such as: strand diameter, strand spacing, cross sectional size and strand debonding
were-studied. It was observed that the transfer length increased with increase in4hediameter of
the strand. Shorter transfer lengths were observed for larger cross sections and debonded strands.
The confinement and strand spacing were observed to have no effect on transfer length.
This study also performed flail-scale tests on nineteen AASHTO type girders and nine
rectangular beams to evaluate the development length of 12.7 mm (0.5 in.) and 15 mm (0.6 in.)
diameter strands. This study showed that shear may have influence on bond of prestressed
beams. Sudden and violent bond failures were observed when web cracking propagated through
the web of the AASHTO type girders. Web shear cracking was followed by strand slips and
subsequent shear and bond failures. The authors proposed a new form of development length
equation which limits the applied loads such that cracking is prevented in the transfer zone. For
an effective stress of 1100 MPa (160 ksi), the transfer length for 12.7 mm (0.5 in.) and 15 mm
(0.6 in.) obtained by the proposed equation is 1016 mm (40 in.) and 1219 mm(48 in.)
respectively. The proposed equation for transfer length is:
L, - £edb (2-6)2
The proposed equations for development length of bonded (Eq. 2-7) and debonded strands (Eq.2-
8) are as follows:
Mcr > LtVu (2-7)
where, Lb is the bonded length, Mcr is the cracking moment, M, is the ultimate moment and V, is
the ultimate shear at the critical section.
(2-8)
33
Conclusions or recommendations in this report are the opinions of the authors. PCI assumes no responsibility for the interpretation or application of the information contained herein.
2.5.1 Outstanding issues
With the exception of cantilevers and short span members, strand development seldom
governs the design of pretensioned concrete members. Ne-vertheless, several bond-related
failures ofpretensioned members have been reported since the adoption of the current criteria.
Diameter of the strand
In current practice, Grade 1860 MPa (270 ksi) strand with a higher tensile strength, 1.860
MPa (270 ksi), and larger cross sectional is used. Low-relaxation strand with higher yield stress
has replaced stress relieved strand. The current ACI-318 / AASHTO LRFD expression for
transfer length was derived using a bond stress of 2.76 MPa (400 psi), which represents the
average values form the tests conducted by Hanson and Kaar [24]. This stress applies to the
actual perimeter of the seven wire perimeter of the strand. For Grade 270 strand, this constant is
about 6% larger. Despite wide variations in measured values, several researchers have concluded
that the transfer length increases directly with strand diameters ranging up to 15.7 mm (0.6 in.).
Shear - Bond interaction
The issue of web-shear cracking and bond of prestressing strands has been discussed and
debated for a long time. The interaction between shear and bond has been considered to be cause
for slip failures [24][8][9] It has been found that the initial slip occurred coincident with the web
shear cracking [8][9]. However, there is a doubt on whether web-shear cracking initiates strand
slip or vice versa. Researchers from University of Texas at Austin [8][9] found that the results
indicate a direct interaction between shear and bond with the initial slip occurring immediately or
shortly after the appearance of first shear crack. The best documented evidence found to explain
interaction between shear and bond gives a strong indication that general bond slip occurred
prior to the sudden shear failure [8] [9].
Shahawy [52] proposed two different equations (Equations 2-5 and 2-6) for development
length depending on the depth of the member. He found that the effects of shear on development
length cannot be neglected on members greater than 610 mm (24 in.) as there exists interaction
between shear and flexure and the slippage of the strand is most likely to occur before the
flexural capacity of the member is achieved.
34
Conclusions or recommendations in this report are the opinions of the authors. PCI assumes no responsibility for the interpretation or application of the information contained herein.
The wide variations and the confusion in the validation of the current code provisions
may also be due to the inconsistency in the amount of shear reinforcement used in the various
research studies performed. Researchers have used different amounts of shear reinforcements in
their studies on transfer and development lengths. Taking into account the shear-bond
interaction, researchers who have had relatively higher shear reinforcement are more likely to
have lower transfer and development lengths and vice versa. This may also be a reason for the
wide variation in the results in past studies. Shear-bond interaction must be taken into
consideration to properly correlate the variations in transfer and development length results
available.
Failure strains in test specimens
The wide variation in the results of development lengths have also been attributed to the
level of strand strains developed at the section at failure. Apparently to simplify testing, most
development length test units have been designed to fail at relatively low strains in the strands.
The exceptions have been girders with cast-in place composite slabs [9]. Experimental results
from most test programs suggest that average bond strength is lower in specimens with large
strand strains at failure (eg. strains near the guaranteed ultimate minimum elongation of 0.0350)
as compared to specimens that failed with strains near the yield strain. Studies indicate that the
studies on non-composite sections with failure strains much lower than the guaranteed ultimate
minimum elongation showed that the ACI-318/AASHTO LRFD recommendations were
consercative. At the same time, composite sections with failure strains near the guaranteed
minimum elongation showed 1.7 times longer development length than the ACI-318/AASHTO
LRFD recommendations [9][52]. A possible reason for this discrepancy has been attributed to
the relative difference in strain levels at failure. Members with composite sections represent the
actual bridge applications and hence it has been recommended that development length studies
should be made with cross sections that would develop strand strains near the minimum
guaranteed ultimate elongation.
2.6 Studies on Strand Bond Performance
As discussed in this section, significant research has been done to evaluate the bond
parameters of prestressing strand in concrete. The complex bond mechanisms and dependence of
35
Conclusions or recommendations in this report are the opinions of the authors. PCI assumes no responsibility for the interpretation or application of the information contained herein.
bond on a large number of parameters (section 2.4) has been attributed to the wide variation in
the r~ults obtained from previous works. Researchers from University of Oklahoma [47]
summarize the variations in the results of transfer length from past projects. The study [47] found
a wide degree of scatter for seemingly similar strands with similar surface conditions yielded
widely disparate results. The researchers conclude that to certify the bond characteristics of a
given prestressing strand in pretensioned concrete applications, a standardized and repeatable
bond test must be developed [47].
The need to have a standardized test to measure the bond performance of prestressing
strands lead to the development of various tests such as simple pull-out tests, and tensioned pull-
out tests. Theoretically, the test must replicate the actual conditions of the strand in the
pretensioned beam and must take into account all the bond mechanisms. At the same time,
various strand surface conditions affect the bond performance. The different manufacturing
processes by different strand producers may leave a different residue on the strand that may have
an adverse or enhancing effect on the bond performance depending on the residue [47]. Hence
researchers have addressed that the developed bond test must also be a pre-qualification for the
strand bond quality [35]. Nevertheless, the non-existence of an ASTM standard that addresses
bond quality has increased the need of a standardized test for bond quality.
Several tests have been developed including pretensioned pull-out tests [i][13] and
simple pull-out tests [34][35][47]. Simple pull-out tests have been widely accepted due to the
ease of manufacturing and testing. At the same time, it should be noted that the bond
performance is related to the bond mechanisms and complex phenomena. The results of these
simple pull-out tests depend on the bond resistance created by friction and mechanical interlock.
The Hoyer’s mechanism which is the main contributor for transfer length [8] is not represented
in these tests. The correspondence between the results obtained from simple pull-out test and
structural design parameters such as transfer length and development length have been
questioned for conventional concrete [8][42] [49] [48] and seem to be of continued debate for use
in SCC studies.
In order to determine values of the slip resistance of a prestressing strand through
experimental methods, care must be taken to consider the mechanisms affecting bond response
[33]:
36
Conclusions or recommendations in this report are the opinions of the authors. PCI assumes no responsibility for the interpretation or application of the information contained herein.
The bond stress (slip resistance), typically assumed as uniformly distributed, is higher for
shorter embedment lengths in a pull-out test specimen. This is shown in Figure 2-10. This
maximum stress value has a decisive part in the shear stress vs. slip response.
The slip resistance increases with the quality, the compaction, and the degree of
hardening of the concrete, thus the relevance bf evaluating this mechanical behavior
parameter for SCC.
The slip resistance is significantly dependent on whether a transverse compressive stress
acts on the strand. This effect can be reproduced through normal pull-out tests (see Figure
2-10 a).
4. Additional transverse pressure is created by the Hoyer effect.
Because of all of these influencing factors, it is difficult to determine bond lengths by
means of simple pull-out tests. At the same time researchers have supported the use of simple
pull-out tests. Arguments in favor of simple pull-out tests note that the friction between the
strand and concrete is also an essential element of bond [47].
(a) d
//I /
IllIII
III
(b) dAverage "l" ~ --~
I1
Average
~. Max ~" ~A verage ~
Figure 2-10 Effect of Embedded Length in Normal Pull-Out Tests [33]
37
Conclusions or recommendations in this report are the opinions of the authors. PCI assumes no responsibility for the interpretation or application of the information contained herein.
Chuck
Hydraulic Ram
Steel Chair
2" Sleeve
¯
4" Sleeve
Figure 2-11. Details of Moustafa test [46]
The variation in performing pull-out tests include varying embedment lengths, different
equipment, different loading rates and varying concrete mix designs. !n order to have a
standardized test, these variations should be removed. It has been found that rapid pull-out
loading rate produces higher peak pull-out loads and vice versa [47]. In 1974, Concrete
Technology Corporation (CTC), under the supervision of Dr. Saad Moustafa, performed simple
pull-out tests on 12.7 mm (0.5 in.) strands with 457 mm (18 in.) embedment length. In these
tests, strands were pulled from concrete using an hydraulic jack with a single strand pull-out
accomplished in approximately 90 seconds and less than 2 minutes. The average peak pull-out
was 170 kN (38.2 kips) with a standard deviation of 3.3 percent. Recently these 1974 tests have
been used as a benchmark to compare strand bond performance of strands currently produced
[47][34][35]. In 1994, Donald R. Logan, chairman of Stresscon Corporation., Colorado,
conducted pull-out tests on additional series of strands to asses variations in bond that could be
caused by differences in strand surface condition from different manufacturers [47][34][35]. The
38
Conclusions or recommendations in this report are the opinions of the authors. PCI assumes no responsibility for the interpretation or application of the information contained herein.
pull-out tests performed by CTC and Stresscon used similar procedures [47]. In order toavoid
variations in pull-out strengths and to have a standardized tests for strand bond quality
evaluation, Logan made a few modifications to the Moustafa-tests and specified guidelines to
perfonm the tests_ [34][35]. This test has become commonly termed as large block pull-out tests
(LBPT).
As discussed earlier, in order to qualify the strand for adequate bond performance, the
test has to be performed in a specific manner on a specific mix design of concrete. The following
are the guidelines and test procedure as prescribed by Logan [34] [35]:
1) The hydraulic jack shall be a pull-jack with a center hole assembly at the end of
the ram (similar to those normally used for single-strand stressing). It shall be
tested and calibrated to permit loading upto 50 kips (222 kN), and shall have a
travel of at least 12 in. (305 ram)
2) A specific bridging device should be used [35].
3) On the day of casting the test blocks (with heat curing), the cylinders shall be
tested and the concrete strength recorded. Based on results of past testing, the
concrete strength can range from 24.1 to 40.7 MPa (3500 to 5900 psi) without
affecting the pull-out strengths.
4) A bridge is slipped over each strand to be tested and placed against the concrete
surface. Strand chucks are slipped over the strand to the top of the bridge and light
pressure is applied to the jack to seat the jaws of the chuck into the strand.
5) The jacking load shall be applied in a single increasing application of load at the
rate of approximately 20 kips per minute (89 kN per minute) until the maximum
load is reached and the load gauge indicator can no longer sustain maximum load.
The test should not be stopped at the sign of movement of the strand sample or for
any other reason. The strand samples can pull-out as much as 203 mm to 254 mm
(8 to 10 in.) before maximum load is reached with a poor strand, and 25.5 to 51
mm (1 to 2 in.) with a good bonding strand.
6) The pull-out capacity of the strand sample shall be recorded as the maximum load
attained by the strand sample before the load drops off on the gage and cannot be
further increased.
7) The following data shall be recorded for each strand sample:
39
Conclusions or recommendations in this report are the opinions of the authors. PCI assumes no responsibility for the interpretation or application of the information contained herein.
a) Maximum capacity _
b) Approximate load at first load movement
c) Apwoximate distance the strand pulls out at maximum load
d) General description of failure
Record data and compute average failure load and standard deviation for each
strand group tested. Compare results with mininmm requirements for acceptance
for pretensioning applications.
The tests on strand bond confirmation by means of the "LBPT" have been recommended
by the PCI Interim Guidelines for SCC [46]. However, the correspondence between the results
obtained from this test and structural design parameters such as transfer length and development
length have been questioned for conventional concrete [8][42][48][49] and seem to be of
continued debate now for SCC. While the response evaluated through the Moustafa test is clearly
related to bond performance, its correlation to the complex phenomena occurring in the transfer
zone region and during development of strand capacity under flexura! actions, as previously
discussed, is questionable.
Nonetheless, pull-out tests such as the LBPT and t’ne Moustafa test are excellent methods
to provide a baseline to qualify the strand bonding characteristics, which may be affected by rust
or manufacturing residues. However, bond length evaluation needs to be conducted in a manner
consistent with the stress state in both transfer and flexural regions.
2.7 Strand Bond Performance in SCC
Much attention and research has been dedicated to understand the bond behavior of
prestressing strands since the start of this project. At the beginning of this project the issue of
bond in SCC was a major question and only limited work had been done to evaluate it. The
results were scattered and there was a sense of concern on theprecast and engineering industry on
the effects that SCC may have on strand bond. The work from this report has evolved together
with many other projects dedicated to this issue. In the following, a brief overview of selective
work in the U.S. and abroad on the issue of strand bond in SCC is provided. The goal is to place
the findings from this study within the context of the current state of the art.
40
Conclusions or recommendations in this report are the opinions of the authors. PCI assumes no responsibility for the interpretation or application of the information contained herein.
Girgis et al. [22] (University of Nebraska-Lincoha, NE, USA) studied the bond strength
and transfer len~b_ of pretensioned bridge girders made of SCC. Two SCC mixes and one
conventional mix were used. Strand pre-qualification pull-out tests were performed in
accordance to the LBPT, and the strands used in bridge girders exceeded the limits set by Logan
[35]. The transfer length on bridge girders was measured using concrete strain profiles. The
authors suggest that the the use of VMA affects the early compressive strength and bond strength
of SCC with pretensioning strands. The SCC mixes were reported to experience significantly
longer transfer lengths (up to 50% higher in- some cases) relative to conventional concrete.
Transfer length measurements indicated lower early bond strength compared to conventional
concrete. Finally, at 28 days, it is reported that the transfer lengths of SCC mixes was lower than
for conventional concrete and is hence suggested that SCC may also have lower development
lengths. Large scale testing was not performed and hence the development length issues were not
addressed.
As part of the previously cited (see Section 2.1.3) research by Naito et al. [40] (Lehigh
University, PA, USA) on the structural performance of large scale bulb-tee girders made with
SCC, they also evaluated the bond characteristics of the strand with respect to transfer length. As
previously mentioned, four 10 m (35 ft.) long bulb-tee girders were produced, two using a single
SCC mix and two others with conventional concrete. Large block pull-out tests (LBPT) were
performed on a total of 35 strands to pre-qualify the strand. The test setup and experimentation
was similar to the one proposed by Logan [35]. The strand used in this work had only 84% of the
acceptable criteria defined for the LBPT by Logan. Transfer lengths at initial prestressing for
SCC and conventional concrete were found to be similar. The transfer lengths were found to be
shorter than that expected from standard PCI formulations. As previously mentioned, large scale
testing revealed that test units from SCC and conventional concrete exceed the nominal strengths
for all conventional girder failure modes. Damage progression and failure modes were also found
to be similar between the SCC and normal concrete girders, with all of them exhibiting some
strand end-slip. Yet the authors conclude that since the flexural failures exceeded the nominal
capacities, the performance of SCC in bond was adequate. The authors do note that this
conclusion is valid only for the specific SCC mix used in the research and that further
investigation into other SCC mixes was required to cast wider conclusions.
41
Conclusions or recommendations in this report are the opinions of the authors. PCI assumes no responsibility for the interpretation or application of the information contained herein.
_ Mart~-Vargas et al. [37] (Politecnic University of Valencia, Spain)_studied the bon.d
behavior of seven wire strands on six SCC mixes and compared it with three conventional
concrete mixes. The SCC mixes were obtained from tln~ee w/c ratios (0.5, 0.45 and 0.35) and
three cement quantities (350 400 and 500 kg/m3), respectively. The measurement of transfer
length and strand pullout was performed on the same test unit using the ECADA test method-- a
stressed strand pull-out test method. Transfer length was measured after prestress release and
anchorage length was through pullout. The anchorage length was measured as the minimum
embedment length required to produce a pull-ore force of 158 kN (35.8 kips). Prestress losses
were found to be higher on SCC mixes than conventional mixes. SCC mixes with low cement
content provided a more ductile pull-out versus end-slip response. For low cement content SCCs,
the anchorage length of SCCs was greater than for the corresponding conventional mix. For high
cement content SCC mixes, the anchorage lengths were similar to those of the conventional mix.
Finally, the transfer lengths of SCC mixes were found to be similar to those of the conventional
mixes.
Stanton et al. [53] (University of Arkansas, AR, USA) studied the transfer lengths of two
SCC mixes and one conventional mix and compared the results with the ACI recommendations.
Eighteen small-scale rectangular beams per mix design were manufactured. The test units had
dimensions of 165 mm by 305 mm (6.5 x 12 in.) and contained two seven wire 15.25 mm (0.6
in.) diameter prestressing strands. The target compressive strength was 48.2 MPa (7 ksi) at
prestress release and 82.7 MPa (12 ksi) at 28 days. Transfer lengths were determined using
concrete strain profiles at prestress release, 5, 7 and 14 days. Their results indicate that the
transfer lengths measured at 14 days for the SCC beams were within ACI recommendations and
were approximately 60% of the ACI code predictions.
Hegger et al. [26] (Aachen University, Germany) studied the bond performance of seven
wire (&=12.Smm) and ribbed wires (d~=12mm) on SCC by performing pull-out tests and
studying the effect of strand clear spacing and concrete cover on transfer length. The goal was to
compare the experimental transfer lengths of SCC with code regulations. Three SCC mixes were
studied: one containing fly ash, the second containing limestone and the third containing a
combination of both. The study revealed that high powder content of SCC positively influenced
the microstructure relative to conventional concrete. The resulting interfacial zone between
aggregates and matrix, matrix and prestressing strand was found to be less porous, with the pores
42
Conclusions or recommendations in this report are the opinions of the authors. PCI assumes no responsibility for the interpretation or application of the information contained herein.
being well distributed and homogeneous. The pull-out tests was performed on prestressed
strands. After 24 hours, the modulus of elasticity and the bond strength of SCC were found to be
lower, and the tensile strengths were found to-be higher, than conventional concrete. Transfer
length studies were performed on small-scale rectangular beams with two and four se_ven wire
(db=12.5 mm) strands with va~,ing concrete cover and strand spacing. It was found that the
minimum concrete cover and strand clear spacing is the same for SCC and conventional
concrete. Finally, it was concluded that except for the ACI code, Eurocode and German code
regulations concerning transfer length reflect the beneficial influence of compressive strength
adequately.
Larson et al. [32] (Kansas State University, KS, USA) studied the transfer and
development length of an SCC mix. The transfer length was measured using end slip
measurements and the development length was determined by means of iterative flexural testing
at various critical embedment lengths. Twelve test units were tested. Also, the top strand effect
was studied by placing the strand at the top while casting and testing the test unit inverted. It was
reported that transfer lengths for the SCC units were within the ACI code recommendations.
Also, the transfer lengths of beams with "top strand effect" were 50% higher than corresponding
bottom-strand beams. Finally, the development lengths of all SCC units were found to be within
the ACI recommended values.
2.8 Concluding Remarks
From the above-mentioned studies, it is clear that SCC is of high interest due to the many
advantages it provides to the precast industry for improved construction efficiency and quality.
However, it becomes obvious that most efforts to date have focused on the materiM aspect of
SCC and only limited efforts have validated its structural performance. For precast/prestressed
concrete construction, the bond between concrete and prestressing strands is of primary
importance. Given the complex nature of bond stresses and the mechanisms controlling them;
along with the varied results and continuous debate over the existing code recommendations for
conventional concrete, it becomes essential to evaluate the bond performance of prestressing
strand in members built using SCC. The evaluation of bond performance on SCC is not an easy
task taking into account that there is no commonly accepted procedure to proportion SCC mixes.
Proper evaluation of the bond performance and evaluation of the respective bond parameters
43
Conclusions or recommendations in this report are the opinions of the authors. PCI assumes no responsibility for the interpretation or application of the information contained herein.
(.transfer and development.lengths) is essential to take the advantages SCC offers into safe
implementation in precast/prestressed concrete construction.
44
Conclusions or recommendations in this report are the opinions of the authors. PCI assumes no responsibility for the interpretation or application of the information contained herein.
CHAPTER 3 THEORETICAL CONSI-DERATIONS
3.1 Introduction
This chapter deals with the theoretical considerations related to the computations used in
this research project to determine developmem length parameters. As discussed in Section 2.3,
the determination of development length (Ld) involves two parameters: transfer length (Lt) and
flexural bond length (Lf). The determination of transfer length requires the computation of the
effective stress @e) in the strand, taking into account all the losses that may occur in the strand.
Similarly, the determination of flexural bond length involves determination of the flexural
moment capacity (M,,) and stress in the stand at nominal flexural capacity (fps). Also, as discussed
later in CHAPTER 7, the experimental determination of transfer length in this project has been
done by two methods: a) Concrete strain profile, and b) Draw-in method. The determination of
transfer length by the draw-in method involves the measurement of"draw-in" value (A~).
The theroretical considerations used to calculate: a) effective prestress ~e), b) stress in the
strand at nominal flexural capacity (fps), c) the fiexural moment capacity (Mn) of the beam
section and d) "draw-in" value (Ad) and its associated transfer length are presented.
3.2 Effective Prestress (fse)
The amount of prestress force effectively transferred from the tendon to the concrete, or
"effective prestress (fs~)" depends on a series of losses; some of which occur instantaneously and
others are time-dependent. The calculation of effective prestress at transfer (release of prestress)
is computed by including only the instantaneous losses, while the computation of effective
prestress at the day of flexural testing takes into account all losses, including long term losses.
Instantaneous losses include those due to slip at the anchorages (AfpA) and the elastic shortening
of the concrete (AfpEs). Time-dependent losses include losses due to the relaxation of the
prestressing steel (AfpR), shrinkage of the concrete (AfpsR) and creep of the concrete (Afpca). The
total prestress losses (Afpr) at a given time would be the accumulation of all these losses
calculated at that particular time (Eq. 3-1). The effective prestress ~e) would thus be the
difference from the initial jacking prestress ~i) and the total prestress losses (Afpr) as indicated in
Equation 3-2.
45
Conclusions or recommendations in this report are the opinions of the authors. PCI assumes no responsibility for the interpretation or application of the information contained herein.
Af ;t = Af ;~ + Af ~rs + Af ;sn + Af ~c~ + Af ~
3.2.1 Anchorage Set Losses (AfpA) [71
The stresses developed by the jacking force are not completely transferred to the member
as there is a slight slip at the jacking end where the wedges adjust to seat themselves in the
anchorage. This anchorage slip (~) is assumed to produce a uniform strain over the length of the
strand (L), which results in an anchorage loss of [7]:
= E, (3-3)
where, Ep is the modulus of elasticity of the prestressing strand.
In this project, the tendons were instrumented with electrical resistance strain gages and
the "locked in" stresses after anchor set losses were directly obtained from the strain gage
readings.
3.2.2 Losses due to Elastic Shortening of Concrete (AfpES) I71
When the prestress force in the tendons is released into the concrete member, the
concrete is subjected to compression. This transferred tbrce causes the concrete member to
shorten. Strain compatibility between the strains in concrete and the strand results in relative
elongation of the tendon [7]. This causes a loss in prestress force transferred. The loss due to
elastic shortening of the concrete (Af~Es) was calculated by equating the strain in tendon due to
change in prestress and the strain in concrete due to the concrete stress at the strand centerline
(fcgp) [7]:
EpAf vEs = ~ fcu, (3-4)
where, E~i is the modulus of elasticity of concrete at transfer. The value offcgp was obtained from
the elastic uncracked properties of the section as:
fc~, =+P_p_+ Pey +Moy (3-5)A I I
46
Conclusions or recommendations in this report are the opinions of the authors. PCI assumes no responsibility for the interpretation or application of the information contained herein.
where, P is the total initial prestress force at the centroid group line of the strands, e is the
eccentricity of the tendon from the centroid of the section, y is the fiber at which the stress is
computed (in this case, y = e), MD is the moment due to self weight and I, is the moment of
inertia of the section.
3.2.3 Losses due to Concrete Shrinkage (AfpSR) [7]
Shrinkage of concrete is a time dependent loss that is caused by a decrease in volume
under constant temperature due to loss of moisture after the concrete has hardened. Shrinkage
losses are influenced by the curing method, volume to surface ratio of the member, water content
of the mix and ambient relative humidity. In this project the shrinkage losses (AfpsR) were
obtained from the modified version of AASHTO recommendations as (Collins and Mitchell,
1991):
Af ~,s~ = -esxE ~, (3-6)
where, gsR is the shrinkage strain which is a function of drying time (t) and constants of size
factor (ks) and humidity factor (k~):
esR =-k,k,,[t+~lO.56xlO-S (3-7)
The values of ks are dependent on ratio of volume to surface area and drying time. In this
project, for the specific test specimen used, the values of ks and k~, were computed to be 0.9 and
1.29 respectively.
3.2.4 Losses due to Creep of Concrete (AfpCR) [71
Creep is a time dependent phenomenon in which deformation increases due to a
prolonged application of a constant stress. In concrete, creep is primarily due to the viscous flow
of the hydrated cement paste [7]. Creep depends on the age of concrete, mix proportioning,
stiffness of the aggregates and the method of curing. Creep losses in concrete (Afpc~) can be
determined from the creep strain (gca), which is obtained by multiplying the elastic shortening
strains (~ci) with a creep coefficient (~.
Ec. (t, ti ) = ~(t, ti )£~i (3-8)
47
Conclusions or recommendations in this report are the opinions of the authors. PCI assumes no responsibility for the interpretation or application of the information contained herein.
where, t is the age of concrete in days and 1i is the time in days when the permanent load is
applied. The assumed creep coefficient is that given by the following equation [7]:
where, H is the relative humidity (%), kc. is the creep factor for effect of volume/surface area and
62ks - 42 + f ’~ (3-10)
where, f’~ is the compressive strength at 28 days. In order to calculate the creep losses, a time
dependent concrete elastic modulus, EcR (t, ti) is obtained ~om the creep strain (Eq. 3-8) and
concrete stresses ff~’c~) due to the applied load at time t~.
Ec,(t, ti)= f~ (3-11)
In order to dete~ine the s~esses in the prestressing tendon ~om the stress in the su~ounding
concrete, a time dependent modular ratio nc~ (t, ~) is calculated:
E,.c. ( t, ti ) : ~( t, ti ) (3-12)
The losses due to creep (A£c~) were thus obtained from the stress along the strand group line
(Eq. 3-5) and the modular ratio as:
3.2.5 Losses due to Steel Relaxation (AfpR) [7]
Relaxation of steel is a time dependent loss. It occurs when the tendon is held at a
constant stress and temperature. The total relaxation loss (AfpR) can be classified into two
components: a) relaxation loss at transfer (Afpm) and b) relaxation loss after transfer (Afp~2).
Af pR = Af pR, + Af p~2 (3-14)
The prestress loss due to relaxation at transfer (Afp~l) for a member with an initial
prestress at transfer ~i) greater than 0.5fp~ (ultimate strength of the strand) was calculated as per
the AASHTO recommendations as:
48
Conclusions or recommendations in this report are the opinions of the authors. PCI assumes no responsibility for the interpretation or application of the information contained herein.
where, t is the time in days andfpy is the yield strength of the prestressing tendon.
The prestress loss due to relaxation after transfer (Afpm) for stress relieved strand was
taken as a con~ant value of 138 MPa (20 ksi) [7]. The effective prestress ~e) was thus
calculated from (Eq. 3-1) by taking into consideration all the losses (Eq. 3-2) described earlier.
The values of the effective stresses taking into consideration all the losses for the test units in
Phase-1 and Phase-2 are given in_ Table 5-2 and Table 5-3 respectively.
3.3 Draw-in Value (Aa)
As discussed earlier, one of the experimental methods used in this research for determining
the transfer length is "Draw-in methoa~’ (Section 7.3). This method follows from the premise
that when prestress is released, the strand at the face of the member is pulled into the concrete
member. "Draw-in" is the measurement of this "pulling-in" phenomenon, hence also referred to
as "suck-in" or "free end slip" [8]. In this thesis the term "draw-in" is used to refer to the
prestress release phenomenon and the term "end slip" is used to refer the strand slip due to
applied external loads. Draw in measurements have been shown to correlate well with transfer
length [54]. Due to the simplicity of this method it was pursued in this project as a counterpart to
the concrete strain method. The relationship between the strand draw-in and the corresponding
transfer length follows.
3.3.1 Transfer Length by Draw-in
A relationship between strand draw-in (Ad) and the transfer length (Lt) was first proposed
by Guyon (1953). It is assumed that there is no displacement between the steel and the concrete
beyond the transfer length. Hence the displacement of the strand within the transfer length region
can be used to obtain the transfer length. The strand "draw-in" was measured experimentally by
connecting a bracket to the strand and measuring its distance from the face of the beam before
and after prestress release (Refer Section 7.3). From the measured draw-in the transfer length can
be computed as:
O~EpsLt - Ad
Li(3-16)
where:
49
Conclusions or recommendations in this report are the opinions of the authors. PCI assumes no responsibility for the interpretation or application of the information contained herein.
o~ = constant that depends on the_ load stress distribution (c~ = 3 for constant load stress
distribution and ~ = 2 for linear load stress distribution [6] ) and
Eps = Modub~-of elasticity of the strand.
f~i = Intial stress in the prestressing strand (before release of prestress).
In this report, the variation of strains from the beam end is assumed to be linear and the
value of c~ is taken as 2 for the determination of transfer length [6]. The values of Eps for two
different strands used in this research are provided in Section 5.2.2. The stressing information for
various test units of Phase- 1 and Phase-2 are provided in Table 5-2 and Table 5-3 respectively.
3.4 Moment Capacity (Mn) and strand stress at Ultimate (f~s)
The determination of strand stress at nominal flexural strength of the member (fp~) is
essential to calculate both the flexural bond length and the nominal moment capacity (Mr) of the
member according to current code guidelines (Eq. 2-1 and Eq. 3-20). Since these parameters (fp~,
Mr ) are inter related, the computations for obtaining them are discussed together.
Analysis of the prestressed section at its ultimate flexural strength is necessary to
determine its nominal moment resisting capacity. The cross-section dimensions, material
properties, amount of reinforcement and the amount of prestress force in the strands must be
known to calculate the moment at ultimate. The ultimate strength of the section is achieved
outside the linear range of the behavior of the prestressed section. A detailed strain compatibility
analysis of this response is generally not feasible in daily design practice. Simplifications have
thusSeen made by most code provisions that allow a fast but sufficiently accurate evaluation of
the nominal capacity of the section [4]. The following assumptions are made by the ACI code
recommendations [4] with reference to Figure 3-1:
1. Plane sections remain plane before and after loading; strain distribution is linear
2. Perfect bond exists between steel and concrete
3. The limiting compressive strain of concrete is 0.003 for all cross-sections, types of
concrete and amount of reinforcement.
4. The tensile strength of concrete is neglected.
50
Conclusions or recommendations in this report are the opinions of the authors. PCI assumes no responsibility for the interpretation or application of the information contained herein.
5. The total, force in the concrete compressive zone cart be approximated by considering a
uniform stress of magnitude 0.85f’~ over a rectangular block (Whitney’s block) of width
b and depth a=fllc, where c represents the depth of the neutral axis and fll
(Equation 3-17) depends on the compressive strength of concrete as:
ASSUMED STRAIN ACTUAL STRESS A CI ASSUMEDDIAGRAM DIAGRAM STRESS DIAGRAM
Figure 3-1 ACI-318 code Assumed Stress - Strain Distribution [3][4]
Calculation of the nominal capacity of a prestressed section according to the ACI method
[3][4] involves the assumption of the Whitney rectangular stress block. In order to satisfy the
horizontal equilibrium of the section, the resultant tensile (7) and compressive forces must
balance each other. The nominal moment capacity (Mn) is obtained from the couple created by
the resultant tensile (7) and compressive (C) forces, then thus giving:
where, d is the distance from the extreme compression fiber to the centroid of the tensile force. If
the section includes any passive compressive reinforcement, the contribution of such
reinforcement must be included in the total compressive force. The distance from the extreme
compression fiber to the centroid of the tensile reinforcement (d) can be estimated from the
51
Conclusions or recommendations in this report are the opinions of the authors. PCI assumes no responsibility for the interpretation or application of the information contained herein.
locations, area and capacities of the prestressing tendons (dp, Aps, fps) and passive reinforcement
(ds,
d = Apsfpsdp + Zlsfyds (3-19)Apsf poo + Asf ),
The ACI-318 code provides a simplified approach to determine the value of stress in the strand at
the nominal capacity of the member @~) if the effective stress ~e) is not less than 0.5 times the
ultimate strength of the tendon (fpu) which is given by:
where:
factor for type of prestressing steel
0.55 forfp/fpu not less than 0.80
0.40 forfp~/fpu not less than 0.85
0.28 forfp/fp~ not less than 0.90
specified yield strength of prestressing steel (psi).
ratio of prestressed reinforcement = Aps/bdp
distance from extreme compression fiber to centroid of prestressed
Clearly, the nominal capacity can be calculated from the resultant tensile forces as given
in Equation 3-18. Calculation of the nominal capacity by the ACI-318 code as discussed above is
a simplified method. A more accurate analysis involves the use of the actual stress distributions
in the section by considering strain compatibility and realistic material constitutive models. In
this approach, the strain distribution in the section is still assumed to be linear. However, no
assumptions for fps are made. Rather, for any curvature demand, equilibrium between resultant
compressive and tensile forces is enforced andfps is calculated accordingly.
In this project, the nominal capacity was calculated by three methods: a) the ACI-318
code equations, b) a custom program using a strain compatibility approach using Ramberg-
52
Conclusions or recommendations in this report are the opinions of the authors. PCI assumes no responsibility for the interpretation or application of the information contained herein.
Osgood constitutive model for the prestressing strand and ACI-318 model for concrete, and c) a
research software for analysis of concrete sections (RESPONSE 2000®)[21], which also uses
strain compatibility method and refined stress-strain models for both concrete and steel. The
strain compatibility approaches from both the custom algorithm and Response 2000® were used
only as prediction tools. Since the overall objective of the work is to study the effect of selected
SCC mix designs on bond performance and to compare their performance with ACi code
recommendations, the experimental moment capacities (M, te~t) were only compared with the
nominal moment capacities obtained from ACI equations (M, AcI) (refer CHAPTER 8),
53
Conclusions or recommendations in this report are the opinions of the authors. PCI assumes no responsibility for the interpretation or application of the information contained herein.
CHAPTER 4 MIX DESIGN DEVELOPMENT AND EVALUATION
Due to the many options available for obtaining SCC, the goal of this research was to bound
the effects of SCC mix proportioning on transfer and deve!opment length of prestressing strand
by considering extreme conditions for its proportioning. As discussed in Chapter 1 and Chapter
5, this project had two phases, which used two different types of prestressing strands. Similar
mix designs were repeated in both the phases. This chapter describes the rationale behin-d the
selected mix designs for this project and provides the specific proportioning used. Also included
herein is the evaluation of the fresh and hardened properties of the experimental mix designs. For
both project phases, SCC mix development and test results are compared with a reference
normally consolidated concrete (NCC) mix.
4.1 SCC Mix Design Approaches
As previously discussed in Chapter 2, SCC achieves its fresh property advantages through
specially proportioned mix designs that significantly deviate from what can be considered ideal
mixes, developed through many years of research and development. The tailorable design of
SCC mixes for fresh and hardened properties gives many different possibilities to obtain SCC.
While there is no commonly accepted procedure to proportion SCC mixes, over the years several
methods have been developed in research centers around the world [15][16][29][42]. In spite of
the different methods of achieving SCC, it is commonly agreed that all methods are bounded by
two main approaches [29] :
¯ Approach 1: Mixes without any viscosity-enhancing admixture, but with lower w/c ratios
(e.g., 0.33) to reduce free water content and provide stability and use of a relatively high
content of HRWR to provide high-fluidity.
Approach 2: Proportioning concrete with moderate w/c ratios (e.g., 0.45), and use of
HRWR and VMA to provide fluidity and increase stability, respectively. The VMA
increases both the yield value and viscosity, while the HRWR reduces the yield value. The
resulting combination provides a mix with relatively low yield and moderate viscosity.
Due to the wide variety of mix designs that have been proposed, and that can be developed
to create SCC, this research used SCC mix designs that bounded the currently used proportioning
54
Conclusions or recommendations in this report are the opinions of the authors. PCI assumes no responsibility for the interpretation or application of the information contained herein.
techniques for SCC. With this approach, the mix design characteristics of SCC and their effect
on material and structural properties are thought to be bounded, so as to provide designers with
knowledge on the compromises made through the optimization of an SCC mix for fresh-concrete
behavior. This will hopefully allow design freedom to tailor the proportioning of SCC to match
fresh performance objectives while giving guidance tO design engineers on the compromises that
the mix design will have on short term and long term hardened properties as wel! as the
structural response of structural elements.
In this research, the SCC mixes were designed following extreme cases of the mentioned
approaches. The first SCC max (SCC1) was designed with a low w/c ratio (0.35) after Approach
1. At the other extreme of proportioning, a SCC mix (SCC3) with a high w/c ratio (0.45)
followed Approach 2. In between these two cases, SCC mix (SCC2) with moderate w/c ratio
(0.40) was obtained from the combination of the two approaches. A normally consolidated
concrete (NCC) mix comparable to the balanced SCC mix (SCC2) with w/c ratio = 0.40 was
used as a reference or control mix design for the project objectives. These mix designs and the
controlling parameters are described in the following section.
In Phase-1, the SCC2 and NCC mixes had to be repeated due to poor performance of the
mix and testing equipment. The first and second attempts are designated by the letters "A" and
"B," respectively. In Phase-2, there was no repetition. Hence, for relative comparison of
structural parameters from both the Phases, the results for NCCB and SCC2B from Phase-1 are
to be compared with the results of NCC and SCC2 of Phase-2.
4.2 Project Mix Design Matrix
Based on the parameters governing the proportioning of a SCC mix (see Section 2o 1.1) and
implementing the idea of bounding the performance of all SCC mixes, as stated above, the
development of the mix design matrix for the test program is shown conceptually in Table 4-1.
As discussed earlier, the SCC behavior is achieved with the addition of certain admixtures. The
admixtures used in this research include high range water reducer (HRWR), viscosity modifying
admixture (VMA) and entrained air (EA) admixture. Mixes with low w/c ratio (SCC1) have
lower coarse aggregate content (CAC) and relatively higher sand or paste content (S/Pt).
Similarly, depending on the CAC, S/Pt content and w/c ratio, the other admixtures are increased
(+) or reduced (-) to achieve the SCC fresh properties.
55
Conclusions or recommendations in this report are the opinions of the authors. PCI assumes no responsibility for the interpretation or application of the information contained herein.
Table 4-1o Mix Design Matrix - Binding of Performance by w/c ratio
Mix w/c HRWR VMA CAC S/Pt EA
Design
SCCi 0.35 + - Less more +
SCC2 0.40 + - +
SCC3 0.45 + + More less +
NCC 0.40 - - 0.50 0.50 +
The mix designs with respect to the approaches were obtained from consultation with
Degussa Admixtures Inc. The mix designs in
Table 4-2 were used as target to be achieved to cast the test specimens at MSU’s Civil
Infrastructure Laboratory. All mixes used Type III cement and were proportioned for a target 28
day compressive strength of 48.3 MPa (7,000 psi). Local natural aggregates in agreement with
the Michigan Department of Transportation specifications for use in bridge elements were used,
namely 6AA coarse aggregates and 2NS sand. The design level of entrained air for all mixes was
6%. The HRWR, VMA, EA admixture and set-retarding (SR) admixture were provided by
Degussa Admixtures Inc. Set retardants were used to delay the initial setting time of concrete
since it had to be delivered to the laboratory via a ready mix delivery truck. In addition, the
casting process was long as it included multiple test units and material testing samples. Thus, due
to these requirements for ready mix concrete delivery, the mix designs used in the project may
vary slightly from those used in a precast plant. Casting during the first Phase of the project was
performed in summer and the quantities of set retardants used were much higher than those used
in the second Phase of the project, which was done during winter. Also, small adjustments were
needed at the laboratory to achieve good SCC fresh properties.
As discussed earlier, during the actual casting of the specimens, some of the mix designs
had to be modified on site due to variations in delivery time, moisture and temperature. The
target mix designs used in this research for both the phases were the same and are provided in
Table 4-2. The weights of the aggregates are given in saturated surface dry (SSD)
condition. Proper changes were made to take into account the moisture content of the aggregates.
As discussed NCC and SCC2 mixes in Phase-1 were repeated due to performance issues, but the
target mix design were similar. The variation of the in-situ admixtures and w/c ratio from the
56
Conclusions or recommendations in this report are the opinions of the authors. PCI assumes no responsibility for the interpretation or application of the information contained herein.
target mix designs are expressed in terms of percentage change from the original for all the
mixes.
Table 4-3 and Table 4-4 show the variations in admixtures and w/c ratios for Phase-1 and
Phase-2 mixes, respectively. The negative values indicate that less quantity of a particular
admixture was used relative to the target quantity. It should be noted that there were no changes ~
in any other component of the mix design except for water and admixture content. _Table 4-5 and
Table 4-6 give the final mix designs used in the test beams for Phase- 1 and Phase-2 respectively.
COMPONENT
Cement - Type III
Fine Aggregates.
Coarse Aggregates.
Water
Air
w/c Ratio
ADMIXTURES
Air Entraining Admixture
High Range Water Reducer
Viscosity Modifying Admixture
Set Retardant
llb/yd3=0.593 kg/m31 fl oz./cwt = 65 mL/100 kg
Table 4-2. Target Project Mix Designs
NCC
700
1216
1580
280
6%
0.40
t
6
0
6
MIX TYPE
SSD weights (lbs/yd3)
SCC1
700
1519
1380
245
6%
0.35
ft. oz./cwt
0.5
6
0
6
SCC2
700
1426
1380
280
6%
0.40
0.5
7
1
6
SCC3
700
1275
1435
315
6%
0.45
0.5
8
2
6
57
Conclusions or recommendations in this report are the opinions of the authors. PCI assumes no responsibility for the interpretation or application of the information contained herein.
Table 4-3. Changes in Admixtures for Actual Project Mixes - Phase-1
ADMIXTURES
Air Entraining Admixture
High Range Water ReducerViscosity ModifyingAdmixtureSet Retardant
w/c Ratio
MIX TYPEChanges in Admixtures relative to target mix (%)
NCCA
0.00
-33.33
0.00
-100.00
0.00
NCCB
0.00
-66.67
0.00
0.00
0.00
SCC1
0.00
33.65
0.00
16.67
0.00
SCC2A
-57.14
21.28
293.88
-100.00
5.00
SCC2B
0.00
0.00
0.00
11.56
0.00
SCC3
81.63
0.00
350.00
0.00
0.00
Table 4-4. Changes in Admixtures for Actual Project Mix Designs - Phase-2
MIX TYPEChanges in Admixtures relative to
ADMIXTURES target mix (%)
Air Entraining Admixture
High Range Water Reducer
Viscosity Modifying AdmixtureSet Retardant
w/c Ratio
NCC
0.00
0.00
0.00
0.00
0.00
SCC1
0.00
33.33
0.00
-50.00
0.00
SCC2
0.00
7.15
50.00
0.00
0.00
SCC3
0.00
-37.59
50.00
-75.00
0.00
58
Conclusions or recommendations in this report are the opinions of the authors. PCI assumes no responsibility for the interpretation or application of the information contained herein.
Table 4-5. Actual Project Mix Designs - Phase-1
NCCACOMPONENTCement - Type III
Fine Aggregates.
Coarse Aggregates.
Water
Air
w/c ratio
ADMIXTURES
Air EntrainingAdmixtureHigh Range WaterReducerViscosity ModifyingAdmixtureSet Retardant
Conclusions or recommendations in this report are the opinions of the authors. PCI assumes no responsibility for the interpretation or application of the information contained herein.
4.3 Fresh Property Evaluation
As discussed in Chapter 2, the acceptability of an SCC mix resides on its ability to satisfy
performance criteria that defines the concrete as self-consolidating, namely to be have a highly
flowable and cohesive mix. Details on the different test methods were given in Section 4.3. A
brief discussion and results of the tests performed in this research is given in the following sub-
sections.
4.3.1 Slump Spread and Visual Stability Index (VSI)
The slump spread and visual stability index tests were performed. If the concrete
flowability and cohesiveness performance was satisfactory then the other tests (J-Ring and L-
Box) were performed. The flat base plate was kept on leveled ground and was slightly moist with
water. All tests were consistently performed with an inverted cone by the same person. The
concrete was filled in the cone with a scoop and no tamping was done. Any excess concrete
around the cone base was removed and the cone was lifted vertically allowing the SCC to flow
freely. The diameter of the-spread was measured in perpendicular directions. The average of the
two measured diameters was calculated. The stability of the mixture was rated by visual
inspection of the spread concrete. The results of the slump spread values before casting for all
the SCC mixes of both Phases and their VSI ratings are shown in Table 4-7.
It should be noted that the slump spread is a characteristic of a given batch of a particular
mix. Theoretically, a similar mix design should give a similar slump spread for all the batches. In
this project, although similar mix designs were repeated in both the Phases of the project,
weather conditions (temperature and humidity) were very different. Hence the slump spread
values were different for ~ similar mix for each of the research Phases. As discussed earlier,
SCC2A was the first SCC mix cast in this project and had some performance problems. Hence,
the SCC2B mix of Phase-1 is the one considered for all the comparisons with the SCC2 mix of
Phase-2. The sequence of performance of the SCC slump test and visual stability tests is shown
in Figure 4-1.
60
Conclusions or recommendations in this report are the opinions of the authors. PCI assumes no responsibility for the interpretation or application of the information contained herein.
MIX
Table 4-7. Slump Spread and VSI rating of SCC mixes.
Phase-1 Phase-2
Average slump. Spread VSI Average slump Spread
mm
533
in.
27.0
25.0
24.5
27.0
Rating
0.0
0.5
0.0
1.0
in,
21.0
mm
SCC1 686 :
SCC2A 635
SCC2B 622 508 20.0 0,0
SCC3 686 559 22.0 0.0
VSIRating
0.0
a) Slump Spread test apparatus
c) Step 3 - Cone lifted vertically
b) Step 1 - Cone Filled with SCC
d) Step 4 - Measurement of spread
Figure 4-1 - Slump Spread test
61
Conclusions or recommendations in this report are the opinions of the authors. PCI assumes no responsibility for the interpretation or application of the information contained herein.
4.3.2 J-Ring Test
The J Ring test is used to determine the passing ability of SCC. The procedure is
essentially the same as for the slump spread test with the exception that a ring with equally
spaced bars simulating reinforcement is placed concentrically- around the slump cone. (Figure
4-2). The cone is lifted and the SCCis a!lowed to pass through the reinforcement ring. The
spread in pe~endicular directions is measured as slump spread test. Visual examination of any
segregation or bleeding is also done. The values of concrete spread with J-Ring were compared
with the values of slump spread without the J-Ring. The smaller these differences were, indicated
the better passing ability of the concrete. Table 4-8 shows the results obtained from the slump
spread in the presence of the reinforcement ring. These values should be compared to those
without a ring listed in Table 4-7. The J-Ring measurements were not taken for SCC2B mix as
the mix was stiffening rapidly.
Table 4-8 also shows the J-Ring value calculated as explained in Chapter 2. As discussed
earlier, Phase-2 mixes casting was done in cold weather conditions and thus a reduced amount of
set retardants were used in all SCC mixes relative to the Phase-1 mixes (except for SCC2 mix
where complete set retardants as per target mix design was used). All of the SCC mixes in Phase-
2 showed very good SCC fresh properties, i.e., flowability, passing ability and lack of
segregation. At the same time, the initial slump spread values were much lower for Phase-2
mixes Table 4-7. Hence the J-ring test was not performed for all SCC mixes of Phase-2 except
SCC2. The average slump spread for the SCC2 mix of Phase-2 with the J-Ring was 406.4 mm
(16 in.) and the J-Ring value was computed to be 6.35 ram.
Table 4-8. J - Ring Slump Spread and J-Ring Values - Phase-1
MIXAverage J-Ring Slump
Spreadmm
635
521
in.
25.0
20.5
J- Ring Value
mm
6.35
9.53
in.
0.25
0.38
SCC1
SCC2A
SCC2B - -
SCC3 597 23.5 0.00 0.00
62
Conclusions or recommendations in this report are the opinions of the authors. PCI assumes no responsibility for the interpretation or application of the information contained herein.
b) J - Ring test in Progress
Figure 4-2 J - Ring Test
According to the PCI Interim guidelines, the higher the slump spread the better the
performance. The PCI Interim guidelines [46] commentary for slump spread also states that for
an application that has a high level of reinforcement, a slump flow less than 559 mm (22 in.) is
not recommended. All the mixes in the Phase-1 except SCC2A (stiff mix) achieved this value. In
Phase-2 this value was achieved only by SCC3 mix. Nevertheless, the amount of reinforcement
in the test units can be considered low and the mixes were found to be flowable, stable and with
good passing ability.
Similarly, the passing ability is determined by J-Ring value. The method of obtaining the
J-Ring value is explained in Section 4.3.2. According to PCI Interim guidelines, satisfactory
63
Conclusions or recommendations in this report are the opinions of the authors. PCI assumes no responsibility for the interpretation or application of the information contained herein.
passing ability is achieved when the J-Ring value is less than 15 mm (- 0.59 in.) and acceptable
passing ability is achieved when the J-Ring value is around 10 mm [46]. The passing ability of
the SCC mixes used in this project can be considered to have acceptable or satisfactory as the
amount of reinforcement in the actual test units where much lower than that represented by the J-
Ring used. :
4.3.3 L - Box Test
The L-Box test assesses the flow of SCC and also the extent to which it is subjected to
blocking by reinforcement [46]. The test apparatus comprises of a rectangular cavity in the shape
of "L" with reinforcement. The level of reinforcement can be changed to enforce severe or light
restraints depending on the actual reinforcement blocking of the structure. This opening is
controlled by a gate. The SCC is placed in the vertical cavity without any vibration and held
there for a minute. The gate is then opened for the SCC to flow into the horizontal cavity. After
the flow is complete the heights of SCC in the vertical chamber (H1) and the horizontal chamber
(H2) are measured. The ratio of "H2/HI" is termed as the "blocking ratio". If the SCC flows as
freely as water, at rest, it will be horizontal, so H2/HI=I. Thus, the closer the blocking ratio is to
unity, the better is the passing ability. The segregation of aggregates, if any can be easily noted in
the vertical chamber. The L-Box used in this test had 3 numbers of 12.5 mm (0.5 in.) rebar with
a spacing of 35 mm (1.375 in.) which is the same as given in PCI Interim guidelines [46] (Figure
2-4). L- Box test was not performed for Phase-2 mix designs. The L-Box results obtained for the
various SCC mixes (Phase-l) are reported in Table 4-9. According to PCI Interim guidelines
[46], a value of blocking ratio less than 0.75 may cause potential problems in medium and high
levels of reinforcement. Except SCC3 mix in Phase-i, all mixes achieved this value. The lower
value of blocking ratio for SCC3 is not concerning taking into consideration that the test units
have low reinforcement content.
Table 4-9 L- Box Blocking Ratio
MIX Blocking Ratio(H2/H1)
SCCI 0.80
SCC2A 0.86
SCC2B 0.77
SCC3 0.69
64
Conclusions or recommendations in this report are the opinions of the authors. PCI assumes no responsibility for the interpretation or application of the information contained herein.
Figure 4-3 L- Box Test Apparatus
4.4 Challenges in SCC Quality Control and Quality Assurance
The SCC used in this project was proportioned with a ready-mix concrete company and
delivered to Michigan State University’s Civil Infrastructure Laboratory (CIL) in a concrete
mixer truck. The travel time for the concrete mixer to reach the laboratory was approximately 30
to 45 minutes. In the first SCC mix (SCC2A), all of the admixtures were added at the plant and
by the time the truck reached the lab the fresh property behavior was not typical of SCC (low
fluidity). In addition, no set-retarding agents (stabilizers) were used. Substantial addition of
HRWR’s was needed to achieve SCC behavior. It was thus determined that it was difficult to
achieve proper SCC behavior with long delivery times, use of Type III cement, and the hot
climate conditions of summer. In order to delay the initial setting time, set retarding agents
(stabilizers) were used for all the future mix designs. Also, it was found that the order of
admixtures addition plays a vital role in the setting time and behavior of the SCC mix. In order to
avoid the issues of rapid setting and to achieve the target fluidity, not all of the admixtures were
added at the ready mix plant. Aggregates, cement, water, air entraining agent and set retarding
agent were added at the plant. The high range water reducer (HRWR) and viscosity modifying
admixture (VMA), if any, were added at the laboratory, and in that order. These admixtures were
added individually and mixed in the truck drum for approximately 5-10 minutes before the next
65
Conclusions or recommendations in this report are the opinions of the authors. PCI assumes no responsibility for the interpretation or application of the information contained herein.
admixture was added. The fresh behavior of SCC was evaluated after all of the admixtures were.
added. In some cases it was found that proper fluidity and/or stability of the SCC mix was not
achieved-or not satisfactory. Hence additional quantities of admixtures were added to achieve the
desired SCC behavior. As a result, the actual SCC mixes deviated slightly from the target mix
design (see Table 4.-3 and Table 4-4). This deviation was mainly in the content of admLxtures.
It was also found that the weather conditions at the site play a vital role in achieving ~the
desired SCC behavior. In the absence of set retarding admixtures, although proper fluidity was
obtained initially, the mixes set/harden rapidly. This effect was found to be more pronounced
with the Phase-1 mix designs as most of them were cast in relatively warmer temperatures
(summer). The Phase-2 test units were cast during peak winter season with very cold conditions.
Hence the quantity of set retarding agents was reduced from the target mix design. While the
effect of rapid initial setting was also observed in Phase-2 test units, this effect was relatively
lower. In either case, the unique SCC fresh properties had a very short "shelf life" and thus
needed to be poured into the forms as soon as the fresh properties were deemed satisfactory. This
may pose a problem if large numbers of relatively smaller structural units need to be made from
the same batch, as the fresh properties of the units cast initially will be different from those that
were cast at the end of the same batch. This may not be a problem in the precast/prestress
industry as the mixed concrete is immediately poured into units that are relatively large in size
and issues like travel time and rapid setting of mix will have less of an effect on the fresh
behavior of the mix design.
The desired target properties for the NCC mix were achieved without any problem. This
reflects the significant experience with conventional concrete mix designs. Conversely, even
though SCC was introduced in the early 1980’s, it is still relatively new to the industry. In spite
of much research work done in fresh concrete properties and mix designs of SCC, achieving the
same target mix is not easily done in the field, as climate conditions and aggregate properties
may vary significantly. More research on various practical difficulties needs to be performed in
collaboration with industry and admixtures experts to make SCC achievable, controllable and
available to industry as easily as NCC.
66
Conclusions or recommendations in this report are the opinions of the authors. PCI assumes no responsibility for the interpretation or application of the information contained herein.
4.5 Hardened Concrete Property Evaluation ,
Since the target engineering prope~ies of hardened SCC should be the same as those for
conventional concrete, the same tests and procedures that are used for conventional concrete
were used for SCC. Tests were performed on concrete cylinders of following dimensions: 101.6
mmx 203.2 mm (4"x8"). Compressive strength, modulus of elasticity and split tensile strength
tests were performed in accordance with ASTM C39, ASTM C469 and ASTM C496 standards,
respectively. Compressive and split tensile strength tests were performed at 1, 3 (day of prestress
release), 7, 14, and 28 days for Phase-1 mix designs. Also for Phase-l, elastic modulus tests were
performed at the day of release (3 days) and at 28 days of age. Since extensive material
characterization was done in Phase-1, only compressive tests were performed for Phase-2. The
compressive strength for Phase-2 mix designs were performed at 3 and 28 days. In both project
phases, tests were also performed at the day of flexural testing, where the average age of
concrete was approximately 110-130 days for Phase-1 test units and 28-50 days for Phase-2 test
units.
4.5.1 Compressive Strength (f’~)
The target compressive strength (f’c) for all mix designs used in this project was 48.26
MPa (7000 psi) at 28 days. Also at release of prestress the target compressive strength for all mix
designs at release was 27.57 MPa (4000 psi). The compressive strength tests were performed in
accordance with the ASTM C39 standards. Three concrete cylinders were tested for each test.
Table 4-t0 shows the average compressive strength values and their standard deviation
for concrete ages varying from 1 to 28 days for all the mixes of Phase-1. Table 4-11 shows the
compressive strength and the standard deviation for all mixes of Phase-1 at the day of flexural
testing (-110-130 days). Figure 4-4 shows the variation of compressive strength with the age of
concrete. Due to improper functioning of the equipment, 14 day test results are not available for
SCC1.
Similarly, Table 4-12 shows the compressive strength values and its standard deviations
for all mixes of Phase-2. Figure 4-12 summarizes the compressive strengths at 28 days for Phase-
2 test units.
67
Conclusions or recommendations in this report are the opinions of the authors. PCI assumes no responsibility for the interpretation or application of the information contained herein.
Titble 4-10. Compressive Strength ( f’o ) Test Results - 1 to 28 days - Phase-i
It can be observed from Table 4-10 and Figure 4-4 that the target strength at day of
release (3 days) was achieved by all mixes of both the phases. However, cylinder test results
indicate that the 28 day target strength was not achieved by all mixes in Phase-2. While these
values were not far away from the design target strength, the lower strengths are attributed to the
68
Conclusions or recommendations in this report are the opinions of the authors. PCI assumes no responsibility for the interpretation or application of the information contained herein.
fact that the test cylinders were cured under laboratory conditions, which during winter had very
low humidity levels. The cylinders were left to cure-in the laboratory floor to reflect the same
conditions on the test beams. This was equally done for Phase-1 and Phase-2. However, Phase-1
casting took place during summer and Phase-2 during winter. Thus the humidity conditions wer_e
considerably different. The beam units were moved outside the laboratory after prestress release.
Thus their curing environment beyond this point and until their day of test was outside winter
weather conditions. While the effect of curing conditions on the beam units is not known with
certain~, the researchers believe that the effect was !ower. This was corroborated daring the
flexural tests, w_hen the capacities closer to the expected concrete strengths were achieved. Thus,
the research team does not suspect any significant effect on the transfer and development lengths
because of these slightly lower strengths of the Phase-2 mix designs. It should be noted that the
target strength was met at release of prestress which is consistent with the Phase-1 test units and
hence the transfer length values at prestress release are unaffected by these relatively lower 28
day strengths of Phase-2 mix designs.
MIXNCCB
SCC1
SCC2A
SCC2B
SCC3
Table 4-11. Compressive Strength at Day of Test - Phase- 1
Age of Concreteat Day of Test
CompressiveStrength
StandardDeviation
(days)133
124
118
119
120
MPa
48.4
61.9
63.5
64.7
55.0
(psi)
7018.3
8973.3
9209.0
9378.3
7971.3
MPa
2.1
2.2
7.7
7.8
1.4
(psi)
302.69
322.27
1121.69
1131.81
199.62
69
Conclusions or recommendations in this report are the opinions of the authors. PCI assumes no responsibility for the interpretation or application of the information contained herein.
Figure 4-4. Compressive Strength variation with time - All Mixes
Table 4-12. Compressive Strength at all ages.- Phase-2
AGE
3 days
28 days
MIXCompressive
Strength
StandardDeviation
CompressiveStrength
MPa(psi)MPa(psi)MPa(psi)
NCC33.4
(4843.6)0.1
(10.7)39.8
(5778.7)
SCC128.1
(4078.1)0.7
(95.1)31.2
(4527.3)
SCC230.1
(4370.3)2.8
(412.0)39.8
(5775.9)MPa(psi)days
MPa
SCC332.0
(4640.7)0.9
(131.1)35.0
(5081.6)StandardDeviation
AgeCompressiveStrength *
StandardDeviation
2.3
(329.2)58
38.81
0.4(54.0)67
32.78
2.1(306.1)
6941.31
Day ofTest (psi) (5629.0) (4754.0) (5991.5)
MPa 2.02 2.70 0.35(psi) (293.2) (391.4) (51.0)
0.2(24.2)77
38.63
(5603.0)0.97
(141.2)
7O
Conclusions or recommendations in this report are the opinions of the authors. PCI assumes no responsibility for the interpretation or application of the information contained herein.
4.5.2 Elastic Modulus Test
The average Elastic modulus (Ec) was calculated as per the ASTM C469 standards and
was compared with the values obtained from the ACI-318-08 [3] as given in Equation (3-1).
Ec,co,~e =4730~c (N/mm:)(3-1)
E c,~oae : 57000X/~ (psi)
Table 4-13 and Table 4-14 and show the values of the modulus of elasticity for the Phase-1 mix
designs obtained both experimentally and from the ACI code expression and their relative
comparison, for 3 and 28 days, respectively. Due to improper fhnctioning of testing equipment,
reliable values of E~. could not be obtained for the SCC1 and SCC2A mixes at 3 days and for the
SCC2B mix at 28 days. Sample plots of the compressive stress-strain response (28 days) for
each of the mix designs showing the calculation of the modulus of elasticity are provided in
Figure 4-5 to Figure 4-8. Detailed individual plots are shown in Appendix A. Elastic modulus
tests were not performed for the Phase-2 mixes.
MIX
Table 4-13. Elastic Modulus Tests at 3days - Phase-1
MPa (ksi)StandardDeviation
171.1
(24.8)
Ec, code
MPa (ksi)StandardDeviation
246.5(35.8)4471.5(648.5)9686.0
(1404.7)2356.2(341.7)717.7
(104.1)
Ec.,,,eas I Ec, code
Average Average
27949.2 29268.1NCCB 0.95
(4053.2) (4244.5)34456.4
SCC1 - -(4996.9)34474,8
SCC2A - -(4999.5)
29880.4 2162.4 33877.5SCC2B 0.88
(4333.3) (313.6) (4912.9)28204.7 3411.7 31796.1
SCC3 0.89(4090.2) (494.8) (4611.1)
71
Conclusions or recommendations in this report are the opinions of the authors. PCI assumes no responsibility for the interpretation or application of the information contained herein.
MIX
NCCB
scc1
SCC2A
SCC2B
SCC3
Table 4-14. Elastic Modulus Tests at 28 days- Phase-1
Figure 4-5. Typical Stress-Strain Response - NCCB - 28 days
72
Conclusions or recommendations in this report are the opinions of the authors. PCI assumes no responsibility for the interpretation or application of the information contained herein.
6O
~ 54
~ 42
~ 36
¯ ~ 3oP 24
o 18
12
O~0 250 500 750
9OOO
6000
5000
4000
3000
2000Ec = Elastic ModulusEc = 29,300 Mpa lOOO
= 4,249,249 psio
lOOO 125o 15oo 175o 2000 2250 2500 2750 3000 3250
8000
7000
Compressive Strain (micro strains)
Figure 4-6. Typical Stress-Strain Response - SCC1 - 28 days
66
60
¢ 54n~ 48v
u~ 42
u3 36
¯ ~ 30
=- 24
Eo 18
12
00
EcEc = ElasticEc = 37,707 Mpa
250 500 750 1000 1250 1500 1750 2000
9000
6000
5000
4000
3000
2000
1000
02250 2500 2750 3000
8000
~-~
Eo
Compressive Strain (micro strains)
Figure 4-7. Typical Stress-Strain Response - SCC2A - 28 days
73
Conclusions or recommendations in this report are the opinions of the authors. PCI assumes no responsibility for the interpretation or application of the information contained herein.
54
48
42
36
30
24
18
12
6
00
Ec
8000
7000
6000
5000
4O0O
3000
2000
1000
0250 500 1000 1250 1500 1750 2000 2250 2500 2750
Compressive Strain (micro strains)
Figure 4-8. Typical Stress-Strain Response - SCC3 - 28 days
4.5.3 Split Tensile Strength
As previously mentioned, split tensile strength (f’~) tests were performed in accordance
with the ASTM C469 standard for all mixes in Phase-1. Table 4-15 shows the average split
tensile strength values and their standard deviation for concrete ages varying from 1 to 28 days,
while Table 4-16 shows the split tensile strength and the standard deviation at their respective
days of flexural test. Figure 4-9 shows the variation of split tensile strength with the age of
concrete. Due to large variation of results and improper functioning of testing equipment, some
of the data was considered unreliable and was not included in the results given here. Thus, Table
4-15 and Table 4-16 below have some blank spaces. As discussed earlier, split tensile strength
tests were not performed for Phase-2 mixes.
74
Conclusions or recommendations in this report are the opinions of the authors. PCI assumes no responsibility for the interpretation or application of the information contained herein.
MIX
Age OfConcrete(Days)
Table 4-15. Split Tensile Strength - 1 to 28 Days - Phase-1.
NCCBAverageTensile
StrengthMPa(psi)3.0
StandardDeviation
MPa(psi)
0.4
SCC2Ascc!
StandardDeviation
MPa(psi_)
0.5
(73.0)
0.0
(0.0)
0.4
(58.0)
0.2
(33.0)
0.2
(33.0)
AverageTensile
StrengthMPa(pSi)
AverageTensile
StrengthMPa(psi)3.6
(515.0)3.6
(519.9)3.9
(572.0)3.7
(540.6)
4.0
(581.1)
StandardDeviation
MPa(psi)
(434.4) (65.0)
4.0 0.53 -
(574.95) (68)
2.9 0.8 4.0 0.57
(424.28) (120.0) (574.95) (68)
3.7 0.2 4.0 0.114
(540.63) (33.0) (583.57) (8)
4.1 0.628 -
(596.33) (88)
SCC2BMIX
Age OfConcrete
(Days)
1
3
7
14
28
AverageTensile
StrengthMPa(psi)3.6
(528.5)
3.7
(534.3)
4.0
(572.9)
4.1
(589.47)
StandardDeviation
MPa(psi)
0.4
(64.0)
0.1
(11.0)
0.8
(111.1)
0.3
(4O.O)
AverageTensile
StrengthMPa(psi)3.5
(509.0)
3.7
(532.2)3.9
(569.1)
3.9
(569.3)
SCC3
StandardDeviation
MPa(psi)
0.5
(73.0)
0.5
(121.0)
0.8
(82.0)
0.2
(36.0)
75
Conclusions or recommendations in this report are the opinions of the authors. PCI assumes no responsibility for the interpretation or application of the information contained herein.
MIX
NCCB
SCC1
SCC2A
SCC2B
SCC3
Table 4-16. Split Tensile Strength - Day of Test - Phase-1
Ag~atDay ofTest
(days)133
124
118
109
120
Average Tensile Strength
3.75
4.25
4.30
4.34
4.00
psi
544..54
6~5.7J
623.76
629.47
580.33
Standard Deviation
MPa
0.78
0.81
1.50
1.51
0.63
psi
113.00
117.00
218.00
219.00
92.00
4.75
4.50
4.25
4.00
3.75
3.50
3.25
3.00
700
~ NCCB+ SCC1~ SCC2A+ SCC2B-+- SCC3
650 u~
600 ~
550 U~
500 ~
450 U~
20 40 60 80 100 120Age Of Concrete (days)
400140
Figure 4-9. Split Tensile Strength variation with Time - Phase-1
76
Conclusions or recommendations in this report are the opinions of the authors. PCI assumes no responsibility for the interpretation or application of the information contained herein.
4.5.4 Discussion of Results - Hardened Test properties
The target compressive strength at 28 days for all mixes was 48.3 MPa (7000 psi). It was
found that a!! the mixes of Phase-i had compressive strengths much beyond this target value at
28 days. Figure 4-10 shows the variation of the_compressive strengths at 28 days for Phase-1
mixes. The results show that the compressive strength at 28 days was approximately 2% lower
than the designed target for NCCB and was greater than the design target by 11% - 25% for the
SCC mixes. Considerable research in all aspects an-d extensive use of NCC has made it possible
to control the hardened properties of NCC with more confidence. It seems as if the same amount
of control and confidence has not been achieved with SCC.
From the elastic modulus at 28 days of concrete age (Figure 4-11 and Table 4-14) it was
observed that the measured value of NCCB was 7% lower than that predicted by the ACI code,
whereas SCC1 and SCC3 had lower measured modulus by 13% and 11%, respectively, relative
to the code predicted values. Figure 4-11 shows the relative comparison of the elastic modulus
for the various mixes. Due to technical problems with the testing equipment, SCC2B modulus
tests at 28 days could not be performed. SCC2A showed no variation with respect to the code
predicted values. It should be noted that SCC2A was a very stiff mix and the performance of the
mix was poor and hence the reliability of the data is questionable.
65 Mix Design60 Target
55
50
45
40
35
30
25
20
15
10
5
10000
8000
6000 -
.>4000
Eo
2000
NCCB SCC1 SCC2A SCC2B SCC3
MIX TYPEFigure 4-10. Comparison of Compressive Strength at 28 days - Phase-1.
77
Conclusions or recommendations in this report are the opinions of the authors. PCI assumes no responsibility for the interpretation or application of the information contained herein.
Overall, the SCC mixes showed a larger variation in elastic modulus compared to the code
predicted values than the NCC mix. The results reiterate the fact that much control in hardened
properties has not yet been gained in SCC mix proportioning relative to NCC mix design. It
should also be noted that the variations in SCC hardened properties may also be due to the
various mix propo~ions used,!n fact, SCC1 and SCC3 are mixes obtained from two different ¯
approaches and differences in strength and modulus are to be expected. SCC2B is the only mix
relatively similar to NCCB mix. Figure 4-12 shows the compressive strength at 28 days of the
Phase-2 mixes. It can be-seen that the target mix design value of 48.3 MPa (7000 psi) was
apparently not achieved by anyof the mixes. As discussed earlier, these mixes were cast during
extreme cold weather conditions. The temperature inside the laboratory with heating conditions
and low humidity was entirely different from those existing outside in the actual beams. Also,
the heating conditions in the laboratory during winter conditions create a mostly dry
environment. This dry environment is suspected to have caused loss of water from the test
cylinders and hence affected the curing process. Thus, considerable variation was seen in the
compressive strengths of Phase-2 test cylinders.
6e+640000 ~ Ec measured
~ Ec ACI-318
35000 5e+6 ~
30000 ~4e+6 ~
25000 o
20000 3e+6 ~
15000 o2e+6 ~;
10000 ~le+6 ~
5000
NCCB SCCl SCC2A SCC2B SCC3
MIX TYPE
Figure 4-11. Measured vs. ACI Predicted Elastic Modulus at 28 days - Phase 1
78
Conclusions or recommendations in this report are the opinions of the authors. PCI assumes no responsibility for the interpretation or application of the information contained herein.
j Mix ~Design Target8000
7000
6000
5000
4000
3000
2O00
1000
NCC SCCl SCC2 SCC3MIX TYPE
Figure 4-12. Comparison of Compressive Strength at 28 days -Phase-2
Nevertheless, the research team does not suspect any significant effect on the transfer and
development lengths because of the slightly lower strengths of the Phase-2 mix designs. It should
be noted that the target strength was met at release of prestress which is consistent with Phase-1
test units and hence the transfer length values at prestress release were unaffected by the
relatively lower 28 day strengths of the Phase-2 mix designs. The beam units were moved
outside the laboratory after prestress transfer. Thus, their curing environment beyond this point
and until their day of test was the outside weather conditions. Correspondence between the tested
cylinder strength (at 28 days) and the concrete strength in the actual beams is thus questionable.
79
Conclusions or recommendations in this report are the opinions of the authors. PCI assumes no responsibility for the interpretation or application of the information contained herein.
CHAPTER 5 TEST PROGRAM - INTRODUCTION
The effect of bond on transfer and development length of precast/prestressed girders built
using SCC was evaluated through a structural testing program described herein. The
experimenta! study is based on evaluating transfer and development lengths for !3 rnm (0.5 ~in.)
diameter strand in laboratory scale precast/prestressed beams made from different SCC mixes
such as to evaluate the effect of SCC mix proportioning on strand bond behavior. The test
program-was performed in two phases. In the firstphase, two beams for each of the program_ mix
designs (NCCA, NCCB, SCC1, SCC2A, SCC2B and SCC3 - Table 4-5) were constructed and
used in the study. After the completion of the first phase, the bond quality of the strand used in
the experimental program was questioned and hence, a partial repetition of the experimental
program was conducted on a second phase with a pre-qualified strand. In the second phase, one
beam for each of the program mix designs (NCC, SCC1, SCC2 and SCC3 - Table 4-6) were
constructed and used in the study. This section discusses the design of the beam test units, their
nomenclature and their fabrication process.
5.1 Specimen Design & Nomenclature Used.
5.i.1 Specimen Design
The test units consisted of precast/prestressed T-beams with two 13mm (0.5 in.) diarneter
prestressing stands and nominal compression and shear reinforcement (Figure 5-1). The strain
level in the prestressing strand has been identified to be an important parameter in the
discrepancy of experimentally obtained values for development length [9]. Experimental values
from most test programs suggest that the average bond strength is lower in test units with large
strand strains at failure (e.g., near the guaranteed ultimate elongation) as compared to specimens
that failed with strains near the yield strain (0.010) [9]. Therefore, the beams for this study were
designed such that the strain demand on the strands was closer to the guaranteed ultimate
strength. Seven wire low relaxation 1860 MPa (270 ksi) Grade strands with a nominal diameter
of 13 mm (0.5 in.) were used. The beam length was 11.58 m (38 fi) in length with the goal of
being able to perform two flexural tests per beam (one for each end). The prestressing strands
were completely bonded. Nominal shear reinforcement was provided with 6 mm (0.25 in.)
diameter smooth stirrups. The U-shaped stirrups were placed at 305 mm (12 in.) spacing through
80
Conclusions or recommendations in this report are the opinions of the authors. PCI assumes no responsibility for the interpretation or application of the information contained herein.
out the length of the beam except at the ends where_ they were spaced at ! 52 mm (6 in.) for a
length of 610 mm (24 in.) An elevation drawing showing the reinforcement details is given in
Figure 5-2.
mrs
Figure 5-1 Test Specimen - Cross Section Details
5.1.2 Nomenclature
In Phase-i of the project, two test specimens were cast at a time for each mix. In Phase-2
only one test unit was cast per mix. For transfer length measurements, strains on both sides of the
beam web were measured. The test unit identification nomenclature used for both phases of this
project for transfer length studies is summarized in Figure 5-3.
The identification nomenclature used for the development length tests was similar to that
of the transfer length nomenclature. Flexural tests to determine the development length were
performed on both the ends of the beams. The only difference in the nomenclature for
development length is the removal of the "side" identifier from the nomenclature for transfer
length tests. Thus, for Phase-1 tests, "SCC2B-PI-I-A" refers to the development length test of
the first beam of SCC2B mix and the test being performed at beam end A. Similarly, for Phase-2
test specimens "SCC2-P2-I-A" refers to the development length test of the SCC2 mix beam at
end A.
81
Conclusions or recommendations in this report are the opinions of the authors. PCI assumes no responsibility for the interpretation or application of the information contained herein.
# 2 - U Stirrups @ 6 " c/c onlyfor 24" from the beam supports
Conclusions or recommendations in this report are the opinions of the authors. PCI assumes no responsibility for the interpretation or application of the information contained herein.
Type of Concrete:SCC - Self Consolidating ConcreteNCC - Normally Consolidated Concrete
End at which measurementtaken:
A: West endB: East end
Side of the web where transfer length is measured with respectto thecut end. 1" North side, 2: South side l
. SCCl X- B #- SIDE - END
NCCA,
SCC has three mixes Beam Number:viz. 1, 2 & 3
Repeat Number "a or b"NCC & SCC2 have two m~xes:NCCB, SCC2A, SCC2B
1 or 2. Each mix has two beams
Example: SCC2B - 2 - 1 - B : means, transfer length reported is measured at theeast end on side 1 (facing north) from the 2nd beam of the second SCC mix.
For Phase-2 beams, only one test unit per mix was made and there were norepeated tests, hence "B #" is replaced by "P2" and repeat number "X" is removed.
Figure 5-3 Nomenclature for Transfer Length
5.2 Material Properties
5.2.1 Concrete
Fresh property tests on concrete were performed for every mix before acceptance for use
in the beam units. Results on the fresh concrete properties of the SCC mixes are described in
Section 4.3. The hardened concrete material properties were determined at various ages of
concrete. The targetf’~ at 28 days for all mix designs was 48.3 MPa (7000 psi) and was achieved
or exceeded by all the mixes used in Phase-1 of the project. In Phase-2 of the project, the
freezing weather conditions and improper humidity conditions inside the laboratory led to
problems in curing of the specimens and the measured compressive strengths at 28 days were
below the design strength. In Phase-1 of the project, compressive strength and split tensile
strength were performed at 1, 3, 7, 14, 28 days of age of concrete. The modulus of elasticity tests
83
Conclusions or recommendations in this report are the opinions of the authors. PCI assumes no responsibility for the interpretation or application of the information contained herein.
were performed only at 3 and 28 days of age of concrete. For Phase-2 only cornpressive strength
tests were performed at 3 and 28 days, Results of the hardened concrete properties for Phase-1
and Phase-2 are gi~’en in Section 4.5.
5.2.2 Prestressing Steel
As discussed in Section 1.4, the pretensioning reiwforcement used for the two Phases of
this project was different. After the completion of the first Phase of the project, it was observed
that the pull-out strengths were lower and that the experimental development lengths
(CIL~PTER 8) obtained were relatively higher than expected. Based on these results, the bond
quality of the strand was questioned. The pull-out tests performed in this research (Chapter 6)
differed from the specific large block pull-out test (LBPT) procedure for strand qualification
(Section 2.6) prescribed by Logan [34] . In order to check the qualification of the strand, strand
samples used in this research were independently tested by Logan [36]. The results and
properties of each of the strands used in both the Phases are described in the following sections
5.2.2.1 Phase-1 Strand
The pretensioning reinforcement used in the Phase-1 test beams was 13 mm (0.5 in.)
sectional area was 97.870 mm2 (0.152 in2). The modulus of elasticity and guaranteed minimum
elongation provided by the manufacturer was 196 GPa (28,400 ksi) and 0.035 in./in. (3.5%),
respectively.
The same strand was used for all test beam specimens for all the mix designs. As discussed
earlier (CHAPTER 4), the bad performance of the first SCC2 concrete mix (SCC2A) required
that the test units be repeated. Hence, a new set of strands from the same p_ool, but two months
later were obtained from the Premarc Corporation. The new set of strand pieces, however, had
slight rust on its surface. The rust condition was minor. Nonetheless, in order to avoid disturbing
the relative performance of the SCC mixes, the clean non- rusted strands (Figure 5-4a) were used
for all SCC mix designs and the slightly rusted / pitted strand (Figure 5-4b) was used for the
NcCB beams.
84
Conclusions or recommendations in this report are the opinions of the authors. PCI assumes no responsibility for the interpretation or application of the information contained herein.
(a) Clean Strand (b) Slightly pitted Strand
Figure 5-4 Strand Condition - Phase-1
5.2.2.2 Phase-2 Strand
In Phase-2 of the project, all the test units used prequalified strand donated by Stresscon
Corporation. The strand has been shown to exceed code bond requirements and lead to full
flexural capacities with 80% of the code-required development length. All test units used the
same strand which also had uniform surface conditions. The strands were low-relaxation seven-
wire strand of Grade 1860 MPa (270 ksi) with a nominal diameter of 13 iron (0.5 in.). The
nominal cross sectional area was 99.355 mm2 (0.154 in2). The modulus of elasticity and
guaranteed minimum elongation provided by the manufacturer was 200 GPa (29,000 ksi) and
0.035 in./in. (3.5%), respectively.
5.2.2.3 Results of Strand Pre-qual~l~cation
Figure 5-5 shows the results of the pull-out tests on strand specimens used in this research
as performed by Logan [36] in full accordance to his LBPT protocol. The "B-control" strand is
the benchmark strand used by Logan to compare to other strands and the same one used for the
Phase-2 of this study. For the pretensioning strands used in Phase-1, the slightly rusted strand
(used in NCCB mix) met the peak pull-out force requirement of 160 kN (36 kip), but did not
reach the first slip requirement. The new (i.e., clean/shiny) strand used for all SCC mixes did not
meet the pull-out force requirements prescribed by Logan’s LBPT requirement [34]. These
results are shown in Figure 5-13. Thus the strand used in the first phase of this research does not
seem to qualify the bond quality requirements with respect to the criteria prescribed by Logan
85
Conclusions or recommendations in this report are the opinions of the authors. PCI assumes no responsibility for the interpretation or application of the information contained herein.
[3@ Unfortunately, the LBPT evaluation by Mr.Logan came as an afterthought to the research
team upon noticing the longer development lengths (CHAPTER 8) observed in this research. The
research team did not pursue this qualification tests earlier as they had no reason to doubt the
quality of the strand being used. The poor performance of the strands obviously raised concerns
regarding the validity of the results from Phase-1 o£ithis research program, as discussed earlier in
this section, and the respective results presented in Chapters 5, 6 and 7 on pull-out, transfer and
development length studies, respectively. Hence a partial repetition of the experimental program
was done with a prequalified strand in the Phase-2 of this research, which is the benchmark
strand labeled Bb in Table 5-1 and Figure 5-5.
220
20O
180
160
U. 140~ 120
~.100
60
~ 40
2O
Used in Phase-1Used in Phase-2
~ At First MovementAt Bond Failure
B-Control b New/Clean a SR - Slightly rusteda
MIX TYPE
Figure 5-5. Results from LBPT performed by Logan according to [36]
50
45
86
Conclusions or recommendations in this report are the opinions of the authors. PCI assumes no responsibility for the interpretation or application of the information contained herein.
_Table 5-1. Pull~Out Tests Results ~ Performed by Logan .
Strand Type
FirstSlip
Load(kips)22.8B-Control b
New/Clean a 7.9
SR- Slightly rusted a 12.9a Used in Phase- 1b Used in Phase-2 1 kip= 4.448 kN
StandardDeviation
(kips)3.37
0.83
1.23
Peak Pull-out Force
(kips)40.5
31.3
37.7
S~andardDeviation
(kips)2.31
2.91
1.43
5.3 Specimen Fabrication
The beam units were fabricated at Michigan State University’s Civil Infrastructure
Laboratory. The fabrication process can be grouped into four steps: a) assembly of formwork, b)
prestressing operation, c) placement and curing of concrete, and d) release of prestress. A brief
description of the fabrication process is explained in the following:
The tbrmwork assembly with the reinforcement and prestressing tendons in place is shown
in Figure 5-6. The strands were pretensioned by anchoring them to reaction concrete blocks post
tensioned to the laboratory strong floor. The strands were pretensioned individually using a
hydraulic jack to a level of approximately 75% of ultimate after anchor-set losses. Electrical
resistance strain gages were attached to the strands to monitor the prestress operation and to
measure the forces before and after the jacking operation. The stressing information, concrete
strengths and dates of prestress and release for all the beams of Phase-1 and Phase-2 are given in
Table 5-2 and Table 5-3 respectively. Figure 5-7 shows the schematic layout of the casting bed.
87
Conclusions or recommendations in this report are the opinions of the authors. PCI assumes no responsibility for the interpretation or application of the information contained herein.
An~:horBI,)ck
Figure 5-6. Formwork and Casting Layout
TOPSide# 2
Beam # 2Side# 1
Side# 2Beam # 1
Side# 1
S
W
L = 11.58 m (38 ft) ~ Am horBI~ )ck
Figure 5-7 Schematic Layout of the casting bed
88
Conclusions or recommendations in this report are the opinions of the authors. PCI assumes no responsibility for the interpretation or application of the information contained herein.
20-Nov-05shown also include long term losses up to the age of concrete considered.
1Mpa =145.0377 psi
89
Conclusions or recommendations in this report are the opinions of the authors. PCI assumes no responsibility for the interpretation or application of the information contained herein.
The prestressing operation- was carried out one svand at a time. In Phase-1, a post-tensioning
jack from Premarc Corp. was used (Figure 5-8). In Phase-2, a hollow-core jack, similar to the
one used in pull-out tests Figure 6-3, was used. In both phases, the load was monitored using the
electrical resistance strain gages attached to one of the wire of each strand. A U-bracket similar
to the one used for draw-in measurements in transfer length measurements (see Section 7.3) was
attached and the elongation of the strand was also monitored. The load corresponding to the
elongation was computed. Also, in Phase-l_, the post-tensioning device also had a pressure
transducer calibrated to read the applied load on the strands. Similarly, in Phase-2, a concentric
load cell was used in conjunction with the hydraulic jack to obtain the load applied on the
strands. The values of loads from strand elongation measurements, pressure transducer and load
cell were used to validate the electrical strain gage readings. The values of strand stress obtained
from the electrical resistance strain gages have been used for all the computations in this project.
Figure 5-8. Strand Pretensioning with Post-Tensioning Jack
90
Conclusions or recommendations in this report are the opinions of the authors. PCI assumes no responsibility for the interpretation or application of the information contained herein.
.. The concrete was mixed at a ready mix plant and delivered to MSU’s Civil Infrastructure
Laboratory. As discussed in Section 4.2, the admixtures were added on site in order to achieve
proper SCC behavior. After appropriate fresh property tests were conducted and approval from
the research team, the concrete was poured into the test units. Pull-out blocks and material
testing cylinders were cast at the same time. After casting, the beams were left to cure at room
temperature and humidity conditions. The formwork was removed the next day to place
instrumentation for transfer length measurements.
Figure 5-9. Release of Prestress -Both Beam Ends being Cut Simultaneously
After instrumentation of the test specimens had been completed for transfer length through
concrete strain measurements (see Section 7.2), reference readings were taken and the release of
prestress was performed. Prestress release was done by flame cutting on both beam ends
simultaneously. However, the strands were first gradually heated with a broad flame, until most
of the prestressing force was transferred by thermal elongation of the strands. The strands were
heated over a distance of 305 mm (12 in.) by slowly moving the flame above and below the
strand in gradual strokes. This process was done simultaneously on both ends and was
coordinated by a team member. The annealing process was performed for approximately 5
minutes to release as much of the prestress as possible. The release of prestress was also
monitored by resistance strain gages attached to one of the wires for each strand. These strain
gages were installed during stressing operation to measure the amount of stress in the strands.
During the heating process, the strain in the strands was verified to drop and reach near zero
values. The strands were then cut simultaneously on both ends (Figure 5-9). In some cases, one
91
Conclusions or recommendations in this report are the opinions of the authors. PCI assumes no responsibility for the interpretation or application of the information contained herein.
of the wires of the strands would fracture during the heating process. In such cases the heating
process was terminated and the strand at both beam ends was flame-cut simultaneously
immediately after such event. The process just described was repeated for each strand.
92
Conclusions or recommendations in this report are the opinions of the authors. PCI assumes no responsibility for the interpretation or application of the information contained herein.
CHAPTER 6 STRAND BOND PERFORMANCE EVALUATION
6.1 Introduction
This chapter deals with the evaluation of strand bond performance with the different
concrete mixes in the test program. This evaluation was done by means of simple pull-out tests
on unstressed strands. The pull-out experimenta! program was intended only to study the effect
of various mix proportioning on the bond performance of the prestressing tendon and not to
study the qualification of the strand bond quality. The test description, procedure and results are
presented in detail. These tests were performed in series with the transfer length study. In Phase-
1 of the project, pull-out tests were performed at the day of transfer (mostly 3 days) and at 7
days, whereas for Phase-2, pull-out tests were performed only at the day of transfer. Results for
the different SCC mixes are compared to those obtained for the reference NCC mix.
6.2 Background
The need to have a standardized test to measure the bond performance of prestressing
strands lead to the development of various tests such as simple pull-out tests, and tensioned pull-
out tests [47]. Tests on strand bond quality by means of the "Moustafa test" have been
recommended by the PCI Interim Guidelines for SCC [46]. Previous research has shown that the
bond quality of strands from different manufacturers varied significantly [47]. Hence, a modified
version of the Moustafa test, the large block pull out test (LBPT) has been recommended by
Logan [35] to qualify strand (Section 2.6) for prestressing use.
As discussed in Section 2.6, the LBPT procedure recommended by the PCI Interim
Guidelines for strand qualification in SCC products [46], has to be performed in a very specific
manner. In this research, pull-out tests were performed not necessarily to qualify the strand but to
study the relative bond performance of a specific strand on different SCC mixes relative to a
reference mix. As discussed in Section 5.2.2, two types of strands with different surface
conditions were used in this project. The pull-out tests performed in this project also highlighted
the effect of strand surface quality on the pull-out performance of the strands.
93
Conclusions or recommendations in this report are the opinions of the authors. PCI assumes no responsibility for the interpretation or application of the information contained herein.
6.3 Pull-out Block Test Details
Details on the pull-out block used in this study are shown in Figure 6-1. A separate block
was cast for each of the concrete mixes. Each pull-out block contained six non-tensioned
prestressing strands. As a trial specimen, to check instrumentation and testing procedures the
first pull-out block in Phase-1 NCCA mix was made with twelve strands. The prestressing
strands used in the block were of the same type as that used in the corresponding test beam units.
The pull-out tests were designed to replicate the pull-out tests recomrnended by Logan [35].
Although the test procedure differed slightly (See Section 6.4.1), the geometry of the pull-out
blocks was the same. The other difference of the pull-out block used in this study and those
recommended by Logan is that the strand was placed such that it protruded from both ends of the
block. This was done so that measurements of strand "pull-in" and thus a better estimate of first-
slip onset could be made. This modification was used successfully in the strand studies by Rose
and Russell [47].
The total depth of the block was 610 mm (24 in.). Plastic sleeves of 50 mm (2in.) and 101
mm (4 in.) were provided in the top and bottom of the strands, respectively, leaving strand
embedment length of 457 mm (18 in.) The strands had a side cover of 115 mm (4.5 in.) and a
center to center spacing of 229 mm (9 in.). The total strand length was 1.83 m (6 ft), with
approximately 300 mm (1 ft) extending below the block and 915 mm (3 ft) extending above the
block. The longer end was used as the jacking end to attach the pull-out equipment, and
instrumentation was done on both the ends of the strands while performing the pull-out test.
Nominal reinforcement was provided to the block to prevent temperature or shrinkage effects on
the block. The casting procedure and the concrete used was the same as that used in the
corresponding test beam specimens. No vibration was used for the SCC mixes, while the NCC
mix was conventionally vibrated. Formwork for the block was removed at the same time as the
formwork for the test beams. Figure 6-2 shows the casting of a pull-out block and Figure 6-3
shows a finished pull-out block with a test in progress.
94
Conclusions or recommendations in this report are the opinions of the authors. PCI assumes no responsibility for the interpretation or application of the information contained herein.
11
TOP
11
FRONT ELEVATION
#5 Ties
0.5" Strand
4" PlasticSleeve
1" = 25.4 mm
2" PlasticSleeve
SIDE ELEVATION
Figure 6-1 Pull-out Block Geometry and Reinforcement Details
95
Conclusions or recommendations in this report are the opinions of the authors. PCI assumes no responsibility for the interpretation or application of the information contained herein.
Figure 6-2. Casting of a SCC Mix Pull-out Test Block
Figure 6-3. Overview of Typical Pull-out Test Setup
96
Conclusions or recommendations in this report are the opinions of the authors. PCI assumes no responsibility for the interpretation or application of the information contained herein.
6.4 Pull-out Test Procedure
The pull-out tests were performed after the release of prestress in the test beam units,
~lpica!!y 3 days after casting. This was done so that the bond strength at the time-of transfer in
the actual beam_specimens could be correlated with the pull-out test data obtained. The pull-out
tests were designed to replicate the large block pull-out tests (LBPT) recommended by Logan
[35] in geometry and test procedure. However, due to the non-availability of similar equipment,
equipment working range limitations, etc., the test procedure varied slightly. The test procedure
followed is given in the following section.
Variation in pull-out test procedures
The test procedure used in this research differed from the LBPT in the following ways:
1) The hydraulic jack used in this research was different from that prescribed. The
LBPT prescribed by Logan [35] used the hydraulic jack assembly with the block
in the vertical position and the jack resting on the block. In this research, the block
was laid horizontal and the strands were pulled horizontally. The jack was held by
a crane. The schematic of the pull-out test setup is shown in Figure 6-4 and the
actual pull-out test in progress is shown in Figure 6-5
2) The rate of loading prescribed for the LBPT by Logan [35] is approximately 89
kN per minute (20 kips per minute). Also, it is reported that each pull-out test
should take approximately 2 minutes~ The average pull-out rate achieved with the
equipment used in this project varied from 13 kN (3 kip) to 27 kN (6 kip) per
minute. As expected, past researchers have noted that slower jacking rates will
result in lower pull-out force measurements [47]. The time taken to complete the
test varied from 3 to 6 minutes.
3) The LBPT for strand bond qualification prescribes a specific concrete mix such
that it is produced from one batch of hard-rock structural concrete mix without
any high range water reducers and that it should attain between 26.2 to 34.5 Mpa
(3800 to 5000 psi) with overnight heat curing (or 2 days of ambient cure) [35]. As
discussed earlier, the objective of this pull-out experimental program was to study
the relative effect of different concrete mix proportioning (i.e., the SCC mixes) on
the bond strength of the prestressing strand. Hence the concrete mixes used in the
97
Conclusions or recommendations in this report are the opinions of the authors. PCI assumes no responsibility for the interpretation or application of the information contained herein.
research which differed significantly from the reference LBPT mix. Moreover, the
concrete mixes were cured in ambient conditions; thereby the conventional
reference NCC mixes used in this project also diffei~ed from the reference mix of
Logan LBPT [35].
Hollow Core CylinderPiston (Stroke 6 in.) ~ = 5
Steel Plate ~ = 4
Load Cell ~ = 2~
Prestressing Chuck ~ =
Strand ¢ = ~
10.5 ~ ~ 1~0.5 I
13.5 0.5--~)~ ~ I I~ >!.... 3.5 I
19.5 ~!ALL DIMENSIONS IN INCHES
Figure 6-4. Schematic of Pull Out Test Setup
6.4.2 Pull-out test procedure
The schematic of the pull-out test setup is shown in Figure 6-4 while an actual pull-out
test setup is also shown in Figure 6-5. After removal of forms the pull-out block was turned on
its side so that both the free and jacking ends (end from which the strand is pulled) of the strand
could be easily accessed and instrumented. A hollow core hydraulic cylinder with a capacity of
100 ton (220 kips) and a ram stroke of 150 mm (6 in.) was used to pull-out the strands. The pull-
out test setup was assembled as described next: A hollow core cylinder’s piston was brought to
zero position (completely intruded). The strand was inserted in the hollow-core cavity and the
cylinder was rested against the face of the block. A load cell assembly consisting of a center-hole
load cell [capacity = 334 kN (75 kips)] "sandwiched" between two center-hole steel plates was
then placed next to the cylinder ram. A prestressing chuck was then placed behind the load cell
assembly to anchor the strand against the cylinder piston. During the loading process the piston
of the cylinder would extend thereby pushing the load cell assembly against the chuck. The
98
Conclusions or recommendations in this report are the opinions of the authors. PCI assumes no responsibility for the interpretation or application of the information contained herein.
chuck, in turn would pull the_ strand out and the corresponding load was measured by the load
cell.
Front Displacement Back Displacement
Figure 6-5 Measurement of Displacements - Pull-Out Test
In Phase-l, two linear potentiometers placed in line with the stand were used to measure
the strand movements at both the free and jacking ends (Figure 6-5). In Phase-2, only one linear
potentiometer was used at the jacking end, as it was found from Phase-1 that one potentiometer
was sufficient to capture any strand movement.
The pull-out rate was calculated from the peak load and the total time taken to complete
the test. An average pull-out rate varying from 13 kN (3 kip) to 27 kN (6 kip) per minute was
obtained with this jack. The time taken to complete the test varied from 3 to 6 minutes. The test
was stopped after the peak load was recorded and when there was no significant increase in load
corresponding to increases in the displacement, in other words when excessive slip was
observed.
A total of 12 trial tests were performed on strands embedded in the Phase-1 NCCA mix at
different concrete ages. As expected, there was an increase in the measured peak pull-out force
measured with an increase in age of concrete. Also, there was very little variation observed in the
peak pull-out forces of multiple strands tested at the same age of concrete. From the insights
gained from these trial tests, the following pull-out-tests for Phase-1 were performed on only
99
Conclusions or recommendations in this report are the opinions of the authors. PCI assumes no responsibility for the interpretation or application of the information contained herein.
three strands at two different concrete ages, namely at a concrete age corresponding to the
release of prestress in the beam test units (-3 days) and at 7 days. The results obtained from the
individual set of three tests showed very little variation. Thus, for Phase-2, the pull-out tests were
performed on all six strands at the concn’ete age corresponding to release of prestress (-3 days).
The summary of the results of a!!- the pull-out tests for both research phases are presented in the
following section.
6.5 Pull-out Test Results
Results of the pull-out tests for each of the phases are explained separately in the following
sub-sections. The peak pull-out forces and forces corresponding to the first movement of the
strand were determined from the pull-out force vs. strand slip response. In the pull-out tests
performed by Rose and Russell [47], the onset of general bond slip was defined as the load at a
free end slip of 0.005 in. In this project, the loads at first slip were determined by examining the
measured test force-displacement response data. In the Phase-1 pull-out tests, it was observed
that the first slip was noticeable by a pronounced drop in load and increased rate of deformation
at both the free and jacking ends. In the Phase-2 pull-out tests, the mentioned load drop was not
observed, which is believed to be due to the higher quality of strand in bond. Thus, the first slip
in phase2 was obtained by identifying the point where a pronounced change in slope on the test
force-displacement response occurred. The results of pull-out tests from each of the phases are
given next.
6.5.1 Phase-1 Pull-out Results
Table 6-1 shows the average peak pull-out forces and the standard deviation for__all mixes
of Phase-1 at 3 days, while Table 6-2 shows same information at 7 days. The average pull-out
forces and the values of standard deviations for all the mixes of Phase-1 corresponding to the
strand first slip at 3 days and 7 days are given in Table 6-3 and Table 6-4, respectively. The
individual pull-out forces values that deviated significantly from the average were neglected and
such values are reported as "n/a" in the mentioned tables.
100
Conclusions or recommendations in this report are the opinions of the authors. PCI assumes no responsibility for the interpretation or application of the information contained herein.
Table 6_-1. Maximum (Peak) Pull-out Force - Phase-1 - Release (3 days)
All the pull-out tests displayed a gradual load-slip behavior and no fracture of strand was
achieved. A typical load-slip response for all the mixes at release and 7 days is shown in Figure
6-6 and Figure 6-7, respectively. A "close-up" of the response at first movement for all the mixes
at release and 7 days are shown in Figure 6-8 and Figure 6-9 respectively. The individual pull-
out plots for all the strands are given in Appendix B. The average peak pull-out forces obtained
at 7 days were compared with those obtained at release (3 days), and as expected, it was found
that the 7 day pull-out forces were slightly higher. The smallest increase of approximately
101
Conclusions or recommendations in this report are the opinions of the authors. PCI assumes no responsibility for the interpretation or application of the information contained herein.
around 6% was found for the SCC 1 and NCCB mixes, a moderate increase of around 24% was
found for the SCC2 mixes and a large increase of around 48% was observed for SCC3 mixes.
Figure 6-10 shows the comparison of the peak pull-out-forces at release (3days) and 7 days for
all mixes.
Table 6-3. Pull-out Forces at First Slip - Phase-1 - Release (3 days)
Conclusions or recommendations in this report are the opinions of the authors. PCI assumes no responsibility for the interpretation or application of the information contained herein.
Figure 6-7. Typical Pull-out Test Responses - At 7 days - Phase-1
103
Conclusions or recommendations in this report are the opinions of the authors. PCI assumes no responsibility for the interpretation or application of the information contained herein.
Figure 6-9. "Close-Up" of First slip occurrence - At 7 days - Phase-1
104
Conclusions or recommendations in this report are the opinions of the authors. PCI assumes no responsibility for the interpretation or application of the information contained herein.
165
135
120
45
30
15
0NCCB SCCl SCC2A SCC2B SCC3
MIX TYPE
Figure 6- ! 0. Comparison of Peak Pull-out forces - Phase- l
40
35
0
90 m
~ 80 18
o60 ~14 Pu. O
50
~ 6 ~~20 4
10
0NCCB SCCl SCC2A SCC2B SCC3
MIX TYPE
Figure 6-11. Comparison of Pull-out forces at First Slip - Phase- 1
105
Conclusions or recommendations in this report are the opinions of the authors. PCI assumes no responsibility for the interpretation or application of the information contained herein.
As seen in Figure 6-10, the Phase-1 results of the peak pull-out forces at release and at 7
days follow the same trend. The NCCB mix had the highest average peak pull-out force while
SCC1 (high-paste SCC mix), had the lowest. Of the SCC mixes, the highest pull-out force was
for SCC3 (high aggregate content mix). SCC2A was a stiff concrete that had to be repeated and
its performance was closer tO the NCCB mix. Thus, the results support the concept of bounding
the response of SCC behavio-r with the selected mix designs.
As expected, an increase in peak pull-out forces was observed for all mixes for 7 days
relative to those at transfer. However, the same trend was not observed for the first peak loads as
seen in Figure 6-11. The first peak loads at 7 days were smaller than the first peak !oads at 3 days
for the NCCB and SCC3 mixes. Although this was not expected, it could be due to a variety of
reasons as the bond phenomena is complex and depends on various factors including the age of
concrete, the mix design, admixtures added etc. However, in general, it was found that the first
slip load for all SCC mixes was relatively the same.
The average pull-out forces corresponding to the first slip for all the SCC mixes were
found to be relatively the same at both release and at 7 days. Of all the SCC mixes, SCC1 had the
highest average first slip pull-out force, approximately 40 kN (8.9 kips) while all others had an
average first slip pull-out force of around 30 kN (6.75 kips). The NCCB mix block yielded the
highest average first slip loads for both release and 7 days of 67 kN (14.93 kips) and 88 kN
(19.67 kips), respectively.
The average maximum bond strength (u) for all the mixes was obtained from the average
peak pull-out forces, given the embedment length, and the surface area of the strand. Equation 6-
average bond strength per strand from the peak load (P,~a~-)1 shows the calculation of this
achieved by the respective strand
~Inax (6-1)
where, Dn is the nominal strand circumference =-*~* db, db is the diameter of the prestressing3
strands, and Lb is the embedment length or distance of the strand contributing to bond = 457 mm
(18 in.).
The average maximum bond strength was calculated only from the peak pull-out force and
not the first slip force. The bond strength calculated from the peak pull-out forces at release for
106
Conclusions or recommendations in this report are the opinions of the authors. PCI assumes no responsibility for the interpretation or application of the information contained herein.
each mix type is reported in Table 6-5. In order t-o effectively correlate the bond strength for all
mix designs, the bond stress value was normalized with respect to concrete compressive strength,-~(~ccj--at the time of the test. The variation of bond strength of SCC mixes with respect to the
NCC mix was e~luated by observing the relative ratios of the normalized bond strength of the
SCC mixes against the NCC mix. ~ ¯ .... ~
Tab!e:6-5. Average Maximum Bond Strengths from Peak Pull-out Forces - Phase- 1
NCCB
SCC1
SCC2A
SCC2B
SCC3
PeakLoad
30.40
16.61
26.01
19.39
20.12
Bondstrength
(u)(psO
806.39
440.51
689.80
514.42
533.61
Compressivestrength
5545.12
~! scc
H NCC
10.83
5.02
7.86
6.28
6.52
7685.02
7693.25
6703.80
6703.801 MPa = 145.04 psi
1 kip = 4.485 kN
1.00
0.46
0.73
0.58
0.60
It is important while interpretation of results to incorporate the surface condition of NCCB
strand used in Phase-1, which used a slightly rusted strand (see Section 5.2.2.). This slight rust
may indicate higher pull-out strengths than expected. T.he amount of increase in the pull-out
strength due to the rusted surface condition cannot be determined exactly, but can be
approximated with certain assumptions as discussed in section 7.5.3. However, the effect of rust
should not affect the relative trend of concrete mixes. Comparison of the normalized maximum
bond strength (Table 6-5 and Figure 6-12) shows that all SCC mixes had less bond resistance
than the NCC mix. The SCC1 mix (high fines) showed the least average bond strength, with
approximately 54% less bond resistance than the NCC mix. The SCC3 (high coarse aggregates)
mix showed the best performance of all the SCC mixes with a 40% reduction in bond strength
relative to NCC. The SCC2A, mix being a stiff mix, showed only 27% reduction in bond relative
to NCC. However, this test is not being considered as the reliability of the SCC2A mix is in
question. At the same time the SCC2B showed a reduction of 42% in bond strength relative to
107
Conclusions or recommendations in this report are the opinions of the authors. PCI assumes no responsibility for the interpretation or application of the information contained herein.
x~tu ;DDS 0ql jo asuodsa:~ oql Su!punoq jo ldaauoa 0q! !~oddns un3:~3 s!lnsoa aqa ’aOUaH "DDN
Conclusions or recommendations in this report are the opinions of the authors. PCI assumes no responsibility for the interpretation or application of the information contained herein.
Table 6-7. Pull-out Forces at First Slip - Phase-2 -Release (3 days)
72.50
(16.30)56.93
(12.80)74.73
(16.80)66.72
(15.00)
2
62.27
(14.00)63.25
(14.22)
lq!a
57.60(12.95)
Maximum Pull-out Force, kN (kips)
3
68.05
(15.30)53.38
(12.00)46.70
(lO.5O)63.16
(14.20)
4
84.96
(19.10)69.39
(15.60)72.50
(16.30)70.19
(15:78)
5
82.96(18.65)64.41
(14.48)
n/a
n!a
6
67.16
(15.10)54.89
(12.34)56.93
(12.80)
n/a
Average
72.99(16.41)60.36
(13.57)62.72
(14.10)64.42
(14.48)
StandardDeviation
9.12(2.05)6.27
(1.41)13.29(2.99)5.37
(1.21)
The average peak pull-out forces at release (-3 days) obtained with SCC mixes were
compared with NCC mix (see Figure 6-15). Phase-1 pull-out tests revealed (see Section 6.5.1)
that all SCC mixes had lower pull-out strengths than NCC mixes. In Phase-2 pull-out tests it was
found that only the SCC3 mix had higher peak pull-out strength (- 9%) relative to NCC. SCC 1
had the lowest peak pull-out strength followed by SCC2 with approximately 27% and 17% lower
than the NCC mix.
The average first slip pull-out forces at release (-3 days) for various SCC mixes were
compared with corresponding NCC mix (see Figure 6-15). Consistent with Phase-1 results (see
109
Conclusions or recommendations in this report are the opinions of the authors. PCI assumes no responsibility for the interpretation or application of the information contained herein.
Figure 6-11); it was found all SCC mixes had lower first slip pull-out forces than NCC mixes.
Relative to NCC (reference mix), SCC1 (high fines mix) had the lowest first slip load by
approximately 17%, followed by SCC3 (high CA content) and SCC2 mixes with- !4% and 12%
respectively. It -was observed that the values of the pull-out forces obtained for the $CC2 mix
w~s bounded by the SCC! and SCC3 mixes, the bounding mix designs selected in this project.
This is consistent with Phase-l results (see Figure 6-15). It was observed that the variation in the
mean value of the first slip loads for various mix designs was minimal compared to similar
variations in peak pull-out forces. Taking the standard deviations into consideration, it was
observed that the first slip pull-out forces were relatively a constant. Hence, it can be concluded
that the effect of mix proportioning is minimal on the first slip pull-out forces.
Table 6-8 Average Maximum Bond Strengths from Peak Pull-out Forces - Phase-2
MIX TYPEPeakLoad
43.1231.3335.7146.81
Bondstrength
(u)(psO
1143.90830.93947.171241.57
Compress~estrength
4843.634078.074370.264640.70
16.4413.0114.3318.23
NCC 1.00SCC1 0.79SCC2 0.87SCC3 1.11
The bond strength for Phase-2 pretensioning strands was calculated as previously
explained (see Section 6.5.1) using Equation 6-1. Table 6-8 and Figure 6-16 compare the
normalized bond strengths for Phase-2 strands. It can be observed that all SCC mixes had lower
bond strengths relative to NCC, except SCC3. SCC3 (high coarse aggregate) mix showed the
best performance of all SCC mixes and had approximately 1 i% higher bond strength, while
SCC1 and SCC2 had 21% and 13% lower bond strengths relative to NCC. The peak pull-out
strengths and associated bond stresses and the first slip forces support the concept of bounding
the response of SCC mix proportioning with the selected mix designs. The individual plots for all
the pull-out responses for Phase-2 are provided in Appendix B. The overall comparison and
discussion of results from both phases is given in the following section.
110
Conclusions or recommendations in this report are the opinions of the authors. PCI assumes no responsibility for the interpretation or application of the information contained herein.
Figure 6-14. "Close-Up" of First Slip Occurrence - At Release - Phase-2
111
Conclusions or recommendations in this report are the opinions of the authors. PCI assumes no responsibility for the interpretation or application of the information contained herein.
260 I240 ~
180
160
140 1
120
_,o 100
~- 80
60
40
20
0
Peak Pull-out ForcesFirst Siip Pull-out Forces
NCC SCC1 SCC2 SCC3
MIX TYPE
Figure 6-15. Comparison of Pull-out Results - Phase-2
60
50
30 0
10
1.4
~ 1.2
orn 1.0
~- 0.8
.>
’~ 0.6
._ 0.4
Eo 0.2
z
z 0.0
U NCC -- U PPK---:----; U =--; U =--Uscc ~ As
NCC SCC1 SCC2 SCC3
MIX TYPE
Figure 6-16. Comparison of NCC Normalized Relative Bond Strengths - Phase-2
112
Conclusions or recommendations in this report are the opinions of the authors. PCI assumes no responsibility for the interpretation or application of the information contained herein.
6.6 Discussion
The results from the pull-out tests presented in Sections 6.5 can be discussed further using
the following parameters: a) effect of strand bond quality, b) effect of mix proportioning on
strand bond performance, c) effect- of strand surface (rust of NCC_mix of Phase-l), and, d)
Overall SCC behavior. ’: ’
The pull-out tests in Phase-1 were performed at two different concrete ages (transfer (3-
days) and 7-days). The pull-out tests in Phase-2 were performed only at a concrete age of 3-days.
For comparison, the results from both phases strands are compared and discussed in this section
at concrete age of 3-days. The NCCB and SCC2B mix of Phase-1 is compared with the NCC and
SCC2 mix of Phase-2.
6. 6.1 Effect of Strand Quality on Bond Performance
As discussed in Section 5.2.2, the strands used in each of the phases were different, with
the Phase-2 strands being pre-qualified and of a better quality than the strand used in Phase-l,
this according to a well- accepted strand bond evaluation method as discussed in Section 2.6.
The relatively superior quality of the Phase-2 strands was evident from the experimental pull-out
results. Phase-2 strands showed higher values for peak pull-out forces, first slip loads and hence
higher bond strengths. Figure 6-17, Figure 6-18, and Figure 6-19 compare the peak pull-out
forces, first slip loads and the normalized bond strengths of strands from both phases. It can be
seen that Phase-2 strands had higher pull-out strenghts than the Phase-1 strands.
Table 6-9 shows the comparison of the average pull-out forces from both phases. The
effect of strand bond quality was evident on all the mixes including the reference NCC mix. The
least increase in peak pull-out strength due to better strand quality was approximately 42% for
the NCC mix. It should be noted that this includes the contribution of rust from the Phase-1
strand used for NCC mix. Among SCC mixes, the increase in peak pull-out strength due to better
strand quality was approximately 89%, 84% and 133% for SCC1, SCC2 and SCC3 respectively.
The variation of the first slip pull-out forces was similar to that of the peak pull-out forces.
In order to better understand and interpret the results, it is important to understand the different
bond mechanisms that act at various stages of the pull-out test. The pull-out force corresponding
to the first slip is resisted mainly by the chemical bonding or adhesion mechanism. The peak
113
Conclusions or recommendations in this report are the opinions of the authors. PCI assumes no responsibility for the interpretation or application of the information contained herein.
pm,-out force is obtained due to a combination of adhesion and mechanical interlock, with the
latter being the main contributor.
Table 6-9~ Cornparison of Phase-i and Phase-2 Pull-out Strengths
MIXTYPE
NCC
SCC1
SCC2
SCC3
Average PeakPull-out Loads
(PPK)ION (Kips)
Phase-1 Phase-2
(30.40) (43.12)73.88 139.34
(16.61) (31.33)86.25 158.83
(19.39) (35.71)89.49 208.20
(20.12) (46.81)
Pex , Phase - 2Pex , Phase - 1
1.42
1.89
1.84
2.33
Average First-SlipPull-out Loads (PFs)
(Kips)Phase- 187.49
(19.67)39.54(8.89)31.71(7.13)29.98(6.74)
Phase-2
72.99
(16.41)60.38
(13.57)62.72
(14.10)64.42
(14.48)
PFS , Phase - 2
PFS , Phase - 1
0.83
1.53
1.98
2.15
All SCC mixes showed an increase in first slip pull-out forces. The least increase was
approximately 53% for SCC1 followed by SCC2 and SCC3 with 98% and 115% respectively. It
was observed that there was a decrease of approximately 17% in the first slip pull-out load for
NCC mix of Phase-2 strands relative to Phase-1 strands. Although the decrease in first slip pull-
out strength for a high quality strand may be surprising, it was expected. It should be noted that
the Phase-1 strand used in the NCCB mix was a slightly rusted strand (see Section 5.2.2.1). As
discussed previously in this section, the first slip pull-out strength is attributed to adhesion. The
higher first slip pull-out strength for Phase-1 strand is thus attributd to the rusted surface of the
strand. Hence it was observed that strand quality clearly affects the bond performance and has
distinct effects on different bond mechanisms. The increase of peak pullout forces due to better
quality of Phase-2 strands for SCC mixes was found to vary from approximately 89% to 133%,
with an average increase of 103%.
6. 6.2 Effect of Mix Proportioning on Strand Bond Performance
The same strand was used for different concrete mixes of each of the project phases. Thus,
the relative effect of strand quality and strand related parameters (diameter, surface quality, etc.,)
can be considered eliminated with respect to mix design. This implies that the pull-out
114
Conclusions or recommendations in this report are the opinions of the authors. PCI assumes no responsibility for the interpretation or application of the information contained herein.
performance from each of the phase provides significant informatioli about the maique.
contribution of concrete mix proportioning on the pull-out performance. Also, as discussed in
Chapter 3, the mix designs used in this project were designed to bound the various-mix design
approaches to SCC and study their effect on performance of structural parameters. While, the
pull-out strengths from two different strands should be different, m~n11,, the relative performance
of the same strand with different concrete mixes should be the same.
Table 6-10. Comparison of Relative Pull-out Strengths
Table 6-10 shows the comparison of the average pull-out forces from both phases. In order
to compare the relative effect of concrete mix proportioning, the pull-out forces (peak and first
slip) from both phases were normalized with respective reference NCC mixes. The effect of
concrete mix proportioning is evident from the NCC mix normalized ratios.
All SCC mixes had lower peak pull-out strengths relative to respective NCC mixes except
SCC3 of Phase 2 which was slightly higher by approximately 9%. in Phase-l, SCC1, SCC2 and
SCC3 mixes had 45%, 36% and 34% lower peak pull-out forces respectively compared to the
respective NCC mix. Hence, the overall variation in peak pull-out forces for SCC mixes with
Phase-1 strands was between 34% to 45% lower than NCC mixes.
Similarly, in Phase-2, SCC1 and SCC2 had 27% and 17% lower peak pull-out forces
compared to respective NCC mix. SCC3 was higher by approximately 9% relative to respective
115
Conclusions or recommendations in this report are the opinions of the authors. PCI assumes no responsibility for the interpretation or application of the information contained herein.
NCC mix. Hence, for Phase-2 strands, the peak pull-out forces of SCC mixes varied from -27%
to +9% to the corresponding NCC mix.
Similar to peak pull-out forces, all SCC mixes had lower first-slip pull-out strengths
relative to respective NCC mixes In Phase-l, SCC1, SCC2 and SCC3 mixes had 55%, 64% and
66% lower first slip pull-out forces respectively compared to the respective NCC mix. Hence, the
overall variation in first slip pull-out forces for SCC mixes with Phase-1 strands was 55% to 66%
lower than NCC mixes. Similarly, in Phase~2, SCC1, SCC2 and SCC3 had 17%, 14% and 12%
lower first slip pull-out forces than respective NCC mix. Overall, for Phase-2 strands, the first
slip pull-out forces of SCC mixes were lower by approximately 12% to 17% than the
corresponding NCC mix.
In both phases, among SCC mixes, the least value of pull-out forces was found for SCC 1
(high fines mix) and the largest value was obtained for the SCC3 (high aggregates) mix. The
SCC2 (moderate mix) was in between the two mixes, thereby conforming to the overall research
concept that the structural parameters can be bound by properly considering different mix
designs.
It can be seen from Figure 6-17, Figure 6-18, and Figure 6-19 that the trend and relative
variation of the parameters in each of the plots is the same. Figure 6-17 shows the comparison of
peak pull-out forces from strands used in Phase-1 and Phase-2. It can be seen that among the
SCC mixes, SCC1 had the lowest and SCC3 had the highest peak pull-out strength, with SCC2
having an intermediate value. The conventional NCC mix had a higher average peak pull-out
strength than all of the SCC mixes for Phase-1 but for Phase-2 SCC3 had marginally higher
average peak pull-out strength than NCC. However, both phases show consistent trends and the
effect of mix design is quite evident. Overall, the SCC mixes had lower pull-out strengths than
the respective NCC mixes
Figure 6-18 shows the comparison of first slip pull-out forces. Again, Phase-2 strands
showed higher values relative to Phase-1 strands. However, for both phases, first slip loads were
relatively constant for the same type of strand for all mixes. The higher first slip load for NCC in
Phase-1 is attributed to the rusted surface in the strand used for that particular mix (see Section
5.2.2.). It is important to understand the different mechanisms of bond transfer and the loading
stages at which these mechanisms are active. The constant first slip load for both types of strands
for various concrete mix proportioning implies that the concrete mix proportioning has relatively
116
Conclusions or recommendations in this report are the opinions of the authors. PCI assumes no responsibility for the interpretation or application of the information contained herein.
less effect on the mechanism of bond transfer related to first slip. As kdiscussed previously, first
slip loads are contr611ed by adhesion or chemical bonding mechanism where as the peak pull-out
forces- correspond to the combination of adhesion and mechanical-interlock, with a much larger
contribution from the latter mechanism.
. Figure 6~ 19 shows the comparisor~ of maximmm average peak bond strengths with respect
to the respective NCC mixes in each phase. These bond strengths were obtained from the
average peak pull-out strengths and are assumed to be constant i.e, average, over the strand
embedment length. The compressive strengths of the various concretes at the day of pull-out
testing were different. Hence, the bond strengths were normalized with their respective
compressive strengths (~c’c). It can be observed that the normalized bond strengths for strands
from both phases follow the same trend as the peak pull-out forces.
Figure 6-20 shows the comparison of maximum average first slip bond strengths relative
to the respective NCC mixes in each phase. The first slip bond strengths were obtained similar to
peak bond strengths but by using the average first slip pull-out strengths instead of peak pull-out
strengths. As the various concrete mixes used in this research have different compressive
strengths, the bond strengths obtained were normalized with the compressive strength (~x!f’c). It
was observed that the normalized bond strengths from the first slip loads were relatively constant
for all mixes. Hence, it can be concluded that the effect of mix proportioning on first slip loads
and corresponding bond strengths is relatively minimal.
Among the SCC mixes, it was found that SCC3 had the highest value followed by SCC2
and SCC1, respectively. Also, it was observed that the NCC normalized bond strengths of SCC
mixes were much lower for the Phase-1 strands than for the Phase-2 strands. These low values
cannot be completely attributed to SCC as the strand used in NCC for Phase-1 was slightly
rusted. The exact contribution of rust cannot be calculated accurately, but can be approximated
but certain assumptions (See Section 6.6.3). Nevertheless, the relative bond strengths within the
SCC mixes seem to follow a consistent trend and hence support the concept of bounding the
bond performance of prestressing strands in SCC with the selected mix designs.
117
Conclusions or recommendations in this report are the opinions of the authors. PCI assumes no responsibility for the interpretation or application of the information contained herein.
260
240
220
200
180
166
140
120
100
80
60
40
20
0NCC SCCl SCC2 SCC3
MIX TYPE
Phase-1~ Phase-2
60
50
40
10
Figure 6-17. Comparison of Peak Pull-out forces of Strands from both Phases
110
100
9O
8O
70
60
5O
40
30
20
10
0NCC SCCl SCC2 SCC3
Phase-1~ Phase-2
25
2O
1o o,.,--
M IX TYPE
Figure 6-18. Comparison of First Slip Pull-out Forces of Strands from both Phases
118
Conclusions or recommendations in this report are the opinions of the authors. PCI assumes no responsibility for the interpretation or application of the information contained herein.
oz
1.4
U SCC --
1.2 U NCC
1.0
0.8
0.6
0.4
0.2
0.0NCC SCCl SCC2 SCC3
Phase-!~ Phase-2
T
MIX TYPE
Figure 6-19. Comparison of NCC Normalized Relative Peak Bond Strengths - both Phases
0.6
0.2
14 scc -- U PFSPhase.1
--------; U = --; U = -- ~ Phase-2UNCC ~ As [
0.0NCC SCCl SCC2 SCC3
MIX TYPE
Figure 6-20. Comparison of NCC Normalized Relative First Slip Bond Strengths - both Phases
119
Conclusions or recommendations in this report are the opinions of the authors. PCI assumes no responsibility for the interpretation or application of the information contained herein.
6.6.3 Effect of Strand Snrface Condition (NCC- Phase-1)
As discussed ~- Section 5.2.2, due to the poor performance of first few concrete mixes,
few test units had to repeated. As a result, the strand used in NCC mix of Phase-1 was slightly
rested / pitted (Section 5.2.2). At the same time, the strand used in all the SCC mixes of Phase-1
was the same and d0es’not affect the relative study of the SCC mixes. As discussed in Section
6.5, it was observed that the rusted strand in Phase-1 NCC mix gave higher peak and first slip
pull-out forces. The exact effect of rust on pullout tests and corresponding parameters cannot be
determined exactly. An approximate analysis of the effect of rust can be obtained by making
certain assumptions.
The main assumption made for computing the effect of rust is that: if a similar strand is
used for all the mixes and for any parameter, the ratio of average value obtained for all SCC
mixes for that particular parameter to its value for the corresponding NCC mix is a constant. In
this chapter, the parameters under study are: a) average peak pull-out force and b) average first
slip pull-out force.
6. 6. 3.1 Ef[ect of Rust on First slip PulLout Force:
As discussed in section 6.5 and 6.6.2, it was observed that the first slip pull-out forces
were relatively constant for all mixes of a particular strand type. Hence, a ratio of average first
slip forces for NCC mixes to average first slip loads for all SCC mixes for Phase-2 prequalified
strand was obtained. This ratio for Phase-2 strand was found to be 1.17,
A similar relationship must exist for Phase-1 strand, if the same strand condition existed.
But the ratio of average first slip forces for NCC mixes to average first slip loads for all SCC
mixes for Phase-1 strand was found to be 2.60. Since the strand used for Phase-1 for all mixes
including the one used in NCC mix was from the same batch (but strand used in NCC mix was
slightly rusted), this difference in the ratio of NCC to SCC average first slip forces can be
attributed mainly due to rust. Hence, a new value for first slip pull-out force for Phase-1 NCC
mix (predicted) was obtained from the average NCC to SCC ratio of Phase-2. This predicted first
slip pull-out force value was found to be 39.40 kN (8.86 kip). Hence the contribution of rust was
obtained from the difference of the experimental and predicted value.
This difference is attributed to the rusted surface and the contribution of rust on first slip
loads was thus approximated to be 55%. It should be noted that this approximation holds true
120
Conclusions or recommendations in this report are the opinions of the authors. PCI assumes no responsibility for the interpretation or application of the information contained herein.
only for the strand used in this research and for the amount of rust that existed in the strand at the
time of concrete cast in the test units. This carmot be applied to all rusted strands, as the strand
type-and degree of rust or surface condition may vary uniquely for different strands. At the same
time, a similar approach can be used to quantify the effect of rust on the particular strand under
study
6. 6.3.2 Effect qfRust on Peak PulLout Force:
Similar to the first slip pull-out forces, the contribution of rust on peak pull-out forces of
Phase-1 NCC mix strand can be obtained approximately. The first slip forces were relatively
constant and the effect of mix proportioning on first slip pull-out forces was minimal. But, for
peak pull-out forces, the effect of mix proportioning was more prominent and was not constant
as observed in first slip pull-out forces. Hence, in order to obtain the contribution of rust on peak
pull-out forces, two approaches were used:
Approach-I: An approach similar to first slip forces, where in the average of peak pull-out
forces of all SCC mixes of Phase-2 was considered and its corresponding ratio with peak pull-out
force of NCC was obtained. A similar ratio must exist for Phase-1 strands; hence a value for
peak pull-out force value for NCC mix of Phase-1 strand was predicted. Using the measured
value and the predicted value, the contribution of rust was obtained.
Approach-2: It was observed that the ratio of first slip pull-out forces to peak pull-out forces was
relatively constant (0.38) for all SCC mixes of Phase-2. A similar value (0.38) was also obtained
for NCC mix of Phase-2. This suggests that the ratio of first slip forces to peak pull-out forces is
a constant for a particular type of strand irrespective of mix design. Based on this assumption, a
similar constant ratio for first slip to peak pull-out force must exist for Phase-1 strand. Hence, a
ratio of first slip pull-out force to peak pull-out force of Phase-1 strand was obtained for SCC
mixes (0.41) of Phase-1 strand. A similar ratio for NCC mix of Phase-1 was obtained (0.65). If a
similar unrusted strand was used for NCC, the first slip to peak pull-out force ratio must be the
same as that of SCC mixes. Hence the contribution of rust to this first slip to peak pull-out force
ratio was obtained.
The predicted value for the contribution of rust on peak pull-out forces from approach-1
was found to be approximately 30%. Similarly, from approach-2, the predicted value for the
121
Conclusions or recommendations in this report are the opinions of the authors. PCI assumes no responsibility for the interpretation or application of the information contained herein.
contribution of rust,.on the ratio of first slip to peak pull-out forces was found to,be
approximately 37 %
6. 6. 3o 3 Effect of Rust -Comparison with Literature:
Researchers from University of Oklahoma have shown that the weathered (uniform rust)
surface condition of strand produced lower transfer_ length and higher pull-out forces [47]. The
researchers tested strands from three different manufacturers and four different surface
conditions. One of the strands used in this research had both weathered (uniformly rusted) and
"as-received" surface condition, and are hence used for the comparative study. The contribution
of rust on transfer length was calculated from literature [47]. The effect of rust from simple pull-
out tests performed at University of Oklahama study was calculated to be approximately 53%
and 20% on first slip and peak pull-out forces respectively. In this research, these values were
found to be 55% and 30% for first-slip and peak pull-out forces respectively. It is observed from
the results of this research and the literature that the effect of rust is larger on first slip pull-out
forces than peak-pull out forces.
The main purpose of comparison of the contribution of rust with literature is to
understand the magnitude of rust contribution on pull-out forces.Although, the comparison of
rust contribution with literature seems to agree reasonably well, it is important to understand that
there are certain assumptions in computing the rust contribution mad that rust contribution is
"strand-specific". The strand used in this research was slightly rusted / pitted and not uniformly
rusted as used by researchers from University of Oklahoma [47].
6. 6.4 Strand Quality and Surface Condition corrected Pull-out forces
The pull-out strengths of Phase-1 test units were corrected for the effects of strand
surface condition (rust) and strand quality. The assumptions and technique in determining these
effects were described in earlier sections. The effect of rust on peak pull-out and first slip pull-
out forces was found to be 30% and 55%, respectively. Similarly, the effect of strand quality was
found to be 103% and 88% for peak and first slip pull-out forces, respectively. Table 6-11
provides the results indicating the effect of mix proportioning and the values of peak and first
122
Conclusions or recommendations in this report are the opinions of the authors. PCI assumes no responsibility for the interpretation or application of the information contained herein.
slip pull,out forces corrected for strand quality and rust effects. For brevity, the standard
deviation values are not provided.
Table 6-11. Experimental pull-out sta’engths corrected for effects of strand quality and rust.
Figure 6-21 and Figure 6-22 compare the peak and first slip pull-out forces with the
effect of strand quality and rust removed. Similarly, Figure 6-23 and Figure 6-24 provide the
effect of mix proportioning on peak and first slip pull-out forces, with values corrected for strand
quality and rust. The pull-out forces (both peak and first slip) of all SCC mixes except peak pull-
out of SCC3 in Phase-2 were lower than for the corresponding NCC mix. The trend of peak pull-
out force values shows that among the SCC mixes SCC1 (high fines) had the lowest peak pull-
out force, SCC3 (high coarse aggregate) had the highest, and the SCC2 mix values were bounded
by the results for the other two mixes. The overall effect of SCC mix on pullout forces is
explained in detail in the following section.
123
Conclusions or recommendations in this report are the opinions of the authors. PCI assumes no responsibility for the interpretation or application of the information contained herein.
260
240
220
200
z 180
¢~ 160
o 140
¯ ’-’ 120,o
100n 80
60
40
20
NCC SCCl SCC2 SCC3
50
10
MIX TYPEFigure 6-21. Comparison of peak pullout forces corrected for strand quality and rest
90
80
70
60
50
40
30
20
10
0NCC SCC1 SCC2 SCC3
20
18
16
MIX TYPEFigure 6-22. Comparison of first slip pullout forces corrected for strand quality and rust
124
Conclusions or recommendations in this report are the opinions of the authors. PCI assumes no responsibility for the interpretation or application of the information contained herein.
1.4
1.2PPK NCC
~.0
0.8
0.6
0.4
0.2
0.0
/// ,
//
//
/
/
NCC SCCl SCC2 SCC3
MIX TYPEFigure 6-23. Effect of mix proportioning on peak pull-out forces corrected for strand quality and
rust
1.4
o 1.2
-̄ 17.8
~ 0.6
-~ 0.4
oz 0.2
z0.0
NCC
17~Z] Phase-1~ Phase-2
SCCl SCC2 SCC3
MIX TYPEFigure 6-24. Effect of mix proportioning on first slip pull-out forces corrected for strand quality
and rust
125
Conclusions or recommendations in this report are the opinions of the authors. PCI assumes no responsibility for the interpretation or application of the information contained herein.
6. 6. 5 Overall Effect of SCC on pull-out Forces
As discussed in earlier sections, it was observed that all SCC mixes had lower pull-out
stren~hs relative to respective NCC mixes. For peak pull-out forces, on an average, the SCC
mixes were !ower relative to respective NCC mixes by 38% and 12% for Phase-1 and Phase-2
strands respectively. The reduction in 38% of peak puil-0ut forces tbr SCC rnixes relative to
NCC mix also includes the contribution due to rust. If the assumed approximate value of rust
contribution (- 30%) for peak pull-out forces is used to correct the NCC mix of Phase-1, then the
Phase-1 results will match with that of Phase-2 results. Hence, the SCC mixes would have 12%
lower peak pull-out forces for both Phase- 1 and Phase-2 strands.
Similarly for first slip pull-out forces, on an average, the SCC mixes were lower relative
to respective NCC mixes by 61% and 14% for Phase-1 and Phase-2 strands respectively. Similar
correction for rust contribution (-55%) would suggest that all SCC mixes have -14% lower first
slip pull-out forces than respective NCC mixes. Again, this 14% matches for both Phase-1 and
Phase-2 as the assumption used to quantify the contribution of rust assumes the existence of a
constant relationship between NCC and average SCC mixes for a single type strand. Hence, the
ratio of NCC to SCC mixes for Phase-2 was used to calculate the rust of Phase-1 NCC strand.
Nevertheless, from both phases, SCC mixes were found to have lower pull-out strengths.
6.7 Summary and Conclusions
As discussed earlier bond phenomena depends on different mechanism to transfer shear
stresses between the steel strand and the su~ounding concrete. Bond shear stresses follow
complex distributions at member ends and at flexural cracks. Because of all these factors
influencing the slip resistance of a prestressing strand in concrete, it is difficult to determine
bond lengths by means of simple pull-out tests [33] .Thus, the correspondence between the
results obtained from this test and structural design parameters such as transfer length and
development length have long been questioned for conventional concrete [9][34][47][48] and
seem to be of continued debate now for SCC. While the response evaluated through simple pull-
out tests is clearly related to bond performance, its correlation to the complex phenomena
occurring in the transfer zone region and during development of strand capacity under flexural
actions is questionable. Nonetheless, pull-out tests are good methods to provide a baseline to
126
Conclusions or recommendations in this report are the opinions of the authors. PCI assumes no responsibility for the interpretation or application of the information contained herein.
qualify the strand bonding characteristics and can serve as a relative performance measure
between normally consolidated concrete and the different SCC mixes under evaluation (Figure
6-19).
In this study, pull-out tests were performed to study the relative effect of concrete mix
proportioning on the strand bond performance. A reference conventional concrete mix and~three ¯
SCC mixes were selected in such a way that the SCC mixes bounded the approaches of
achieving SCC. The two Phases of the project used two different types of strand with technically
equal concrete mix designs. The strand used in Phase-2 was pre-qualified for adequate bond
performance, while the Phase-l strand was subsequently shown to not meet this requirement.
Pull-out tests were performed on six strands per mix design in both research phases. As
expected, the pre-qualified Phase-2 strands had higher bond parameters values (peak-pull-out
strengths, first slip loads and bond strengths) relative to the Phase-1 strand. Among all SCC
mixes, the peak loads and the bond strength (calculated from peak loads) had the highest values
for SCC3 (high-aggregates mix) followed by SCC2 and SCC1 (high fines mix), in that order.
The NCC mix had the highest values for all bond parameters relative to all SCC mixes; except
for SCC3 mix in Phase-2 which was marginally higher (See Section 6.5.2). The first slip loads,
which are dominated by the chemical component to bond resistance, were relatively constant for
all mixes for a given type of strand.
Interpreting the results, it is important to recognize the different bond mechanisms and
their contribution at various stages of loading. The authors believe that the first slip loads are
related mainly to the adhesion (chemical bonding) mechanism and the peak loads (and hence the
overall bond strength) are caused by both adhesion and mechanical interlock mechanisms, with a
major contribution from the latter. Another factor influencing interpretation of the presented
results is the effect of rust in the strand used in the Phase-1 NCCB strands (See Section 5.2.2.1
and Figure 5-4). Surface condition has been recognized as an important parameter to bond
performance [34] [35] [47]. The strand used in the NCCB pull-out block was only slightly rusted,
whereby most of the rust was superficial and not complete. Yet, its effect seems to have been
significant as suggested from the LBPT tests performed by Logan on both Phase-1 strands using
the same concrete mix design (See Figure 5-5) [34][36]. Consistent with the previous discussion,
the highest influence from rust was found in the first slip loads, (see Figure 6-10). Consequently,
it can be seen that in Phase-1 the NCCB strands had noticeably higher first slip loads than all of
127
Conclusions or recommendations in this report are the opinions of the authors. PCI assumes no responsibility for the interpretation or application of the information contained herein.
the SCC mixes. The effect of rust and the doubts that they bring on the bond performance due to
surface quality were overcome in the pull-out tests performed in Phase-2 with a pre-qualified_
strand with uniform surface conditions. In these second series of tests it was observed that for a
similar type of strand, all mix designs yielded relatively equal first slip loads (see Figure 6-18).
Thus, the results from the pull-out test program in both phases give considerable
information about the strand bond performance and the effect of mix design selection. Overall, it
was found that all SCC mixes have less bond strengths relative to NCC. The overall variation in
peak pull-out forces for SCC mixes with Phase-1 strands was 34% - 45% lower than respective
NCC mixes. Similarly, for Phase-2 strands, the peak pull-out forces of SCC mixes varied
between -27% to + 9% of the corresponding NCC mix. The findings of the pull-out test program
are summarized in Table 6-12. Among the SCC mixes, SCC1 (high fines mix) had the least bond
strength followed SCC2 (moderate mix) and SCC3 (high coarse aggregate content mix) mixes;
thereby the pull-out behavior of SCC mixes was bound by the extreme mix designs selcted in
this project, thereby supporting the concept of controlling the hardened properties by selective
* pull-out stengths corrected for strand quality and rust effects
PEAK(%)10330
P-1-45/-22"-36 / -9*-34 / -5*
-12
P-2-27-17+9
128
Conclusions or recommendations in this report are the opinions of the authors. PCI assumes no responsibility for the interpretation or application of the information contained herein.
CHAPTER 7 TRANSFER LENGTH EVALUATION
7.1 Introduction
This chapter deals with the evaluation of bond performance of prestressingJstrands in terms
of transfer length in precast/prestressed beams. As discussed earlier, this research included two
phases with two different types of prestressing strands. All the procedures of casting, release,
measurement and instrumentation were the same for both the phases.
Two different techniques were used to expe~mentally determine transfer length: (i)
measurement of concrete strains along the length of the beam, and (ii) measurement of strand
draw-in. The phenomena of prestress transfer and the associated bond mechanism is complex
and both experimental methods have some inherent assumptions. For example, the computation
of transfer length from draw-in measurements inherently assumes a given distribution of bond
stress [6]. Similarly, the measurement by concrete strain profile method assumes that the first
intersection of the 95% average maximum strain (AMS) line with the strain profile defines the
transfer length [54]. The determination of the 95% AMS line is subjective based on visual
evaluation of the actual strain profile [54]. Hence, the transfer lengths obtained from each of
these methods are discussed separately. Moreover, as discussed earlier in Chapters 2 and 4,
transfer length depends on the initial strand stress, the effective stress in the strand after transfer
and the diameter of the strand. The jacking strain for each of the beam was slightly different for
each beam and hence the effective stress. The values of effective stress at transfer and day of
flexural testing were provided in Table 5-2 and Table 5-3 for Phase-1 and Phase-2 strands,
respectively. In order to compare the relative performances of the concrete mixes, all of the
transfer lengths were normalized with the effective stress and the diameter of the strand. The
transfer length values for each of the phases, the normalized values, comparison with ACI code
recommendations, relative comparison between results of both phases and a summary discussion
are also included in this chapter.
7.2 Concrete Strains Method
As previously defined in Section 2.3.1, transfer length is the distance from the end of the
beam to the point in the concrete member where the entire stress from the strands is transferred
to the concrete member. Steel stresses along the beam length increase rapidly from the beam end
129
Conclusions or recommendations in this report are the opinions of the authors. PCI assumes no responsibility for the interpretation or application of the information contained herein.
until becoming constant once equilibrium between concrete and steel stresses is achieved. The
strain in the concrete can be thus measured as a means to locate where the strain becomes
constant, and hence can be used to measure the transfer length. This section describes the
procedure of instrumentation and measurement of transfer length using concrete strain profiles.
Z2.1 Test Unit Preparation
The DEMEC (DEtachable MEChanical) strain measurement system (Figure 7-1) was
used to measure the strains on the surface of concrete. The DEMEC system consists of a
mechanical gauge used in conjunction with small stainless discs (0 = 6.3 ram), each with a small
hole (0 = 1.0 ram) in the center designated to fit the mechanical gage (Figure 7-2.). The stainless
discs are glued to the surface of interest at a given spacing over which the strain needs to be
measured. These discs or target points thus define strain measuring points. Thus, strains are
obtained from the change in length between target points (gage length) measured by the
mechanical gage.
(0.04 in.)
Figure 7-1. Actual Picture of the DEMEC Figure 7-2. Schematic Representation ofGage Target point
For placement of the DEMEC target points the beam forms (See Figure 5-6) were
removed after one day (18-24 hours) and the specimen was allowed to dry at ambient conditions
to obtain a surface dry condition. The centerline of the strand layout was marked along the strand
centroid defining the placements of the target points. The strand centerline was 51mm (2 in.)
130
Conclusions or recommendations in this report are the opinions of the authors. PCI assumes no responsibility for the interpretation or application of the information contained herein.
from the base of the beam (Figure 5-1). The concrete surface was lightly grinded and then cleaned
along the prestressing centerline to prepare the surface for bondiiag of the target points. The
target points were attached on both sides of the beam using a rapid setting adhesive. Since the
variation of stresses is more pronounced in the transfer zone (end of the beam), the spacing of the
target points was 51 mm (2 in.) along the expected transfer zone of 1.52 m(60 in.). For the rest
of the beam, excluding the transfer zones the spacing of the target points was increased to 203
mm (8 in.). For Phase-2, the target points were placed only in the transfer zones, as it was
observed from the results of Phase-1 that the information obtained from the non-transfer zone
(central zone) was of no use. In order to measure the strains in the target points close to the end
of the beam, extension brackets were attached as shown in Figure 7-4. Target points were
attached to both sides of the beam in order to capture any unbalanced effects from the pair of
prestressing tendons.
Figure 7-3. Performing Measurement with aDEMEC Gage
Figure 7-4. Extension Brackets to MeasureStrains at Beam Ends
7.2.2 Concrete Surface Strain Measurements
Initial (baseline) concrete surface strain measurements were taken (Figure 7-3) prior to
the release of the prestressing strands. Final strain measurements were taken approximately 4
hours after the release of prestress. Two sets of readings were recorded for each side to increase
confidence in the readings. Readings were taken by the same person and care was taken to
maintain the same amount of pressure and posture while taking the measurements.
131
Conclusions or recommendations in this report are the opinions of the authors. PCI assumes no responsibility for the interpretation or application of the information contained herein.
7.2.3 Cot~struction of Surface Compressive Strain Profile
The first step to determine transfer length from concrete strains involves the construction
of a concrete strain profile for each end and each side of the beam. The compressive strain for
each measured gauge length of 203 mm (8 in.) was obtained by dividing the difference in the
recorded values of the measurements taken prior and after the release of prestress by the gage
length of the DEMEC device. The strain value obtained from the measurement of two DEMEC
points is assigned to the middle of these two points. In the transfer zone, where the spacing of the
target points is reduced, these middle values overlap. Hence, an average is taken of three
consecutive readings and this value is applied to the middle of these three points. This procedure
has been termed "smoothing the data" [50]. A general equation for the strain data smoothing
procedure, with reference to Figure 7-5 is represented as follows:
Once the strain values are assigned to each target disc point, the concrete strain profile is
plotted against the distance of the particular target point from the end of the beam. The data
obtained from the DEMEC points tends to have considerable scatter. Smoothing techniques
(Figure 7-5) has been shown to lessen the scatter and reduce the effect of data points that have
132
Conclusions or recommendations in this report are the opinions of the authors. PCI assumes no responsibility for the interpretation or application of the information contained herein.
¯ values higher Ol" lower than the average. By smoothing the data it is easier to define .the plateau
(see Figure 7-7)at which the constant strain in the beam is established [54]. A plot comparison of
the smoothed and non- smoothed (raw data) is shown in Figure 7-7.
70O
600
500
"~- 400
300
0Distance ~Tom end of the beam (in.)
10 20 30 40 50 60 70 80 90 100 110 120
200
¯ Smoothed Data100 / / -- Unsm°°thedDatal
0 300 600 900 1200 1500 1800 2100 2400 2700 3000
Distance from end of the beam (mm)
Figure 7-6. Comparison of Smooth and Non- Smooth (RAW) data
Distance from end of the beam (in.)0 10 20 30 40 50 60 70 80 90 100 110 120
700
600
500
400
300
200
100
00 300 600 900 1200 1500 1800 2100 2400 2700 3000
Distance from end of the beam (mm)
Figure 7-7. Location of AMS values
133
Conclusions or recommendations in this report are the opinions of the authors. PCI assumes no responsibility for the interpretation or application of the information contained herein.
7.2.4 Determination of Average Maximum Strain (AMS)
The 95% average maximum strain (AMS) method represevXs an accurate value for
determining the transfer length [50]. The AMS is the average of all the strains contained on or
near the plateau of the fully effective prestress. To determine the AMS, strain values in the likely
plateau region" were ~visually inspected and then the arithmetic mean of these values was
calculated. It may include all the points above the 95% AMS line, but generally, only the points
clearly on the strain plateau are chosen. Although, this method is subjective as it requires visual
definition of the plateau region, the AMS value will not change significantly if one or two data
points either included or excluded from the average. Nevertheless, care was taken to be
consistent in this approach for all the transfer zones [50].
In this project, the 95% AMS method was used to obtain the transfer length from the
concrete strain profiles. For this, the smoothed concrete strain profiles were plotted along the
length of the beam and a horizontal line representing the 95% AMS value for that particular
transfer zone was also plotted. The transfer length was obtained as the value of the distance
along the length of the beam where the 95% AMS line intersected the concrete strain profile.
7.2.5 Phase-1 Results - Concrete Strains Method
In Phase-l, two beams were cast for each mix and concrete strains measurements were
taken on both sides of the beam, therefore, four transfer zones were evaluated for each beam.
Moreover, two trials of readings were taken for each side of the beam. Hence, a total of 8
transfer length values were obtained for each beam. A total of 16 values of transfer lengths were
thus obtained for each mix design by plotting each set of data (a total of 16 sets) separately. Also,
a single plot of concrete strains was obtained for each beam by averaging 8 sets of raw concrete
strains, from which a single value was obtained from this single plot. Similarly, a single plot of
concrete strains was obtained by averaging all the 16 sets of raw concrete strain measurements,
thereby obtaining a single transfer length value for each concrete mix. In this section, plots for
each mix (average of 16 values) are shown as follows: NCCB (Figure 7-8), SCC1 (Figure 7-9),
SCC2A (Figure 7-10), SCC2B (Figure 7-11), SCC3 (Figure 7-12). The plots for each beam
(averages of 8 plots) are given in Appendix C.
The single concrete strain profile for each mix obtained from the averages of the concrete
strains (16 sets) does not represent the actual transfer length for that particular mix, since it may
134
Conclusions or recommendations in this report are the opinions of the authors. PCI assumes no responsibility for the interpretation or application of the information contained herein.
include bad data points which may skew the overall plot. Moreover, while a single plot obtained
from averaging all 16 sets of data may provide a smoother and relatively good looking plot it
may not provide the stafi-stical parameters such as the mean (#) and standard deviation (o). As a
result, the mean transfer length (Lt-#) value and its standard deviation (Lt-o-) for any particular
mix by concrete strain profile method were obtained from t’ne 16 individual concrete .strain plots
and not single averaged plots.
It was also found that the numerical average from the 16 individual plots was not
significantly different from the transfer le~agth value obtained from a single strain profile plot
obtained from averaging 16 sets of data. Table 7-1 compares the mean transfer length values for
each mix obtained from the numerical averages of all the 16 set of values. The individual values
of each plot are provided in Appendix C. It was also found that all the values of transfer length
obtained from the 16 individual plots were within the limits of twice the standard deviation
(Lt - 2# _< Lt _< L¢ +2# ), thereby, if normal distribution is assumed, the values of L~ fall within
the 95% confidence interval.
Figure 7-13 summarizes the transfer length value for each mix obtained by the method of
concrete strain profiles. It can be observed that the obtained transfer length values seem to show
a trend, where the transfer length values of the SCC2 mix seems to be bounded by the results for
SCC 1 and SCC3 mixes.
As discussed in CHAPTER 2 and CHAPTER 3, the transfer length as per ACI-318
recommendations [3] is given by:
Lt_ACl _ f~d~ (7-2)3
Since the strand used in a particular phase of the project is the same for all concrete mixes, the
factor (db / 3) should be an invariant and the effective stress in the strand should be the only
varying parameter. For a single concrete mix, two test units were manufactured, with each unit
prestressed individually. Although care was taken to maintain relatively similar stress levels in
all the test units, the jacking stress and hence the effective stress was not exactly the same in all
the test units. The jacking strains and the effective stresses at prestress release are provided in
Table 5-2 and Table 5-3 for Phase-1 and Phase-2 respectively. In order to obtain a single value
for each concrete mix that could be used to study the relative performance of different concrete
mixes, the obtained experimental transfer lengths were normalized with the respective ACI
135
Conclusions or recommendations in this report are the opinions of the authors. PCI assumes no responsibility for the interpretation or application of the information contained herein.
predicted transfer lengths, in other words, the experimental transfer lengths were normalized into
where, Lt_,~a,~ is the me.asured transfer length and Lt-,.,~,o is a dimensionless parameter that relates
the transfer length of the test unit to that of ACI recoro_mendations.
The Lt-ratio parameter in the above equation normalizes each of the test unit with its
conesponding effective stress, thereby providing a good comparison with the ACI code
recommendations. A!so~ for two different test units of a similar concrete type the average value
of this ratio would be a good representative parameter of the concrete mix. It should be noted
that this dimensionless parameter is also dependent on the experimental technique used. For the
value of transfer length corresponding to the ACI recommendations, this ratio is unity. Hence,
any value higher than unity would suggest that the ACI recommendations are non-conservative
for that particular concrete mix, by the particular experimental measurement technique under
consideration. The average values of the Zt-ratio per mix obtained by concrete strain profile
method for Phase-I strands are provided in Table 7-2. Figure 7-14 summarizes the average
values of Lt-,.atio for all mixes in Phase-1. A similar Lt-,.atio was determined for the draw-in method
in Section 7.3.2. A representative experimental Lt-,.atio for a particular mix was thus obtained from
the average ratios of both experimental methods and discussed in Sections 7.4 and 7.5.
Table 7-t. Average Transfer Length per Mix Type - Concrete Strains - Phase-1
Mix Type
NCCB
SCC1
SCC2A
SCC2B
SCC3
Mean Transfer(mm)
521
732
784
802
763
Length (Lt-fl) Standard Deviation (Lt- o’)(mm) (inches)
85 3.36
94 3.68
103 4.07
135 5.30
133 5.24
(inches)
20.53
28.82
30.88
31.56
30.02
136
Conclusions or recommendations in this report are the opinions of the authors. PCI assumes no responsibility for the interpretation or application of the information contained herein.
Table 7-2. ACI -Normalized Transfer Length Ratios by Concrete Strain Method - Phase-1
Mix Type
Mean
0171 ~
0.97
0.97
1.02
0.85
Lt-meas
gt - A ci
NCCB
SCC1
SCC2A
SCC2B
SCC3
Standard-Deviation
0.12
0.12
0.13
0.17
0.15
0450
5Distance from end of the beam (in.)
10 15 20 25 30 35 40 45 50 55 60
oc-O
400
350
300
250
200
150
100
50
00
Lt = 497.8 mm
(19.6 in.)
95% AMS
150 300 450 600 750 900 1050 1200 1350 1500
Distance from end of the beam (mm)
Figure 7-8. Determination of Transfer length from Concrete Strain Profiles - Phase-1NCCB (Average of all 16 transfer zones)
137
Conclusions or recommendations in this report are the opinions of the authors. PCI assumes no responsibility for the interpretation or application of the information contained herein.
~ ~ _ Distance from end of the beam (in.)0 5 10 15 20 25 30 35 40 45 50 55 60
Figure 7-10. Determination of Transfer length from Concrete Strain Profiles - Phase- 1SCC2A (Average of all 16 transfer zones)
138
Conclusions or recommendations in this report are the opinions of the authors. PCI assumes no responsibility for the interpretation or application of the information contained herein.
5OO
45.0
400
350
300
250
200
150
100
50
00
Distance-from end of the beam (in.)0 5 10 15 20 25 30 35 40 45 50 55 60
150 300 450 600 750 900 1050 1200 1350 1500
Distance from end of the beam (mm)
Figure 7-11. Determination of Transfer length from Concrete Strain Profiles - Phase-1SCC2B (Average of all 16 transfer zones)
Distance~rrom end of the beam (in.)0 5 10 15 20 25 30 35 40 45 50 55 60
Figure 7-12. Determination of Transfer length from Concrete Strain Profiles - Phase-1.SCC3 (Average of all 16 transfer zones)
139
Conclusions or recommendations in this report are the opinions of the authors. PCI assumes no responsibility for the interpretation or application of the information contained herein.
100
40
35
~ 25
20
0 0NCCB SCC1 SCC2A SCC2B SCC3
MIX TYPE
Figure 7-13. Phase- 1 - Comparison of Transfer Length Values Obtained from Concrete Strains
Conclusions or recommendations in this report are the opinions of the authors. PCI assumes no responsibility for the interpretation or application of the information contained herein.
It can be observed from Figure 7-14 and Table 7-2 that the measured transfer length by
the concrete strain profile method was lowest for NCC mix by approximately 30% relative to the
ACI predictions. Also, NCC had the least deviation of all mixes. Among the SCC mixes, SCC3
had the least measured value of approximately 15% be!ow the ACI prediction, followed by
SCC1 and SCC2A mixes which were both 3% lower than the code prediction. SCC2B mix had~
the highest measured transfer length with a value of approximately 2% over the AC! prediction.
It should be noted, however, that the SCC2B values have a very high deviation. Hence, it cannot
be concluded that SCC2B is not conservative. Also, these values are the experimental values
obtained from only the concrete strain profiles method. In order to find a single representative
value for each mix type, similar results from the draw-in measurements (discussed in Section
7.3.2) will be determined and a mean representative value for a particular mix would be
obtained.
7.2.6 Phase-2 Results - Concrete Strains Method
In Phase-2, one beam per mix was cast and concrete strain measurements were taken
similar to the Phase-1 beams on both sides of the beam. Therefore, four transfer zones were
evaluated per beam. Two trials of reading were again taken for each side of the beam, thus
leading to a total of 8 transfer length values per mix. A single plot of concrete strains was
obtained for each mix by averaging all of the 8 concrete strain measurements.
Plots for each mix (average of 8 sets) are shown as follows: NCC (Figure 7-15), SCC1
(Figure 7-16), SCC2 (Figure 7-17) and SCC3 (Figure 7-18). Similar to Phase-1 results,
individual plots of strain profiles were used. The mean value of measured transfer length
per mix and its standard deviation (Lt-o-) were obtained from the 8 sets of data. The individual
values for each plot are shown in Appendix C. In some cases, the strain profiles had several bad
points and these were filtered. In such cases, the poor quality strain profiles were not considered
in the mean value.
Similar to Phase-1, it was also found that all the values of transfer length obtained from
the 8 individual plots per mix were within the limits of twice the standard deviation (Lt - 2/1 _<
_< L¢ +2/z ), thereby, if normal distribution of L~ is assumed, the values of Lt fall within the 95%
confidence interval. The mean values of transfer lengths obtained for all the mix designs are
141
Conclusions or recommendations in this report are the opinions of the authors. PCI assumes no responsibility for the interpretation or application of the information contained herein.
provided in _Table 7-3. Figure 7-19 summarizes the transfer length values -for the Phase-2 test
units obtained by the concrete strains method.
Similar, to the Phase-1 results, the transfer lengths obtained from surface concrete strains
were normalized to the transfer length from AC! recommendations and Lt-,.atio was found as given
in Equation 7=3. The average values of Lt-,.atio per minx obtained by the concrete surface profile
method for Phase-2 test units are provided in Table 7-5. Figure 7-20 smqmaarizes the average
values of L~-ratio for all mixes in Phase-2.k
Table 7-3. Average Transfer Length per Mix Type - Concrete Strains - Phase-2
Mean Transfer Length Standard Deviation
Mix Type (Lt
mm inches mm Inches
NCCB 417 16.40 43 1.71
SCC1 569 22.42 68 2.67
SCC2 624 24.57 30 1.18
SCC3 634 24.96 57 2.25
Table 7-4. ACI -Normalized Transfer Length Ratios by Concrete Strain Method - Phase-2
Lt-meas
Lt-AC1Mix Type
StandardMean Deviation
NCCB 0.510 0.053
SCC1 0.771 0.092
SCC2 0.764 0.037
SCC3 0.847 0.076
The transfer lengths obtained from surface concrete strains in Phase-2 were also found to
follow a similar trend, where in the average transfer length values of SCC2 mix seem to be
bounded by the results of the SCC1 and SCC3 mixes. Also, the Lt-ratio values (Figure 7-20) for
Phase-2 concrete strain measurements that relate the measured transfer length with the ACI
142
Conclusions or recommendations in this report are the opinions of the authors. PCI assumes no responsibility for the interpretation or application of the information contained herein.
recommendations ,show that the measured transfer length values for Phase-2 strands are.well
below the ACI recommendations. The lowest measured transfer length was obtained for the NCC
mix with a value appro×imately 49% lower than the ACI recommendations. All SCC mixes had
values higher than NCC mix but within the ACI recommendations. Among SCC mixes, SCC1,
SCC2 andSCC3 were approximately 23%, 24% and 15% lower than those predicted by the ACI
recommendations, respectively. It was observed that the measured transfer length values and
ACI normalized transfer length ratios for Phase-2 strands were lower relative to Phase-1 strands
(see Section 7.2.5.). This is attributed to the better quality of strands used in Phase-2.
Distance from end of the beam (in.)0 5 10 15 20 25 30 35 40 45 50 55 60
Figure 7-15. Determination of Transfer length from Concrete Strain Profiles - Phase-2NCC (Average of all 8 transfer zones)
143
Conclusions or recommendations in this report are the opinions of the authors. PCI assumes no responsibility for the interpretation or application of the information contained herein.
Distance from end of the beam (in.)0 5 10 15 20 25 30 35 40 45 50 55 60
Figure 7-17. Determination of Transfer length from Concrete Strain Profiles - Phase-2SCC2 (Average of all 8 transfer zones)
144
Conclusions or recommendations in this report are the opinions of the authors. PCI assumes no responsibility for the interpretation or application of the information contained herein.
Distance from end-of the beam (in.)0 5 10 15 20 25 30 35 40 45 50 55 60
Figure 7-18. Determination of Transfer length from Concrete Strain Profiles - Phase-2SCC3 (Average of all 8 transfer zones)
i !30700 I
25
20 ~"
is _=
NCCB SCC1 SCC2A SCC3
MIX TYPE
Figure 7-19. Comparison of Transfer Length Values Obtained from Concrete Strains - Phase-2
145
Conclusions or recommendations in this report are the opinions of the authors. PCI assumes no responsibility for the interpretation or application of the information contained herein.
7.2. 7 Precision of Results from Concrete Surface Strains (DEMEC) measurements [23]
The degree of accuracy of the transfer length values obtained by the concrete strain
measurement method depends on various factors as follows:
¯ Spacing of DEMECpoints: The minimum spacing of the target points was 51mm
(2 in.), thus assigning a precision less than this value would completely rely on
the smoothening process and interpolation.
Strain measurements: The DEMEC readings needed to be taken in hard-to-reach
places, which compromised the quality and consistency of the readings.
¯ Temperature: Almost all the DEMEC measurements were made consistently at
approximately same ambient temperature, since the casting of the test specimen
and measurements were all done indoors. But it should be noted that temperature
fluctuations of the concrete surface between readings will introduce strains that
will be incorporated in the measurements. This can be especially a problem when
instrumenting high strength concrete specimens at early age because of the very
high hydration temperatures [23].
146
Conclusions or recommendations in this report are the opinions of the authors. PCI assumes no responsibility for the interpretation or application of the information contained herein.
The accuracy of the DEMEC measurements may have been decreased by any of these
factors noted above. However it should be realized that the overall accuracy of the DEMEC
system has been reported to be approximately 16 micro strains [23].
7.3 Strand Dra-w-In Method
The second method used to determine transfer length of the i3 mm (0.5 in.) prestressing
strands was the draw-in method. This method follows from the premise that when prestress is
released, the strand at the face of the member is pulled into the concrete member. Draw-in is the
measurement of this "pulling-in" phenomena, hence it is also referred to as "suck-in" or "free
end slip" [8]. In this thesis the term "draw-in" is used to refer to this phenomenon and the term
"end slip" is used to refer the strand slip due to external loads. Draw in measurements have been
shown to correlate well with transfer length [54]. Due to the simplicity of this method it was also
pursued in this project as a counterpart to the concrete strain method. The relationship of the
measured draw-in and the corresponding transfer length are provided in Section 3.3.
7.3.1 Test Procedure
Draw-in measurement involves determining the relative movement of the strand into the
concrete member at the end of the beam. In order to avoid irregularities in the concrete surface, a
glass target plate was attached with rapid setting glue on the place where the draw-in
measurements were to be taken prior to release and measurements. The draw-in measurements
were made using a digital vernier with a precision of 0.00254 mm (0.0001 in.). The draw-in
measurements were made possible by mounting reference brackets on to the strands
approximately 50 rmna (2 in.) from the face of the beam Figure 7-21. These brackets (U-channels)
were attached to the strands with metal clamps. The metal clamps were tightened such that there
was no relative motion of the clamp, U channel and the strand. The channel webs had a cavity in
them through which the movable end of the vernier was inserted such that the vernier came in
contact with the target glass plate. Since the vernier had to pass through the two cavities in the
channel webs, it made it possible for the readings to be taken from approximately the same point
of consideration, thus making the measurements more consistent and accurate.
147
Conclusions or recommendations in this report are the opinions of the authors. PCI assumes no responsibility for the interpretation or application of the information contained herein.
Figure 7-21 Strand Draw-in - Instrumentation and Measurement
It should be noted the strands were flame cut after annealing see Section 5.3. However, in
some cases, the strands unwound or splayed violently thereby affecting the U-channel mounting.
This problem was overcome by tightly attaching three or more metal clamps before the
measurement device. In such cases, these metal clamps prevented the effect of the strand
unwinding from reaching the measurement device. For most of the test specimens, prestress
release was gradual, and without any disturbance to the reference U channels.
The draw-in measurements were taken prior and after release (-4 hours later), and then at
7, 14, 28 days and finally at the day of tlexural test (Chapter 8). The beams had to be moved
from the casting bed to the storage yard and brought back from the yard at a later date to be setup
for flexural testing_(Chapter7). In some cases, during this process, the glass target plates for
draw-in measurements were damaged. In such cases, new glass target plates were attached at the
same location in the best possible way and draw-in measurements were carried out. Effect on
accuracy from these instances is difficult to estimate but care was taken in the data analysis to
consider the possibility of error sources such as this one. In order to avoid the problem with glass
target plates, in Phase-2, a small flat- aluminum plate was cast in place where the measurements
were to be taken.
148
Conclusions or recommendations in this report are the opinions of the authors. PCI assumes no responsibility for the interpretation or application of the information contained herein.
7.3.2 Determination of Draw-ln Value and Transfer Length - Phase-1
The draw-in value (A~ in Equation 4-27) was obtained as the difference of the readings
taken prior to release with respect to all future readings. This value was used in Equation 7-9 to
obtain the transfer length at various ages of concrete. Figure 7-22 shows the average draw-in
values at prestress release for each of the mix types in the Phase-1 test units°
4.0 i
".//tt/t/J ............
///////~
NCCB SCC! SCC2A SCC2B SCC3
0.16
0.14
0.12
0.10 ._c
0.08 ~
0.06 ,.--
0.04 u~
0.02
0.00
MIX TYPE
Figure 7..22. Average Draw-in Values at Release (3 days) %r all mixes ,.Phase,, 1
Although the initial stress in the strands was almost the same for all strands and for all of
test mix designs, the exact stress values calculated from the measured monitoring strain gauges
(Table 5-2 and Table 5-3) were used to obtain the transfer length for each mix. Figure 7-23
shows the average transfer length values obtained at release for each of the mixes from the draw-
in values (Equation 4-27).
149
Conclusions or recommendations in this report are the opinions of the authors. PCI assumes no responsibility for the interpretation or application of the information contained herein.
11001000
800
300 ~___
200i100 i---
0NCCB SCC1 SCC2A SCC2B SCC3
45
40
5
0
MIX TYPE
Figure 7-23. Average Transfer Length Values at Release from Draw-in values -Phase-1
Similar to the concrete strain profile methods, in order to perform a relative study for all
concrete mixes, the measured transfer length were normalized with the transfer length obtained
from ACI recommendatons. Hence the Lt-r,~tgos were calculated as given by Equation 7-2. The Lt-
ratios calculated at prestress release for Phase-1 strands from draw-in measurement are given in
Table 7-6 and summarized in Figure 7-24. As discussed earlier, the Lt-ratio parameter compares
the measured transfer length with respect to the ACI recommendations. Similar to the Lt-ratio
calculated from concrete strain profdes, the measured Lt-~,~tZo for Phase-1 strands by the draw-in
method also shows that the NCC mix had the lowest measured transfer length. NCC mix was
approximately 24% lower than that predicted by the ACI recommendations. Among the SCC
mixes, SCC1 had 3% more transfer length than the ACI predictions. SCC2A, which was a stiff
mix, was 27% below the ACI estimate followed by the SCC2B and SCC3 mixes with 13% and
10% lower values than the ACI value.
150
Conclusions or recommendations in this report are the opinions of the authors. PCI assumes no responsibility for the interpretation or application of the information contained herein.
Table 7-5. Draw-in and Transfer Length Values at Various Concrete Ages (Phase-1)
Conclusions or recommendations in this report are the opinions of the authors. PCI assumes no responsibility for the interpretation or application of the information contained herein.
As discussed in Section 7.2.5, the value of any one mix being slightly higher than the ACI
recommendations does not imply that the respective concrete is un-conservative with respect to
the ACI recommendations. These values are specific to a particular experimental method. Also,
the variation from the code was only 3% yet the standard deviation was 29%. Thus, it calmot be
strongly concluded that the ACI reconmaendations are invalid for a pal~icular concrete case. For
a better understanding, the Lt-,.atio (ACI nol~-nalized transfer lengths) values from both
experimental values were averaged and a comparative study is produced in Section 7.4.
Table 7-6. ACI -Normalized Transfer Length Ratios by Draw-in method - Phase-1
Mix TypeStandardMean Deviation
NCCB 0.76 0.17SCC1 1.03 0.29
SCC2A 0.63 0.26
SCC2B 0.87 0.22
SCC3 0.90 0.13
Draw..in measurements taken at several time periods after release showed that the draw~-in
~Talues increased with time for the Phase-~l strands. This variation was different for every mix.
Table %5 shows the variation of draw-in values and the corresponding calculated transfer length
values for various mixes at different ages of concrete for the Phase~ 1 test units. The variation of
transfer length (obtained from draw-dn measurements) with time is shown in Figure 7-25. The
day of test (DOT) ch’aw-in reading for the SCC2A mix was not taken due to miscommunication
between the research team members and hence the corresponding values in Table 7-5 is shown
as "n/a."
152
Conclusions or recommendations in this report are the opinions of the authors. PCI assumes no responsibility for the interpretation or application of the information contained herein.
1,4 ¯
1.2
1.0
0.4
0.2
0.0NCCB SCC1 SCC2A SCC2B SCC3
MIX TYPE
Figure 7-24. Comparison of ACI Normalized Lt by Draw-in method - Phase-1
Age Of Concrete (days)0 20 40 60 80 100 120 140
1400
~ 1200
lOOO
800
~oo
400
20O
~ NCCB _
~ SCC2AI / ~-,- scc~I //
0 200 20 40 60 80 100 120 140
Age Of Concrete (days)
60
55
50 "~45 N
Figure 7-25. Variation of Transfer Length with Time - Phase-1
153
Conclusions or recommendations in this report are the opinions of the authors. PCI assumes no responsibility for the interpretation or application of the information contained herein.
The NCCB beams (Phase-l) showed a relatively gradual and small variation with time,
while all the SCC mixes showed a significant increase. At 28 days, the percentage increase in
transfer length measured by draw-in measurements relative to similar measurements at prestress
release was the least for NCCB with a value of approximately 39%. SCC mixes showed an
increase of approximately 60%, 30% and 18% for SCC!, SCC2B and SCC3, respectively. At the
day of test (- 120 days), the NCCB beams showed an increase of 56% more transfer length
relative to the value at prestress release whereas the SCC!, SCC2B and SCC3 beams showed an
increase of 83%, 94% and 60% respectively. The strand bond quality and its role on the increase
in draw-in measurements over time (and thus transfer length) is discussed in Section 7.5.1.
7.3.3 Determination of Draw-In Value and Transfer Length - Phase-2
Similar to Phase-1, draw-in values were obtained for all test units in Phase-2 and transfer
lengths were obtained from Equation 4-27. Figure 7-26 and Figure 7-27 show the average draw-
in measurements (of two strands in both beam ends) and the corresponding transfer length values
at transfer for each of the mix types of the Phase-2 test units. Also, the ACI normalized transfer
length values (Lt-,.atio) were obtained from Equation 7-2 and are given in Table 7-8 and are shown
in Figure 7-28.
4.0
3.5
3.0
2.5
2.0
1.5
1.0
0.5
0.0
0.12
NCC SCCl SCC2 SCC3
t 0.06
I 0.04
.......... t 0.02
0.00
MIX TYPE
Figure 7-26. An average Draw-in value at Release (3 days) for all mixes - Phase-2.
154
Conclusions or recommendations in this report are the opinions of the authors. PCI assumes no responsibility for the interpretation or application of the information contained herein.
1100
1000
45
4O
100
NCC SCC1 SCC2 SCC3MIX TYPE
Figure 7-27. Average Transfer Length Values at Release from Draw-in values - Phase-2.
As discussed in section 7.2.5, the Lt-ratio normalizes the transfer length with the
corresponding effective stress and hence also relates the measured transfer length value -with the
ACI equation for transfer length. Similar to the results of concrete strain profile method, and
consistent with the results in both phases, the NCC mix had the lowest measured transfer length
with approximately 28% lower transfer lengths than ACI predictions. Among the SCC mixes, the
SCC3 exceeded the ACI equation equality limit by approximately 4%, yet at the same time it had
the highest deviation of approximately 14%. The SCC2 and SCC3 were lower than ACI
predictions by 15% and 3% respectively. Overall, Phase-2 strands had much lower transfer
lengths than Phase-1 strands, which can be attributed to the better quality of strand used in
Phase-2 (see Section 7.5).
Table 7-7 shows the variation of draw-in measurements and the corresponding transfer
length values at various concrete ages for the Phase-2 test units. The concrete age at day of
flexural testing for the Phase-2 test units was much smaller than for the phase l test units.
Instrumentation for flexural testing requires that the instrumentation for draw-in measurements
be removed. The age of concrete at flexural tests (development length testing) of Phase-2 beam
units (- 55-75 days) was performed much earlier than the Phase-1 beam units (-120 days). Also,
the day of test draw-in measurements were not taken for some beam specimens due to
miscommunication between the research team members. Hence the comparison of the variations
155
Conclusions or recommendations in this report are the opinions of the authors. PCI assumes no responsibility for the interpretation or application of the information contained herein.
in draw-in measurements are done up to the concrete age of 28 days. Figure 7-29 shows the
variation of transfer length (obtained from draw-in measurements) with time for Phase-2 test
units.
Table 7-7. Draw-in and Transfer Length Values at Various Concrete Ages - Phase-2
Age of Strand Dra~ .....in Transfer LengthConcrete Standard Standard
(days) Average Deviation Average Deviationmm in. mm mm in. mm I in.
209* For all beams, release was 3 days after concrete casting
6.055.745.535.976.13
3o263.133.143.28
3.12.85
6.25.636.486.278.22
156
Conclusions or recommendations in this report are the opinions of the authors. PCI assumes no responsibility for the interpretation or application of the information contained herein.
Table 7-8. ACI -Normalized Transfer Length Ratios by Draw-in method - Phase-2
Mix Type
NCCB
SCC1
SCC2
SCC3
Mean
0.72
0.97
0.85
1.04
StandardDeviation
0.16
0.19
0.10
0.19
As discussed in Section 5.2.2, the strand used in Phase-2 was pre-qualified to have
adequate bond performance. This needs to be considered while interpreting the results. It can be
observed in Figure 7-29 that the transfer length seems to increase rapidly from the time of
transfer up to 7 days and then stabilizes as time progresses. The dotted line in Figure 7-29
indicates that a predicted value for SCC3 mix at 21 and 28 days of age of concrete is used
instead of the actual measured value. The measured value at 21 and 28 days was lower than the
previously measured value at 14 days, which is not possible. The trend of all other SCC mixes
was observed and found that the draw.in values were stabilizing and hence the same measured
value at concrete age of !4 days was used fbr 21 and 28 days. The overall increase in transfer
length for the Phase~.2 test units from the day of release to 28 days from the draw-in
measurements was found to follow aveW similar trend as the Phase-1 strands (Figure 7-25). The
percentage increase was lowest for the NCC mix with a value of approximately 42%. Similarly,
for the SCC mixes the percentage increase was 54%, 37% and 22% for SCC1, SCC2 and SCC3
respectively. A comparison of the Phase-1 and Phase-2 variations of transfer length with time is
discussed in Section 7.5.
157
Conclusions or recommendations in this report are the opinions of the authors. PCI assumes no responsibility for the interpretation or application of the information contained herein.
1.4
1.0 ~
0.8
0.6 ....
0.4 ....
0.0NCCB SCC1 SCC2 SCC3
MIX TYPE
Figure 7-28. Comparison of ACI Normalized Lt by Draw-in method - Phase-2.
Age Of Concrete (days)0 ? 1,0 1,5 20 2,5
1400 --~- NCCB--=-- SCC1
1200 --~-- scc~ -v
1000
~ 800I
L_
,~_ 600
== 400
200
3050
45
40 ~
35 ~L_
30 ==
25
0 .... ’ .................. 200 5 10 15 20 25 30
Age Of Concrete (days)Figure 7-29. Variation of Transfer Length with Time - Phase-2
158
Conclusions or recommendations in this report are the opinions of the authors. PCI assumes no responsibility for the interpretation or application of the information contained herein.
7.4 Comparison of Experimentally Measured Transfer Lengths with ACI 318Recommendations.
Transfer length values obtained from each of the experimental techniques (concrete strain
profiles and Draw-in) in both phases of the project were presented and discussed in the previous
sections. Transfer length according te the ACI 318/AASHTO recommel~_dations (Lt-~ic~) [3] was
obtained fiom Equation 2-6. According to Equation 2-6, transfer length is dependent only on the
effective stress ~;e) and diameter (d~) of the strand. The procedure for calculating the effective
stress by taking into account all possible prestress losses has been discussed in Chapter 4. The
calculated values of effective stress for the Phase- 1 and Phase-2 test units are given in Table 5-2
and Table 5-3, respectively. It should be noted that the effective stress in the strand is a function
of time as it incorporates time dependent losses. The experimental evaluation of transfer length
by concrete strain profiles is practically cumbersome to be performed frequently and was hence
performed only at 3 days, corresponding to the release of prestress. Hence, in this section, the
comparison of the experimentally measured transfer lengths with the ACI-318 recommendations
is done only at prestress release (3 days).
In Phase-1, there were two beams per mix design and each had slightly different prestress.
In order to have a single ACI recommened transfer length value for that particular mix, a average
value from both the beams was computed and is presented in Table 7-9. For Phase-2, only one
test unit per mix was constructed, hence the effective stress and mix-.representative AC!
recommended transfer length was calculated directly and is presented in Table 7.. 10
Table 7-9 Transfer Length values from ACI 318 / AASHTO equation - Phase-, 1
Transfer length L,. = f~d~Mix 3
mm (inches)
NCCB 760 (29.93)
SCC1 756 (29.77)
SCC2A 808 (31.83)
SCC2B 795 (31.29)
SCC3 898 (35.34)
159
Conclusions or recommendations in this report are the opinions of the authors. PCI assumes no responsibility for the interpretation or application of the information contained herein.
In-order to compare the experimentally measured transfer lengths with the ACI
recommendations, a single representative measured transfer length value (Ltmea~) was obtained by
averaging the experimentally measured transfer length values by both the concrete profile and
draw-in methods. A ratio between the experimentally measured transfer length (Ltmeas) and ACI
predicted transfer length (Lt-Ac;) was then obtained. These ratics were computed for both of the
project phases and are discussed in the following sub-sections.
Table 7-10 Transfer Length values from AC! 3 !8 /AASHTO equation- Phase-2
Mix Transfer length Lt =--fsedo (inches)31 inch = 25.4 mm
NCC 817 (32.17)
SCC1 738 (29.07)
SCC2 816 (32.14)
SCC3 749 (29.48)
7.4.1 Comparison of Phase-1 Results with ACI318 Recommendations
The Phase.~l transfer lengths obtained by both experimental methods (concrete strains
and draw..in) show a consistent trend in the obtained transfer length values. "Fable 7,.! ! and
Figure 740 summarize the average values fro1Tl each of the experimental methods against the
value from the ACI recommendations. The transfer length value of the SCC2 mix was bounded
by the SCC1 and SCC3 mixes. A ratio of the measured transfer length (Lt,,,~,~) with transfer
length predicted by ACI equation (Lt-Ac9 is also shown in Table 7= 11. It was observed that the
average experimentally measured transfer lengths were less than code estimate for all mixes
except SCC1, which is exactly on the limit of ACI recommendations. The NCC mix had the
lowest measured transfer lengths, of approximately 28% lower than the ACI predicted value.
Among the SCC mixes, SCCI (high fines mix) had the highest transfer length with an
experimental value almost equal to the ACI predictions. It was then followed by the beams with
SCC2B, SCC3 and SCC2A mixes, which were lower than the ACI predictions by 8%, 13% and
20%, respectively. It should be noted that SCC2A was a stiff mix and had transfer lengths closer
to the NCC mix. Also, it is important to remember while interpreting the data that the strand used
160
Conclusions or recommendations in this report are the opinions of the authors. PCI assumes no responsibility for the interpretation or application of the information contained herein.
in the NCC mix was slightly rusted (see Section 5.2.2). Nevertheless, it can be concluded from
the results that the ACI code recommendation is conservative in determining th~transfer length
for all mix designs including the SCC 1 mix which was at the limit of the ACI recommendations.
At the same time, this finding seems to indicate that additional care must be taken while using
mix proportions similar to SCC1.
MixType
NCCB
SCC1SCC2ASCC2B
SCC3
Table 7-1 i. Summary of Average Transfer Lengths - Phase- 1
Measured Transfer Length
Concrete Strains
in.
20.5328.8230.8831.5630.02
Draw-in
mm in.566 22.29
782 3O.78508 20.01662 26.08
805 31.68
mm
521732784802763
TransferLength - ACI
( L t-A CI)
mm in.760 29.93
756 29.77808 31.83795 31.29
898 35.34
AverageExperimental
TransferLength(Lt-mea~
mm in.544 21.41757 29.8646 25.44732 28.82784 30.85
Lt-ACI
0.721.000.800.920.87
1200 i ~ Concrete Strains~ Strand Draw-in
1100 ~ ~ ACI/AASHTO1000 ~ Measured Average
200
!00
0NCCB SCCl SCC2A SCC2B SCC3
50
45
40
25 ¢
20 ~
5
0
MIX TYPE
Figure 7-30 Comparison of Measured Transfer Length with ACI Equation - Phase-1
161
Conclusions or recommendations in this report are the opinions of the authors. PCI assumes no responsibility for the interpretation or application of the information contained herein.
As seen in Table 7-1.1 and Figure 7-30, the transfer length values obtained from draw-in
and concrete strain measurements had some variation. This variation was not consistent for all
mixes° It can be noted, however, that the transfer length values from draw-in measmements were
generally higher than the values obtained from concrete strain measurements, except for the
SCC2 mixes.
7.4,2 Comparison of Phase-2 Results with A C1318 Recommendations
Phase-2 transfer lengths obtained by both the experimental measurement methods
(concrete strains and draw-in) are compared here with the values obtained according to the ACI
recommendations. For this phase, the results from both methods show a consistent trend. The
transfer length value of the SCC2 mix is bounded by the SCC1 and SCC3 mixes. Table 7-12
compares the average of the experimentally measured transfer lengths with the predicted values
from the ACI equation.
Table 7-12. Summary of Transfer Lengths - Phase-2
MixType
Measured Transfer Length
Concrete Strains Draw-in
TransferLength - ACI
AverageExperimental
TransferLength
~nm in. mm in. mm ino mm in.NCCB 41/ 16.40 592 23.31 817 32.17 504 19.85 0.62SCC1 569 22.42 715 28.14 738 29.07 642 125.28 0.87SCC2 624 24.57 695 27.38 816 32.14 660 25.97 0.81SCC3 634 24.96 781 30.74 74? .....2~._~8 _i _7_0Y 27.85 0,94
The transfer length values obtained from draw-in and concrete strain measurements had
some variation. However, this variation seems consistent for all mixes as the transfer length
values from draw-in measurements were generally higher than the values obtained from concrete
strains. As discussed in the previous section, this same pattern was not seen in the Phase-1 test
units. This could be attributed to the better instrumentation technique used in Phase-2, wherein a
flat aluminum plate was attached to the beam face where draw-in measurements were taken. In
Phase-l, a glass plate was glued to the surface which was susceptible to environmental factors,
162
Conclusions or recommendations in this report are the opinions of the authors. PCI assumes no responsibility for the interpretation or application of the information contained herein.
shrinkage of glue, susceptibility of being broken etc. Nonetheless, both phases showed overall
consistent results compared to the ACI recommendations.
The a~rage of transfer length values obtained form both experimental methods were
compared with the ACI equation for all the mixes. A ratio of the measured transfer length
to the transfer length predicted by the ACI equation (Lt-ACi) was determined. Table 7-12 shows
this ratio (Ltmeas /Lt-AC!) for all the mixes. It was observed that the ACI code equation is
conservative in determining the transfer lengths for all mixes. Similar to Phase-1 results, the
NCC mix had the lowest experimentally measured transfer length, which was approximately
38% lower than the ACI prediction. The transfer length value of the SCC2 mix was found to be
bounded by the SCC1 and SCC3 mixes. Unlike Phase-l, the SCC3 beam had larger transfer
value than SCC1. Nonetheless, all mixes had experimental transfer lengths below the ACI
prediction. Among the SCC mixes, the SCC1, SCC2 and SCC3 mixes were 13%, 19% and 6%
lower than their ACI prediction, respectively.
1200 ~ Concrete Strains~ Strand Draw-in
1100 ==== ACIiAASHTO
1000 mm~ Measured Average
~" 900 ~
---. 800 ~I:~ 700<9 600
i.,- 400 ~
’- 300 ~
200
100
NCC SCCl SCC2 SCC3MIX TYPE
50
45
40
35 .-v
30 "~
25 _~
20 ,.,-
15 ~
5
Figure 7-31 Comparison of Measured Transfer Length with ACI Equation - Phase-2
163
Conclusions or recommendations in this report are the opinions of the authors. PCI assumes no responsibility for the interpretation or application of the information contained herein.
7.5 Discussion
Similar to pu!!-out test results (chapter 6), the experimental results from the transfer length
program can be discussed fu~her using the following parameters: a) effect of strand bond
quality, b) effect of mix proportioning, c) effect of strand surface (rust of NCC mix of Phase-i),
and, d) Overall SCC behavior.
Transfer length was experimentally evaluated using concrete strain profiles and strand
draw-in measurements. Two different strand types classified based on the strand bond quality, as
explained in chapter 5, were used. For comparison, the average experimental results for each
mix from each of the phases are compared in this section. As discussed earlier, in Phase-1, the
SCC2A mix was a stiff mix and is thus not included in the comparison. Instead, results from the
SCC2B mix of Phase-1 will be compared with those of the SCC2 mix in Phase-2. Also, in order
to eliminate the variations due to different jacking strains in different beams, the average values
of ACI normalized transfer lengths (Lt-,.atio) are used to study the relative effects of the concrete
mixes and the different strands on transfer length.
7. 5.1 Effect of Strand Bond Quality on Transfer Length
As discussed in Section 5.2.2, strands used in each of the two project phases were
different, with the Phase.-2 strand being pre-qualified and of a better quality than that used in
Phase.-1. The better quality of the Phase-.2 strand was evident from the experimental transfer
length results. The transfer lengths obtained from Phase..2 were lower than those from the
corresponding mix designs of phasel. Nonetheless, it was observed that all of the SCC mixes
had larger transfer lengths than the NCC mixes in both phases.
Table 7-13 and Figure 7-32 compare the measured transfer lengths from both phases. The
ACI transfer length value is different for each of the mixes and hence is cumbersome to be
included in Figure 7-32. Moreover, test units of each mix have different prestress forces. As a
better way of assessing the relative performance of the strands and also compare with the ACI
recommendations the average ACI normalized transfer length ratio (L,-,.atio) of each of the mixes
from both phases is shown in Figure 7-33.
The last column in Table 7-13 describes the ratio of experimental transfer lengths of Phase-
2 to Phase-1. It was observed that the transfer lengths obtained from the pre-qualified Phase-2
strands were lower than those obtained from the lower quality strand used in Phase-1. It was also
164
Conclusions or recommendations in this report are the opinions of the authors. PCI assumes no responsibility for the interpretation or application of the information contained herein.
observed that the results of Phase-1 strands had higher deviations in the experimental values (see
Table 7-13) than higher quality Phase-2 strands (see Table 7-13). Considering the relatively
lower experimental transfer lengths, and the fulfillment of the ACI recommendations in Phase-2
strands with a larger margin than Phase-1 strands, it can be concluded that strand bond quality
has a significant effect on the transfer length performance.
Table 7-13. Comparison of Measured Transfer Lengths, Phase- 1 vs. Phase-2
MixType
Phase-1 (Lt, Phase-l)
’ StandardAverage
Deviationmm
544757
732
784
in.
21.4129.80
28.82
30.85
mm
103155
156
122
in.
4.046.12
6.15
4.81
mm
504
642
660
707
ino
19.85
25.28
25.97
27.85
mm
89111
56
107
Lt,Phase-2
,Phase-1
Measured Transfer LengthsPhase-2 (Lt, Phase-2)
StandardAverage Deviationin.
3.514.362.22
NCC 0.93
SCC1 0.85
SCC2 0.90
SCC3 4.22 0.90
40
32
28
24 ~
20
200
lOO
NCC SCC1 SCC2 SCC3
MIX TYPE
Figure 7-32. Comparison of Measured Transfer Lengths - Both Phases
165
Conclusions or recommendations in this report are the opinions of the authors. PCI assumes no responsibility for the interpretation or application of the information contained herein.
Figure 7-33. Comparison of ACI Normalized Experimental Lt- Both Phases
The experimental transfer lengths provided in Table 7-13 give an overall summary of the
transfer length results from both the phases, but include the variations.of different effective stress
in the test units. As discussed earlier, although care was taken to have the same prestress force in
all the test units, there was some difference in the prestress achieved in various beams.
Moreover, due to variations in concrete strengths and different mix desigsn, the effective
prestress was different in various test beams. Hence, in order to quantify the effect of higher
quality strand on transfer lengths, it is essential to remove the effects of variations in effective
stress. Hence the ACI normalized transfer length ratio will be used. Table 7-14 provides the
average experimental transfer lengths from both phases normalized with respective ACI
predicted transfer lengths. Also included in the Table 7-14 are the relative comparisons of
experimental transfer lengths of Phase-1 with Phase-2.
It was observed that the Phase-1 strands (relatively poor quality) had higher transfer
lengths than Phase-2 (pre-qualified for adequate bond) strands. For Phase-1 strands, the transfer
length of NCC mix showed an increase of-19% with respect to Phase-2 strands. Similarly for
SCC mixes, the transfer length of SCC1 and SCC2 mixes showed an increase of-15% and
-17% respectively. The transfer length of SCC3 mix for Phase-1 showed a decrease of-7%
166
Conclusions or recommendations in this report are the opinions of the authors. PCI assumes no responsibility for the interpretation or application of the information contained herein.
relative to Phase-2. This decrease although strange, may have been caused due to the SCC3
concrete in Phase-2. As discussed earlier, the concrete had curing issues due to extreme cold
weather conditions. Moreover, the consistent increase of transfer length (- 15% to 19%) for all
mixes including NCC suggests that the effect of rust on Phase-1 transfer lengths is minimal. The
effect of rust on transfer length is discussed in SectionT.5.3.
The increase in transfer length due to poor strand quality in Phase-1 was found to vary
approximately within 15% to 19%, and hence the average increase (SCC3 not included) of
transfer lengths due to poor strand quality in Phase-1 was found to be 17%.
MIX
Table % 14. Comparison of ACI Normalized Average Experimental
Z 5.2 £~ffect of Mix Proportioning on Transfer Length
The same strand was used for different concrete mixes of each of the project phases. Thus,
the relative effect of strand quality and strand related parameters (diameter, surface quality, etc.,)
can be considered eliminated with respect to the mix design within each phase. This implies that
thc cxperimental transfer length obtained from each pha-~e provides valuable information about
the unique contribution of concrete mix proportioning on transfer length performance. Also, as
discussed in chapter 3, the mix designs used in this project were designed to bound the various
mix design approaches to SCC and study their effect on performance of structural parameters. It
is logical that the transfer lengths from two different strands are different. At the same time, for
the same strand, the relative performance of the strand with different concretes should be the
same. This was validated with the experimental results of the transfer length program performed
in this research.
167
Conclusions or recommendations in this report are the opinions of the authors. PCI assumes no responsibility for the interpretation or application of the information contained herein.
It can be observed from ~igure 7-32, Figure 7-33 and Figure 7-34 that the experimental
transfer lengths follow a very similar trend. The reference NCC mixes had the least transfer
length of all mixes. Among the SCC mixes, the experimental transfer length of SCC1 mix (high
fines) had the highest value and SCC3 mix (high coarse aggregate comem) had the least value,
while the SCC2 mix (moderate mix) was bounded by the extremes of SCC1 and SCC3. The
resu!ts seem to support the hypothesis of bounding the structural properties by proper mix design
selection.
Similar to the comparative study of two phases for strand quality, in order to obtain the
effect of mix proprtioning, the exper’:mental transfer lengths should be normalized with the ACI
reconamended transfer lengths to remove the variations in effective stresses. Table 7-15
summarizes the average experimental transfer length from each of the phases normalized with
ACI recommended value. Also, in order to determine the effect of mix proportioning, the ACI
normalized transfer length values of SCC mixes were normalized with similar reference NCC
mix values as shown in the last two columns of Table 7-15. The NCC normalized values were
obtained by dividing the average ACI normalized experimental transfer length ratios of a
particular mix with that corresponding to the reference NCC mix.
Table 7-15. Comparison of ACI Normalized Average Experimental Lt - Both Phases
Average
0.741,000.94
0,88
Phase.,1
Phase-1StandardDeviation
0.150.210.200.14
Average
0.62
0.870.8!0.94
Phase-2StandardDeviation
0.110.i4
0.070.13
Lt , MIX
L~ NCC
Phase..2
L~ , MIX
L~, NCCMIX
NCC ! ~00 1.00
SCC1 i.36 i.4i
SCC2 1.28 !.31
SCC3 1.19 1,53
The normalized ratios of relative transfer length for each mix with respect to the
appropriate NCC mix (as given in Table 7-15) are graphically represented in Figure 7-34. The
effect of mix proportioning on transfer length was distinct in both of the research phases. For
Phase-1 , SCC 1 had highest transfer length followed by SCC2 and SCC3 mixes with an average
168
Conclusions or recommendations in this report are the opinions of the authors. PCI assumes no responsibility for the interpretation or application of the information contained herein.
approximate increase of 36%, 28% and 19% respectively, relative to the corresponding NCC
mix.
Similarly for Phase-2, SCC1 and SCC2 had 41% and 31% higher transfer lengths than
respective NCC mix. SCC3 mix showed an increase of 53% relative to NCC mix. It was
expected (from Pbaseol) that the increase in SCC3 transfer lengths relative to NCC should be
lower than that obtained for SCC2. Considering the improper weather conditions that effected
SCC3 and takil~g into effect the deviation for SCC3 mix (-22%), it can be safely concluded that
the SCC3 mixes have lower transfer lengths than SCC1 and SCC2 corresponding to respective
NCC mixes.
Overall, it was observed that the SCC1 (high fines) mix had the highest difference and
SCC3 (high fines) mix had the least increase relative to respective NCC mix; therby supporting
the research concept that the structural parameters (in this case transfer length) can be
controlled/bound by proper mix design selections.
2.0
1.8
1.4
0.6
0.4
0.2
0.0
/Lt-ACI I [ZZZ] Phase-1.........................................................................................
NCC SCCl SCC2 SCC3
MIX TYPE
Figure 7-34. Comparison of NCC Normalized Transfer Lengths from both Phases.
169
Conclusions or recommendations in this report are the opinions of the authors. PCI assumes no responsibility for the interpretation or application of the information contained herein.
7.5.3 Effect of Strand Surface Condition (NCC- Phase-l) on Transfer Length
As discussed in Section 5°2.2, due to the poor performance of first few concrete mixes,
few test units had to repeated. As a result, the strand used in NCC mix of Phase-1 was slightly
rusted / pitted (Section 5.2.2). At the same time, the strand used in a~ the SCC mixes of Phase-1
was the same and does not affect the relative stucly of the SCC mixes. As discussed in section
6.5, it was observed that the rusted strand in Phase-1 NCC mix gave higher peak and first slip
pull-out forces. The contribution of rust on pull-out forces was calculated by certain assumptions
as discussed in section 6.6.3. One of the assumptions was that the ratio of any measured
parameter for SCC mixes to the same for NCC should be a constant for a particular type of
strand. A similar approach was used to obtain the contribution of rust on transfer length. But, this
approach did not provide realistic results. This could be because the bond mechanisms in pull-
out and transfer are unique and very different. As discussed earlier, the transfer bond mechanism
is mainly contributed by the wedging action or Hoyer’s effect, where as the pull-out bond
mechanism is mainly contributed by mechanical interlock.
Hence, in order to quantify the contribution of rust on transfer lengths of Phase-1 NCC
strand, a new transfer length value was predicted from the measured transfer length values for
NCC mix of Phase-2. The contribution of rust was obtained by comparing the predicted value
with the measured value. The predicted transfer length value for NCC mix of Phase.- 1 strand was
done by removing the contribution of strand quality flom the Phase..2 measured NCC value. The
contribution of rust by this approach was fouled to be ~/e~T mir~ima~ (~1%). It is important to
understand the bond mechanisms in assessing the contributions of rust. The researchers believe
that the wedging mechanism or Hoyer’s effect is the main contributor to the transfer length.
Researchers from University of Oklahoma have shown that the weathered (uniform rust)
surface condition of strand produced lower transfer length and higher pu!!-out forces [47].
Similar to pull-out forces (see section 6.6.3.3) the contribution of rust on transfer length was
calculated from literature [47] and was found to be approximately 13% lower than un-rusted, as
received condition of the same strand type. In this research it was found that the rust contribution
was minimal. The main purpose of comparison of the contribution of rust with literature is to
understand the magnitude of rust contribution on pull-out forces. It is clear from the literature
[47] that the effect of rust on pull-out forces was more than that on transfer length. Similar
results were obtained from this research wherein the effect of rust was larger on pull-out forces
170
Conclusions or recommendations in this report are the opinions of the authors. PCI assumes no responsibility for the interpretation or application of the information contained herein.
than transfer length. Although the comparison of rust contribution with literature seems to agree
reasonably, it is important to understand that there are certain assumptions in computing the rust
contribution and the rust contribution is "strand-specific". The strand used in this research was
slightly rusted / pitted add not uniformly rusted as used by researchers from University of
Oklahoma [47].
7. 5.4 Strand Quality and Surface Condition corrected Transfer Lengths
The assumptions and method of computing the effects of strand quality and strand
surface were explained in sections 6.6.4 and 6.6.3 respectively. The corrections due to effects of
rust were found to be minimal and hence neglected, while corrections due to the effects of strand
quality were applied to all Phase-1 mixes. The transfer length values corrected for effects of
strand quality and rust, remove the contribution of strand and enable us to study the sole effect of
mix proportioning on transfer length. Table 7-16 provides the experimental transfer lengths
results corrected for strand quality and rust. For brevity, the standard deviation values are not
provided. The effect of mix proportioning with the corrected transfer lengths is also provided in
Table 7-16. Figure 7-35 compares the corrected transfer lengths from Phase-1 and Phase-2.
Table 7-16. Experimental transfer lengths corrected for effects of strand quality and rust.
MIX
NCCSCC1SCC2SCC3
Actual experimental data
Phase-10.74! .000.940.88
Phase-20.620.870.810.94
Experimental data correctedfor strand qua ity and rust
Note: a) Correction for effect of rust is applied only to NCC mix of Phase-1._ b) Correction for Strand quality is applied to all mixes of Phase- 1
As discussed earlier, the effect of strand surface (rust) on transfer length was found to be
negligible @ 1%) and hence no correction for the NCC mix result of Phase-1 was applied. The
corrections for strand quality were applied equally to all mixes of Phase-1. As a result, the effect
of mix proportioning obtained by normalizing transfer length of any mix with corresponding
171
Conclusions or recommendations in this report are the opinions of the authors. PCI assumes no responsibility for the interpretation or application of the information contained herein.
NCC mix is not altered after applying corrections, for strand quality. Hence the discussion on the
effect of mix proportioning provided_ in Section 7.5.2 is still valid even after corrections for
strand quality are applied.
The comparison of measured transfer lengths with those computed based on the current
AC] recommendations reveals that all SCC mixes (both phases) had transfer lengths below the
ACI estimate. However, all SCC mixes had transfer lengths longer tha_n_ for the corresponding
NCC mix. Among the SCC mixes (excluding SCC3 mix of Phase-2), SCC1 (high fines) had the
largest transfer lengths and SCC3 (high coarse aggregate content) had the least transfer length,
with the SCC2 mix values being bounded by the SCC1 and SCC3 results. This supports the
hypotheses of the work that performance-based parameters like transfer length can be bound by
Figure 7-35. Experimental transfer lengths corrected for strand quality and surface effects -bothphases
7.5.5 Overall Effect of SCC on Transfer Length
As discussed in earlier sections, it was observed that all SCC mixes had larger transfer
lengths than respective NCC mixes. On an average, the SCC mixes (excluding SCC3) had larger
172
Conclusions or recommendations in this report are the opinions of the authors. PCI assumes no responsibility for the interpretation or application of the information contained herein.
transfer lengths relative to respective NCC mixes by 32% and 36% for Pha~-I and Phase-2
strands respectively. Meanwhile, while SCC3 mix was included, the overall average transfer
lengths of SCC mixes were larger than respective NCC mix by 28% and 42% for Phase-1 and
Phase-2 strands respectively.
The .average measured transfer lengths for all mixes were,within ACI recommendations.
At the same time, when the standard deviation of measured experimental lengths is taken into
considerations, all SCC mixes exceeded the ACI recommendations (see Figure 7-33), thereby
raising concerns on the consetwativeness of the ACI recommendations.
7.6 Summary and Conclusions
Transfer lengths were experimentally found for a total of 12 beams (24 ends) of different
concrete mixes, with two beams per mix type, in Phase-1. In Phase-2, transfer lengths were
experimentally found for 4 beams (8 ends), with 1 beam per concrete mix design. Initial transfer
length was determined by concrete strain profiles and draw-in measurements. Long term transfer
lengths were determined only by use of draw- in values.
The overall average transfer length values at prestress release were found to be less than
those predicted by the ACI code equation, with the exception of the SCC1 mix in Phase-1 which
exactly met the ACI code value. All SCC mixes had higher transfer length relative to the
respective NCC mixes, On an average (both phases), SCC mixes had larger transfer lengths by
35% relative to NCC mix.
The strand quality seems to effect the transfer length. It was observed that this effect was
relatively the same for all mixes including NCC and SCC. It was found that the transfer length of
poor quality Phase--1 strands was higher by approximately 17% relative to pre-qualified Phase-1
strands
The transfer length values seemed to increase with time based on draw-in measurements.
In Phase-1, draw-in values were measured for a period of approximately 120-130 days from the
date of release. It was observed that the draw-in values increased from 50% - 100% for NCCB to
SCC 1 mixes, respectively. It should be noted, however, that in many cases, the last reading was
affected by the condition (i.e., damage) of the beam end. This decreases the confidences on the
readings at the day of test (-130 days). At the same time, the rate of increase in transfer length at
28 days for both the Phase-1 and Phase-2 strands seems to be identical. Although the Phase-1
173
Conclusions or recommendations in this report are the opinions of the authors. PCI assumes no responsibility for the interpretation or application of the information contained herein.
strands had higher transfer lengths relative to Phase-2 strands, the rate of increase of transfer
lengths from the time of release to 28 days obtained from draw-in measurements for both the
Phases shows a consistent increase. The average increase (average of % increase from both
phases) was minimal for SCC3 mix followed by SCC2, NCC and SCC1 mixes with values of
20%, 33%, 40 % and 5.6%, respectively.
As discussed earlier, the mechanisms of bond transfer are very important in the
interpretation of the results. It is commonly agreed that the major contribution to transfer length
is the wedging action of the strand (also called as Hoyer’s effect). This wedging action is mainly
dependent on the stresses from the strand, the elastic modulus of the strand, the diameter of the
strand and the elastic modulus of the concrete. Since the same strand was used for all the mixes
of a particular phase, the strand related parameters should have a similar effect on all mix types
and thus can be ignored for this comparative study. Hence, the only parameter having a
significant relative contribution is the elastic modulus of concrete. The SCC3 mix has the highest
coarse aggregate content and hence higher expected modulus. Thus it seems rational that this
mix shows the least percentage increase in transfer length with time. Similarly, the SCC 1 mix,
which is the high fines mix, should have the lowest modulus and represents correspondingly had
a relatively large increase in transfer length with time. The NCC and SCC2 mixes, having similar
aggregate contents, seem to fal! in between the extremes of SCC1 and SCC3 mixes, thereby
supporting the research concept of bounding/controlling the structural parameters by proper mix
design selection.
Valuable insights have been gained from the transfer length (CHAPTER 7) and pull.-out
(CHAPTER 6) sections of the project, with respect to the effect of strand bond quality, effect of
mix proportioni_n_g, effect of strand surface condition (rust of NCC Phase-1 strand), overall
behavior of SCC mixes and increase in transfer length with time. At the same time, due to the
large variations and complex mechanisms associated with bond behavior in the prestress transfer
region, it is difficult to assign exact numerical values to the variations of transfer lengths to each
of these mix designs. This would require statistically large number of tests to be performed and
was beyond the scope of this project.
174
Conclusions or recommendations in this report are the opinions of the authors. PCI assumes no responsibility for the interpretation or application of the information contained herein.
7.7 Recommendations
SCC mix proportioning was found to have a distinct and unique effect on bond (and-
hence transfer length) of prestressing strand. Although the transfer lengths of all SCC mixes
were lower than th~respective ACI recommended values, it was found that the transfer length of
all SCC mixes was higher than the respective NCC reierence mix. This raises questions
regarding the conservativeness of the ACI code, On one hand, the conservativeness of the code is
an advantageous in designer’s point of view. At the other hand, too much conservativeness may
not be advisable. In our case, with SCC mixes having higher transfer lengths relative to
respective NCC mix raises questions in the designer’s point of view.
While designing a beam with an SCC mix, a designer can select a mix design similar to one
of the mixes used in this research. Taking into consideration the numerous ways of achieving
SCC, it is not possible to find an exact mix that fits the mixes used in this research. Nevertheless,
the mix designs used in this project bound the SCC mix proportioning methods. Hence, the
designer can assess where his mix design fits within the bounds of the SCC mixes used in this
project (SCC1, SCC2 and SCC3). After assessing the proper range within which the selected mix
design fits, the designer can increase the factor of safety in his design to match the same
reliability as that of the NCC mix.
As an example, let us assume that, a designer is using a SCC mix design similar to SCC 1
and desires to have a similar conservativeness and reliability as that of NCC mix. It was found
(see Figure Z~I5) that SCCI mixes had 36% .. 41% higher transfer lengths than respective NCC
mix. Hence, the designer may have to increase the factor of safety, in other words, increase the
transfer length by 40% .,. 45% to achieve similar safety as that of the NCC mix. A similar
approach can be done to any given SCC.
Hence, SCC mix designs can be used without any hesitation in the prestress industry
provided proper considerations in factor of safety are taken. It should be noted that this
additional factor of safety is obtained by providing additional transfer length which is dependent
on the type of SCC mix design used.
175
Conclusions or recommendations in this report are the opinions of the authors. PCI assumes no responsibility for the interpretation or application of the information contained herein.
CHAPTER 8 DEVELOPMENT LENGTH TEST PROGRAM
Evaluation of strand bond on SCC precast/prestressed girders with respect to development
length was inade tlu-ough flexurai load tests on laboratory scale beams. The beam units are those
described in Section 5. ! and represented in Figure 5-1. As discussed earlier, the project had two
phases and similar test units were replicated in Phase-2. For each project mix design (see chapter
4), two test units were cast in Phase-1 and one test unit was cast in Phase-2. The beams were
11.58 m (38 ft) in length such that two tests (one per beam end) were conducted per beam unit.
Thus, a total of 4 flexural tests for each concrete mix were performed for Phase-1 and two tests
per concrete mix were performed for Phase-2. This chapter provides details on testing
configuration, procedure, observations and results.
8.1 Test Approach
As discussed earlier, development length is defined as the total length of bond required to
develop the steel stressf~s at the ultimate strength of the member. Development length consists of
two components: transfer length and flexural bond length. Determination of transfer length is
described in Chapter 7. It is not possible to evaluate flexural bond length separately and hence
the total developlnent length was determined fiom fiexarai tests. From these tests and the known
transfer length values, the flexural bond length can hence be estimated.
By definition, the development length of a prestressing strand wili depend on achievement
of its design stress level at the section flexural capacity. Section capacity depends on several
factors, which makes development length measurements, or estimates, difficult to determine in a
single test. Thus, a trial and error or bounding approach has been typically used [19] and the
same was also used in this project. The distance from the end of the member to the critical
section is defined as the anchorage length (L~). In this project, since the strands are completely
bonded throughout the length of the beam, development length is the minimum anchorage length
required to develop nominal stresses at the critical section. The critical section can be defined as
the section closest to the end of the member that develops full strength when subjected to
external loading.
176
Conclusions or recommendations in this report are the opinions of the authors. PCI assumes no responsibility for the interpretation or application of the information contained herein.
The testing approach thus consists in determining the minimum distance from the beam
end that will allow attainment of the strand design stress level at the section nominal flexural
capacity° The process is thus iterati-¢e, where the resulting failure mode (flexure, flexure-slip, or
shear) defines whether the evaluated anchorage length was sufficient. If the test response reveals
that the ultimate moment at the critical section was equal or greater than the nominal capacity,
with no strand slip, then_ the next evaluated anchorage length was reduced. Conversely, if the
moment nominal capacity was not reached, or strand -slippage was observed before nominal
capacity was reached, then the anchorage or development length to the critical section was
increased. The beams were designed long enough to enable two flexural tests per test unit, on
two ends repectively. The longer length enable to perfo~-n the tests in a way that they were
independent of each other, i.e., the first test having no influence on the other. Thus, in Phase-1,
with two beams cast per mix type, it could afford four trials. In this way, the range within which
the actual development length may lie for the particular mix can be obtained. With the insight
and experience gained from Phase-1, only 1 beam per mix design was cast in Phase-2, thereby
affording two trials.
8.2 Test Configuration
The flexura! test setups consisted of a simple span beam loaded under a pair of
concentrated !oads at the critica! section and a cantilever overhang that was unaffected by the
test. A schematic of the test setup is shown in Figure 8..1. For most of the tests~ the beam was
supported over a span of "7.32 in (24 ft) leaxTing a cantilex~ered length of 4.2"7 m (14 ft). In the first
few tests (NCCA and SCC2A) of Phase--I, the span length was kept as a variable. In all other
tests of both phases, the span was kept constant at 7.32 m (24 R). The beam was supported on
two neoprene pads of dimensions 150 x 305 x 19 mm (6.125" x 12" x ~/4") on each support.
Loading was applied by means of a servo controlled hydraulic actuator mounted on a reaction
frame. The actuator load was transferred to the girder through a loading beam with two contact
points in order to create a constant moment demand region. Since the development length testing
requires that the anchorage length be varied from test to test, the support blocks were moved to
get the required anchorage length while keeping the span constant at 7.32 m (24 ft). Figure 8-2
shows the overall test setup at the MSU Civil Infrastructure laboratory with some of the
components of the test setup labeled.
177
Conclusions or recommendations in this report are the opinions of the authors. PCI assumes no responsibility for the interpretation or application of the information contained herein.
Embedment length or Test DevelopmentLength
Section \ ! - vA-A \\ ~
NOT TO SCALE
Cantilevered end unaffected byapplied loads
Maximum MomentRegion Lab Floor
24’ 0"Center to Center of Bearing pads
38’ 0"
Figure 8-1 Schematic Representation of Flexural Test
Figure 8-2 Overview of the Flexural Test Setup
178
Conclusions or recommendations in this report are the opinions of the authors. PCI assumes no responsibility for the interpretation or application of the information contained herein.
Figure 8-3 Test setup - View of Spreader Beam
Figure 8-3 shows a close-up view of the spreader beam attached to the actuator to create a
constant moment region. Two aluminum plates of 305 x 76 x 6.4 mm (12" x 3"x ¼") were used
to transfer the loads from the spreading beam loading points onto the beam flange. Two tilt
prevention blocks 457 x 610 x 1372 mm (18" x 24" x 54") were tied to the strong floor and used
on either side of the test specimen to prevent in an event that the beam may become unstable.
The different test configurations: effective span, anchorage length (Lda), the shear span
(considering the center of the support), the test date for all the mixes are given in Table 8-1 for
the 24 tests performed in Phase-1. Similar information for the 8 tests performed on the Phase-2
test units is provided in Table 8-2.
179
Conclusions or recommendations in this report are the opinions of the authors. PCI assumes no responsibility for the interpretation or application of the information contained herein.
Table 8-1 Test Configurations for Development Length Studies - Pha~-1
Mix
NCCA-P1
SCC2A-P1
SCC2B-P1
SCC3-P1
NCCB-P1
SCC1-P1
Unit End
1 in. = 25.4 mm
1 A
1 B
2 A
2 B
1 A
1 B
2 A
2 B
1 A
1 B
2 A
2 B
1 A
1 B
2 A
2 B
1 A
1 B
2 A
2 B
1 A
1 B
2 A
2 B
Test Date
6-Oct-04
1 l-Oct-04
!4-Oct-04
20-Oct-04
30-Oct-04
3-Nov-04
9-Nov-04
16-Nov-04
17-Nov-04
19-Nov-04
23-Nov-04
30-Nov-04
2-Dec-04
7-Dec-04
10-Dec-04
21-Dec-04
22-Dec-04
25-Dec-04
2~-Dec-04
30-Dec-04
4-Jan-05
5-Jan-05
4-Jan-05
4-Jan-05
Effective span
L
(ft) ~
23.83
27.67
26.67
24.25
23.50
23.50
23.50
23.50
24.00
24.00
24.00
24.00
24.00
24.00
24.00
24.00
24.00
24.00
24.00
24.00
24.00
24.00
24.00
24.00
Lda
~ (in)
76~00
122.70
111.00
60.00
70.50
64.50
80.00
86.75
70.50
102.75
126.75
124.50
58.00
97.75
106.50
103.00
63.75
64.00
103.50
93.50
72.38
137.75
122.00
118.50
Shear
Span, a
(ft)
6.08
9.98
9.00
4.75
5.63
5.13
6.42
6.98
5.63
8.31
10.31
10.13
4.58
7.90
8.63
8.33
5.06
5.08
8.38
7.54
5.78
11.23
9.92
9.63
180
Conclusions or recommendations in this report are the opinions of the authors. PCI assumes no responsibility for the interpretation or application of the information contained herein.
Table 8-2 Test Configurations for Development Length Studies - Phase-2
Effective span ShearMix Unit End Test Date
L Span, a
1 in. : 25.4 mm (ft) (in) (ft)
NCC-P2 1 I ’~A 4-Jan-06 24.00 67.00 5.33
1 B 5-Jan-06 24.00 60.25 4.77
SCC2-P2 1 A 10-Jan-06 24.00 66.00 5.25
1 B l%Jan-06 24.00 66.50 5.29
SCC3-P2 1 A 26-Jan-06 24.00 72.50 5.79
1 B 31 -Jan-06 24.00 65.25 5.19
SCC1-P2 1 A 2-Feb-06 24.00 75.50 6.04
1 B 2-Feb-06 24.00 68.00 5.42
8.3 Instrumentation
Instrumentation for the development length tests can be broadly classified into two types:
(1) primary instrumentation - used to study the response of parameters essential to the
development length study, and (2) secondary instrumentation - used for monitoring the overall
test response and safety of the specimen and the crew during testing. All instrumentation
readings were automatically recorded via a data acquisition system
The servo-controlled hydraulic actuator has in-built transducers that measure the load in
the actuator and its displacement. The actuator has a capacity of 1450 kN (328 kips) with a
stroke of 1016 mm (40 in.). The actuator load and displacement signals were recorded both at the
controller computer and the data acquisition system.
Potentiometers were used to measure all the displacement responses of the test specimen.
Two types of displacement transducers were used: (1) devices with a stroke of 305 mm (12 in.)
were used to measure deformation under the points of application of the loads, and (2) devices
with a stroke of 38 mm (1.5 in.) were used to measure support movements and strand end-slip.
181
Conclusions or recommendations in this report are the opinions of the authors. PCI assumes no responsibility for the interpretation or application of the information contained herein.
Figure 8-4 shows the three 305 mm (12 in.) devices that were used to measure the test unit
displacements; two were used at the two points of application of the load and the third one at the
center. A tota! of six 38 mm (1.5 in.) displacement transducers were used: Two transducers were
used to measure the vertical deformation at the supports, two transducers to measure the
horizontal motion of the supports, and the last two transducers were used to measure end-slip of
the strands. The transducers used to measure strand end slip were attached to the strands with
mounting of brackets and clamps. Figure 8-5 shows one of the supports with the instrumentation
to measure these displacements.
Compressive strains at the top surface of the flange were monitored throughout the test
with a 60 mm (2.36 in.) foil type strain gage placed at the top compression fiber of the section in
the middle of the constant moment region. In order to monitor the strains developed in the strand,
average strains were measured on the concrete surface at the strand level on the constant moment
region by means of a mechanical gage. DEMEC target points attached at strand level were
spaced at 152.4 mm (6 in.) for a distance of 762 mm (30 in.) centered in the constant moment
region. Initial readings were taken before the start of the experiment. Loading was applied in
displacement-control at a rate of 2.5 mm (0.1 in.) per minute. A set of readings were taken after
each displacement loading increment. Figure 8-6 shows the strain measurements being taken at
the end of a displacement loading cycle.
Figure 8-4 Instrumentation for Overall Unit Deformation
182
Conclusions or recommendations in this report are the opinions of the authors. PCI assumes no responsibility for the interpretation or application of the information contained herein.
Figure 8-5 Instrumentation for Support Movement and Strand End-Slip
Figure 8-6 Average Strain Measurement at Strand Level
183
Conclusions or recommendations in this report are the opinions of the authors. PCI assumes no responsibility for the interpretation or application of the information contained herein.
8.4 Failure Modes and Analysis:
The failure mode and definition of the nominal moment capacity at the critical section
performed play a vitat role in determining the development length of the strands in test unit. The
ultimate moment achieved at the critical section for a given test (Mtest) was that obtained from the
test response and the recorded data. The self weight was calculated at the critical section taking
into considerations the overhang and the effective span. The self weight is also included in the
test moment value (M~est). Since all the beams tested in this project were of the same cross
section, the nominal moment capacity (M~) of the section for each test specimen depends on the
amount of effective prestress in the strands and the concrete strength at the day- of test (Table 5-2,
Table 5-3, Table 4-11, and Table 4-12). As discussed earlier in chapter 4, the nominal moment
capacities were calculated by two methods: (1) ACI 318 method (Equation 7-2) [3], and (2)
refined strain compatibility analysis (Response 2000) [21]. Since the transfer lengths are
compared with the ACI recommendations, the development length results only from the ACI 318
recommendations are reported.
For a given anchorage length, if no strand end-slip was observed until the moment
achieved in the critical section was greater than the calculated nominal capacity of the section,
then the anchorage length provided was considered equal to or greater than the actual
development length and the embedment length for the next test was reduced. Conversely, if
strand end slip was observed before the nominal capacity was achieved or if the moment
achieved in the critical section was less than the calculated nominal capacity of the section, then
the anchorage length was considered to be insufficient relative to the actual development length
and the anchorage length for next test was increased. As a result, a range within which the actual
development may occur for a particular mix was obtained. Three distinct failure modes were
observed in the development length tests. 1) shear-slip failure, 2) flexural failure (no slip), and 3)
flexure-slip failure. These failure modes are discussed in following sections.
8.4.1 Shear-Slip failure:
This type of failure was initiated by large slip (or draw-in) at the free end of the beam. The
nominal capacity of the section was not achieved under this type of failure. In this type of failure,
the test behavior is as follows: Initially, as the loading was increased, flexural cracks
symmetrical to the points of application of load were observed. The crack propagation ceased to
184
Conclusions or recommendations in this report are the opinions of the authors. PCI assumes no responsibility for the interpretation or application of the information contained herein.
remain symmetric after the first slip occurred. The crack closest to the end (support from which
anchorage length was measured), grew relatively much faster than the other cracks. Initiation of
the strand end-slip is characterized by the formation of a horizontal crack at the strand level
(Figure 8-7). This horizontal crack usually occurs at the crack closest to tlae support. As the load
~as increased, the strand end-slip increased rapidly until there was a compressive failure at the
top flange. The strains in the strands were much lower (- 0.220 strains for SCC3-l-A) than the
ultimate strain capacity of the strand (0.035 strains) and the moment capacity of the section was
not achieved. Figure 8-7 shows the initial stages of one of the shear-slip failure tests. Figure 8-8
shows the top flange compressive failure with the expansion of the crack close to the support.
Figure 8-9 shows the test response corresponding to this type of failure.
Figure 8-7 Shear- Slip Failure - Initial Stage
185
Conclusions or recommendations in this report are the opinions of the authors. PCI assumes no responsibility for the interpretation or application of the information contained herein.
Mom
ent (kip-ft)
~"
I1~
~ I /
~-"- "- (U
J-N~
I) ~,uauJolR
Conclusions or recommendations in this report are the opinions of the authors. PCI assumes no responsibility for the interpretation or application of the information contained herein.
8.4.2 Fiexural Failure:
This type of failure is basically a pure flexural failure wherein no end slip is observed. The
nominal capacity of the section was mostly achieved in this type of failure. In-this type of failure,
the test behavior is as follows: Initially, as the loading was increased, flexural cracks
symmetrical to fhe points of application of loads were observed (Figure 8-10). The cracks
propagate symmetrically throughout the test and large crack openings and deformations were
observed. As the load was increased, the crack pattern remained symmetric and the crack growth
was proportional to the time of occurrence of the crack during the test. The failure, in most cases
was reached first in the top compression flange. The compression flange failed within the
maximum moment region (Figure 8-11) and not at the point of application of load as observed in
test units displaying shear-slip failures. In most cases, for this type of failure, the measured strain
in the strand was beyond the guaranteed ultimate strain of 0.035 strains. Out of all the
development tests performed, the strands fractured in only two units. Figure 8-12 shows the
flexural failure for one of the units failing with strand fracture. Figure 8-13 shows the moment-
displacement response corresponding to this type of failure. In most cases, this type of failure
occurred at sufficient anchorage lengths. Even though no strand slip is associated to this type of
failure, this type of response does not guarantee that the nominal capacity of the section is
achieved.
187
Conclusions or recommendations in this report are the opinions of the authors. PCI assumes no responsibility for the interpretation or application of the information contained herein.
Figure 8-11 Flexural Failure - Final Condition (Compression)
188
Conclusions or recommendations in this report are the opinions of the authors. PCI assumes no responsibility for the interpretation or application of the information contained herein.
120
110
100
9o
70
50
211
Figure 8-12 Flexural Failure - Final Condition (Tension)
Displacement at the section (in.)1 2 3 4 5 6 7 8 9 10 11 12
No Slip OccuredMn achieved
30 60 90 120 150 ~80 210 -~*~=~. 270300Displacement at the section (ram)
Figure 8-13 Test.Response for a Typical Flexural Failure
90
8O
70 ~0
60 ~
50 ~
189
Conclusions or recommendations in this report are the opinions of the authors. PCI assumes no responsibility for the interpretation or application of the information contained herein.
8.4~3 Flexural-Slip Failure:
In this type of failure a combined effect of flexure and strand slip effects were observed.
The nominal capacity- was achieved at the critical section only in some cases, depending on the
dominance of either the flexure or the strand slip contributions. If the test anchorage length was
slightly greater than the actual development length, then the bond component was dominant and
the moment capacity at the critical section would be achieved with some amount of slip.
Similarly if the test embedment length was slightly less than the actual development length then
the strand-slip component would dominate and the moment capacity in the section would not be
achieved. Only the cases in which the nominal capacity of the section was achieved are
considered in this type of failure. If the nominal capacity was not achieved, such failure types
were classified as shear-slip failures. In this type of failure, the test behavior was a combination
of the first two cases. Initially, as the loading was increased, flexural cracks symmetrical to the
points of application of loads were observed (Figure 8-10). As the loading was increased,
depending upon the dominance of the flexural bond or strand-slip contributions, the crack
propagation varied slightly. The variation was mainly in the shear crack causing the strand slip.
If the strand-slip component was larger than the flexural bond component, then this crack would
grow relatively faster than the flexural cracks. If the flexural bond component dominated, then
the flexural cracks would grow faster than the shear crack. It should be noted that strand-slip was
recorded in all cases, irrespective of the dominance of the components. Figure 8-14 shows the
test response for the case wherein the flexural response was dominant and the moment capacity
was achieved~ The test response for the case wherein the strand-slip component was dominant
and moment capacity was not achieved is similar to a typical shear-slip failure as shown in
Figure 8-9. In most cases, this type of faiiure was accompanied with the top flange failing in
compression (Figure 8-11). In cases of flexural forces dominating the test response, the measured
steel strains in this type of failure were very close to the strand guaranteed ultimate strain of
0.035 strains.
190
Conclusions or recommendations in this report are the opinions of the authors. PCI assumes no responsibility for the interpretation or application of the information contained herein.
120
11o
lOO
,~’9oZ~, 80
"~ 70
~ 50
4O
30
2O
10
Displacement at the section (in.)3 4 5 6 7 8 9 10 11 12
Slip Onset
Slip @ Mn = 10.67 mm (0.42 in.)
P/2 P/2
25 50 75 100 125 150 175 200 225 250 275 300Displacement at the section (mm)
Figure 8-14 Test Response for a Typical Bond-Slip failure
90
80
50 ¢EO
40 ~
30
20
10
8.5 Development Length Results
Development lengths were experimentally found by performing flexural tests on beams
made from three SCC mixes and one conventional NCC mix. In Phase-l, a total of 12 beams (24
flexural tests), with two beams per mix design were tested. In Phase-2, a total of 4 beams (8
flexural tests), with 1 beam per mix design were tested. In Phase-1, two mix designs (NCC and
SCC2) had to be repeated due to concrete performance issues and hence the results from those
tests were not considered. The experimental development length was obtained by trial and error
approach. The anchorage length was varied and the minimum anchorage length that led to
flexural type of failure was considered as the representative of the mix.
In Phase-1, all test specimens excluding NCCB had unrusted clean strands. The NCCB test
specimens used a slightly rusted strand, as it ~was acquired a couple of months later due to the
need to repeat the NCC mix. The NCC and-SCC2 mixes were repeated due to the poor
perfomaance of the mix and the equipment, hence the first trial is represented by suffix "A" and
the second trial is represemed by the suffix "B."
191
Conclusions or recommendations in this report are the opinions of the authors. PCI assumes no responsibility for the interpretation or application of the information contained herein.
The experimental development lengths obtained from Phase-1 studies were found to be
large and the quality of the strand was questioned. As explained in chapter 6, the strand quality
of Phase-1 strand was evaluated by an independent party and was found to be of poor quality.
Hence, ail-~hase-2 test units used pre-qualified strand. A clean cloth was used to wipe off the
strand~ .with one stroke before the cast of concrete for all test units in both phases,~-,- . ¯
Test ID Failure Type
Table 8-3 Development Length Test Results - Phase-1
Lda M,,, f,, by ACI-318
L a~ l g test(in.)
1.062
1.066
1.351
1.221
1.042
1.055
1.151
1.143
(m)
NCCB-PI-I-A1.62 63.75 F
NCCB-PI-I-B 1.63 64.00 F
NCCB-P1-2-A 2.63 103.50 F
NCCB-P1-2-B 2.37 93.50 F
SCC1-PI-I-A 1.84 72.38 1.068 1.067 FS
SCC1-PI-I-B 3.50 137.75 2.032 1.147 F
SCC1-P1-2-A 3.10 122.00 1.796 1.131 F
SCC1-P1-2-B 3.01 118.50 1.744 1.228 F
SCC2B-P 1-1-A 1.79 70.50 1.207 ! .016 FS
SCC2B-PI-I-B 2.61 102.75 t.759 1.151 FS
SCC2B-P1-2-A 3.22 126.75 1.781 1.111 F
SCC2B-P1-2-B 3.16 124.50 1.748 1.198 F
1.47 58.00 1.066 0.961 S
2.48 97.75 1.796 1.098 FS
2.71 106.50 1.797 1.108 FS
2.62 103.00 1.737 1.141 FS
SCC3-PI-I-A
SCC3-PI-I-B
SCC3-P1-2-A
SCC3-P1-2-B
TYPE OF FAIL URE:S - Shear Slip FailureF - Flexural FailureFS - Flexural Slip failure
1 in. = 25.4 mm
192
Conclusions or recommendations in this report are the opinions of the authors. PCI assumes no responsibility for the interpretation or application of the information contained herein.
In order to compare the Phase-2 results with Phase-1, NCC and SCC2 mixes of Phase-2
are compared with N CCB and SCC2B mixes of Phase-1. Hence, the results for poor performance
mixes (NCCA and SCC2A) are not reported.The test results of Phase-1 and Phase-2 are
tabulated in Table 8-3 and Table 8-4 respectively. The values of Ld-AC1 , Mn-AC! were obtained
from the ACI-318 equations using a value for£, (nominal stress in the strand) as per the ACI
318-provisions (Equation 7-4) [3]. Table 8-3 and Table 8-4 also show the failure type of the test
unit, where in "F" represents flexural failure, "S" represents the shear-slip failure and "FS"
represents flexural slip failure. Results of the flexural tests for each mix design are explained in
detail. The least anchorage length that achieved the nominal moment capacity with no slippage
(at Mn-ACI) were taken as the representative of that mix. The flexural test responses of all test
units are shown in Appendix D.
Test ID
Table 8-4 Development Length Test Results - Phase-2
M., fps by ACI-318
(m) (in.)Ld-ACI
Mtest
M n-ACI
Failure Type
NCCB-P2-1-A 1.70 67.00 1.059 1.095 F
NCCB-P2-1-B 1.52 60.00 0.948 0.996 F
SCC1-P2-1-A1.92 75.50 I. 101 1.052 F
SCC1-P2-1-B1.73 68.00 0.992 0.935 S
SCC2-P2-1-A1.68 66.00 1.04 1.05 FS
SCC2-P2-1-B1.69 66.50 1.038 1.039 FS
SCC3-P2-1-A1.84 72.50 1.056 1.116 F
SCC3-P2-1-B1.66 65.25 0.949 1.049 FS
TYPE OF FAIL URE:S - Shear Slip FailureF - Flexural FailureFS - Flexural Slip failure
1 in. = 25.4 mm
193
Conclusions or recommendations in this report are the opinions of the authors. PCI assumes no responsibility for the interpretation or application of the information contained herein.
8.6 Development Length Test Results as per ACI-318 Method [3] - Phase-1
Results of the development length tests for each mix design type for Phase-1 development
lengths are-provided in this section. Specific test details and failure type are given only for the
test with the minimum embedment length that satisfied the moment requirements. Also provided
for each mix-design are the ratios of anchorage length provided and test moment achieved with
respective values predicted by ACI recomrnendations.
NCCB: All the four test beams achieved the nominal moment capacity. No slip was
observed in any of the tests and hence flexural type failure was observed in all tests The
least anchorage length that achieved the ACI nominal capacity was 1.62 m (63.75 in.). The
next test was slightly higher 1.63 m (64.00 in.). Although, the latter was slightly higher, it
was assumaed as the least anchorage length that achieved the nominal capacity as it had
much higher compressive strains at failure indicating a good flexural behavior. Moreover,
the difference in the anchorage lengths of these two tests was minimal. The representative
anchorage length selected achieved the ACI moment capacity without ar~ end slip and had
an Ldtest/LdAci ratio of 1.07, corresponding to Ldtest of 1.63 m (64.00 in.). The corresponding
M~est/Mn-Acl ratio was evaluated to be 1.06. This test had a flexural type failure
SCCI: All the four test beams achieved the nominal moment capacity. One of the tests had
a flexural-slip type of failure and all other tests had flexural type failure. Similar to NCCB,
there were two tests with very little difference in the anchorage length provided 3.0tm
(118.50 in.) and 3.10m (122.00 in.), and both reached the ACI nominal capacities with no
strand slippage. Hence the representative test was selected by taking the test that showed
better flexural response. The anchorage length of 3.10 m (122.00 in.) had higher
compressive strains at ACI nominal capacities relative to the anchorage length of 3.01m
(118.50 in.) and is hence selected as the representative of that mix. The selected mix
representative as mentioned earlier had Ldt~st/L~Acz ratio of 1.80, corresponding to L~.¢ of
3.10 m (122.00 in.). The corresponding Mt~/Mn.AC~ ratio was evaluated to be 1.13. This
test had a flexural type failure.
194
Conclusions or recommendations in this report are the opinions of the authors. PCI assumes no responsibility for the interpretation or application of the information contained herein.
SCC2B: All the four test _beams achieved the nominal moment capacity. Two tests had
flexural-slip type failure and the rest two had flexural type failure. Similar to NCCB and
SCC1, there were two tests with very little difference in the av..-chorage length provided
3.16 m (124.5 in.) and 3.22 m (126.75 in.,) and both reached the ACI nomina!_capacities
with no strand slippage_.. Hence the representative test was selected by taking the test that
showed better flexural response. The anchorage length of 3.22 m (126.75 in.) had higher
compressive strains at ACI nominal capacities relative to the anchorage3ength of 3.16 m
(124.50 in.) and is hence selected as the representative of that mix. The selected mix
representative as mentioned earlier had Ldtest/LdAcz ratio of 1.78, corresponding to Ldtest of
3.22 m (126.75 in.). The corresponding Mtest/Mn-AC~ ratio was evaluated to be 1.11. This
test had a flexural type failure.
SCC3: Three of the four test beams achieved the nominal moment capacity. One test had a
shear - slip type failure and the remaining three tests had flexural-slip type failures.
interesting observation was that all the three tests that satisfied had strand slippage, but the
initiation of strand slippage had occurred after the ACI nominal capacity was achieved.
Hence the least anchorage length that achieved the achieved ACI nominal capacity with
minimal total slip was taken as the representative of the mix. The representative anchorage
length had L~ttest/LdACl ratio of 1.74, corresponding to Ldtest of 2.62 m (103.00 in.). The
corresponding Mtest/M,,-ACZ ratio was evaluated to be 1.14. This test had a flexure-slip
failure, but ACI nominal capacity was achieved with no strand slip.
Table 8-5. Representative Development Lengths and ACI Normalized Ratios - Phase-1
MIX
NCCB
SCC1
SCC2
SCC3
m
1.63
3.10
3.22
2.62
Lda
in.
64.00
122.00
126.75
103.00
L~.Ld_exp --
Ld-ACI
1.07
1.80
1.78
1.74
MtestLd-exp --
Ld-ACI
1.06
1.13
1.11
1.14
Mtest
Mn_AC1
1.01
1.59
1.60
1.52
195
Conclusions or recommendations in this report are the opinions of the authors. PCI assumes no responsibility for the interpretation or application of the information contained herein.
2~1
1.8
1~5
1.2
0.9
0.6
0.3
0.0NCC SCC1 SCC2 SCC3
MIX TYPE
Figure 8-15 Representative Development Lengths and ACI Normalized Ratios - Phase-1
The representative anchorage lengths and the respective ACI normalized development
length and moment ratios as described above are summarized in Table 8-5 and Figure 8-15. It
was observed that SCC mixes had much higher Ldtest/LdAcz ratios relative to NCC mixes.
Moreover, the obtained Mtest/M,,-AC~ ratios for different mixes varied slightly. In order to compare
the performance of SCC mixes relative to each other and to compare with reference NCC mix, it
is important to have similar Mte,~t/M,,-ACI ratio. Since the comparison of development lengths of
various mix designs is needed; and the condition for obtaining the required anchorage length is
based on the achievement of nominal capacity by ACI recommendations, approximate reduced
development lengths (Ld_e~p ) values are obtained by making mtest/mn-ACI equals unity for all
mixes. In otherwords, the test moment capacity is matched with the ACI nominal capacity and
the development length required to achieve the exact ACI nominal moment capacity is
computed. Figure 8-16 and Table 8-5 show the reduced development length ratios for Phase-1
tests.
196
Conclusions or recommendations in this report are the opinions of the authors. PCI assumes no responsibility for the interpretation or application of the information contained herein.
2.1
0.3
0.0
~Ld exp-Lda M
Ld-ACI Mn-ACI
NCC SCC1 SCC2 SCC3
MIX TYPE
Figure 8-16. ACI M~- Normalized Development Length Ratios - Phase-1
Results from the ACI-318 method show that the SCC beams required longer development
lengths relative to the NCCB beams. The SCC1, SCC2B and SCC3 beams had 59%, 60% and
52% longer development lengths while NCCB beam had 1% longer length than recommended
by the ACI-318 code. Overall, Phase-1 strands seem to produce higher development lengths,
with an average of approximately 57% more than ACI recommendations for SCC mixes. The
lower value (-1%) obtained for NCC mixes may be due to the rusted surface condition used in
NCC mix. The higher development lengths for SCC mixes were concerning and raised question
about strand bond quality. Hence the Phase-2 test program was performed with similar mix
designs but with a pre-qualified strand. The effect of rust and mix proportioning are discussed
along with Phase-2 results in Section 8.9.
8.7 Development Length Test Results as per ACI-318 Method [3] - Phase-2
Similar to Phase-1 the results of the development length tests for each mix design type for
Phase-2 development lengths are provided in this section. As discussed earlier, only two tests
were performed per mix design in the Phase-2 of the project. All development length tests (all
197
Conclusions or recommendations in this report are the opinions of the authors. PCI assumes no responsibility for the interpretation or application of the information contained herein.
mixes) except SCC1-P2-1-B showed flexural type response and achieved ACI recommended
nominal capacities.
Table 8-6. Representative Development Lengths and.ACI Normalized Ratios - Phase-2
NCCB
SCC1
SCC2
SCC3
m
1.52
1.92
1.68
1.66
Lda
in.
60.00
75.50
66.00
65.25
LdaLd_exp -- Ld_ACI
0.95
1.10
1.04
0.95
Mtest
Mn -A Cl
1.00
1.05
1.05
1.05
La exp ~
Mt~, - 1M n-ACI
0.95
1.05
0.99
0.90
1.5
1.2
0.9
0.s
0.3
0.0
-" I-’da =:~ Mn-test d= 1Ld-exp Ld_AC!Mn-AC1
SCC1 SCC2 SCC3
MIX TYPE
Figure 8-17 Representative Development Lengths and ACI Normalized Ratios - Phase-2
The representative anchorage lengths and the respective ACI normalized development
length and moment ratios for Phase-2 test units are summarized in Table 8-6 and Figure 8-17. It
was observed that all mixes had much almost similar Ldtest/LdACI ratios, with SCC mixes being
198
Conclusions or recommendations in this report are the opinions of the authors. PCI assumes no responsibility for the interpretation or application of the information contained herein.
slightly higher relative to NCC mixes. Similar to Phase-1, the obtained Mtest/Mn-AC,’. ratios for
different mixes varied slightly. Hence, in order to compare the performance of SCC mixes
relative-to each other and to compare with reference NCC mix, reduced development lengths
(Ld_exp ) values, similar to Phase-1 results were-obtained. Figure 8-18 and Table 8-6 show the
reduced development length ratios for Phase-2 tests.
1.5
~E
0.9
0.6
0.3
0.0
L da M n-testLd exp ~ :~>-
Ld_AC1 Mn-AC!
-1
NCC SCC1 SCC2 SCC3
MIX TYPE
Figure 8-18. ACI M,,- Normalized Development Length Ratios - Phase-2
Results from the ACI-318 method for Phase-2 indicate that SCC1 test specimens required
longer development lengths and SCC3 test specimens required lower development length
relative to the NCC mix test beams. The development length of SCC2 test beams was similar to
that of NCC beams. The SCC1 beam had 5% higher development lengths than the ACI
recommendations. SCC2, NCC and SCC3 beams had 1%, 5% and 10% shorter development
lengths than the ACI recommendations. Overall, Phase-2 pre-qualified strands seem to produce
lower development lengths than Phase-1 strands. Moreover the effect of SCC mix proportioning
on development lengths seems to become more evident, with SCC1 (high fines) having larger
development lengths and SCC3 (high coarse aggregate content) having least development
lengths. The SCC2 (moderate mix) seems to be bounded by these extreme mix designs. Overall,
199
Conclusions or recommendations in this report are the opinions of the authors. PCI assumes no responsibility for the interpretation or application of the information contained herein.
SCC mixes for Phase-2 strands had development lengths that varied from +5% to -10% than
those predicted by ACI recommendations.
8.8 Flexural Bond length
As discussed earlier, deyelopment length is defined as the sum of the .transfer and flexural
bond lengths. Experimental values for transfer and development length from both phases were
obtained and hence flexural bond length can be computed as:
Lf = La_exp - Lt_,,,e,s (8-1)
where Ld-exp and Lt-,,,ea, are the experimentally obtained transfer and development lengths,
respectively.
In order to obtain the flexural bond length, the exact, or true, development length
corresponding to the nominal capacity of the section is required. The experimental approach to
determine development length (La-exp), consisted in varying the distance of the critical section
from the support by a trial and error such that the minimum anchorage length (Laa) that achieved
the nominal capacity was considered as the representative development length (La-ex~,) for the test
unit. However, the flermre tests with minimum anchorage length typically had a capacity beyond
the nominal estimate, indicating that the bond length was beyond the nominal requirement.
Therefore, use of the representative development length (La-~_xp) to estimate the flexural bond
length would over-predict the flexural bond length. Consequently, instead of using the
representative minimuna development length (La-ex~,), the experimental development length
corresponding to ACI nominal capacity (La_oxp ) was used. Further, in order to compare the
flexural bond length of both phases, the effects of strand quality and strand surface should be
removed. Thus, the experimental development length (Ld_oxp ) with the effects of strand quality
and rust removed were used in the determination of flexural bond length (Refer Table 8-9).
It follows that experimental transfer lengths corrected for strand quality and rust (refer
Table 7-16) are the values to be used for determining flexural bond length. Since concrete age at
day of flexural testing varied, the corresponding long-term prestress losses were different for
each test unit thus affecting the estimate of flexural bond length. Ideally, the flexural bond length
estimates should use experimental transfer lengths measured at the day of flexural testing. The
experimental transfer lengths at day of flexural testing were measured using draw-in
200
Conclusions or recommendations in this report are the opinions of the authors. PCI assumes no responsibility for the interpretation or application of the information contained herein.
measurements that rely on the position of reference brackets at the beam end(See section 7.3).
Movement of the test units from casting through test setup and weathering while beams were
scheduled for testing may have caused movements of these reference brackets. Thus, the
reliability of draw-in measurements at the day of flexural testing was questionable. However,
transfer length estimates at release (3 days) were deemed reliable. Yet, as discussed earlier,
flexural bond length estimates should consider transfer length values at the same age of flexural
testing. To overcome this problem, it was assumed that the ratio of measured transfer length to
the ACI value remains the same at release and at the day of flexural testing (irrespective of
concrete age):
Lt-"e’~s @ prestress release - L¢_,.e.. @ day of flexural test (8-2)Lt-ACl Lt-aCl
The flexural bond length was then back-calculated from the experimentally obtained
transfer and development lengths as described by Equation (8-1). Since the ratios of
experimental transfer and development length to corresponding ACI values were used to
estimate flexural bond length, the corresponding ideal transfer and development lengths were
obtained by the product of these ratios and respective lengths. The ideal development length was
obtained from the ACI estimate at the day of flexural testing for the particular test unit:
where Lu_oxp was obtained experimentally and is defined as the ratio of minimum anchorage
length (La,) that achieved (or exceeded) the ACI nominal moment capacity (M,,-ACI) to the ACI
predicted development length (La-Aci) such that the experimental moment capacity (M,,-tes~)
corresponds to the ACI predicted nominal capacity (M,,-ACt). In other words, the ideal
development length (La-iae,,Z) corresponds to the minimum amount of anchorage length to be
provided such that the ACI nominal capacity is exactly achieved. It should also be noted that the
value of La_exp used in determining flexural bond length was corrected for the effects of strand
quality and strand surface.
Similarly, the ideal transfer length (Lt-iaeal) was obtained from experimental data as
defined by the following expression:
201
Conclusions or recommendations in this report are the opinions of the authors. PCI assumes no responsibility for the interpretation or application of the information contained herein.
(8-4)Lt-ACI
where the values of Lt-meas]Lt-ACl were obtained experimentally and were corrected for strand
quality and surface rust (see Table 7-16). The values of Lt-AC1 and Lf-ACI correspond to the
predictions of transfer and,flexural bond lengths at the day of flexural testing and consider short~
and long-term prestress losses,
The ideal flexural development length (Lf-iaeal) can then be obtained as the difference of
ideal development (La-iae.3 and ideal transfer length (Lt-iaeat):
L f_ideaI = Ld_ideaI -- Lt_ideal (8-5)
The ideal flexural bond length (Lf-iaeal) thus represents the estimated experimental flexural bond
length as it was obtained from average experimental development and transfer lengths. The
values of estimated ideal flexural bond lengths for project both phases are provided in Table 8-7.
1 in. 25.4 mm* Effects of strand quality and surface rust removed.** ACI estimates include long term prestress losses corresponding to a concrete age atthe day of flexural testing.
8.8.1 Comparison of flexural bond lengths with ACI recommendations
The estimate of flexural bond lengths used experimental values of transfer and
development lengths that were already corrected for strand quality and strand surface conditions.
Hence, such effects on flexural bond length cannot be estimated. Ideally, since strand quality and
202
Conclusions or recommendations in this report are the opinions of the authors. PCI assumes no responsibility for the interpretation or application of the information contained herein.
surface effects are removed, the val-ues of estimated flexural bond lengths must be relatively
same and are representative of the effect of concrete on flexural bond length related parameters.
Table 8-8 provides su_rnrnary of flexural bond length related parameters and the comparison with
the ACI.recommendations.
NCCSCC1SCC2SCC3
Table 8-8. Comparison of Phase-! and Phase2 flexural bond lengths
L f _idea! L f _ideat , MIX L : , MIXL f - L f -AcI
Figure 8-19 compares the ratios of estimated flexural bond lengths with values according
to the ACI code. Except for SCC3 of Phase-2, the flexural bond lengths of all mixes (including
the NCC mixes) were higher than the ACI estimates. The ideal flexural bond length for the NCC
mixes were 31% and 26% higher than the ACI estimates for Phase 1 and Phase 2, respectively.
In Phase-l, the estimated flexural bond lengths for SCCt, SCC2 and SCC3 were 7%, 10% and
17% higher than ACI predictions, respectively. For Phase-2, the SCC1 and SCC2 mixes had
11% and 12% higher flexural bond lengths, respectively, while SCC3 had 15% lower flexural
bond length relative to the AC! estimate. Overall, among the SCC mixes, SCC 1 had the lowest
flexural-bond length and SCC3 (excluding the Phase-2 data point) had the highest fiexural bond
length. Results for the SCC2 mix were bounded by the other two mix designs. Similar to transfer
and development length results, the estimated flexural bond length results support the hypotheses
of bounding the performance parameters by proper mix design selection.
203
Conclusions or recommendations in this report are the opinions of the authors. PCI assumes no responsibility for the interpretation or application of the information contained herein.
1.4
1.2
0.2
Phase-1~ Phase-2
0.0NCC SCCl SCC2 SCC3
MIX TYPE
Figure 8-19. Comparison of estimated flexural bond lengths with ACI predictions.
8. 8.2 Effect of mix proportioning on flexural bond lengths
The effect of SCC mix proportioning on flexural bond lengths was computed in two
ways: a) by taking the ratio of estimated flexural bond le_p_gths of a given mix to the
corresponding flexural bond ~ of NCC mix in the same project phase, and b) by taking
ratios of ACI normalized flexural bond length of a given mix to the corresponding ACI
normalized flexural bond length of the NCC mix in the same project phase. The effect of mix
proportioning on transfer and development lengths were obtained by the latter method as it
includes the effects of varying concrete strengths and prestress.
Figure 8-20 shows the effect of SCC mix proportioning obtained from direct ratios of
flexural bond lengths. As shown in Table 8-8 and Figure 8-20, on an average (both phases), the
flexural bond lengths for the SCC1 and SCC2 mixes were 16% and 12% longer, respectively,
than the NCC mix and shorter by 14% for the SCC3 mix. The limitation of comparing the
flexural bond lengths by the above method is that it does not take into account the different
concrete strengths and effective prestress force in the test units at day of testing. By normalizing
the estimated flexural bond length with the ACI estimate at the day of testing these effects are
204
Conclusions or recommendations in this report are the opinions of the authors. PCI assumes no responsibility for the interpretation or application of the information contained herein.
removed. The ACI normalized flexural bond lengths can then be compared with the values for
the NCC mix of the respective project phase to obtain the effect of SCC mix proportioning.
1.4
1.2
0.4
0.2
0.0
17-/7] Phase-1~ Phase-2
NCC SCCl SCC2 SCC3
MIX TYPE
Figure 8-20. Comparison of flexural bond lengths with NCC mix - both phases
Figure 8-21 compares the ratio of ACI normalized flexural bond lengths with the ACI
normalized value for the NCC mix for each project phase. All SCC mixes had flexural bond
lengths smaller than those of respective NCC mixes. In Phase -1, the SCC1, SCC2 and SCC3
mixes had 19%, !6% and 11% lower flexural bond lengths, respectively, than the corresponding
NCC mix. Similarly, in Phase-2, the flexural bond lengths for the SCC 1, SCC2 and SCC3 mixes
were 9%, 9% and 32% lower, respectively, than the corresponding NCC mix. The general results
trend (more obvious in Phase-l) relative to the NCC mix values is that SCC1 has the lowest
flexural bond length, SCC3 (excluding Phase-2 SCC3 mix data point) has the highest flexural
bond length and SCC2 flexural bond length is bounded by the SCC1 and SCC2 mixes. This trend
is complimentary (opposite) to what was observed in transfer length measurements (see Figure
7-34). Therefore the combination of transfer and flexural bond lengths seems to get averaged out
and a relatively less pronounced effect is seen in development length results. This suggests that
205
Conclusions or recommendations in this report are the opinions of the authors. PCI assumes no responsibility for the interpretation or application of the information contained herein.
mix proportioning has unique, effects on different bond mechanisms that govern transfer and
flexural bond lengths.
1.1
1.0
~,,~% 0.8
0.7
0.5
Phase-1~ Phase-2
0.4NCC SCCl SCC2 SCC3
MIX TYPE
Figure 8-21. Effect of SCC mix proportioning on flexural bond length - both phases
An evaluation of results just presented seems to indicate that the data from the Phase 2
SCC3 mix seems to be an outlier in the trends, i.e., higher value of flexural bond length was
expected for SCC3 of Phase-2. It should be noted that the same SCC3 mix was also found to not
follow the trend of transfer length measurements (see Figure 7-34), i.e., a !ower value of transfer
length was expected than what was measured. As discussed earlier, the SCC3 Phase 2 test units
were cast in extreme cold weather conditions and this may have affected the corresponding
results. Nevertheless, the overall data from both phases shows similar trends. In addition, the
SCC3 transfer and flexural bond data compliment each other thereby increasing confidence in
the results.
206
Conclusions or recommendations in this report are the opinions of the authors. PCI assumes no responsibility for the interpretation or application of the information contained herein.
8.8.3 Comparison of flexural bond length and pull-out test data
Table 8-9 provides a comparison of NCC normalized peak pull-out strengths and NCC
normalized flexural bond lengths. A detailed evaluation of pull-out strengths is provided in
Chapter 6. Figure 8-22 and Figure 8-23 compare the NCC normalized peak pull-out and flexural
bond lengths for Phase-1 and PNige-2 Yespectively. The flexural bond lengths and peak pull-out
strengths follow similar trends indicating that similar bond phenomenon controls / governs both
parameters.
Table 8-9. Comparison of pull-out and flexural bond lengths
MIX
P1NCC 1.00SCC1 0.78SCC2 0.91SCC3 0.95
P1 = Phase-1; P2 = Phase-2
PPK _ NCC
P21.000.730.831.09
P11.000.810.840.89
Ls ,MIX
Ls,NCC
P21.000.910.910.68
Pet: ~ = Peak pull-out force of any mix, PPt¢ ~vcc = Peak pull-out force of NCC mix
1.1 1.1
1.0
0.9
0.8
0.7
0.6
0.5
0.4
Pull-outL~
NCC SCCl SCC2 SCC3
1.0
0.5
0.4
MIX TYPE
Figure 8-22. Comparison of peak pull-out and flexural bond length - Phase-1
207
Conclusions or recommendations in this report are the opinions of the authors. PCI assumes no responsibility for the interpretation or application of the information contained herein.
1.3 -
!.2
1.1
1.0
0.9
0.8
0.7
0.6
0.5
1.3
1.2
1.1 ~,~
1.0 ~
~.7
0.5
0.4 0.4NCC SCCl SCC2 SCC3
MIX TYPE
Figure 8-23. Comparison of peak pull-out and flexural bond length - Phase-2
8.8.4 Summary and concl~n on flexural bond length
The complimentary nature of transfer and flexural bond lengths was expected as the
estimation of flexural bond length was done by taking into account the experimental transfer and
development lengths. Since the difference in development lengths for each of the mixes was
relative small, the estimation of flexural bond length by Equation 8-5 will yield flexural bond
lengths complimentary to the transfer length. The authors believe that the bond mechanism
governing the flexural bond length, namely mechanical interlock is replicated well with simple
pull-out tests. It was already observed that the trends in transfer length results for the different
mix designs did not match similar trend obtained from pull-out tests. This indicates that the bond
mechanism governing transfer length (Hoyer’s effect) is not represented well by simple (non-
prestressed) pull-out tests. This suggests that the use of simple (non-prestressed) pull-out tests to
estimate transfer lengths is technically incorrect as it does not represent the bond mechanisms
dominant at transfer. Yet, simple pull-out tests are a good approach to estimate the flexural bond
parameters. This is supported by results shown in the previous section where the estimated
flexural bond lengths and peak pull-out strengths showed similar trends.
208
Conclusions or recommendations in this report are the opinions of the authors. PCI assumes no responsibility for the interpretation or application of the information contained herein.
8.9 Discussion on Development Length
Similar to pull-out test results (chapter 6) and transfer lengths (chapter 7), the experimental
results from the development length program can be discussed further using the following
parameters: a) effect of-strand bond quality, b) effect of mix proportioning, c) effect of strand
surface (rust of NCC mix of Phase-1), and, d) Overall SCC behavior.
Development length was experimentally evaluated using flexural tests. The representative
development length for each mix was obtained from the test response and type of failure. The
least anchorage length that led to achievement of the ACI nominal moment capacity was
considered as the representative of the mix. Two different strand types classified based on the
strand bond quality, as explained in chapter 5, were used. Since the moment capacities achieved
for each test was different; for comparison the reduced development ratios corresponding to AC1
nominal capacities were used. As discussed earlier, in Phase-l, the SCC2A mix was a stiff mix
and is thus not included in the comparison. Instead, results from the SCC2B mix of Phase-1 will
be compared with those of the SCC2 mix in Phase-2.
8. 9.1 Effect of Strand Bond Quality on Development Length
As discussed in Section 5.2.2, strands used in each of the two project phases were
different, with the Phase-2 strand being pre-qualified and of a better quality than that used in
Phase-1. The better quality of the Phase-2 strand was evident from the experimental development
length results. The development lengths obtained from Phase-2 were lower than those from the
corresponding mix designs of Phase-1. Nonetheless, it was observed that all of the SCC mixes
had larger transfer lengths than the NCC mixes except for SCC3 mix of Phase-2.
Table 8-10 provides the ACI normalized development length for both phases. Figure 8-24
provides a comparison of the least development lengths obtained from both phases. Figure 8-25
provides the comparison of the experimental development lengths corresponding to ACI nominal
moment capacity for both phases. It was observed that Phase-1 strands (relatively poor quality)
had higher development lengths than Phase-2 (pre-qualified for adequate bond) strands. For
Phase- 1 strands, the development length of NCC mix showed an increase of-6 % with respect to
Phase-2 strands. Similarly for SCC mixes, the development length of SCC1, SCC2 and SCC3
mixes showed an increase of approximately 52%, 62% and 68% respectively, with respect to
Phase-2 strands.
209
Conclusions or recommendations in this report are the opinions of the authors. PCI assumes no responsibility for the interpretation or application of the information contained herein.
Table 8-10 Comparison of Experimental Development Lengths from both phases
MIXNCCSCC1SCC2SCC3
L aa M testLd_exp -
,La-AC! Mn-AC!
Phase-11.011.591.601.52
Phase-2_0.95!.050.990.90
La_exp, Phase - 1
La_exp , Phase - 2
1.061.521.621.68
1.2
0.9
0.6
0.3
0.0
: Laa :==> gn-test
Ld-exp Ld_AC! Mn-ACt
NCC SCCl SCC2 SCC3
Phase-1~ Phase-2
MIX TYPE
Figure 8-24. Comparison of Experimental Development Lengths - Both Phases
The increase in development length due to poor strand quality in Phase-1 was found to
vary approximately within 50% to 70%, and hence the average increase (NCC not included) of
development lengths due to poor strand quality in Phase-1 was found to be 60%. The NCC mix
was not included as the development result of NCC mix of Phase-1 includes the contribution of
rust. The contribution of rust is explained in section 8.9.3. Thus strand quality seems to
considerably affect the development length. Also, the strand quality is strand specific and hence
will vary for different types of strands. For the strands used in this research, it was observed that
210
Conclusions or recommendations in this report are the opinions of the authors. PCI assumes no responsibility for the interpretation or application of the information contained herein.
the Phase-1 (poor quality) strands had approximately 60% more development length than the
corresponding Phase-2 (pre-qualified) strands.
1.5
~ 1.2EO¯ ~ 0.9
’̄o 0.6N
L~exp "~-Ld" :~’ Mn-test = 1 Phase-1
-L~t_AcI
Mn_AcI~ Phase-2
NCC SCCl SCC2 SCC3
MIX TYPE
Figure 8-25 Comparison of ACI Normalized Development Lengths - Both Phases
8.9.2 Effect of Mix Proportioning on Development Length
The same strand was used for all concrete mixes of each pr~ect phase. Thus, within each
project phase, the effect of strand quality and strand related parameters (diameter, surface
quality,, etc.,) is the same for all mixes. This implies that the experimental development length
obtained from each phase provides valuable information about the unique contribution of
concrete mix proportioning on deve!opment length performance. Also, as discussed in chapter 3,
the mix designs used in this project were designed to bound the various mix design approaches to
SCC and study their effect on performance of structural parameters. It is logical that the
development lengths from two different strands are different. At the same time, for the same
strand, the relative performance of the strand with different concrete mix designs should be the
same. This was validated with the experimental results of the development length program
performed in both phases of this research.
211
Conclusions or recommendations in this report are the opinions of the authors. PCI assumes no responsibility for the interpretation or application of the information contained herein.
It can be observed from Figure 8-24 and Figure 8-25 that the experimental development
lengths from both phases follow a very similar trend. The reference NCC mixes had the least
development ,length of all mixes (excluding SCC3 of Phase-2). Among the SCC mixes~ the
expenmentm devmopmenr length of SCC 1 mix (high fines) had the highest value and SCC3 mix
(high coarse aggregate content) had the. least value, while the SCC2 mix (moderate mix) was
bounded by the extremes of SCC1 and SCC3. The results seem to support the hypothesis of
bounding the structural properties by proper mix design selection.
Table 8-i i summarizes the experimental development length from each of the phases. It
should be noted that the experimental development length shown in Table 8-11 are normalized to
match the ACI nominal moment capacity. As discussed earlier, the moment capacities of the
various flexural tests was different and in order to have a reference to compare the results, the
representative development lengths for each mix were reduced to match the respective ACI
recommened moment capacities. Also, in order to determine the effect of mix proportioning, the
ACI normalized experimental development length values of SCC mixes were comapred with
similar reference NCC mix values as shown in the last two columns of Table 8-11.
MIX
NCCSCC1SCC2SCC3
Table 8-11 Effect of Mix Proportioning on Devlopment Length- Both Phases
Lda Mtest - 1Zd_exp --
~Ld-ACl M n-Acl
Phase-1
1.011.591.601.52
Phase-2
0.951.050.990.90
Phase-1
1.001.571.591.51
Ld_exp ,
Ld_exp, NCC
Phase-2
1.001.101.040.95
The normalized ratios of relative development length for each mix with respect to the
appropriate NCC mix (as given in Table 7-15) are graphically represented in Figure 8-26. The
effect of mix proportioning on development length was distinct in both of the research phases.
For Phase-l, SCC1, SCC2 and SCC3 mixes showed an approximate increase of 57%, 59% and
51% respectively, relative to the corresponding NCC mix. Similarly for Phase-2, SCC1 and
212
Conclusions or recommendations in this report are the opinions of the authors. PCI assumes no responsibility for the interpretation or application of the information contained herein.
SCC2 had 10% and 4% higher development lengths thatt respective NCC mix._ SCC3 mix
showed a decrease of 5% relative to NCC mix.
In spite of the complex bond mechanisms and-the numerous factors affecting it; it was
observed that the bond parameters including transfer and development lengths seem to be
¯ affected by mix proportioning. Overall, for development lengths, it was observed that the SCC 1
(high fines) mix had the highest increase and SCC3 (high coase aggregate content) mix had the
least increase relative to respective NCC mix; thereby supporting the research concept that the
strucraral parameters (in this case development length) can be controlled/bound by proper mix
design selections.
0z
2.1Ld-exp - MIX
1.8 Ld-exP NCC
1.5
!.2
"1.00.9
0.6
0.3
; Ld expL~ Mn_test
Ld-ACI Mn-ACI
0.0NCC SCC1 SCC2 SCC3
Phase-1~ Phase-2
MIX TYPE
Figure 8-26 Comparison of NCC Normalized Development Lengths - Both Phases.
8.9.3 Effect of Strand Surface (rust of NCC- Phase-l) on Development Length
As discussed in Section 5.2.2, due to the poor performance of first few concrete mixes,
few test units had to repeated. As a result, the strand used in NCC mix of Phase-1 was slightly
rusted / pitted (Section 5.2.2). At the same time, the strand used in all the SCC mixes of Phase-1
was the same and does not affect the relative study of the SCC mixes. As discussed in section
6.5, it was observed that the rusted strand in Phase-1 NCC mix gave higher peak and first slip
pull-out forces. The contribution of rust on pull-out forces was calculated by certain assumptions
213
Conclusions or recommendations in this report are the opinions of the authors. PCI assumes no responsibility for the interpretation or application of the information contained herein.
as discussed in section 6.6.3. One of the_ assumptions was that, for any parameter, the ratio of
average value measured for SCC mixes to the same for NCC, for that particular parameter should
be a constant for a particular type of strand. A similar approach was used to obtain the
contribution of rust on development length. It was found that the rust reduced the development of
NCC mix of Phase-1 by approximately 50%. It should be noted that the computed value is based
on some assumptions. The contribution of rust was calculated to roughly estimate the effect of
rust and not to quantify or exactly measure it. Also, the contribution of rust is ’strand specific’, as
the amount of rust may vary for different strands. In conclusion, for the strand used in NCC mix
of Phase- 1, the contribution of rust is estimated to be 50%.
8. 9.4 Strand Quality and Surface Condition corrected Development Lengths
The effects of strand quality and strand surface (rust) on the resulting development
lengths, and the assumptions in estimating these effects and resulting trends were discussed in
previous sections. To solely compare the effects of mix proportioning on development length for
both project phases, appropriate corrections for strand quality and surface conditions were
applied to the experimental development length results of Phase-1. Table 8-12 provides values of
actual experimental development lengths as well as corrected values for strand quality and rust
for both phases. The effect of mix proportioning with the corrected development lengths is also
provided. Figure 8-27 compares the experimental development lengths for both phases corrected
for strand surface and quality effects. Figure 8-28 shows the effect of mix proportioning on
development length for both phases taking into account the strand quality and surface effects.
Table 8-12. Experimental development lengths corrected for effects of strand quality and rust.
MIX
NCCSCC1SCC2SCC3
La.._exp -La" Mtest - 1Ld_~tc! ’ M,,_,ct
Actual experimental data
Phase-11.011.591.601.52
Phase-20.951.050.990.90
Experimental data correctedfor strand quality and rust
Phase-10.950.991.000.95
Phase-20.951.05O.990.90
La_exp, M/X
La_exp, NCC
Strand Quality andsurface rust correctedPhase-1
1.001.041.051.00
Phase-21.001.101.040.95
Note: a) Correction for effect of rust is applied only to NCC mix of Phase-1.b) Correction for Strand quality is applied to all mixes of Phase- 1
214
Conclusions or recommendations in this report are the opinions of the authors. PCI assumes no responsibility for the interpretation or application of the information contained herein.
1.4-
1.2
1.0
0.8
0.6
0.4
0.2
0.0
177-/1 Phase-1~-Phase-2
NCC sccl SCC2 SCC3
MIX TYPE
Figure 8-27. Experimental development lengths corrected for strand quality and rust effects -both phases
o
..c: 1.2
._t
E 0.8o
0.6
N
Eoz 0.2
z 0.0
Ld_exp - MIX
LdaM n_test
; La_e~p - ~ -- - 1La_o~o - ~vcc La_~c~ M~_~cI
17~7] Phase-1~ Phase-2
NCC SCC1 SCC3
MIX TYPE
Figure 8-28. Effect of mix proportioning on development lengths corrected for rust and strandquality effects - both phases.
215
Conclusions or recommendations in this report are the opinions of the authors. PCI assumes no responsibility for the interpretation or application of the information contained herein.
The average results of experimental development lengths with the effects of surface rust
and strand quality removed reveal that all SCC mixes (except SCC 1 of Phase-2) were within the
AC! code-predicted value:-In Phase -1, the NCC and SCC3 mixes had approximately 5% lower
development length than the ACI predictions, while the SCC 1 and SCC2 mixes had development
lengths similar to the ACI estimate. Similarly in Phase-2, the NCC mix and SCC3 had 5% and
!0% shorter develoment lengths, respectively, relative to the ACI predictions, while SCC! had
approximately 5% longer development lengths. Overall, excluding the slightly higher
development length value of SCC1 in Phase-2, it can be conc!uded that all mix design satisfied
the ACI criteria.
Although the comparison of development lengths with ACI recommendations suggests
that the values for all mix designs were within the ACI code criteria, the comparison of SCC
mixes with NCC suggests that on an average the SCC mixes had longer development lengths
than the corresponding NCC mixes (Figure 8-28). Consistent in both project phases, the SCC1
mix had the largest development length followed by SCC2 and SCC3, in that order. In Phase-2
the SCC1 mix had approximately a 10% higher development length than the respective NCC
mix. Thus, while the SCC mixes seem to have average development lengths that meet the ACI
recommendations, the longer development lengths of SCC mixes relative to NCC mix should be
taken into consideration for designs using SCC to have the same level of confidence as those
using NCC.
8. 9. 5 Overall Effect of SCC
As discussed in earlier sections, it was observed that all SCC mixes had larger
development lengths than respective NCC mixes. For Phase-1 strands the development lengths
varied approximately by +50% to +60%. Similarly for Phase-2 strands, this variation was +10%
to -5%. This variation depends on the mix proportioning type.
The experimental development lengths for all mixes of Phase-1 (poor quality) strands
were higher than ACI recommendations. The average experimental development lengths for
SCC mixes of Phase-1 strands exceeded the ACI recommendations by 57%. This increase in
development lengths is concerning for the conservativeness of the ACI code. At the same time,
this increase is not mainly due to the effect of SCC mixes. The major contributor for this increase
was the strand quality, as poor quality strands were used in Phase-1. The NCC mix of Phase-1
216
Conclusions or recommendations in this report are the opinions of the authors. PCI assumes no responsibility for the interpretation or application of the information contained herein.
strand exceeded the A~2I recommendation by only 1%, but the strand was rusted and as discussed.
in section 8.9.3, the contribution of rust reduced the development length.
Similarly the experimental development lengths for Phase-2 (pre-qualified strands) were
within ACI recommendations for all mixes except SCC! (high fines) mix which exceeded by
5%. At the same time, the experimental development lengths for SCC1 and SCC2 mixes was
higher than respective NCC mix by 10% and 4% respectively. The SCC3 mix was lower than
respective NCC mix by 5%.
It was observed from the results of the development length program that the results from
both the phases seem to follow same trends. Moreover, from the Phase-2 (pre-qualified srand)
results, it was found that the worst of SCC mixes (SCC1 - high fines) used in this research
exceeded the ACI recommendations by only 5%. At the same time, the comparison with NCC
mixes shows that the SCC mixes had higher development length by approximately 10%. This
raises concerns about the conservativeness of the code. This lack of conservativeness should be
taken into consideration while designing beams with SCC mixes to obtain the same confidence
as the conventional NCC mix.
8.10 Summary and Conclusions
Development lengths were experimentally found by performing flexural tests on beams
made from three SCC mixes and one conventional NCC mix. In Phase-l, a total of 12 beams (24
flexural tests), with two beams per mix design were tested. In Phase-2, a total of 4 beams (8
flexural tests), with 1 beam per mix design were tested. In Phase-l, two mix designs had to be
repeated due to concrete performance issues and hence the results from those tests were not
considered. The experimental development length was obtained by trial and error approach. The
anchorage length was varied and the minimum anchorage length that led to flexural type of
failure was considered as the representative of the mix.
All SCC mixes had higher development lengths relative to the respective NCC mixes
(except SCC3 of Phase-2). On an average, relative to respective NCC mixes, SCC mixes had
larger development lengths by 55% and 3% for Phase-1 and Phase-2 strands. For Phase-1 strands
the development lengths varied approximately by +50% to +60%. Similarly for Phase-2 strands,
this variation was +10% to -5%. This variation depends on the mix proportioning type.
217
Conclusions or recommendations in this report are the opinions of the authors. PCI assumes no responsibility for the interpretation or application of the information contained herein.
The strand quality_ seems to .affect the development length. The increase in development
length due to poor strand quality in Phase-1 was found to vary approximately within 50% to
70%, and hence the average increase (NCC not included) of development lengths due to poor
strand quality in Phase-1 was found to b.e 60%. The NCC mix was not included as the
development result of NCC mix of Phase-1 inclt~des the contribution of rust. The contribution of
rust on NCC mix of Phase-I strand was computed to be 55%
The effect of mix proportioning was evident from the results of the development length
program. For Phase-1 (corrections for strand quality and rust not incorporated), test units from
SCC1, SCC2 and SCC3 mixes showed an approximate increase in development lengths of 57%,
59% and 51% respectively, relative to corresponding NCC mix. Similarly in Phase-l, the
development length values corrected for strand quality and rust revealed that SCC1 and SCC2
had longer development lengths by approximately 5%, while SCC3 had development length
equal to, respective NCC mix. In Phase-2, test units from SCC1 and SCC2 mixes had 10% and
4% higher development lengths than respective NCC mix while test units from SCC3 mix
showed a decrease in development length by 5% relative to NCC mix test units. Overall, test
units from SCC mixes had higher development lengths. The worst of SCC mixes was SCC1
(high fines mix). Relative to NCC mix, SCC1 mix had approximately 60% and 10% increase in
development lengths for Phase-1 and Phase-2 strands respectively.
In spite of the complex bond mechanisms and the numerous factors affecting it; it was
observed that the bond parameters including transfer and development lengths seem to be
affected by mix proportioning. Overall, for development lengths, it was observed that the SCC 1
(high fines) mix had the highest increase and SCC3 mix (high coarse aggregate content) had the
least increase relative to respective NCC mix; thereby supporting the research concept that the
structural parameters (in this case development length) can be controlled!bound by proper mix
design selections.
The NCC mixes of both phases satisfy the ACI recommendations very well. Also, results
from both phases indicate that the trend of development length agree reasonably well, thereby
validating the Phase-1 results and the effect of strand quality on development length.
Theoretically, if the effects of strand quality are taken into consideration, the Phase-1 resutls
should match with Phase-2 results. From the results it was observed that the worst of all SCC
mixes was SCC1, the high fines mix. In Phase-2, it was observed that SCC1 had 5% higher
218
Conclusions or recommendations in this report are the opinions of the authors. PCI assumes no responsibility for the interpretation or application of the information contained herein.
development length than ACI recommendations and .10% higher development length than the
respective NCC mix. Although this increased development lengths raises questions regarding the
conservativeness of the ACI recommendations for SCC it should be noted that the ACI
recommendations and its validity have been questioned for over 25 years for the conventional
mix [9] [ 13] [27] [34] [47] [49] [52] [59]. Thus, ta~ge deviations on results related to bond issues are
still being debated even for conventi-onal concrete, which is ,.~e!! developed and understood. In
such a scenario, the increase in SCC of 10% over conventional mix should not be much
concerning and should not affect or inhibit the use of SCC. At the same time, in order to increase
the conservativeness to match the_ reliability offerd by conventional mixes, the designers could
increase the development lengths by 10%.
The SCC mixes used in this research are theoretical mixes used solely for this research to
bound the available mix proportioning approaches. Also, the number of flexural tests performed
for each mix design is relatively minimal (four tests for Phase-1 and two tests for Phase-2). With
this limited scope of the research it is difficult to recommend or prescribe a code
recommendation for SCC mixes, as this was not the intent of this research. At the same time, the
researchers feel that a large experimental program with the same concept of bounding the mix
proportioning approaches would lead to valuable information on behavior of SCC mixes and
their effect on bond parameters.
Nevertheless, the research results provide valuable insight on the effects of SCC mixes on
various bond performance. Although the overall effect on development length was minimal
(10% higher for high fines mix), distinct effects were obsel~’ed on bond prameters of transfer
length and pull-out strengths. It seems that these effects get averaged over during the
development length tests, as development length is a combination of all the bond meachanisms.
Overall, it was observed that SCC mix proportioning affects the individual bond mechanisms at
prestress release and flexural testing. For development length, the effects of individual bond
mechanisms seem to get averaged out and the overall effect was found to be minimal and not
much concerning. At the same time, safety considerations are to be taken into account to obtain
the same reliability and confidence in code recommendations as that for the conventional mix.
219
Conclusions or recommendations in this report are the opinions of the authors. PCI assumes no responsibility for the interpretation or application of the information contained herein.
CHAPTER 9 SUMMARY AND CONCLUSIONS
9.1 Project Background-and Scope
Self-consolidating concrete (SCC) is quickly moving from a potential transformative
technology to a mainstream example of modern high-performance concrete. Its unique behavior
to fill formwork and flow around obstructions without blocking or segregating is obtained by
tailoring the selection of materials and mix proportioning. This offers the possibility of designing
for both the fresh and hardened properties of concrete to specific project needs. The special mix
designs that give SCC its unique fresh-property advantages significantly deviate from what is
currently considered as ideal and developed through many years of experience and research. This
has raised concerns regarding material and structural performance issues, which have limited or
at least slowed their increased use particularly in the U.S.
Considerable research exists on the development of SCC mix designs, and research on
structural performance of elements built using SCC has been significant since the start of this
project. Yet, the tailorable nature of SCC seems to be at the core of the data scatter seen in recent
research, whose results are thus hard to compare and are in some instances contradictory. This
raises doubts on the appropriateness of reaching definite conclusions regarding SCC using
limited or specific mix designs. One way to address this issue is to associate the performance of
members built using SCC with its appropriate mix design. Hence, one of the main hypotheses of
this work was that the parameters governing the structural performance of members built using
SCC, in this case bond performance, can be bound by appropriate mix proportioning.
The current study thus focused on investigating the effect of SCC mix proportioning on the
bond performance of prestressing strand in SCC precast/prestressed beams in terms transfer and
development length by bounding the parameters that control SCC mix design.
220
Conclusions or recommendations in this report are the opinions of the authors. PCI assumes no responsibility for the interpretation or application of the information contained herein.
9.2 Project Overview
The study was aimed at evaluating the bond properties of 13 mm (0.5 in.) diameter
prestressing strands as they relate to transfer and development length for precast/prestressed
beams made from SCC. Three SCC mix designs that bound the accepted methods towards SCC
mix proportioning were designed, using their w/c ratio as the guiding parameter, to create
performance bounds that would show the compromises made by different proportioning. The
first SCC mix (SCC1) was designed with a low w/c ratio (0.35) relying on high-fmes content and
high HRWR dosage to provide high-fluidity. At the other extreme of proportioning, a SCC mix
(SCC3) with a high w/c ratio (0.45) and high aggregate content relied on the free-water content
and moderate HRWR dosage for fluidity, and VMA to provide stability. In between these two
cases, a SCC mix (SCC2) with moderate w/c ratio (0.40) was obtained from the combination of
the two approaches. A normally consolidated concrete (NCC) mix comparable to the balanced
SCC mix (SCC2) with w/c ratio = 0.40 was used as a reference or control mix design.
The experimental evaluation of transfer and development length was performed through a
structural testing program on laboratory scale precast/prestressed T-beams. The strand bond
parameters were experimentally studied by: (a) pull-out tests on unstressed strand, (b)
determination of transfer length through compressive strain profile and strand draw-in
measurements, and (c) assessment of development lengths through iterative flexural testing.
Due to unexpected complications, the research project had two phases, which followed
from the two _types of prestressing strand used in the study. Upon completing the project’s
original scope of work, the quality of the strand used was questioned. A subsequent independent
evaluation indicated that the strand did not meet recommended quality criteria benchmarks.
Thus, a second phase, consisting of a partial repetition of the project, was conducted with a pre-
qualified strand to isolate the possible effect of strand quality from the effect of mix design.
Due to repetition of test units in Phase-l, the strand used in the normally consolidated
concrete (NCC) beam was slightly rusted. Consequently, a synthesis of the results from both
project phases have not only allowed the identification of the effects of SCC mix designs on
strand bond behavior parameters, i.e., pull-out strength, transfer length and development length,
but have also given quantitative information on the effect of strand quality and rust on the same
parameters.
221
Conclusions or recommendations in this report are the opinions of the authors. PCI assumes no responsibility for the interpretation or application of the information contained herein.
9.3 Results Summary
9.3.1 Pull-out Strength
Results from the pull-out test program gave considerable information about the strand
bond performance and the effect of mix design selection on resulting pull-out properties. Key
results are provided here and detailed discussions are provided in Chapter 6.
A) Effect Of Mix Proportioning
¯ The pull-out forces (peak and first slip) of all SCC mixes, except peak pull-out of
SCC3 in Phase-2, were lower than those corresponding to the respective NCC mix.
Overall, the pull-out forces corrected for strand quality and surface rust effects
revealed that the average peak and first-slip pull-out forces of SCC mixes were lower
by approximately 12% and 14%, respectively, than the corresponding NCC mix.
The trend of peak pull-out force values showed that among the SCC mixes, SCC1
(high fines mix) had the least bond strength followed by SCC2 (moderate mix) and
SCC3 (high coarse aggregate content mix) mixes. Thus, the pull-out behavior of SCC
mixes was bound by the extreme mix designs selected in this project.
B) E{fect qf Strand Quali~_ & Strand Surface (Rust)
The effect of strand quality and surface rust is specific to the strand used in this work and
certain assumptions have been made in computing these effects (see Chapter 6). The overall
average effect is provided below:
¯ The effect of strand quality was found to be approximately 103% and 88% for peak
and first slip pull-out forces, respectively.
The effect of strand surface rust was found to be approximately 30% and 55% for peak
and first slip pull-out forces, respectively.
222
Conclusions or recommendations in this report are the opinions of the authors. PCI assumes no responsibility for the interpretation or application of the information contained herein.
9. 3.2 Transfer Length
Transfer length values were determined through concrete strain profiles and draw-in
measurements. Results on the average transfer lengths at prestress release (3 days) from the two
techniques are summarized below. Also, to remove the effects of varying prestress and to
compare with ACI recommendations, the results noted below are based on values normalized
with the ACI-3 ! 8 code estimate. Key overall results are provided here and detailed discussions
are provided in Chapter 7.
A) Experimental Transfer Lengths and ACI recommendation
¯ The transfer lengths of all mix designs used in this work were found to be within the
values determined according to the ACI-318 code recommendations.
B) Effect of Mix Proportioning
¯ The transfer lengths of all SCC mixes were longer than those corresponding to the
respective NCC mix.
Transfer lengths corrected for strand quality and surface rust effects revealed that, o~
an average, test units from SCC mixes had longer transfer lengths by approximately
35% relative to the respective NCC mix.
The overall trend of average transfer lengths showed that among the SCC mixes, SCC 1
(high fines mix) had the longest transfer lengths and SCC3 (high coarse aggregate
content mix) mix had the shortest transfer lengths (excluding Phase-2 data point). The
transfer length of SCC2 (moderate mix) was bounded by the values for the SCC1 and
SCC3 mixes.
C) Effect o_f Strand Quali_ty & Strand Surface (Rust)
Similar to pull-out test results, the results given below reflect only the overall average
effect of strand quality and surface rust condition.
¯ The overall effect of strand quality (Lt.Phase-1 > Lt-Phase-2) was found to be
approximately 17%.
¯ The effect of rust on transfer lengths was found to be minimal and was thus neglected.
223
Conclusions or recommendations in this report are the opinions of the authors. PCI assumes no responsibility for the interpretation or application of the information contained herein.
9.3.3 Flexurai Bond Length
Flexural bond length was not directly obtained from experiments but estimated from the
experimental values for transfer and development length. The transfer and deveiopmenttength
values used for calculating flexura! bond length were corrected for strand quality and surface rust
effects. Hence, such effects cannot be computed for tlexural bond length. The average values of
experimental transfer lengths and ideal experimental development lengths were used. Detailed
description and computation of flexural bond lengths is provided in Section 8.8
A) Flexural Bond Lengths and ACI recommendations
The average estimated flexural bond lengths of all mix designs were found to be longer
than the ACI code value. The average (both phases) flexural bond lengths of the NCC
mixes was 29% longer than the ACI recommendations. Similarly, the average flexural
bond length of the SCC mixes (excluding SCC3 of Phase-2) was 12% longer than the
ACI value.
B) Effect of Mix Proportioning
¯ On average, the flexural bond lengths for the SCC mixes were shorter (approximately
16%) than those corresponding to the respective NCC mix.
The overall trend of estimated flexural bond lengths was more evident in Phase-1 than
in Phase-2. It was observed that among the SCC mixes, SCC 1 (high fines mix) had the
shortest flexural bond lengths and SCC3 (high coarse aggregate content mix) mix had
the longest flexural bond lengths. Similar to experimental pull-out and transfer length
studies, the flexural bond length of SCC2 (moderate mix) was bounded by respective
values from SCC1 and SCC3 mixes.
The trend of flexural bond lengths was similar to that of peak pull-out strengths,
suggesting the bond mechanism dominating peak pull-out strengths and flexural bond
length is also similar.
The trend of the estimated flexural bond lengths for the different SCC mixes was
complimentary (opposite) to the transfer length trend.
224
Conclusions or recommendations in this report are the opinions of the authors. PCI assumes no responsibility for the interpretation or application of the information contained herein.
9.3.4 Development Length
Development length values were obtained through flexural tests using a trial and error
approach. The minimum embedment/anchorage !ength that resulted in test moments equal to or
greater than the ACI nominal moment capacity was considered as the representative
development length of that concrete mix. To compare the development lengths -of test units from
various concrete mixes, an ideal experimental development length was obtained by reducing the
representative development length such that the test moment equaled the code nominal capacity.
A detailed description of the test setup and the approach to determine representative and ideal
development lengths is provided in Chapter 8.
A) Experimental Development Lengths and A CI recommendations
¯ The average experimental development lengths for all mix designs used in this work
can be considered to be within the ACI recommended values.
The development length of the SCC1 mix in Phase-2 was approximately 5% longer
than the ACI code value. Considering the uncertainties related to material properties,
test methods, calculation approach, and the uncertainty in code equations themselves, it
can be considered that development lengths of SCC mixes are adequate relative to the
ACI recommendations.
B) Effect of Mix Proportioning
¯ The development lengths all SCC mixes (excluding SCC3 of Phase-2) were longer
than those corresponding to the respective NCC mix.
The most consistent effect of SCC on development length was seen in Phase-2, when
the development length for SCC 1 (high frees mix) was approximately 10% longer than
the NCC mix and the development length for SCC3 (high coarse aggregate mix) was
5% shorter than the NCC mix.
The development length values corrected for strand quality and surface rust effects
revealed that, on average, test units from SCC mixes had longer development lengths
by approximately 3% relative to NCC.
225
Conclusions or recommendations in this report are the opinions of the authors. PCI assumes no responsibility for the interpretation or application of the information contained herein.
The different bond mechanisms that govern the transfer and flexural bond lengths seem
to get averaged (or cancel-out) due to their complimentary (opposite) nature, resulting
in relatively less impact on development lengths-estimates. On average, it was
observed that transfer lengths of SCC mixes were approximately 35% longer and
flexural bond lengths were approximately 16% shorter than the corresponding NCC
mix. Nevertheless, the overall average effect of SCC on development length seems
only marginally higher (by 3%) relative to NCC mix. This suggests that SCC mix
proportioning has unique and distinct effect on each of the bond phenomena pertinent
to prestressing strands, but they seem to cancel out on their effect to development
length.
The overall trend of development lengths showed that among the SCC mixes, SCC1
(high fines mix) had the longest development lengths and SCC3 (high coarse aggregate
content mix) mix had the shortest development lengths. Similar to all bond parameters
studied in this work, the development length of SCC2 (moderate mix) was found to be
bounded by values for the SCC1 and SCC3 mixes.
C) Effect of Strand Quali_ty & Strand Surface (Rust)
Similar to pull-out test results, only the overall average effect of strand quality and surface
rust condition was studied for development length and the summary is provided below.
¯ The average effect of strand quality (Ld-Phase-1 > Ld-Phase-2) on development length
was found to be approximately 60%.
¯ The average effect of strand surface rest (shorter L~ of Phase- 1 NCC mix) was found to
be approximately 50%.
226
Conclusions or recommendations in this report are the opinions of the authors. PCI assumes no responsibility for the interpretation or application of the information contained herein.
9.4 Observations ....
The following key issues were observed during this-project and while not necessarily direct
results of the program the authors consider them valuable lessons learned from this effort.
¯ Achieving the desired fresh properties for SCC on site depends on many parameters,
including weather, material characteristics (aggregate propertieS, surface density,
moisture content, etc.), mixing and delivery methods, etc. As a result, the resuIting
SCC mix will likely deviate from the designed mix proportioning. The changes needed
to achieve the desired SCC fresh properties require experience and skilled personnel.
¯ While the response evaluated through simple pull-out tests is clearly related to bond
performance, its correlation to the complex phenomena occurring in the transfer zone
region and during development of strand capacity under flexural actions is
questionable. Nonetheless, pull-out tests are good methods to provide a baseline to
qualify the strand bonding characteristics and can serve as a relative performance
measure between normally consolidated concrete and an SCC mix under evaluation
¯ The authors believe that first slip loads from large-block pull-out tests are best related
to the adhesion (chemical bonding) mechanism whereas peak loads (and hence the
overall bond strength) best reflect both the adhesion and mechanical interlock
mechanisms, with a major contribution from the latter. Simple pull-out tests do not
simulate the Hoyer’s effect, which is a dominant mechanism for transfer lengths.
Hence, directly relating transfer lengths to the results of simple pull-out tests is
technically incorrect.
¯ The effect of SCC mix proportioning on bond related parameters was observed to be
more pronounced in lower quality strands. This raises particular concern on the use of
poor quality strand on elements built with SCC. Strand pre-qualification is thus of
outmost importance before its use with SCC.
¯ Proper design considerations should be taken when using SCC mixes with high fines as
they tend to have relatively longer development lengths than NCC.
227
Conclusions or recommendations in this report are the opinions of the authors. PCI assumes no responsibility for the interpretation or application of the information contained herein.
9.~ Conclusions
SCC holds great promise for improved construction efficiency and understanding the
performance compromises made when designingSCC will allow its safe use: This study on bond
parameters for prestressing strand on SCC precast/prestressed beams has provided meaningful
information on strand bond performance for thaee different compositions that bound the accepted
approaches to SCC mix proportioning. Pull-out tests of un-stressed strand allowed assessment of
direct bond strength while the bond-related design parameters of transfer and development length
were determined from laboratory-scale T-beams. In spite of some variance in the data obtained
for certain mix designs and the challenges posed by the two project phases, the following
conclusions can be reached based on relative and average, rather than absolute, performance:
¯ In general, the bond performance of strand in SCC was lower than for NCC, that is, on
average, SCC mix designs had lower peak pull-out strength (12%), longer transfer
lengths (35%) and marginally longer development lengths (3%).
¯ The pull-out bond strengths of un-stressed straight strand was noticeably different for
each SCC mix. In comparison with NCC, and averaging the results of both project
phases, SCC1 (high-fines SCC mix) had the lowest pull-out strength (25%) followed
by SCC2 (balanced SCC mix) with 15%. However, the pullout strength of SCC3 (high
coarse-aggregate SCC mix) was 2% higher than the NCC mix.
¯ Transfer lengths for all mixes were lower than the ACI code provisions. For the SCC
beams, transfer lengths were higher for the SCC1 and SCC3 mixes (39% and 36%)
bounding the SCC2 average (30%). Yet, with the exception of SCC3 from Phase-2,
transfer lengths for the SCC beams indicate a trend in which SCC1 led to a higher
transfer length followed by SCC2 and then SCC3. The causes behind the deviation of
the Phase-2 SCC3 data are unknown but the effect of additional VMA required to
stabilize this mix during cold-weather concreting is suspect.
¯ Development lengths for the SCC beams were, on average, only marginally longer
(3%) than for the NCC beams; and, with the exception of SCC1 in Phase-2, the average
development lengths for the SCC beams were within the ACI code recommendations.
In spite of the small differences between the estimated development length values, the
data seems to show a trend in which SCC1 led to a longer development length than
both SCC2 and SCC3.
228
Conclusions or recommendations in this report are the opinions of the authors. PCI assumes no responsibility for the interpretation or application of the information contained herein.
¯ The average flexural bond length values for the SCC beams followed a trend similar_ to
the peak pull-out strengths-values and this trend was more pronounced in Phase-1
results. On an average, flexural bond lengths of a!! SCC mixes were shorter than the
NCC mixby 16%.
¯ The trends of pull-out strengths and transfer, tlexural and development lengths indicate
that bond performance and the bond-related parameters were different for the project’s
three SCC mixes. Thus, the approach of setting bounds of performance on bond
parameters by considering limiting approaches to SCC mix proportioning was
successful.
¯ On average, the SCC1 mix (high-fines and low w/c ratio) had the lowest bond
performance, with lower pull-out strengths and longer transfer and development
lengths. At the other extreme, the SCC3 mix (high coarse aggregate and high w/c ratio)
displayed, on average, the best bond performance with the highest pull-out strengths
and shortest transfer and development lengths. As expected, the performance of the
balanced SCC mix, SCC2, was between the noted extreme SCC mix designs.
The unforeseen circumstance of having a strand of low bond quality during the first phase
of the project was overcome through a second phase with pre-qualified strand. While this
situation was an unfortunate setback, it also led to valuable lessons. While the detrimental effects
of poor quality strand on normal concrete mixes has been recognized, the data from this project
has shown that this negative effect can be even more detrimental on SCC. Thus, the importance
of strand pre-qualification when using SCC seems even larger.
In spite of the differences on bond performance of prestressing strand on SCC compared to
NCC, it has to be noted that the experimental methods to determine the behavior and parameters
are highly variable, with ample shortcomings, and several assumptions. Uncertainty also exists
on the code equations and the data on which they are based. Thus, code compliance cannot be
considered a strict borderline of acceptance; and the limited data from this project should be
considered with proper judgment. With this under consideration, the results of this study indicate
that strand bond performance on SCC is adequate. However, designers should be aware that the
conservative nature of the code is eroded due to the existing bond performance difference, that
this difference is most significant for high-fines SCC mixes and that strand quality can
considerably wear away the safety margins existing for conventional NCC mix designs.
229
Conclusions or recommendations in this report are the opinions of the authors. PCI assumes no responsibility for the interpretation or application of the information contained herein.
9.6 Recommendations
In spite of the relatively small scope of this project, the authors believe that the knowledge
gained was considerable enough to attempt some recommendations for precast producers and
design engineers as stated below.
~ ) For _Precast -producers
Strand prequalification when using SCC is strongly recommended. A much unfortunate
aspect of this researcbwas suffering from the negative effects of poor quality strand on
the first phase of this project. Nonetheless, and clearly serendipitious, this event seems
to have highlighted an important issue. The effect of SCC mix proportioning was more
pronounced in poor quality strand. For instance, development lengths were on average
60% more for SCC mixes with poor quality strand. At the same time, for similar mix
designs with a pre-qualified strand, the development lengths were found to be adequate
as per ACI recommendations. As a result, strand bond prequalification is strongly
recommended.
¯ Strand pull-out tests on SCC mixes are recommended. It should be emphasized that
strand qualification procedures should be made using the concrete mix specified for the
test method, as is done for the LBPT [35]. Nonetheless, it is recommended that similar
tests be performed on the SCC mix(es) under consideration as they can serve as
guidance on the effect that the particular SCC mix might have on bond performance
parameters. The results and approaches provided in this report have shown how pull-
out strengths can be compared with results from conventional concrete to obtain a
reasonable idea on the bond performance of the SCC mix.
¯ Successful SCC requires skilled personnel. Achieving the desired fresh properties for
SCC on site is dependent on many parameters, including weather, material
etc.), mixing and delivery process, etc. Consequently, the resulting SCC mix may
deviate significantly from the designed mix proportion. The changes needed to ensure a
successful SCC on the casting job thus require experienced and skilled personnel.
230
Conclusions or recommendations in this report are the opinions of the authors. PCI assumes no responsibility for the interpretation or application of the information contained herein.
B) For Design Engineers
¯ The reduced reliability of bond properties of SCC vs. NCC should be considered. The
study- has shown that the overall performance of SCC with respect to the ACI code
recommendations was adequate. Nevertheless, it was also observed the_SCC mixes had
lower bond strengths and longer transfer and. development lengths relative to the
reference NCC mix. Recent research suggests that this effect may be larger for top
strand [44]. This .suggests that the confidence and reliability in the design of structures
developed over decades of experience using NCC seems to be reduced when ~sing
SCC. The results from this study indicate that, on average, in order to obtain a level of
design reliability similar to NCC the designer would have to increase the embedment
lengths in SCC depending on the mix design. This is particularly true with SCC mix
designs with very high powder content. Design engineers should thus take this into
consideration when designing members to be built using SCC depending on the
criticality of bond parameters for a specific design.
9.7 Research Needs
"To those of us who have performed transfer and development research, it is apparent that
the number and variety of conclusions and subsequent recommendations can easily exceed
the number of research programs actually performed! "-Dale C. Buckner [9]
Determining bond characteristics of prestressing strand in concrete is a formidable
challenge that requires immersion in this type of research to fully appreciate it. The vast amount
of research that has been dedicated to study this phenomenon is evidence of the importance and
difficulty of the topic. The data scatter and the multiple, and sometimes conflicting, conclusions
from research efforts are not only testament of the difficulty of the problem but also reflect that
the issue is not fully understood. These statements apply to strand on "conventional" concrete
and the situation seems to be getting even more complex with the emergence of high-
performance concretes, such as SCC. While this study was of limited scope, the valuable lessons
learned allow extrapolating thoughts on furore research needs, which the authors humbly share
below.
231
Conclusions or recommendations in this report are the opinions of the authors. PCI assumes no responsibility for the interpretation or application of the information contained herein.
1) Pull-out tests are the most basic, simple and _logical means to assess the bond
characteristics of prestressing strand. However, when it comes to twisted strand for
prestressing applications, those aware of thc-issues will recognize the difficulty in
obtaining meaningful data for design purposes from these tests. This has lead to the_
: dewlopment of a diversity of tests offering trade-offs between simplicity and
’:accuracy." While these type of tests are very valuable, the engineering of high-
performance concretes through chemical, mineral and synthetic admixtures will surely
keep moving the target in the evaluation of bond since the available methods many not
capture the shifting hierarchy of bond phenomena with new concrete technology. This
seems to imply that pull-out testing activity and the development of new tests is bound
to continue with no end in sight. This indicates the need to develop fundamental
understanding of the bond mechanisms between concrete and strand that can be easily
generalized as new concrete technology is developed, together with sound, and again
fundamental, testing methods.
2) The concepts of transfer, flexural and development length are well accepted in
structural design. They are convenient and have been used routinely and without much
hesitation for a number of years. However, the emergence of new high-performance
concretes and processing methods of prestressing strands has brought about much
discussion of the actual bonding mechanisms that define these commonly used design
parameters. Opinions on the mechanisms of influence towards transfer and flexural
bond lengths are incredibly diverse and sometimes inconsistent. The diversity of
opinions grows when these design parameters are related to the definition of bond
strength and its different ways to assess it (as discussed in (1) above). The situation
gets even more complex when considering the experimental methods currently used to
assess these design anchorage lengths, which are time consuming, costly, and whose
reliability can be questioned. All of these arguments indicate that a fundamental
understanding of the mechanisms of bond and their relation to the design parameters of
transfer and flexural bond length needs to be further researched to bring fundamental
transparency to the physics behind the problem. Computational simulation can be a
valuable asset that can bring clarity to this issue, permitting fundamental understanding
232
Conclusions or recommendations in this report are the opinions of the authors. PCI assumes no responsibility for the interpretation or application of the information contained herein.
and controlled evaluation-of the many _parameters behind the anchorage lengths of
prestressing strand.
3) Self-consolidating-concrete is oNy an example of the explosion seen in the
development of engineered high-performance concrete. This growth has been fueled
by the incredibly fast developments,in chemistry, materials science and the emergence
of nanotechnology. It is thus very likely that concrete technology will continue to
evolve at an even higher pace in the years to come. Assessing the effects of every new
concrete by means of research programs as the one pursued in this project does not
seem to be an effective path. Thus, fundamental studies at the materials-science
(chemistry and structure of materials at the nano- and micro-scale) level should be
carried out to better understand how emerging modifications on cement chemistry,
chemical admixtures, mineral admixtures and synthetic admixtures affect the bond
performance of the resulting concretes. These studies should be made in a way that the
fundamental knowledge can be transferred or adapted to new developments on any of
these concrete constituents or concrete proportioning. Clearly, many of these additives
are developed as proprietary products from diverse industries and the chemistry behind
them is closely guarded. However, if standard and fundamental measures for these
additives are agreed upon they could be used by the companies developing the
products and shared with the engineering connnunity to then be used as the means to
determine the effect of the newly formulated additives on concrete. This would
liberate, or at least decrease, the burden of pull-out and beam tests as concrete
technology evolves, as it surely will. This research need is expressed here in general
for high-performance concrete with SCC as the motivating example.
4) Numerous research projects on evaluating the bond performance of strand on SCC
have been done over the world in the past 10 years. However, the mentioned scatter of
results and opinions as it relates to strand bond, its relation to the design parameters of
transfer and development length, and the methods to determine them seems to be even
wider when it comes to SCC. This should be no surprise as SCC simply refers to a
performance criteria of the concrete in its fresh state. While general approaches to SCC
mix proportioning are commonly agreed upon, SCC mixes can be very diverse and the
fundamental influence on bond behavior can be drastically different. This implies that
233
Conclusions or recommendations in this report are the opinions of the authors. PCI assumes no responsibility for the interpretation or application of the information contained herein.
it is very difficult, if not impossible, to compare the findings and conclusions from ..........
different research efforts. Thus, research on strand bond in SCC should be carefully
judged against the specific SCC mix design(s) used in the study and conclusions on the
performance of SCC (in general) when only one mix was _evaluated should be
considered carefully. Nonetheless, a valuable research task-would.be to compile the
available results on SCC bond behavior and categorize the outcomes and conclusions
as a function of the SCC mix or mixes used in the studies. Such an effort would make
it possible to compare results from different research efforts and could allow
conciliation of the available research into unifying findings and conclusions.
234
Conclusions or recommendations in this report are the opinions of the authors. PCI assumes no responsibility for the interpretation or application of the information contained herein.
APPENDIX A - Elastic ModuIus-Tests
The elastic modulus of the different concrete mixes used in this project was evaluated in
accordance with the ASTM C469,test methods, The stress-strain responses measured for the
different mixes are provided in this section
The elastic modulus tests were performed only for Phase-1 concrete mixes at the release
of prestress (approximately 3 days of age) and at 28 days. Elastic modulus tests were not
performed for all mixes due to technical and equipment problems.
In this section the elastic modulus plots at release (approximately 3 days) are followed by
the elastic modulus plots at 28 days. The plots for the various mixes are given in the following
order: NCCB, SCC1, SCC2A, SCC2B and SCC3 and for both transfer and 28 days of concrete
age.
At transfer, elastic modulus tests were performed only on NCCB, SCC2B and SCC3
mixes and are shown from Figure A- 1 to Figure A- 7. At 28 days, elastic modulus tests were
performed for all mixes except SCC2B mix. The plots of elastic modulus tests at 28 days are
shown from Figure A- 8 to Figure A- 16.
235
Conclusions or recommendations in this report are the opinions of the authors. PCI assumes no responsibility for the interpretation or application of the information contained herein.
42
36
30
24
18
12
6 lusIcu / Ec = 4035,652 psi
,P,a,,250
6000
55OO
1500
1000
500
0500 750 1000 1250 1500 1750 2000 2250 2500
5000
4500
4000
3500
3000
2500
2000
Compressive Strain ( micro strains )
Figure A- 1 Elastic Modulus Test - Transfer - NCCB - Testl
~ 36
~ 24
r~odulus6 Ec = 4,070,740 psi
= 2,8,067 M, pa
7OOO
6000
5000 "~.~
4000 ~
3000 .~
2000 ~=
1000
0250 500 750 1000 1250 1500 1750 2000 2250 2500
Compressive Strain ( micro strains )
Figure A- 2 Elastic Modulus Test - Transfer - NCCB - Test2
236
Conclusions or recommendations in this report are the opinions of the authors. PCI assumes no responsibility for the interpretation or application of the information contained herein.
Figure A- 4 Elastic Modulus Test - Transfer - SCC2B - Test2
237
Conclusions or recommendations in this report are the opinions of the authors. PCI assumes no responsibility for the interpretation or application of the information contained herein.
00
7OOO
6000
5000
4000
3000
2000
EcEc = Elastic Modulus lOOOEc = 4,653,828 psi
= ,32,087 ,Mpa
250 500 750 1000 1250 1500 1750 2000 2250
CompressiveStrain ( micro strains )
Figure A- 5 Elastic Modulus Test - Transfer - SCC2B - Test3
40
35
30
25
20
15
10
Ec = Elastic ModulusEc = 4,440,085 psi
= 30,613 Mpa
250 500 750 1000 1250 1500 1750 2000
Compressive Strain ( micro strains )
Figure A- 6 Elastic Modulus Test - Transfer - SCC3 - Test1
6000
500O
4000 J=
3000
2000
Eo
1000
o2250
238
Conclusions or recommendations in this report are the opinions of the authors. PCI assumes no responsibility for the interpretation or application of the information contained herein.
Figure A- 7 Elastic Modulus Test - Transfer - SCC3 - Test2
42
~ 24
"~- 18
/ = 24,445 Mpa
0 250 500
7000
6000
5000 "~.~
4000 ~
3000 .~
2000 ~"
1000
o750 lOOO 125o 15oo 175o 2000 2250 2500
Compressive Strain ( micro strains )
Figure A- 8 Elastic Modulus Test - 28 Days - NCCB - Testl
239
Conclusions or recommendations in this report are the opinions of the authors. PCI assumes no responsibility for the interpretation or application of the information contained herein.
48
~ 30
s6 Ec = 4,383,350 psi
= 3,0 22,2 ,MPa0
250 500 750 1000 1250 1500 1750 2000 2250 2500
Compressive Strain (micro strains)
Figure A- 9 Elastic Modulus Test - 28 Days - NCCB - Test2
8000
700O
6000
5000
4000
3000
2000
1000
66
6O
10000
250 500 750
9000
8OOO
7000
6000
5000
4000
3000
2000Ec = Elastic ModulusEc = 4,249,249 psi lOOO
29,300 Mpa0
1000 1250 1500 1750 2000 2250 2500 2750 3000 3250
Compressive Strain (micro strains)
Figure A- 10 Elastic Modulus Test - 28 Days - SCC1 - Testl
240
Conclusions or recommendations in this report are the opinions of the authors. PCI assumes no responsibility for the interpretation or application of the information contained herein.
Figure A- 11 Elastic Modulus Test - 28 Days - SCC1 - Test2
66
60
~ 54
.... 48
~ 42
"~ 36
~ 30.zm 24
E 18o~ 12
00
//
//
Ec
250 500 750
Ec = Elastic ModulusEc = 7,875,771 psi
= 54,302 Mpa
1000 1250 1500 1750 2000 2250
Compressive Strain ( micro strains )
Figure A- 12 Elastic Modulus Test - 28 Days - SCC2A - Testl
10000
9000
8000
7000
6000
5000
4000
3000
2000
1000
241
Conclusions or recommendations in this report are the opinions of the authors. PCI assumes no responsibility for the interpretation or application of the information contained herein.
Figure A- 13 Elastic Modulus Test - 28 Days - SCC2A - Test2
Eo
66
60
Ec Ec = Elastic ModulusEc = 5,155,837 psi
= 35,548 Mpa
10000
9000
8000
7000
6000
5000
4000
3000
2000
1000
0250 500 750 1000 1250 1500 1750 2000 2250 2500
CompressiveStrain ( micro strains )
Figure A- 14 Elastic Modulus Test - 28 Days - SCC2A - Test3
242
Conclusions or recommendations in this report are the opinions of the authors. PCI assumes no responsibility for the interpretation or application of the information contained herein.
66
6O9000
~ 54
48
~ 42 ~,I/,m 36I
~ 30
~24
~ 12 / Ec ; Elastic No6ulus
= 31,416 Mpa
0 250 500 750 1000 1250 1500 1750
~8000
7000
6000
5000
4000
3000
2000
1000
02000 2250
Compressive Strain ( micro strains )
Figure A- 15 Elastic Modulus Test - 28 Days - SCC3 - Testl
54
48
~ 42
u~ 36L
r~ 30
>� 24
or..1 12
250 500
8000
7000
6000
5000
4000
3000
2000
Ec = Elastic ModulusEc = 4,371,360 psi lOOO
= 30,140 Mpa0
750 1000 1250 1500 1750 2000 2250 2500 2750
Compressive Strain (micro strains)
Figure A- 16 Elastic Modulus Test - 28 Days - SCC3 - Test2
243
Conclusions or recommendations in this report are the opinions of the authors. PCI assumes no responsibility for the interpretation or application of the information contained herein.
APPENDIX B - Pull-out Test Response
The pull-out test was performed on the same strands as were used in the beam specimens.
This appendix contains the pull-out response (force vs. slip) of all mix designs for both phases°
Six strands were pulled out for each mix design. For Phase-l, pull-out test were performed at
release (3 days) and at 7 days. For Phase-2, pull-out tests were performed only at prestress
release (3 days).
in this appendix, plots are arranged according to phases, Phase-1 followed by Phase-2. In
each phase, the plots are arranged in the following order of mix designs: NCC, SCC1, SCC2 and
SCC3. In phasel, pull-out responses for 3days are followed by 7 days.
in Phase-1, pull-out responses for 3 days are provided from Figure B- 1 to Figure B- 15,
and pull-out responses for 7 days are provided from Figure B- 16 to Figure B- 30. Phase-2 pull-
out responses are provided from Figure B- 35 to Figure B- 58.
Also, comparisons of pull-out responses of different mixes from each phase is done by
selecting representative plots and are provided in Figure B- 31 to Figure B- 34 for Phase-1 and
Figure B- 59 to Figure B- 60 for Phase-2 respectively. Also, the summary of the pull-out forces
from both phases are provided from Table B- 1 to Table B- 6
244
Conclusions or recommendations in this report are the opinions of the authors. PCI assumes no responsibility for the interpretation or application of the information contained herein.
Conclusions or recommendations in this report are the opinions of the authors. PCI assumes no responsibility for the interpretation or application of the information contained herein.
Conclusions or recommendations in this report are the opinions of the authors. PCI assumes no responsibility for the interpretation or application of the information contained herein.
Conclusions or recommendations in this report are the opinions of the authors. PCI assumes no responsibility for the interpretation or application of the information contained herein.
Conclusions or recommendations in this report are the opinions of the authors. PCI assumes no responsibility for the interpretation or application of the information contained herein.
Conclusions or recommendations in this report are the opinions of the authors. PCI assumes no responsibility for the interpretation or application of the information contained herein.
Conclusions or recommendations in this report are the opinions of the authors. PCI assumes no responsibility for the interpretation or application of the information contained herein.
Conclusions or recommendations in this report are the opinions of the authors. PCI assumes no responsibility for the interpretation or application of the information contained herein.
Figure B- 16. Pull-out Response at 7 days - NCCB -Strand#4 - Phase- 1
252
Conclusions or recommendations in this report are the opinions of the authors. PCI assumes no responsibility for the interpretation or application of the information contained herein.
Figure B- 18. Pull-out Response at 7 days - NCCB -Strand#6 - Phase-1
253
Conclusions or recommendations in this report are the opinions of the authors. PCI assumes no responsibility for the interpretation or application of the information contained herein.
Figure B- 20. Pull-out Response at 7 days - SCC 1 -Strand#5 - Phase-1
10~o
96 ~
254
Conclusions or recommendations in this report are the opinions of the authors. PCI assumes no responsibility for the interpretation or application of the information contained herein.
Figure B- 22. Pull-out Response at 7 days - SCC2A -Strand#4 - Phase-1
27 ~
24 ~
21 =-018 ~
15 o,
12 ~L
255
Conclusions or recommendations in this report are the opinions of the authors. PCI assumes no responsibility for the interpretation or application of the information contained herein.
Figure B- 24. Pull-out Response at 7 days - SCC2A -Strand#6 - Phase-1
256
Conclusions or recommendations in this report are the opinions of the authors. PCI assumes no responsibility for the interpretation or application of the information contained herein.
--~-- Front Slip vs Pull-out Force~ Back Slip vs Pull-out Force
5 10 15 20 25 30 35 40 45 50 55 60 65 70 75
26
24
Strand Slip (mm)
22
Figure B- 26. Pull-out Response at 7 days - SCC2B -Strand#5 - Phase-1
2O
18 ~"
16 m
14 0
12 ~
257
Conclusions or recommendations in this report are the opinions of the authors. PCI assumes no responsibility for the interpretation or application of the information contained herein.
Figure B- 28. Pull-out Response at 7 days - SCC3 -Strand#4 - Phase-1
258
Conclusions or recommendations in this report are the opinions of the authors. PCI assumes no responsibility for the interpretation or application of the information contained herein.
Figure B- 30. Pull-out Response at 7 days - SCC3 -Strand#6 -Phase-1
259
Conclusions or recommendations in this report are the opinions of the authors. PCI assumes no responsibility for the interpretation or application of the information contained herein.
Figure B- 32. Comparison of Pull-out Test response - All Mixes- 7 Days - Phase 1
260
Conclusions or recommendations in this report are the opinions of the authors. PCI assumes no responsibility for the interpretation or application of the information contained herein.
kN kip kN kip66.43 14.93 2.11 0.4741.61 9.36 3.18 0.7132.59 I 7.33 I 5.53 I 1.2431.69 7.12 7.42 t.6729.41 I 6.61 I 0.40 I 0.09
14 16 18 20 22 24
Strand Slip (mm)
22
20
18
16._.._~
12 PoLL
10~
6
4
2
0
Figure B- 34. Comparison of First Slip Pull-out Test Response - All Mixes - 7Days -Phase-1
261
Conclusions or recommendations in this report are the opinions of the authors. PCI assumes no responsibility for the interpretation or application of the information contained herein.
Conclusions or recommendations in this report are the opinions of the authors. PCI assumes no responsibility for the interpretation or application of the information contained herein.
Conclusions or recommendations in this report are the opinions of the authors. PCI assumes no responsibility for the interpretation or application of the information contained herein.
Conclusions or recommendations in this report are the opinions of the authors. PCI assumes no responsibility for the interpretation or application of the information contained herein.
Conclusions or recommendations in this report are the opinions of the authors. PCI assumes no responsibility for the interpretation or application of the information contained herein.
Conclusions or recommendations in this report are the opinions of the authors. PCI assumes no responsibility for the interpretation or application of the information contained herein.
Conclusions or recommendations in this report are the opinions of the authors. PCI assumes no responsibility for the interpretation or application of the information contained herein.
Conclusions or recommendations in this report are the opinions of the authors. PCI assumes no responsibility for the interpretation or application of the information contained herein.
Conclusions or recommendations in this report are the opinions of the authors. PCI assumes no responsibility for the interpretation or application of the information contained herein.
Conclusions or recommendations in this report are the opinions of the authors. PCI assumes no responsibility for the interpretation or application of the information contained herein.
Conclusions or recommendations in this report are the opinions of the authors. PCI assumes no responsibility for the interpretation or application of the information contained herein.
Conclusions or recommendations in this report are the opinions of the authors. PCI assumes no responsibility for the interpretation or application of the information contained herein.
Conclusions or recommendations in this report are the opinions of the authors. PCI assumes no responsibility for the interpretation or application of the information contained herein.
Figure B- 60. Comparison of First Slip Pull-out Test Response- All Mixes - 3Days -Phase-2
274
Conclusions or recommendations in this report are the opinions of the authors. PCI assumes no responsibility for the interpretation or application of the information contained herein.
Table B- 1. Maximum (Peak) Pull-out Force - Phase-1 - Release (3 days)
Conclusions or recommendations in this report are the opinions of the authors. PCI assumes no responsibility for the interpretation or application of the information contained herein.
Table B- 3. Pull-out Forces at First Slip - Phase-1 - Release (3 days)
Conclusions or recommendations in this report are the opinions of the authors. PCI assumes no responsibility for the interpretation or application of the information contained herein.
Table B- 6. Pull-out Forces at First Slip - Phase-2 -Release (3 days)
Mix Maximum Pull-out Force, kN (kips)
Strand# 1 ~ 3 4 5 6
62.27 82.96 67.16NCC
(14.00) (18.65) (15.10)63.25 64.41 54.89
SCC1(t4.22) (14.48) (12.34)
56.93SCC2 rda rda
(12.80)
SCC3
72.50(16.30)56.93
(12.80)74.73
(16.80)66.72
(15.00)57.60
(12.95)
68.05
(15.30)53.38
(12.00)46.70
(10.50)63.16
(14.20)
84.96
(19.10)69.39
(15.60)72.50
(16.30)70.19
(15.78)ll/a
Average
72.99
(16.41)60.36(13.57)
62.72
(14.10)64.42
(14.48)
StandardDeviation
9.12(2.05)6.27
(1.41)13.29(2.99)5.37
(1.21)
277
Conclusions or recommendations in this report are the opinions of the authors. PCI assumes no responsibility for the interpretation or application of the information contained herein.
APPENDIX C - Transfer Length - Concrete Strain Profiles
The transfer length measurements were done using two methods: a) concrete strain
profiles (95% average maximum strain method) and b) draw-in measurements. This section
inc!udes the plots for concrete strain profiles for each test specimen for both the phases.
The concrete strain profiles were measured on both the sides of the beam units. Two trials
of readings were taken on- each side. A total of 8 plots were obtained for each beam. Only the
average of the eight plots (each beam) is provided here. In Phase-l, two beams per mix type
were cast. The concrete strain profiles computed as an average of 16 profiles per mix type (both
beams) were provided in Chapter 7. The concrete strain profiles for each beam (average of 8) for
various mix types of Phase-1 are given in this section in the following order: NCCB, SCC1,
SCC2A, SCC2B and SCC3. For Phase-2, only one beam per mix type was cast and hence a set
of 8 concrete strain profiles was obtained. The concrete profiles obtained as an average of these 8
sets of data are provided following the Phase-1 plots.
Table C- 1 shows the values of transfer length for all mixes obtained frotn each of the 16
sets of data in Phase-1. Similarly, Table C- 2shows the values of transfer lengths obtained from
each of the 8 concrete strain profiles for Phase-2. As discussed in chapter 7, the smoothest strain
profile is obtained when averaging all the sets of data. At the same time, it should be noted that
the concrete strain profile method is quite time consuming and involves many unforced errors
both instrumental and human. Hence, the strain profiles obtained from the average of all sets of
data may give a smooth profile but may be skewed due to individual profiles that may be bad.
Hence, individual strain plots were obtained and the numerical average of transfer lengths
obtained from each of the plots was taken.
SCC2A of Phase-1 was the first mix on which these concrete strain measurements were
performed. This was used as a training set for the user. Hence, for this particular mix, the
individual concrete strain profiles did not give valuable information, but the average of 16 sets of
data provided a reasonable profile (Figure 7-10) and a transfer length value was obtained as
given in Table C- 1. Similarly, some of the values in Table C- 1 are labeled "n!a" indicating that
the particular data set did not provide a good concrete profile and hence no transfer length value
was determined.
278
Conclusions or recommendations in this report are the opinions of the authors. PCI assumes no responsibility for the interpretation or application of the information contained herein.
It was observed that value of transfer length obtained from a single .profile, with the
average of the complete data (16 sets in Phase-1 and 8 ~ts in Phase-2) was reasonably close to
the numerical average of transfer lengths obtained from the individual concrete strain profiles
from each set of data, The latter has been used as the true output in this project as it also provides
the value of standard deviation for each of the mixes and removes the effects of bad data points.
279
Conclusions or recommendations in this report are the opinions of the authors. PCI assumes no responsibility for the interpretation or application of the information contained herein.
Distance from-end of the beam (in.)0 5 10 15 _20 25 30 35 40 45 50 55 60
Conclusions or recommendations in this report are the opinions of the authors. PCI assumes no responsibility for the interpretation or application of the information contained herein.
_o500
450
400
350
300
250
200
15o
lOO
50
Distance from end of the beam (in.)5 ~, 0 15 20 25 30 35 40 45 50 55 60
i ......... .......... i ............ ..........
150 300 450 600 750 900 1050 1200 1350 1500Distance from end of the beam (mm)
Conclusions or recommendations in this report are the opinions of the authors. PCI assumes no responsibility for the interpretation or application of the information contained herein.
550
500
450
400
350
300
250
200
150
100
50
00
Distance from end of the beam (in.)5 lO 15 20 25 30 35 40 45 50 55 60
.......... _
y95% AMS
150 300 450 600 750 900 1050 1200 1350 1500Distance from end of the beam (mm)
Conclusions or recommendations in this report are the opinions of the authors. PCI assumes no responsibility for the interpretation or application of the information contained herein.
o5oo
450
400
350
3oo
250
15o
lOO
50
00
Distance from end of the beam (in.)5 10 15 20 25 30 35 40 45 50 55 60
Conclusions or recommendations in this report are the opinions of the authors. PCI assumes no responsibility for the interpretation or application of the information contained herein.
5OO
~- 400
~. 300
~ 200
O 100
00
Distance from end of the beam (in.)0 5 10 15 20 25 30 35 40 45 50 55 60
= 769.6 mm
(30.3 in.)
95% AMS
150 300 450 600 750 900 1050 1200 1350 1500Distance from end of the beam (mm)
Conclusions or recommendations in this report are the opinions of the authors. PCI assumes no responsibility for the interpretation or application of the information contained herein.
Distance from end of the beam (in.)0 5 10 15 20 25 30 35 40 45 50 55 60
Conclusions or recommendations in this report are the opinions of the authors. PCI assumes no responsibility for the interpretation or application of the information contained herein.
Distance from end of the beam (in.)0 5 10 15 20 25 30 35 40 45 50 55 60
Conclusions or recommendations in this report are the opinions of the authors. PCI assumes no responsibility for the interpretation or application of the information contained herein.
Table C- 1. Transfer Length from Concrete Strain Profiles - Phase-1.
Data set #
1
2
3
4
5
6
7
8
9
10
11
12
13
14
15
16
Data set ID
B1-SI£T1-EI
B 1-S1-T1-E2
B 1-S1-T2-E1
B 1 -S 1-T2-E2
B1-S2-T1-E1
B 1-S2-T1-E2
B 1-S2-T2-E1
B 1-S2-T2-E2
B2-S1-T1-E1
B2-S1-T1-E2
B2-S 1-T2-E1
B2- S 1-T2-E2
B2-S2-T1-E1
B2-S2-T1-E2
B2-S2-T2-E1
B2-S2-T2-E2
Average Beaml (1-8)
Average Beaml (9-16)
Standard Deviation Beaml (1-8)
Standard Deviation Beaml (9-16)
NCCB
21.80
19.80
20.00
16.50
15.00
17.60
i7.60
16.40
19.40
23.60
24.50
31.00
21.00
19.60
27.00
17.65
18.09
22.97
2.26
4.47
SCC1
29.00
32.00
27.00
35.65
26.00
29.00
26.20
31.00
33.00
29.00
35.00
27.50
23.70
23.80
26.00
27.20
29.48
28.15
3.30
4.07
SCC2A
~a
rda
rda
rda
n/a
n/a
I~a
rda
rda
rda
rda
rda
rda
rda
rda
28.00
33.75
n/a
n!a
SCC2B
24.50
32.50
25.7040,00
33.50
27.20
32.10
32.70
25.50
32.00
37.00
40.50
27.00
28.70
28.70
37.40
31.03
32.10
5.05
5.55
SCC3
41.00
31.00
35.00
27.00
35.50
30.05
34.50
17.60
27.60
27.50
27.80
35.00
26.50
33.00
25.60
25.70
31.46
28.59
7.00
3.48
Average ALL (1-16) 20.53 28.82 30.88 31.56 30.02
Standard Deviation ALL (1-16) 4.25 3.64 4.07 5.15 5.54
Single Plot (16 sets) J 19.60 29.00 27.00 32.00 31.00I
287
Conclusions or recommendations in this report are the opinions of the authors. PCI assumes no responsibility for the interpretation or application of the information contained herein.
Table C- 2. Transfer Length from Concrete Strain Profiles - Phase-2.
Data set #
1
2
3
4
5
6
7
8
Average (1-8)
Data set ID
E1-S1-T1
E1-SI:T2
E1-S2-T1
E1-S2-T2
E2-S1-T1
E2-S1-T2
E2-S2-T1
E2-S2-T2
Standard Deviation (1-8)
NCC
15.00
15.00
15.60
17.60
rda
18.80
n/a
16.40
1.71
SCC1
!9.60
rda
23.40
n/a
23.00
24.00
18.80
25.70
22.42
2.67
SCC2
~/a
23.00
25.70
n/a
25.00
25.90
23.50
24.30
24.57
1.18
SCC3
23.00
27.25
~a
27.00
26.00
25.00
25.50
21.00
24.96
2.25
Single Plot (8 sets) 17.00 25.40 25.20 27.16
288
Conclusions or recommendations in this report are the opinions of the authors. PCI assumes no responsibility for the interpretation or application of the information contained herein.
APPENDIXD - Development Length - Flexural Test Response
Development length for the prestressing strands was measured by performing flexural
tests on the beam units. For each test specimen two development length testa, (one per beam end)
were obtained. Thus, for Phase-1, a total of four development length tests were performed for
each concrete mix type, while only two tests per mix type were performed for Phase-2 test traits.
This section provides the moment-displacement response at the critical section obtained from
these development length~tests. The nominal moment (Mn) that can be developed in the cross
section was calculated using ACI 318 equations, in the following plots, ACI nominal moment
capacity is shown as a horizontal line. If the test response intersects with this line, then the
moment capacity for that particular embedment length was achieved and the embedment length
was considered to be sufficient for that particular test unit.
In this appendix, the development length test responses for Phase-1 test units are
provided first followed by Phase-2 test units. The plots for Phasse- 1 test units are provided in the
following order of mix types: NCCB, SCC1, SCC2A, SCC2B, and SCC3. For each mix type, the
tests responses are provided in the following order: Unitl-EndA, Unit-l-EndB, Unit2-EndA and
Unit2-EndB. All development test responses of Phase-1 are provided from Figure D- 1 to Figure
D-16.
Similarly, for Phase-2, the plots are provided in the following order of mix type: NCC,
SCC1, SCC3 and SCC3. Since, there was only one test unit per mix type, the test responses at
EndA are followed by test response on End B. All development test responses of Phase-2 are
provided from Figure D- 17 to Figure D- 24.
289
Conclusions or recommendations in this report are the opinions of the authors. PCI assumes no responsibility for the interpretation or application of the information contained herein.
Mom
ent (
kN-m
)M
omen
t (kN
-m)
. ~
~ _
, ~
Mom
ent (
kip-
ft)M
omen
t (ki
p-~
Conclusions or recommendations in this report are the opinions of the authors. PCI assumes no responsibility for the interpretation or application of the information contained herein.
120
110
100
90
o 50
40
2~
Displacement at the section (in.)1.5 2.0 2.5 3.0 3.5 4.0 4.5 5.0 5.50.0 0.5 1.0 6.0 6.5
~ _kip-ft)
Ld~i )M
0 15 30 45 60 75 90 105 t20 135 150 165 180Displacement at the section (mm)
7.0 7.5
90
80
70
60 ~,
50 -~
40 Eo
30
20
10
Figure D - 3. -Moment vs. Displacement- NCCB-P 1-2 -A - La = 103.50 in
o
12o
11o
lOO
3O
2O
lO
Displacement at the section (in.)1 2 3 4 5 6 7 8 9 10
90
0 0-0 25 50 75 100 125 150 175 200 225 250
Displacement atthe section (mm)
8O
70
20
10
Figure D- 4. Moment vs. Displacement- NCCB-P1-2-B - La =93.50 in
291
Conclusions or recommendations in this report are the opinions of the authors. PCI assumes no responsibility for the interpretation or application of the information contained herein.
120
110
100
90
~’, 80Z 70
~- 60
E 50O
4O
30
20
10
Displacement at the section (in.)0 1 2 3 4 5 6 7 8 9 10
Mn -ACI= 107.49 kN-m (79.28 k-ft)
Slip~
i Ti: "7--Lda~’,
! i-Lda~
¯ Slip @ Mn-ACI = 7.88 mm 10.31 in.)
90
80
70
60 ~,
50 ~.
40 E
20
10
30 60 90 120 150 180 210 240 270 300Displacement at the section (mm)
Figure D- 5. Moment vs. Displacement- SCC1-PI-I-B - La =72.38 in
120
110
100
90
~.~70
~ 6oE0 50
40
20
10
Displacement at the section (in.)0 1 2 3 4 5 6 7 8 9 10 11 12
’~ANo Slip Observed
90
80
70
30
20
10
.0 30 60 90 120 150 180 210 240 270 300Displacement at the section (mm)
Figure D- 6. Moment vs. Displacement- SCC1-PI-1-B - La =137.75 in
292
Conclusions or recommendations in this report are the opinions of the authors. PCI assumes no responsibility for the interpretation or application of the information contained herein.
Displacement at the section (in.)1 2 3 4 5 6 7
110 ...........
100
~Lda--" ,M
100 I No Slip Observed
0 30 60 90 120 150 180 210 240 270 300Displace~nt at the section(mm)
90
80
70
Figure D- 7. Moment vs. Displacement- SCC1-P1-2-A - La =122.00 in
Displacement at the section (in.)0 1 2 3 4 5 6 7 8 9 10 11 12
0 30 60 90 120 150 180 210 240 270 300Displacement at the section (mm)
100
90
8O
7o
Figure D- 8. Moment vs. Displacement- SCC1-P1-2-B - La =118.50 in
293
Conclusions or recommendations in this report are the opinions of the authors. PCI assumes no responsibility for the interpretation or application of the information contained herein.
Displacement at the section (in.)0.0 0,5 1.0 1.5 2.0 2.5 3.0 3.5 4,0 4.5 5.0 5,5 6,0 6.5
120
110
lOO
9o
~8oz~7o~" 60
40
30
2O
lO
o
Mn-ACI = 107.51 kN-m (79.29 k-ft)
Slip Onset
P/2 P/2
¯ Slip @ Mn-ACI = 15.50 mm (0.61 in.)
o15 30 45 60 75 90 lO5 12o 135 15o 165
Displacement at the section (mm)
9O
8O
70
40 Eo
3O
2O
10
Figure D- 9. Moment vs. Displacement- SCC2B-PI-I-A - La =70.50 in
Displacement at the section (in.)3 4 5 6 7 8 9 10 11 12
120
110
100
90E, 80
z~7o
~ 60
o 50
40
3o
Slip Onset
Mn-ACI = 107.51 kN-m (79.29 k-ft)
P/2 P/2
, M
¯ Slip @.Mn-ACl ; 3,56 turn (0.14 in.)
2-5 50 75 100 125 150 175 200 225 250 275Displacement at the section (mm)
300
9O
8O
7O
60 ~.
50 -~
40 E
3o
20
10
Figure D- 10. Moment vs. Displacement- SCC2B-P 1-1-B - La = 102.75 in
294
Conclusions or recommendations in this report are the opinions of the authors. PCI assumes no responsibility for the interpretation or application of the information contained herein.
120
110
100
~...90
4O
2O
Displacement at the section (in.)0 1 2 3 4 5 6 7 8 9
0 25 50 75 100 125 150 175 200 225Displacement at the section (mm)
90
80
70
Figure D- 11. Moment vs. Displacement- SCC2B-PI-2-A -La =126.75 in
140
130
120
11o
~oo,fi 9o
40
30
2010
0
Displacement at the section (in.)0 1 2 3 4 5 6 7 8 9 10
I P/2 P./2
/ ...... ...............
25 50 75 100 t25 150 175 200 225 250
Displacement at the section (mm)
100
90
8O
50 ~
4o ~3O
20
10
0
Figure D- 12. Moment vs. Displacement- SCC2B-P 1~2-B - La = 124.50 in
295
Conclusions or recommendations in this report are the opinions of the authors. PCI assumes no responsibility for the interpretation or application of the information contained herein.
20 40 60 80 100 !20 140 160Displacement at the section (mm)
9O
8O
70
60 ~’
50 ~
4O Eo
30
20
10
Figure D- 13. Moment vs. Displacement- SCC3-PI-I-A -La =58.50 in
Displacement at the section (in.)2 3 4 5 6 7 8 9 10
120
110
100
9O
,~ ao
40
/Slip Onset
Mn-ACI = 107.34 kN-m (79.17 k-ft)
P/2 P12
i ’O~Lda~’,
i
t A
Mn-ACI achieved before Slip Onset
0 25 50 75 100: 125 150 I75 200 225 250Displacement at the section (mm)
90
80
70
60 ~’
50 -~
40 Eo
3O
20
10
Figure D- 14. Moment vs. Displacement- SCC3-PI-I-B- La =97.75 in
296
Conclusions or recommendations in this report are the opinions of the authors. PCI assumes no responsibility for the interpretation or application of the information contained herein.
Displacement at the section (in.)2 3 4 5 6 7 8 9 10
120
110
100
90,~ 8o.-~ 70
O 50
40
20
-/ Mn-ACl = 107.34 kN-m (79.17 k-if)
Slip Onset bP/2 P/2
~Lda~i ~
Mn-ACI achieved before Slip Onset
25 50 75 100 125 150 175 200 225 250Displacement at the section (mm)
90
80
7O
40 EO
30
20
10
Figure D- 15. Moment vs. Displacement- SCC3-P1-2-A - La =106.50 in
Displacement at the section (in.)0 1 2 3 4 5 6 7 8 9 10 11
120
110
100/
p~2~ i2 ShpOnset"........ ill/
10 Mn-ACI achieved before Slip Onset
00 25 50 75 100 125 150 175 200 225 250 275
Displacement at the section (mm)
90
80
70
60 ~
50 ~
20
Fig~e D- 16. Moment vs. Displacement- SCC3-P1-2-B - La =103.00 in
297
Conclusions or recommendations in this report are the opinions of the authors. PCI assumes no responsibility for the interpretation or application of the information contained herein.
120
11o
lOO
9O
E, 80~7o~ 60o 50
30
20
Displacement at the section (in.)2 3 4 5
lO
o
Mn-ACI = 108,71 kN-m (80.18 k-ft)
P/2 P/2
~Lda~i ],V[, )))
_A
25 50 75 100 125 150 175Displacement at the section (mm)
9O
80
7O
40 Eo
30
2o
lO
Figure D- 17. Moment vs. Displacement- NCC-P2-1-A - La =67.00 in
120
110
100
90
~ 80~7o
40
3O
2O
-I0
Displacement at the section (in.)0 1 2 3 4 5 6
Mn-ACI = 108.71 kN-m ~0_.l_8_k-ft)
f . !;
/
90
0- 00 25 50 75 100 125 150 175
Displacement at the section (mm)
80
70
30
20
10
Figure D- 18, Moment vs. Displacement- NCC-P2-1-B - La =60.00 in
298
Conclusions or recommendations in this report are the opinions of the authors. PCI assumes no responsibility for the interpretation or application of the information contained herein.
120
110
100
90
~- 60
o 50
~ 40
00 25 50 75 100 125 150 175
Displacement at the section (mm)
Figure D- 19. Moment vs. Displacement- SCC1-P2-1-A - La =75.50 in
90
80
70
50 ~
20
Displacement at the section (in.)0.0 0.5 1.0 1.5 2.0 2.5 3.0 3.5 4.0
120
110
lOO
90
,~ ao
40
Mn-ACI = 107.34 kN-m (79.17 k-ft)
Slip OnsetP/2 P/2
0 10 20 30 40 50 60 70 80 -90 100Displacement at the section (mm)
90
80
7O
60 ~.
50 -~
40 EO
3O
10
Figure D- 20. Moment vs. Displacement- SCC I-P2-1-B -La =68.00 in
299
Conclusions or recommendations in this report are the opinions of the authors. PCI assumes no responsibility for the interpretation or application of the information contained herein.
120
110
100
90
~ 8oZ~7o
0 5O
4O
30
20
lO
o
Displacement at the section (in.)0.0 0.5 1.0 1.5 2.0 2.5 3.0 3.5 4.0 4.5 5.0 5.5 6.0 6.5 7.0
Mn-ACI = 108.71 kN-m (80.18 k-ft).
25 50 75 100 125 150 175Displacement at the section (mm)
90
80
70
60 ~.
50 -~
40 Eo
30
2O
10
Figure D- 21. Moment vs. Displacement- SCC2-P2-1-A -La =66.00 in
Displacement at the section (in.)2 3 4 5 6
120
110
100
9O
,fi 80~ 70
411
30
211
Mn-ACI = 109.43 kN-m (80.71 k-ft)
P/2
,,, 2M
25 50 75 100 125 150 175Displacement at the section (mm)
90
80
70
60 ~’
50 -,~
40 Eo
30
20
10
020O
Figure D- 22. Moment vs. Displacement- SCC2-P2-1-B -La =66.50 in
300
Conclusions or recommendations in this report are the opinions of the authors. PCI assumes no responsibility for the interpretation or application of the information contained herein.
Mom
ent (
KN
-m)
Mom
ent (
kip-
ft)M
omen
t (ki
p-ft)
Conclusions or recommendations in this report are the opinions of the authors. PCI assumes no responsibility for the interpretation or application of the information contained herein.
REFERENCES
[1]_ Abrishami, H.H., and Mitchell, D. (1993, June), "Bond Characteristics of PretensionedStrand," ACIMaterials Journal, 90(3), 228-235°
[2] American Association of State Highway and Transportation Officials (AASHTO),AASHTO LRFD Bridge Design Specifications, Second Edition, 1998.
[3] American Concrete Institute (ACI), Building Code Requirements for Structural Concreteand Commentary, ACI 318-08, Farmington Hills, Michigan, 2008.
[4] Antoine E Namaan. (1982) "Prestressed Concrete Analysis and Design Fundamentals."
[5] Attiogbe, E., See, H., and Daczko J., "Engineering Properties of Self-ConsolidatingConcrete," Proceedings of the First North American Conference on the Design and Use ofSelf-Consolidating Concrete, Evanston, IL, November 2002.
[6] Balazs,G.L. (1993). "Transfer Lengths of prestressing strands as a function of draw-in andinitial prestress." PCIJournal, 38(2) 86-93.
[7] Barker, R.M. and Puckett, J.A. (1997). Design of Highway Bridges Based on AASHTOLRFD Bridge Design Specifications, John Wiley & Sons, Inc. New York, NY.
[8] Barnes, R.W., Burns, N.H., & Kreger, M.E. (1999, December). "Development Length of0.6 inch prestressing strand in standard I shaped pretensioned concrete beams." ResearchReport 1388-1. Center of Transportation Research, Bureau of Engineering Research,University of Texas at Austin,
[9] Buckner, C.D., (1995, April) "A Review of Strand Development Length for PretensionedConcrete Members," PCI Journal, 40(2), 84-105.
[I0] Burguefio, R. and Bendert, D.A. (2007) "Structural Behavior and Field-Monitoring of SCCPrestressed Box Beams for Demonstration Bridge," American Concrete Institute, SP-247-6, pp. 67-76
[ 11 ] Byung Hwan Oh., and Eui Sung Kim., (2000, December). "Realistic Evaluation of TransferLengths in Pretensioned. Prestressed Concrete Members." ACI Structural Journal, 97(6).821-830.
[12] Choulli, Y., Mari, A.R., and Cladera, A. (2008). "Shear Behavior of full-scale Prestressed Ibeams made with Self Compacting Concrete," Materials and Structures, 41:131-141.
302
Conclusions or recommendations in this report are the opinions of the authors. PCI assumes no responsibility for the interpretation or application of the information contained herein.
[13] Cousins, T.E., Badeaux, M.H., and Mostafa, S. (1992, February), "Proposed Test forDetermining Bond Characteristics of Prestressing Strand," PCI Journal, 66-73
[14] Cousins,T., Johnston, D., and Zia,P., (July, 1990) "Transfer and Development Length ofEpoxy Coated Prestressing Strand," PCIJournal, 35(4) 92-103.
[15] Daczko, J., and Constantiner, D. (2002, November), ~Not All Applications are CreatedEqual; Designing and Selecting the Appropriate SCC Mixture," Proceedings of the FirstNorth American Conference on the Design and Use of Self-Consolidating Concrete,Evanston, IL.
r16] Daczko, J., and Kurtz, M.A. (2001, October), "Development of High-Volume CoarseAggregate Self-Compacting Concrete." Proceedings of the Second InternationalSymposium on Self-Compacting Concrete, Tokyo, Japan.
[ 17] Dallas R. Rose., Bruce W. Russell. (1997, August). "Investigation of standardized tests tomeasure the bond performance of prestressing strand." PCIJournal, 42 (4), 56-80.
[18] De Almeida Filho, F.M., E1 Debs, M.K., and E1 Debs, H.C.A.L (2008). "Bond-slipbehavior of self compacting concrete and vibrated concrete using pull-out and beam tests,"Materials and Structures, 41:1073-1089.
[19] Deatherage, J.H., Burdette, E.G., and Chew, C.K. (1994, February), "Development Lengthand Lateral Spacing Requirements of Prestressing Strand for Prestressed Concrete BridgeGirders," PCIJournal, 39(1), 70-83.
[20] Domone, P.L. (2007), "A review of the hardened mechanical properties of self-compactingconcrete," Cement and Concrete Composites, 29:1~12.
[21] Evan C. Bentz., Michael P.Collins, (2000). "Response-2000" Version 1.0.5- Rei1{fiorcedConcrete sectional analysis using the mod{[ied compression )qeld theo~_ .
[22] Girgis, A.F.M., and Tuan, C.Y. (2005), "Bond Strength and Transfer Length ofPretensioned Bridge Girders with Self Consolidating Concrete, PClJournal, 50(6) 72-87.
[23] Gross, P. Shawn and Ned H.Burns. (1995, June). "Transfer and Development Length of15.2mm (0.6 in.) diameter prestressing strand in high performance concrete: Results ofHoblitzell-Buckner Beam tests." Research report 580 -2. Center of TransportationResearch, Bureau of Engineering Research, University of Texas at Austin.
[24] Hanson, N.W. and Kaar, P.H. (1959) "Flexural Bond Tests of Pretensioned PrestressedBeams," ACIJournal, 55(7), 783-803.
[25] Hassan, A.A.A., Hossain, K.M.A., and Lachemi, M (2008). "Behavior of full-scale Self-Consolidating Concrete Beams in Shear," Cement and Concrete Composites, 30(6) 72-87.
303
Conclusions or recommendations in this report are the opinions of the authors. PCI assumes no responsibility for the interpretation or application of the information contained herein.
[26] Hegger, J., Biilte, S., arid Kremmer, B. (2007), "Pretensioning in Self ConsolidatingConcrete," PCI Journal, 52(4): 34-42.
[27] Kaar, P.It., LaFraugh, R.W., and Mass, M.A. (!963, October) "Influence of ConcreteStrength on Strand Transfer Length," PCIJournal, 47-67.
[28] Khayat, K.H,. and Daczko, J.(2002, November) "The Holistic Approach to Se!f-Consolidating Concrete," Proceedings of the First North American Conference on theDesign and Use of Self-Consolidating Concrete, Evanston, IL,
[29] Khayat, K.H. (1999, June) "Workability, Testing, and Performance of Self-ConsolidatingConcrete," A CIMaterials Journal, 96(3), 346-353.
[30] Khayat, K.H., K. Manai and A.Trudel.(1996, December) "In Situ Mechanical Properties ofWall Elements cast using Self Consolidating Concrete". ACI Materials Journal 94(6).491-500.
[31] Khayat, K.H., Patrick Paultre., and Stephan Tremblay. (2001, October), "StructuralPerformance and In-Place properties of Self-Consolidating Concrete used for castinghighly reinforced columns". ACIMaterials Journal, 98(5), 371 - 378.
[32] Larson, K.H., Peterman, R.J., and Esmaeily, A. (2007). "Bond characteristics of SelfConsolidating Concrete for Prestressed Bridge Girders," PCI Journal 52(4):44-57.
[33] Leonhardt, F. (1964) "Prestressed Concrete - Design and Construction", Wilhem Ernst &Sohn, Berlin.
[34] Logan, D.R., (1996, April) Discussion of "A Review of Strand Development Length forPretensioned Concrete Members." PCI Journal, 41 (2), 112-116.
[35] Logan, D.R. (1997, April). "Acceptance criteria for bond quality of strand for pretensionedprestressed concrete applications." PCIJournal, 42(2), 52-90.
[36] Logan, D.R. (2005, March) Personal Communication.
[37] Marti-Vargas, J.R., Serna-Ros, P., Arbelfiez, C.A., and Rigueira-Victor, J.W., (2006),"Bond behavior of self-compacting concrete in transmission and anchorage," Materiales deConstrucci6n, 56(284):27-42.
[38] Martin, L.D., and Scott, N.L., (1976) "Development of Prestressing Strand in PrestensionedMembers," ACIJournal, 73(8) 453-456.
[39] Mitchell, D., Cook, W.D., Khan, A.A., and Tham, T., (May 1993) "Influence of HighStrength Concrete on Transfer and Development Length of Pretensioning Strand," PCIJournal, 38(3) 52-66.
3O4
Conclusions or recommendations in this report are the opinions of the authors. PCI assumes no responsibility for the interpretation or application of the information contained herein.
[40] Naito, C.J., Parent, G., and Brunt, G (2006). "Performance of Bulb-Tee .Girders made with._Self-Consolidating Concrete," PCIJournal, 51 (6) 72-85:
[41] Nan Su, Kung-Chung Hsu, His-Wen Chai.(2001) "A simple mix design method for SelfCompacting Concrete," Cement and Concrete Research, V.31, 1799-1807.
[43] Persson, B., (2001) "A Comparison between Mechanical Properties of Self-CompactingConcrete and the Corresponding Properties of Normal Concrete," Cement & ConcreteResearch, 3!, 193-198
[44] Peterman, R.J., (2007). "The Effects of As-Cast Depth and Concrete Fluidity on StrandBond," PCIJournal, 52(3):72-101.
[45] Petersson, O., Gibbs, J., and Bartos, P.(2002, November) "Testing-SCC," Proceedings ofthe First North American Conference on the Design and Use of Self-ConsolidatingConcrete, Evanston, IL.
[46] Precast/Prestressed Concrete Institute (PCI), "Interim Guidelines for the use of Self-Consolidating Concrete in Precast/Prestressed Concrete Institute Member Plants, " TR-6-03, Chicago, Illinois, April 2003.
[47] Rose, D.R., and Russel, B.W. (1997, August) "Investigation of Standardized Tests toMeasure the Bond Performance of Prestressing Strand," PCIJournal, 42 (4), 56-80.
[48] Russell, B.W., and Burns, N.H. (1997, May) "Measurement of Transfer Lengths onPretensioned Concrete Elements," Journal of Structural Engineering, 123 (5), 541-549.
[49] Russell, B.W., and Burns, N.H., (1996, April) Discussion of "A Review of StrandDevelopment Length for Pretensioned Concrete Members," PCIJournal, 41 (2), 116-119.
[50] Russell, B.W., and Burns, N.H., (1993, January). "Design Guidelines for Transfer,Development and Debonding of large Diameter Seven wire strands in pretensionedconcrete girders." Research Report 1210-5F. Center of Transportation Research, Bureau ofEngineering Research, University of Texas at Austin.
[51] Schindler, A.K, Barnes, R.W., Roberts, J.B., and Rodriguez, S., (2006). "Properties of Self-Consolidating Concrete (SCC) for use in Prestressed Applications," 85th Annual Meetingof the Transportation Research Board.
[52] Shahawy, M. (2001, August), "A Critical Evaluation of the AASHTO Provisions for StrandDevelopment Length of Prestressed Concrete Members," PCIJournal, 46(4), 94-117.
305
Conclusions or recommendations in this report are the opinions of the authors. PCI assumes no responsibility for the interpretation or application of the information contained herein.
[54] Thatcher, D.B., Heffington, J.A, Kolozs, R.T., Sylva III, G.S., Breen, J.E., and Burns,N.H.(2002, January). "Structural Lightweight concrete prestressed girgers and panels."Research.report 1852-1 Center _for transportation research. Bureau of EngineeringResearch, University of Texas at Austin.
[55] Transportation Research Board, "Research Problem Statements," A2C03 Committee onConcrete Bridges, Group 2 - Design and Construction of Transportation Facilities,Technical Activities Div.
[56] Vachon, M. (2002, July) "ASTM Puts Self-Consolidating Concrete to the Test," ASTMStandardization News, July 2002, url: http://astm.org/cgi-bin/SoftCart.exe/SNEWS/JULY_2002/vachon iu102.htm
[57] Xie, Y., Liu, B., Yin, J., and Zhou, S., (2002) "Optimum Mix Parameters of High-StrengthSelf-Compacting Concrete with Ultrapulverized Fly Ash," Cement & Concrete Research,32, 477-480.
[58] Zhu, W., Gibbs, J.C., and Bartos, P.J.M., (2001) "Uniformity of In Situ Properties of Self-Compacting Concrete in Full-Scale Structural Elements," Cement & Concrete Composites,23, 57-64.
[59] Zia, P., and Mostafa, T. (1977, October) "Development Length of Prestressing Strands,"PCI Journal, 55-65.
306
Conclusions or recommendations in this report are the opinions of the authors. PCI assumes no responsibility for the interpretation or application of the information contained herein.