International Journal of Geology, Earth & Environmental Sciences ISSN: 2277-2081 (Online)
An Open Access, Online International Journal Available at http://www.cibtech.org/jgee.htm
2016 Vol. 6 (1) January-April, pp. 98-113/Sahoo et al.
Research Article
© Copyright 2014 | Centre for Info Bio Technology (CIBTech) 98
ENVIRONMENTAL FLOWS ALLOCATION IN TWO MAIN
DISTRIBUTARIES OF MAHANADI RIVER
*Sangitarani Sahoo1, Deepak Khare1, Satyapriya Behera1 and Prabhash K Mishra2 1Water Resources Development and Management, IIT Roorkee
2National Institute of Hydrology, Roorkee
*Author for Correspondence
ABSTRACT
The environmental flows concept mainly recognizes, needs of fresh water system to maintain the
ecological integrity and provide goods and services to society &dependent communities. In the Mahanadi
river basin the environmental flow method was first introduced in Chilika Lagoon, downstream of Naraj
Barrage, Odisha by World Bank Environment Department. In 2002 the EFA project was successed to
integrate key water quality concern, particularly salinity within the lagoon, for functioning the lagoon
ecosystem while it was not successed to influence in operation of the Barrage at Naraj. The river system
attains zero and very low flows in low flow period due to construction of hydropower generating
structures, water retaining structure and withdrawal of water by water users, which possesses a
tremendous threat to the environment, ecology & aquatic life. Therefore, a need arises to regulate the
reservoirs and barrages for releasing the adequate water in the river throughout the year. Thus,
environmental flows assessment is done in Lower Mahanadi sub-basin and its two main distributaries for
providing the Environmental Flow Requirements (EFRs), with a range of Low Flow Requirements
(LFRs) and High Flow Requirements (HFRs) to be ensured at any circumstances to avoid any degradation
of river ecosystem. The paper analyse the applicability of several desktop hydrology-based environmental
flow assessment methods such as Tennant, Tessman, Variable monthly flow (VMF), Range of variability
Approach(RVA), FDC shifting technique using GEFC software. In this approach daily discharge data of
Mahanadi River are used to assess Environmental flows in percentage of Mean Annual Flow (MAF) and
range of flow in percentage of mean Low flow and mean High flow respectively. The comparative results
indicate that a minimum flow i.e. 624m3/sec (equivalent to 40%of MAF) for main stream of Mahanadi
river, 203m3/sec (equivalent to 26% of MAF) for Kathajodi river and 23m3/sec (equivalent to 33.5% of
MAF) for Birupa river respectively. This paper also promote the requirement of environmental water
allocation in planning of water resources development project in Mahanadi river system.
Keywords: EFR, GIS, Tennant, Tessman, VMF, Smakhtin Method, RVA and GEFC Software
INTRODUCTION Environmental flow refers to water provide within a river, wetland or coastal zone to maintain ecosystems
and the social benefits, which they provide for people.
Environmental flows is may be termed as "ecological water demand" similar to agricultural or Industrial
water demands and it is effectively a balance between Water Resources Development & the need to
protect freshwater-dependant ecosystem.
Fresh water ecosystems provide many important goods and services includes clean water, Ground water
recharge, food sources for fish & invertebrates, opportunities for harvesting fuel wood & grazing on
riverine corridors, cropping on flood plain, Biodiversity conservation, flood protection, Removal of
wastes through biogeochemical process, recretional opportunities and cultural, asthetic & religious
benefits. Environmental flows are central to supporting sustainable development and adressing poverty
allevation. Investment in water resources infrastructure like multipurpose dams or barrages have been
essential for economic development including hydropower generation, irrigation, industrial & urban water
supply and flood & drought mitigation, but they can cause problem for downstream ecosystem &
communities, when they are improperly planned, designed & operated on the basis of volume, pattern &
quality of flow.
International Journal of Geology, Earth & Environmental Sciences ISSN: 2277-2081 (Online)
An Open Access, Online International Journal Available at http://www.cibtech.org/jgee.htm
2016 Vol. 6 (1) January-April, pp. 98-113/Sahoo et al.
Research Article
© Copyright 2014 | Centre for Info Bio Technology (CIBTech) 99
There are many methods suggested by environmental researchers from very simple to the very complex
for estimating environmental flow requirements. The process of estimating environmental flow
requirements, for maintaining aquatic ecosystem referred to as Environmental Flow Assessment (EFA).
The water quality, sediment, food-supply & biotic interactions are the important determinant of aquatic
ecosystem.
In mid of 1990, the World Bank environment Department were taken seventeen case studies for the
advance understanding & integration in operational terms of environmental water allocation into
integrated water resources management. One case study was from India i.e. restoration of Chilika Lagoon,
located at downstream of Naraj Barrage, Mahanadi river basin, Odisha. Chilika Lagoon is the largest
brackish Lagoon in Asia, is located in the state of Odisha.
The Lagoon is a biodiversity hotspot, especially for of water birds & other aquatic species. Over 2millions
individuals of 160 species water birds are found at the peak migratory times. The Chilika Lagoon
ecosystem provides income for about 200,000 people, who are directly or indirectly dependent upon the
fish, crab & prawn catch.
In this case study it was incorporated that the EFA project was success to integrated key water quality
concerns particularly salinity within the lagoon as it is an important parameter for functioning the lagoon
ecosystem, while it was not able to successed in influencing the operation of the Barrage at Naraj.
However the World Bank assistance provided training and improved the understanding of Environmental
Flows Assessment (EFA) procedures within the State Government agencies (Hirji and Davis, 2009a).
Environmental Flows Adoption and Methods
Many environmental methods were designed to protect a single species to address a single issue.
However, the managing flows for single species may not result in robust aquatic ecosystems and also may
even fail to preserve the target species, because their dependence on a wide range of ecosystem functions
such as food webs & habitat.
The wide range of methods provides a choice of suitable technique to suit various time tables, budgets
and purposes. There is no simple figure can be suggested for the environmental flow requirement of
rivers; as it is related to a number of factors including: (a) the size of the river; (b) its natural state; (c)
combination of the desired state of the river; (d) in practice, the uses to which it is put (Acreman and
Dunbar, 2004).
Methods for Determining Instream Flow Requirements
The instream flow may be defined as the amount of water flowing past a given point within a stream
channel during one second. The instream flow requirements mostly have been based on the habitat
requirements for some species or groups of fish, historically these requirements have been expressed in
terms of some minimum flow.
Water is taken out of the stream for a variety uses, such as irrigation purposes, municipal and industrial.
But "minimum flow" or "low flow" means that amount of water must be left in the stream for the fish. In
addition minimum flows were now a day established for water supply, navigation and protective of
aquatic life.
Quantification of Environmental Flow Requirements (EFRs)
The quantification of Environmental flow requirements can be approached in two ways i.e. bottom-up and
top-down. In "bottom-up" approach, the environmental flow regimes are built up by flows requested for
specific purposes from a starting point of zero flows.
Whereas in "top-down" approach the environmental flow regime built up by determining the maximum
acceptable departure from natural condition. The bottom-up approaches are commonly used, including
Building Block Methodology (Holistic approach) and Instream Flow Incremental Methodology (IFIM).
The bottom-up approach is dependent on the knowledge of the participants in the process & availability
of reliable data of stream and it would examine the environmental flow regime is likely to one to natural
regime.
In top-down approach the degree of departure from the natural regime under various management
scenario, which are quantified in relation to key indicator and then examine the acceptable deviation to
International Journal of Geology, Earth & Environmental Sciences ISSN: 2277-2081 (Online)
An Open Access, Online International Journal Available at http://www.cibtech.org/jgee.htm
2016 Vol. 6 (1) January-April, pp. 98-113/Sahoo et al.
Research Article
© Copyright 2014 | Centre for Info Bio Technology (CIBTech) 100
natural regime. The top-down approach was developed by Queensland Department of Natural. The top
down based on key indicator statistics tied to geomorphological and ecological outcomes.
In bottom-up approaches generally two to three flow bands are considered, such as low flows, medium
flows and high flows.
Low flows: The low flow requirements are generally based on ecological consideration, i.e. the
availability or suitability of instream habitat for target species. Medium flows: Particularly medium flow
requirements are important in sand bed rivers, which often capable of entraining and transporting sand.
High flows: Generally high flows are emphasised in geomorphological assessments of Environmental
flow requirements, due to following objectives: (i) to maintain channel size and form, (ii) to limit
vegetation encroachment, (iii) to remove fine sediment build ups from the stream bed. High flows also
termed as flushing flows or "channel maintenance flows" (Stewardson & Gippel, 1997).
Review of Environmental Flows Assessment Methods
Before the 1990's the water management was limited to water quality standards and minimum flow
requirements.
In the last two decades it has changed towards managing river to achieve more natural flow regime,
capturing the seasonal and inter annual flow variability as well as the magnitude, timing & frequency of
different flow condition.
In a comprehensive study of Environmental flow methodologies, Tharme (2003) documented the
existence of more than 207 significantly Environmental Flow Methods (EFMs) implemented in 44
countries within 6 regions of the World which can be classified into four broad categories: hydrological
methods; hydraulic rating methods; habitat simulation methodologies; holistic methodologies (Tharme,
2003; Acreman and Dunbar, 2004; Dyson et al., 2008).
These methods were mainly developed after studies have been conducted for rivers, wetlands, estuaries,
forest and grassland ecosystem.
Hydrologic Index (Desktop) Methods: These methods analyze the historical hydrology to identify natural
flow conditions and prescribed flow recommendation. Hydrological approaches have been developed for
broad scale planning & which are fully dependent on the historical flow records. The hydrologic index
methods are simple, inexpensive and use as a flow indicator of the biological condition. The method
assumes a relationship between flow and specific biological parameters. In this method the long-term
time series data (usually20-50 years) of the river flows is used and the minimum flow expressed as the
percentage of natural flow values. Tennant method, Tessman method, Range of variability approach,
Desktop reserve model, FDC analysis method, Hydrologic Assessment Tool (HAT) are some examples of
Hydrologic Index method.
Hydraulic Rating Methods: These types of method relates to the hydrodynamics of the river with its
morphology to design adequate habitat for the environment.
Hydraulic rating methods assume a relationship between discharge and some hydraulic measure of a
stream across river cross-section. In this method the flow estimation based on surveyed cross section
relates to various parameters of stream geometry such as width, depth, wetted perimeter and discharge
rates (Jowett, 1989).
The minimum or optimal flows, usually for fish spawning and maximum production by benthic
invertebrates are generally identified from a discharge near the break point of the wetted perimeter-
discharge curve. Wetted perimeter method and R2 cross method are the two examples of Hydraulic rating
methods. These methods are used to compute minimum flow and correlate the available habitat areas
based on river channel geometry. Hydraulic methods are not suitable for the assessment of seasonal flow
requirement.
Habitat Simulation Methodologies: Habitat model is an extension of Hydraulic rating methods, which
determine flow requirements using hydraulic condition to meet specific requirement of biota. These
models are generally complex and data intensive.
In this method a variety of models is used to establish a relationship between flow regimes and the
amount & quality of physical habitat for various species as well as with other environmental aspects such
International Journal of Geology, Earth & Environmental Sciences ISSN: 2277-2081 (Online)
An Open Access, Online International Journal Available at http://www.cibtech.org/jgee.htm
2016 Vol. 6 (1) January-April, pp. 98-113/Sahoo et al.
Research Article
© Copyright 2014 | Centre for Info Bio Technology (CIBTech) 101
as sediment transport, water quality and fish passage. In-stream flow Incremental methodology (IFIM) is
the example of habitat model.
The In-stream Flow Incremental method (IFIM) relates different flows with habitat changes using
predetermined preferences for specific fish species. The IFIM is a software system which is used to
integrate micro-habitat (depth, velocity, substrate, cover) suitability and macro- habitat (basin, network,
river segments) suitability into habitat units that are then related to flow over time.
Holistic Methodologies: In this type of methods Multidisciplinary (from many disciplines of natural &
social sciences and engineering and participation of stake holders) experts are required to define a flow
regime intended to achieve a particular objective or to determine acceptable degrees of departure from the
natural flow regime.
The holistic method consider whole riverine ecosystem. In this approach the environmental flow
requirement is assessed for all biotic and abiotic components of the river ecosystem, including the
wetlands, ground water & estuaries as well as physical features and organisms. Holistic approaches are
also based on the premise modified flow regimes are similar to the historical flow regimes in their spatial
and temporal variability, required to sustain stream morphology, habitats and all kinds of organisms
(Arthington, 1998; King et al., 2003). The basis of the Holistic approach is the systematic construction of
a modified flow regime through a bottom-up or a top-down process (King et al., 2003). A process of
interaction and consensus building allows integration of data and knowledge to achieve a mutually agreed
upon description of a flow regime, which is required to maintain a specified river condition. Building
Block Methodology (BBM), Downstream Response to Imposed Flow Transformation (DRIFT),
Catchment Abstraction Management Strategies (CAMS) and Expert Pannel Assessment (EPA) are the
example of Holistic methodology.
MATERIALS AND METHODS
Study Area
The Mahanadi river is the second major peninsular river in India after Godavari, is located in East Central
India within geographical co-ordinates 80° 28´ to 86° 43´ East longitude &19° 8´ to 23° 32´ North
latitude.
The Mahanadi is extend over five states i.e. Chhatisgarh (52.42%), Odisha (47.14%, approximately the
catchment area of 65847 Sq Km & length 494 Km) & smaller portion of Jharkhand, Maharashtra & M.P.
The total length of the Mahanadi river basin is 851 Km from origin to Bay of Bengal with have
maximum length 587 Km & width have 400 Km comprising the total catchment area of 139681.51 Sq
Km (GIS based) respectively.
The Mahanadi is the largest river in Odisha originates from a fall of Pharasiya village, Dhamtari district
of Chhatisgarh at an elevation of 442m above m.s.l. The basin is broadly divided into three sub basin i.e.
Mahanadi upper sub basin, Mahanadi middle sub basin, Mahanadi lower sub basin. The lower Mahanadi
sub-basin comprising a catchment area of 57958 Sq Km, lying in Odisha extending within geographical
co-ordinates 82° to 86° East longitude &19° 30´ to 21° 30´ North latitude approximately has been
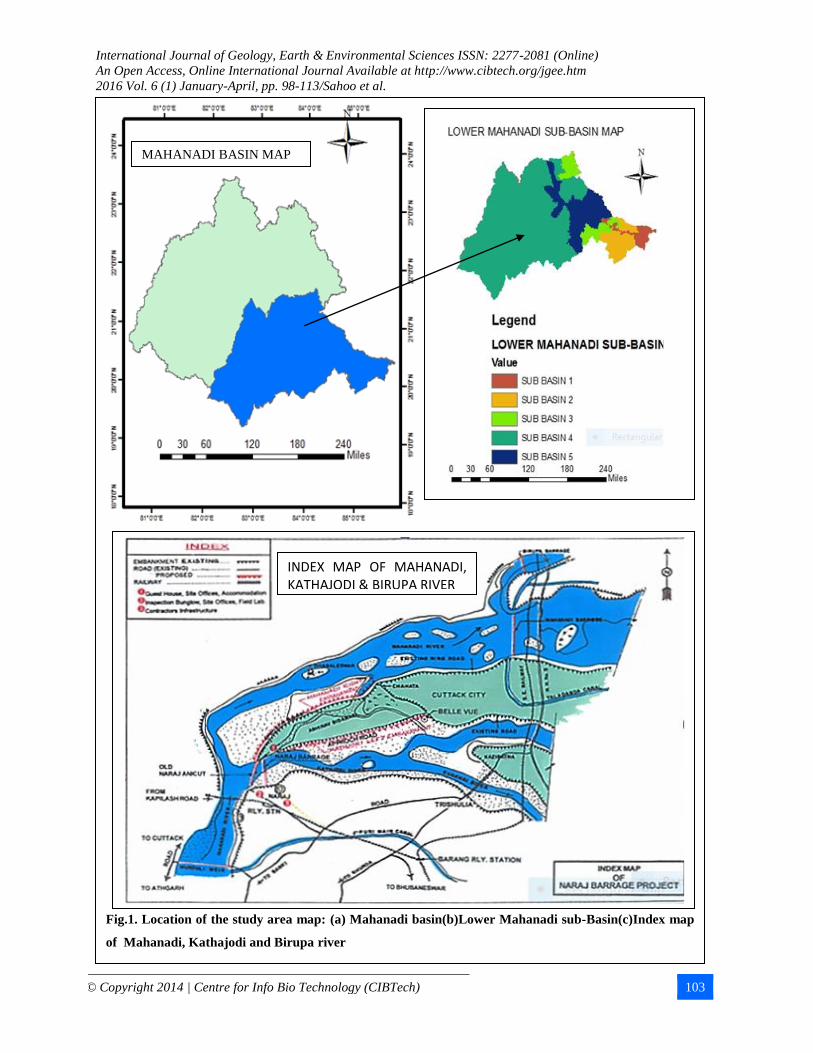
considered in the present work. The thematic map of lower Mahanadi sub-basin and its sub-watersheds
(Figure 1) are generated using Arc GIS 10.2.2 software.
During the traverse a no. of tributaries join the river and out of those the principal tributaries are Ib, Ong,
Tel. The Ib join at the upstream of dam, whereas Ong & Tel are join at the downstream of the dam
respectively.
The Ib river flowing into the reservoir (created by the Hirakud Dam of 4800m length) which is located
across Mahanadi 10 Km from Sambalpur city. Below Sambalpur the Mahanadi enters the Bolangir
district and after flowing 45Km it reaches Sonepur. After flowing 11Km of Sonepur, the Ong and Tel join
the Mahanadi from right.
After flowing a distance of 23Km, the river flows through the extremely narrow Satkosia Gorge. The
Tikarapara village is about 6Km below the start of the Gorge. The 64Km long Satkosia Gorge ends at
Barmul. Below Barmul the river widers again and takes sharp turn to the left & ends at Mundali (4.8 Km
International Journal of Geology, Earth & Environmental Sciences ISSN: 2277-2081 (Online)
An Open Access, Online International Journal Available at http://www.cibtech.org/jgee.htm
2016 Vol. 6 (1) January-April, pp. 98-113/Sahoo et al.
Research Article
© Copyright 2014 | Centre for Info Bio Technology (CIBTech) 102
from upstream of Naraj barrage) and finally emerge into the delta at Naraj, which is 11 Km far away from
Cuttack. In 1993 a barrage of 1353 m has been constructed in place of old weir at Mundali to regulate the
undivided Mahanadi river flow.
From Naraj the Mahanadi River throws its first limb known as Kathajodi. In 2005 a barrage of 940 m has
been constructed in place of old weir at Naraj, to regulate the river flow of the Kathajodi. Then it
branches into Serua, Biluakhai, Devi, Kandal and Taunla and finally it fall into the Bay of Bengal, named
as Devi river mouth. Another sub-distributary branches off from Kathajodi named as Kuakhai, and it
bifurcated into Kushabhadra, Bhargavi and Daya.
The Kushabhadra has an indepedent mouth to the Bay of Bengal, where as Bhargavi & Daya reunite &
discharge into Chilika Lake. The coastal plain stretching from Naraj to Devi mouth around 101 Km &
covering the Delta plain area of 9063SqKm. The estuarine part of the river covers a length of 40Km and
has a basin area 9SqKm.
Similarly another distributary Birupa has bifurcated into Genguti & these two branches finally join to the
Brahmani River and enters to the Bay of Bengal at Dhamra.
In 1991 a barrage of 203 m has been constructed in place of old Birupa weir at Jagatpur, to regulate the
river flow of the Birupa.
Other distributaries of Mahanadi include Chitrotpala, Luna, Paika and it finally fall into Bay of Bengal
named as Mahanadi Mouth.
In 1991 a longest barrage of 1928 m length has been constructed in place of 60 m far away from old
anicut at Jobra, to regulate the river flow of the downstream of Mahanadi.
Physiographically the basin divided into four regions, i.e. Northern plateau, Eastern Ghat, the Coastal
plain and the erosional plains of central table land. The coastal plain stretching from Naraj to Devi mouth
around 101 Km & covering the Delta plain area of 9063Sq Km. The estuarine part of the river covers a
length of 40 Km and has a basin area 9Sq Km. The Mahanadi Basin receive an average annual
precipitation around 1450 mm.
In the period of July to September the basin received the precipitation of 800 mm to 1600 mm, while less
than 50 mm precipitation received in rest of the months. As per CWC (2009) the temperature variation in
Mahanadi basin is from 70C to 45.50C. In winter the mean daily minimum temperature varies from 40C to
120C and in summer the mean daily maximum temp varies from 380C to 45.50C. May is the hottest month
in the Odisha, where the mean maximum temperature ranges from 380 C to 430C over the hills & plains
respectively.
Selection of EF Sites for Environmental Flows Assessment in Lower Mahanadi Sub-Basin: The
Mahanadi basin comprising a lot of multipurpose Water resources development project and it is important
to know what amount of water will be release from dam or weir/barrage to downstream in order to protect
and maintain aquatic life in stream.
Accordingly the study was carried out to determine the environmental flow amount for lower reach of
Mahanadi river basin and its distributaries. The features of the sites along with name, geographical
location and period of hydrologic data sets are illustrated in the table 1.
Description of the Hydraulic Features of Study Area: For the assessment of Environmental flows, the
daily discharge data of Mahanadi River has been used in this study. The flow regimes of the study area
were analysed using several hydrological indicators i.e. Base Flow Index (BFI) = ((Q90)/ MAF) &
Hydrological Variability Index (HVI) = ((Q25-Q75) / Q50). Where, Q90, Q75, Q50, Q25 are the annual flows
equalled or exceeded for 90%, 75%, 50%, 25% of the time respectively. MAF = Mean annual flow and
MMF= Mean monthly flow. These all rivers have strong Base Flow Index more than 20% and a
Hydrological Variability Index less than 1 (table 2).
Method
In worldwide various methods have been developed to determine a minimum stream flows requirement
for protection of habitat.
Out of these six methods that have been applied widely were selected for comparison in this report. These
methods include the
International Journal of Geology, Earth & Environmental Sciences ISSN: 2277-2081 (Online)
An Open Access, Online International Journal Available at http://www.cibtech.org/jgee.htm
2016 Vol. 6 (1) January-April, pp. 98-113/Sahoo et al.
Research Article
© Copyright 2014 | Centre for Info Bio Technology (CIBTech) 103
Fig.1. Location of the study area map: (a) Mahanadi basin(b)Lower Mahanadi sub-Basin(c)Index map
of Mahanadi, Kathajodi and Birupa river
MAHANADI BASIN MAP
INDEX MAP OF MAHANADI, KATHAJODI & BIRUPA RIVER
International Journal of Geology, Earth & Environmental Sciences ISSN: 2277-2081 (Online)
An Open Access, Online International Journal Available at http://www.cibtech.org/jgee.htm
2016 Vol. 6 (1) January-April, pp. 98-113/Sahoo et al.
Research Article
© Copyright 2014 | Centre for Info Bio Technology (CIBTech) 104
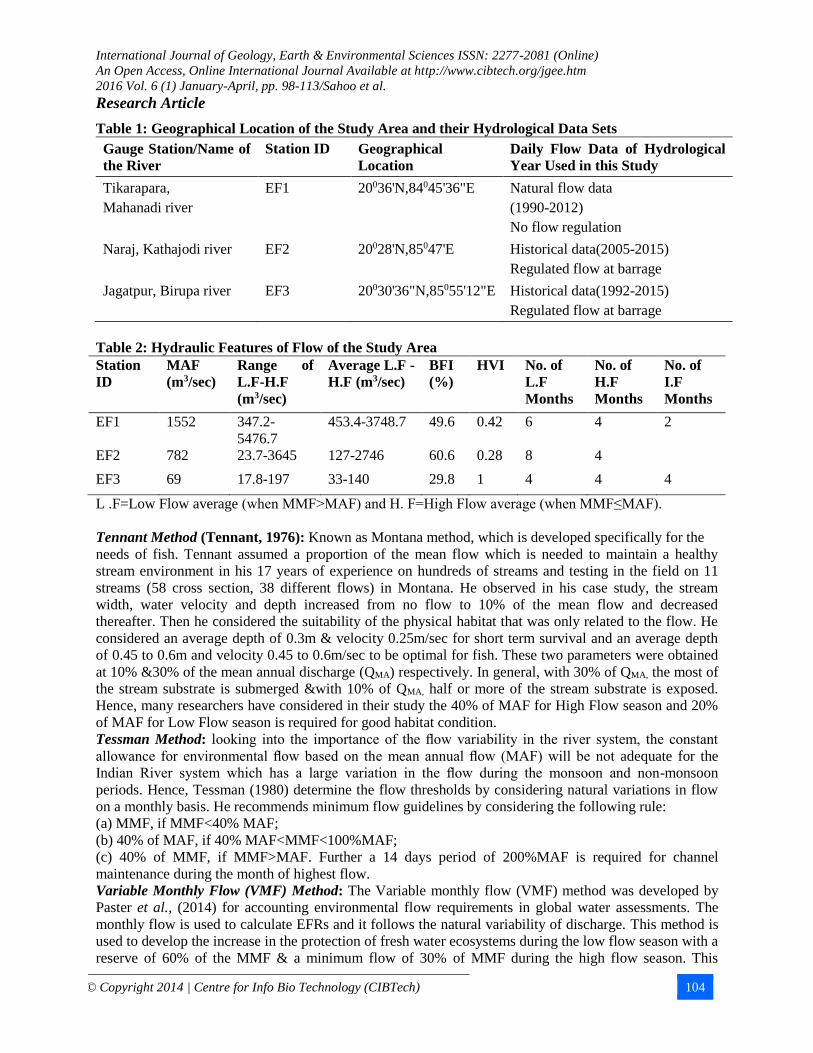
Table 1: Geographical Location of the Study Area and their Hydrological Data Sets
Gauge Station/Name of
the River
Station ID Geographical
Location
Daily Flow Data of Hydrological
Year Used in this Study
Tikarapara,
Mahanadi river
EF1 20036'N,84045'36"E Natural flow data
(1990-2012)
No flow regulation
Naraj, Kathajodi river EF2 20028'N,85047'E Historical data(2005-2015)
Regulated flow at barrage
Jagatpur, Birupa river EF3 20030'36"N,85055'12"E Historical data(1992-2015)
Regulated flow at barrage
Table 2: Hydraulic Features of Flow of the Study Area
Station
ID
MAF
(m3/sec)
Range of
L.F-H.F
(m3/sec)
Average L.F -
H.F (m3/sec)
BFI
(%)
HVI No. of
L.F
Months
No. of
H.F
Months
No. of
I.F
Months
EF1 1552 347.2-
5476.7
453.4-3748.7 49.6 0.42 6 4 2
EF2 782 23.7-3645 127-2746 60.6 0.28 8 4
EF3 69 17.8-197 33-140 29.8 1 4 4 4
L .F=Low Flow average (when MMF>MAF) and H. F=High Flow average (when MMF≤MAF).
Tennant Method (Tennant, 1976): Known as Montana method, which is developed specifically for the
needs of fish. Tennant assumed a proportion of the mean flow which is needed to maintain a healthy
stream environment in his 17 years of experience on hundreds of streams and testing in the field on 11
streams (58 cross section, 38 different flows) in Montana. He observed in his case study, the stream
width, water velocity and depth increased from no flow to 10% of the mean flow and decreased
thereafter. Then he considered the suitability of the physical habitat that was only related to the flow. He
considered an average depth of 0.3m & velocity 0.25m/sec for short term survival and an average depth
of 0.45 to 0.6m and velocity 0.45 to 0.6m/sec to be optimal for fish. These two parameters were obtained
at 10% &30% of the mean annual discharge (QMA) respectively. In general, with 30% of QMA, the most of
the stream substrate is submerged &with 10% of QMA, half or more of the stream substrate is exposed.
Hence, many researchers have considered in their study the 40% of MAF for High Flow season and 20%
of MAF for Low Flow season is required for good habitat condition.
Tessman Method: looking into the importance of the flow variability in the river system, the constant
allowance for environmental flow based on the mean annual flow (MAF) will be not adequate for the
Indian River system which has a large variation in the flow during the monsoon and non-monsoon
periods. Hence, Tessman (1980) determine the flow thresholds by considering natural variations in flow
on a monthly basis. He recommends minimum flow guidelines by considering the following rule:
(a) MMF, if MMF<40% MAF;
(b) 40% of MAF, if 40% MAF<MMF<100%MAF;
(c) 40% of MMF, if MMF>MAF. Further a 14 days period of 200%MAF is required for channel
maintenance during the month of highest flow.
Variable Monthly Flow (VMF) Method: The Variable monthly flow (VMF) method was developed by
Paster et al., (2014) for accounting environmental flow requirements in global water assessments. The
monthly flow is used to calculate EFRs and it follows the natural variability of discharge. This method is
used to develop the increase in the protection of fresh water ecosystems during the low flow season with a
reserve of 60% of the MMF & a minimum flow of 30% of MMF during the high flow season. This
International Journal of Geology, Earth & Environmental Sciences ISSN: 2277-2081 (Online)
An Open Access, Online International Journal Available at http://www.cibtech.org/jgee.htm
2016 Vol. 6 (1) January-April, pp. 98-113/Sahoo et al.
Research Article
© Copyright 2014 | Centre for Info Bio Technology (CIBTech) 105
method also allows water users such as industry and irrigation sector to withdraw water upto 40% of the
MMF during the low flow season. In this method the Low flow, Intermediate flow and High flow seasons
with different algorithm defined. Accordingly they recommends minimum flow guidelines by considering
the following rule:
(a) 60% MMF, if MMF < 40% MAF;
(b) 45% of MMF, if 40% MAF<MMF<80%MAF;
(c) 30% MMF, if MMF> 80% MAF.
Shifting FDC Technique: Smakhtin and Anuptha (2006) has been proposed a variant of the FDC method
for data-deficient situation. In India, practically all river discharge data are either classified or restricted
due to variety of reasons and also ecological data on river biota are very poor. This method relies on a
reference FDC based on the monthly discharge time series and calculates how much the flow can be
modified for a specified desired condition of the river. The FDC are then generated corresponding to the
17 fixed percentage points such as 0.01, 0.1, 1, 5, 10, 20, 30, 40, 50, 60, 70, 80, 90, 95, 99, 99.9 & 99.99
to cover the entire range of flow. The desired condition of the river is referred to as "Environmental
Management Class" such as EMC A, B, C, D, E & F are described here (table: 3) & corresponding default
levels of EWR is defined. Two additional classes E & F may describe present ecological status but not a
target. Higher EMC requires more water for ecosystem maintenance or conservation. These classes are
purely conceptual and not based on any emprical relationship between flow and ecological condition. The
rivers are placed into different EMCs by expert judgement using a scoring system. The environmental
Water Requirement (EWR) is then estimated for all or any of the EMCs corresponding to Mean Annual
Run off (MAR) and then the best one feasible under the given existing and future conditions is choosen.
Table 3: Description of Default EMCs
EMCs Description (Management Perspective)
EMC A Negligible modification from natural condition and negligible risk to sensitive species.
(No new water projects are allowed).
EMC B Slight modification from natural condition and slight risk to intolerant biota. (Water
supply scheme or irrigation developments are allowed).
EMC C Moderate modification from natural condition and especially intolerant biota may be
reduced in number & extent.(Multiple disturbances associated with the need for socio
economic development).
EMC D High degree of modification from natural conditions and intolerant biota unlikely to
be present. (Clearly visible Disturbances associated with basin water resources
development like dam, diversion etc).
The FDC for each EMC is determined by shifting the reference FDC to the left gradually. For class A
river the default environmental FDC is determined by shifting the reference FDC by one step (flow which
was exceeded 99.99 percent of the time in the original FDC will be exceeded 99.9 percent of the time),
for class B shifting the reference FDC by two steps (flow at 99.9 percent becomes the flow at 99 percent)
and so on. Then a linear extrapolation is used to define the "new low flows".
Global Environmental Flow Calculator Software: Global Environmental Flow Calculator (GEFC) is a
software package which is developed by International Water Management Institute (IWMI, 2006). The
GEFC uses the shifting technique to estimate EF. The calculator uses monthly flow data and is built
around a flow duration curve (FDC), subsequently a non-linear transformation procedure converts into
flow time series of environmental flow. The curve is calculated for Environmental flow for several
categories of aquatic ecosystem protection from "largely natural" to severely modified" (Smakhtin &
Eriyagama, 2008). In the GEFC, four steps are involved in the estimation procedure of Environmental
flows. (1) Select a data source (user defined File):- which provides to carry out EF calculations for own
International Journal of Geology, Earth & Environmental Sciences ISSN: 2277-2081 (Online)
An Open Access, Online International Journal Available at http://www.cibtech.org/jgee.htm
2016 Vol. 6 (1) January-April, pp. 98-113/Sahoo et al.
Research Article
© Copyright 2014 | Centre for Info Bio Technology (CIBTech) 106
time series. (2) In display of hydrological characteristics such as original monthly time series, annual
time series, monthly flow distribution, FDC of whole period of record & flow statistics. (3) Calculating
EF with simulating reference hydrological conditions with 17 fixed percentage probabilities are 0.01%,
0.1%, 1%, 5%, 10%, 20%, 30%, 40%, 50%, 60%, 70%, 80%, 90%, 95%, 99%, 99.9%, 99.99% for each
default EMCs. (4) Select the most suitable EMC for the desired river with expert judgement and the
display time series will generate monthly Environmental time series corresponding to FDC.
Range of Variability Approach (RVA): The Range of Variability Approach (RVA) was developed by the
Richter et al., (1997) for the estimation of an environmentally acceptable flow regime. RVA is an
excellent technique, where the role of hydrological variability in structuring and maintenance of a fresh
water dependent ecosystem. In this method Richter et al., identified 32 ecologically-important
hydrological parameters later changed into 33 hydrological characteristics divided into 5groups
(magnitude, timing, frequency, duration and rate of change) of the annual flow regime. This approach sets
appropriate measures of variability for the monthly flow values either 1standard deviation from the mean
flow or within the 25th& 75th percentile of the monthly mean flow. Non parametric measures the 25th&75th
percentile of the mean flow were used in this study because hydrologic data are often skewed (Armstrong
et al., 1999; Babel et al., 2012). Richter (1997) point out that the targeted range will not be attained every
year due to natural flow variability, but he suggested that it should be attained at the same frequency as
the natural flow regime or pre development flow regime.
Smakhtin Method: The Smakhtin method was developed by Smakhtin et al., (2004) for environmental
water requirements in a global water resources assessment. In basin with highly variable flow regimes a
largely proportion of the total annual flow occur in wet period (usually one to three months), but in dry
period of the year, such rivers may either go completely dry or have very low discharge. Accordingly to
this Environmental Low flow requirements was assumed to be equal to the monthly flow, which is
exceeded 90% of time (Q90), on average throughout a year & is normally estimated from FDC. A "steep"
FDC is indication of as variable flow regime, where a flat slope is indication of stable flow regime. For
rivers with highly variable flow regimes, in case of Krishna river Q90 may be equal to zero or very small
(Smakhtin et al., 2004).
After many studies on low flow hydrology, Smakhtin (2001) suggested that Q90 varies in the range of 0-
50% of MAR & it would be account for only smaller part of total annual base flow. But with existing
experience with setting HFR, Hughes and Hannart, (2003) suggested that HFR may vary in the
approximate range of 5-20% of MAR, depending on the type of flow regime & the objective of the
environmental flow management. Hence, it is decided for basin with: (a) High variable flow regime:
HFR=20% of MAR, where Q90<10% of MAR; (b) Stable flow regime: HFR=0, where Q90>30% of
MAR; (c) HFR=15% of MAR, where Q90 ranging from 10% to 20% of MAR; (d) HFR= 7% of MAR,
where Q90 ranging from 20% to 30% of MAR and the total annual Environmental Water Requirements
(EWRs) calculated as sum of Low flow requirements (LFR) & High flow requirements (HFR).
RESULTS AND DISCUSSION
The Environmental flow requirements computed by standard methods for determining a minimum flow
for Mahanadi River and its distributaries were compared, which are illustrated in the table 4 and Figure 2
&3. Using a combination of the six EF methods, on an average the EFRs is recommended 624.50 m3/sec
(equivalent to 40.24% of MAR), along with Low flow requirements (LFRs) & High flow requirements
(HFRs) are 397.80 m3/sec (equivalent to 88% of mean annual LF) & 1077.50m3/sec (equivalent to
28.75% of mean annual HF) respectively for Tikarapada gauge station, main stream of Mahanadi river.
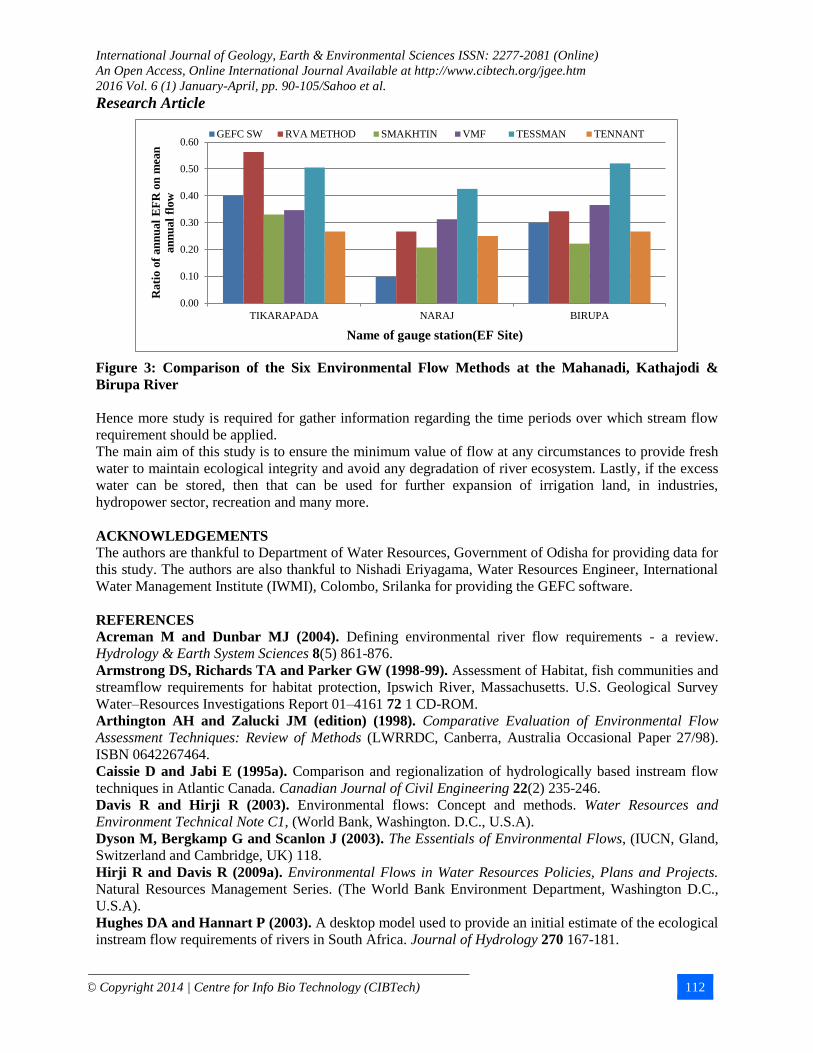
The RVA method provided highest EFRs i.e. 873.80 m3/sec (equivalent to 56.30 % of MAR), where
Tennant method provided lowest result 413.80 m3/sec (equivalent to 26.70% of MAR) respectively.
Similarly, on an average the EFRs is recommended 203.30 m3/sec (equivalent to 26 % of MAR), along
with LFRs & HFRs are 92.20m3/sec (equivalent to 72.56% of mean annual LF) & 536.70m3/sec
(equivalent to 19.55% of mean annual HF) respectively to be released at Naraj Barrage, Kathajodi river.
The Tessman method provided highest EFR i.e. 333 m3/sec (equivalent to 42.60 % of MAR), where
International Journal of Geology, Earth & Environmental Sciences ISSN: 2277-2081 (Online)
An Open Access, Online International Journal Available at http://www.cibtech.org/jgee.htm
2016 Vol. 6 (1) January-April, pp. 98-113/Sahoo et al.
Research Article
© Copyright 2014 | Centre for Info Bio Technology (CIBTech) 107
GEFC software provided lowest result 76.62 m3/sec (equivalent to 9.80 % of MAR) respectively. On an
average the EFR is recommended 23.07 m3/sec (equivalent to 33.61 % of MAR), along with Low flow
requirements (LFRs) & High flow requirements (HFRs) are 15m3/sec (equivalent to 45.50% of mean
annual LF) & 39.20m3/sec (equivalent to 28% of mean annual HF) respectively to be released at Birupa
Barrage, for maintaining the ecosystem in Birupa river. The Tessman method provided highest EFRs i.e.
35.75 m3/sec (equivalent to 52.10% of MAR), where Smakhtin method provided lowest result 15.21
m3/sec (equivalent to 22.17% of MAR) respectively. The Low-flow requirements are usually higher than
high -flow requirements relative to MAR, as the low flow season is higher than four months at Tikarapada
gauge staion (Mahanadi River) & Birupa River and five months higher than at Kathajodi River
respectively.
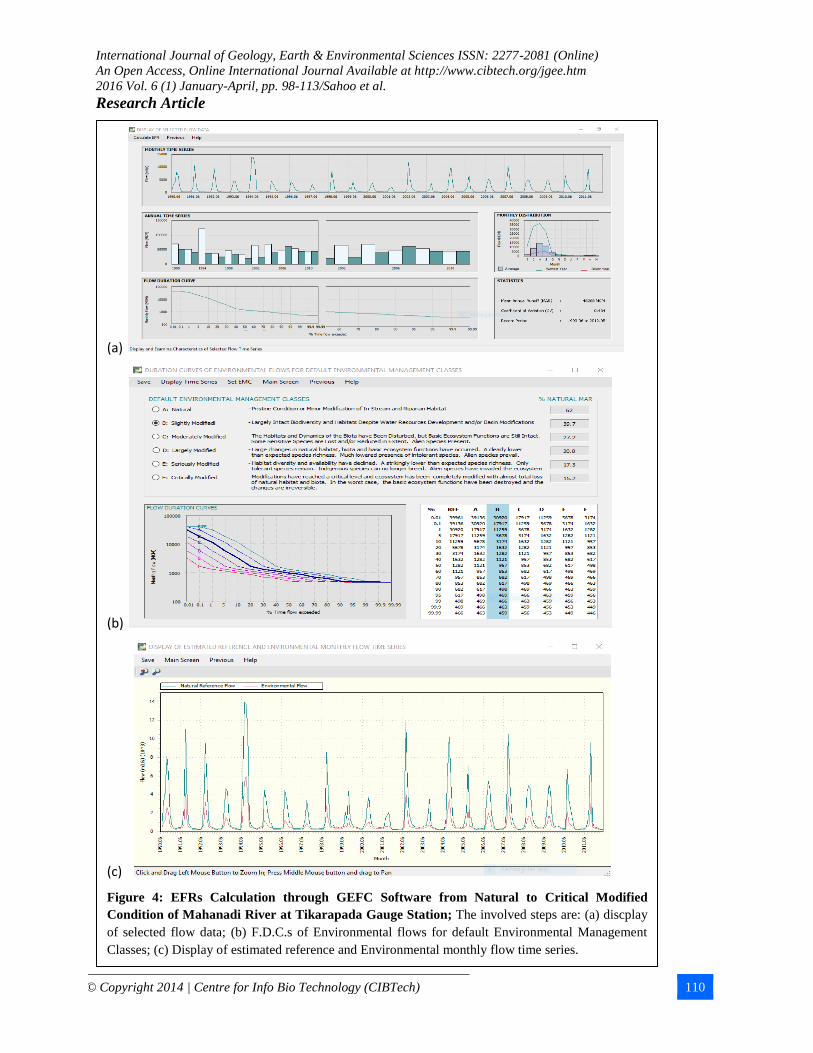
There is a specialization in case of GEFC software, it developed the FDCs and displays the natural and
environmental monthly flow time series corresponding to different EMCs of river for each class i.e. EMC
A, B, C, D, E, F are shown in Figure 4. The software estimates the long term Environmental Flows in %
of Natural MAR for different EMCs of the rivers, which are illustrated in Table 5. It is cleared that the
corresponding Environmental flows decreases progressively as ecosystem protection decreases & for
higher the EMC more water needs for ecosystem. On average the annual EF allocation 623 m3/sec
(equivalent to 39.7% of MAR) for EMC B of Mahanadi river, 76.62 m3/sec (equivalent to 11% of MAR)
for EMC C of Kathajodi river and 20.55 m3/sec (equivalent to 28.9% of MAR) for EMC C of Birupa river
i.e. water released from the Tikarapada gauge station, Naraj barrage, & Birupa barrage respectively to
maintain the D/S stretch of the river to keep the basic ecosystem function intact.
(a) (b)
(c) (d)
(e) (f)
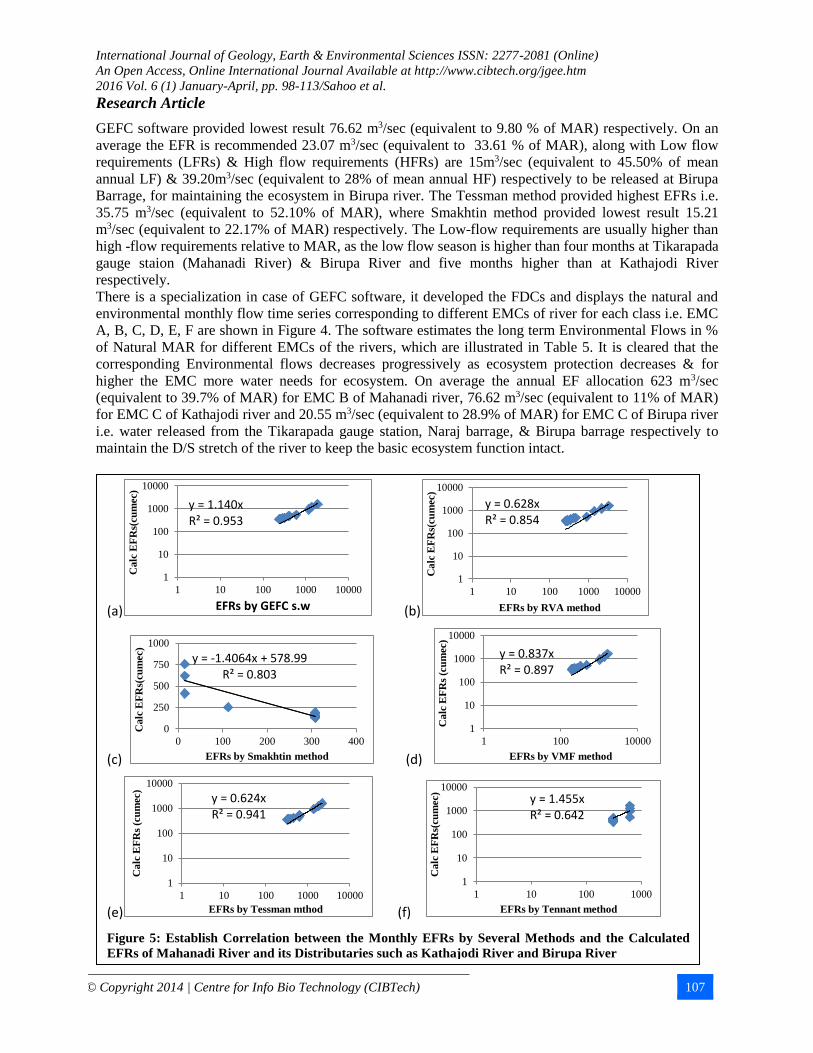
Figure 5: Establish Correlation between the Monthly EFRs by Several Methods and the Calculated
EFRs of Mahanadi River and its Distributaries such as Kathajodi River and Birupa River
y = 1.140xR² = 0.953
1
10
100
1000
10000
1 10 100 1000 10000
Ca
lc E
FR
s(cu
mec)
EFRs by GEFC s.w
y = 0.628xR² = 0.854
1
10
100
1000
10000
1 10 100 1000 10000
Ca
lc E
FR
s(cu
mec)
EFRs by RVA method
y = -1.4064x + 578.99R² = 0.803
0
250
500
750
1000
0 100 200 300 400
Ca
lc E
FR
s(cu
mec)
EFRs by Smakhtin method
y = 0.837xR² = 0.897
1
10
100
1000
10000
1 100 10000
Ca
lc E
FR
s (c
um
ec)
EFRs by VMF method
y = 0.624xR² = 0.941
1
10
100
1000
10000
1 10 100 1000 10000
Ca
lc E
FR
s (c
um
ec)
EFRs by Tessman mthod
y = 1.455xR² = 0.642
1
10
100
1000
10000
1 10 100 1000
Ca
lc E
FR
s(cu
mec)
EFRs by Tennant method
International Journal of Geology, Earth & Environmental Sciences ISSN: 2277-2081 (Online)
An Open Access, Online International Journal Available at http://www.cibtech.org/jgee.htm
2016 Vol. 6 (1) January-April, pp. 98-113/Sahoo et al.
Research Article
© Copyright 2014 | Centre for Info Bio Technology (CIBTech) 108
Table 4: Computation of Annual Average Environmental Flow Requirements (EFRs) by various Methods Corresponding to Study Area
Name of EF
Site/River
Hydrologic-al
Season
GEFC S.W. RVA Method Smakhtin
Method
VMF
Method
Tessman
Method
Tennant
Method
Calc EFRs
Tikarapada,
Mahanadi river
(EF1)
EFRs
(LFRs-HFRs)
in m3/sec
623 (301-
1267)
874 (334-
1953)
513 (769-
0)
538 (245-
1125)
785 (427-
1500)
414 (310-
621)
624 (398-
1078)
% of MAR
% of (LF-HF) 40 (66.4-34) 56 (73.7-52) 33 (169.7-
0 ) 35.7 (54-30)
50.5 (94.2-
40)
26.7 (68.5-
16.6) 40.2 (87.7-29)
Naraj,
Kathajodi river
(EF2)
EFRs
(LFRs-HFRs)
in m3/sec
76.6 (15-
261.5)
208.4 (55-
669)
162.2
(198-54.7)
244.2 (51-
824)
333 (78-
1098)
195.4 (156.3-
312.7)
203.3 (92.2-
537)
% of MAR
% of (LF-HF) 9.8 (11.8-9.5)
26.7 (43.2-
24.4)
20.75
(155.9-2)
31.25 (40.2-
30)
42.6 (61.3-
40)
25 (123-
11.4) 26 (72.6-20)
Jagatpur,
Birupa river
(EF3)
EFRs
(LFRs-HFRs)
in m3/sec
20.6 (9.8-
42.2)
23.5 (3.8-
62.8)
15.2 (20.4-
4.8)
25.1 (16.6-
42)
35.8 (25.6-
56)
18.3 (13.7-
27.5)
23.1 (15-
39.2)
% of MAR
% of (LF-HF) 30 (29.7-30)
34.2 (11.7-
44.8)
22.2 (62-
3.4)
36.5 (50.4-
30)
52.1 (77.8-
40)
26.7 (41.7-
19.6) 33.6 (45.5-28)
Average % of MAR
% of (LF-HF) 27 (36-25) 39 (43-40)
25 (129-
2) 34 (48-30) 48 (78-40) 26 (78-16) 33 (69-25)
The EFR, LFR, & HFR are expressed as a percentage of mean annual flow of river in natural condition, mean annual low-flow & mean annual high-
flow
International Journal of Geology, Earth & Environmental Sciences ISSN: 2277-2081 (Online)
An Open Access, Online International Journal Available at http://www.cibtech.org/jgee.htm
2016 Vol. 6 (1) January-April, pp. 98-113/Sahoo et al.
Research Article
© Copyright 2014 | Centre for Info Bio Technology (CIBTech) 109
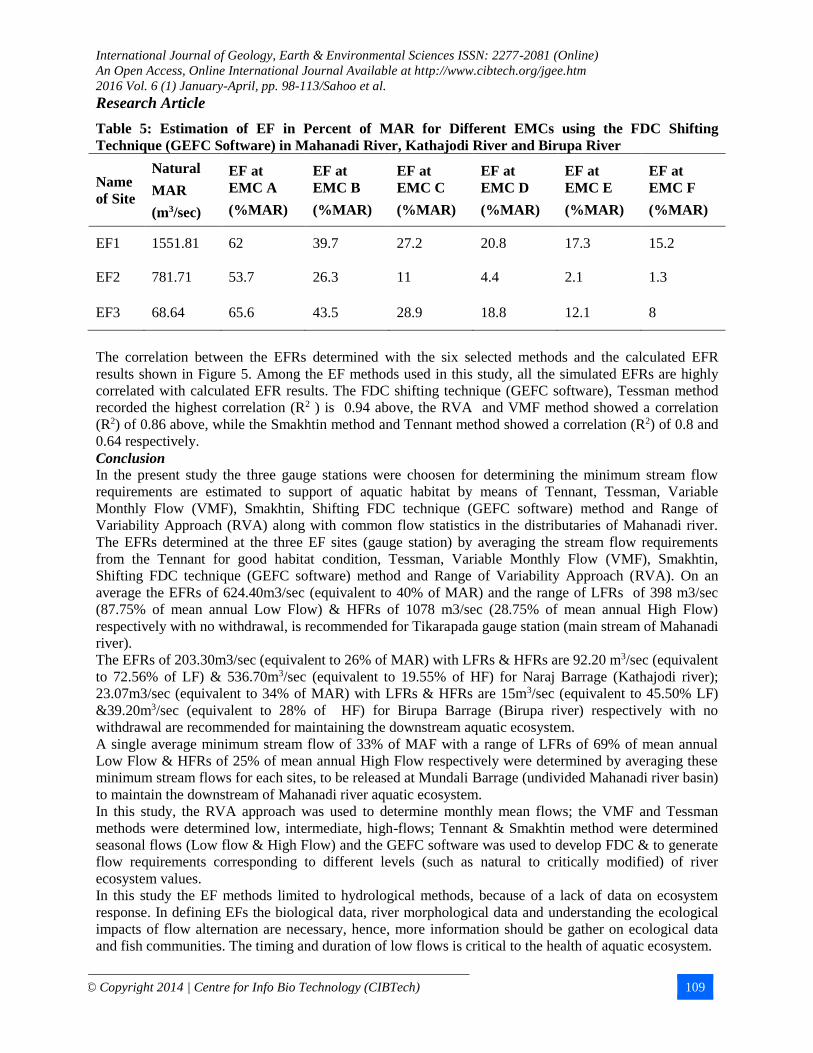
Table 5: Estimation of EF in Percent of MAR for Different EMCs using the FDC Shifting
Technique (GEFC Software) in Mahanadi River, Kathajodi River and Birupa River
Name
of Site
Natural
MAR
(m3/sec)
EF at
EMC A
(%MAR)
EF at
EMC B
(%MAR)
EF at
EMC C
(%MAR)
EF at
EMC D
(%MAR)
EF at
EMC E
(%MAR)
EF at
EMC F
(%MAR)
EF1 1551.81 62 39.7 27.2 20.8 17.3 15.2
EF2 781.71 53.7 26.3 11 4.4 2.1 1.3
EF3 68.64 65.6 43.5 28.9 18.8 12.1 8
The correlation between the EFRs determined with the six selected methods and the calculated EFR
results shown in Figure 5. Among the EF methods used in this study, all the simulated EFRs are highly
correlated with calculated EFR results. The FDC shifting technique (GEFC software), Tessman method
recorded the highest correlation (R2 ) is 0.94 above, the RVA and VMF method showed a correlation
(R2) of 0.86 above, while the Smakhtin method and Tennant method showed a correlation (R2) of 0.8 and
0.64 respectively.
Conclusion In the present study the three gauge stations were choosen for determining the minimum stream flow
requirements are estimated to support of aquatic habitat by means of Tennant, Tessman, Variable
Monthly Flow (VMF), Smakhtin, Shifting FDC technique (GEFC software) method and Range of
Variability Approach (RVA) along with common flow statistics in the distributaries of Mahanadi river.
The EFRs determined at the three EF sites (gauge station) by averaging the stream flow requirements
from the Tennant for good habitat condition, Tessman, Variable Monthly Flow (VMF), Smakhtin,
Shifting FDC technique (GEFC software) method and Range of Variability Approach (RVA). On an
average the EFRs of 624.40m3/sec (equivalent to 40% of MAR) and the range of LFRs of 398 m3/sec
(87.75% of mean annual Low Flow) & HFRs of 1078 m3/sec (28.75% of mean annual High Flow)
respectively with no withdrawal, is recommended for Tikarapada gauge station (main stream of Mahanadi
river).
The EFRs of 203.30m3/sec (equivalent to 26% of MAR) with LFRs & HFRs are 92.20 m3/sec (equivalent
to 72.56% of LF) & 536.70m3/sec (equivalent to 19.55% of HF) for Naraj Barrage (Kathajodi river);
23.07m3/sec (equivalent to 34% of MAR) with LFRs & HFRs are 15m3/sec (equivalent to 45.50% LF)
&39.20m3/sec (equivalent to 28% of HF) for Birupa Barrage (Birupa river) respectively with no
withdrawal are recommended for maintaining the downstream aquatic ecosystem.
A single average minimum stream flow of 33% of MAF with a range of LFRs of 69% of mean annual
Low Flow & HFRs of 25% of mean annual High Flow respectively were determined by averaging these
minimum stream flows for each sites, to be released at Mundali Barrage (undivided Mahanadi river basin)
to maintain the downstream of Mahanadi river aquatic ecosystem.
In this study, the RVA approach was used to determine monthly mean flows; the VMF and Tessman
methods were determined low, intermediate, high-flows; Tennant & Smakhtin method were determined
seasonal flows (Low flow & High Flow) and the GEFC software was used to develop FDC & to generate
flow requirements corresponding to different levels (such as natural to critically modified) of river
ecosystem values.
In this study the EF methods limited to hydrological methods, because of a lack of data on ecosystem
response. In defining EFs the biological data, river morphological data and understanding the ecological
impacts of flow alternation are necessary, hence, more information should be gather on ecological data
and fish communities. The timing and duration of low flows is critical to the health of aquatic ecosystem.
International Journal of Geology, Earth & Environmental Sciences ISSN: 2277-2081 (Online)
An Open Access, Online International Journal Available at http://www.cibtech.org/jgee.htm
2016 Vol. 6 (1) January-April, pp. 98-113/Sahoo et al.
Research Article
© Copyright 2014 | Centre for Info Bio Technology (CIBTech) 110
(a)
(b)
(c)
Figure 4: EFRs Calculation through GEFC Software from Natural to Critical Modified
Condition of Mahanadi River at Tikarapada Gauge Station; The involved steps are: (a) discplay
of selected flow data; (b) F.D.C.s of Environmental flows for default Environmental Management
Classes; (c) Display of estimated reference and Environmental monthly flow time series.
International Journal of Geology, Earth & Environmental Sciences ISSN: 2277-2081 (Online)
An Open Access, Online International Journal Available at http://www.cibtech.org/jgee.htm
2016 Vol. 6 (1) January-April, pp. 98-113/Sahoo et al.
Research Article
© Copyright 2014 | Centre for Info Bio Technology (CIBTech) 111
(a)
(b)
(c)
Figure 2: Comparison of EF Methods with Calculated EFRs in Different EF Sites
(a) Tikarapada, Mahanadi River,
(b) Naraj Barrage, Kathajodi River,
(c) Birupa Barrage, Birupa River
0
1000
2000
3000
4000
5000
6000
JUN JUL AUG SEP OCT NOV DEC JAN FEB MAR APR MAY
Flo
w i
n c
um
ec
NATURAL FLOW
GEFC S.W.
RVA
SMAKHTIN
VMF
TESSMAN
TENNANT
CALCULATED EFRs
0
500
1000
1500
2000
2500
3000
3500
4000
JUN JUL AUG SEP OCT NOV DEC JAN FEB MAR APR MAY
Flo
w u
n c
um
ec
NATURAL FLOW
GEFC S.W.
RVA
SMAKHTIN
VMF
TESSMAN
TENNANT
CALCULATED EFRs
0
50
100
150
200
250
JUN JUL AUG SEP OCT NOV DEC JAN FEB MAR APR MAY
Flo
w i
n c
um
ec
NATURAL FLOW
GEFC S.W.
RVA
SMAKHTIN
VMF
TESSMAN
TENNANT
CALCULATED EFR
International Journal of Geology, Earth & Environmental Sciences ISSN: 2277-2081 (Online)
An Open Access, Online International Journal Available at http://www.cibtech.org/jgee.htm
2016 Vol. 6 (1) January-April, pp. 90-105/Sahoo et al.
Research Article
© Copyright 2014 | Centre for Info Bio Technology (CIBTech) 112
Figure 3: Comparison of the Six Environmental Flow Methods at the Mahanadi, Kathajodi &
Birupa River
Hence more study is required for gather information regarding the time periods over which stream flow
requirement should be applied.
The main aim of this study is to ensure the minimum value of flow at any circumstances to provide fresh
water to maintain ecological integrity and avoid any degradation of river ecosystem. Lastly, if the excess
water can be stored, then that can be used for further expansion of irrigation land, in industries,
hydropower sector, recreation and many more.
ACKNOWLEDGEMENTS
The authors are thankful to Department of Water Resources, Government of Odisha for providing data for
this study. The authors are also thankful to Nishadi Eriyagama, Water Resources Engineer, International
Water Management Institute (IWMI), Colombo, Srilanka for providing the GEFC software.
REFERENCES
Acreman M and Dunbar MJ (2004). Defining environmental river flow requirements - a review.
Hydrology & Earth System Sciences 8(5) 861-876.
Armstrong DS, Richards TA and Parker GW (1998-99). Assessment of Habitat, fish communities and
streamflow requirements for habitat protection, Ipswich River, Massachusetts. U.S. Geological Survey
Water–Resources Investigations Report 01–4161 72 1 CD-ROM.
Arthington AH and Zalucki JM (edition) (1998). Comparative Evaluation of Environmental Flow
Assessment Techniques: Review of Methods (LWRRDC, Canberra, Australia Occasional Paper 27/98).
ISBN 0642267464.
Caissie D and Jabi E (1995a). Comparison and regionalization of hydrologically based instream flow
techniques in Atlantic Canada. Canadian Journal of Civil Engineering 22(2) 235-246.
Davis R and Hirji R (2003). Environmental flows: Concept and methods. Water Resources and
Environment Technical Note C1, (World Bank, Washington. D.C., U.S.A).
Dyson M, Bergkamp G and Scanlon J (2003). The Essentials of Environmental Flows, (IUCN, Gland,
Switzerland and Cambridge, UK) 118.
Hirji R and Davis R (2009a). Environmental Flows in Water Resources Policies, Plans and Projects.
Natural Resources Management Series. (The World Bank Environment Department, Washington D.C.,
U.S.A).
Hughes DA and Hannart P (2003). A desktop model used to provide an initial estimate of the ecological
instream flow requirements of rivers in South Africa. Journal of Hydrology 270 167-181.
0.00
0.10
0.20
0.30
0.40
0.50
0.60
TIKARAPADA NARAJ BIRUPA
Rati
o o
f an
nu
al
EF
R o
n m
ean
an
nu
al
flow
Name of gauge station(EF Site)
GEFC SW RVA METHOD SMAKHTIN VMF TESSMAN TENNANT
International Journal of Geology, Earth & Environmental Sciences ISSN: 2277-2081 (Online)
An Open Access, Online International Journal Available at http://www.cibtech.org/jgee.htm
2016 Vol. 6 (1) January-April, pp. 90-105/Sahoo et al.
Research Article
© Copyright 2014 | Centre for Info Bio Technology (CIBTech) 113
Jha R, Sharma KD and Singh VP (2008). Critical Appraisal of Methods for the Assessment of
Environmental Flows and their Application in two river systems of India. KSCE Journal of Civil
Engineering 12(3) 213-219.
Joshi KD, Jha DN and Alam A (2014). Environmental Flow requirements of River Sone: Impacts of
low discharge on fisheries. Current Science 107(3) 478-488.
Jowett IG (1989). River Hydraulic and Habitat Simulation, RHYHABSIM Computer Manual. Fisheries
Miscellaneous Report 49, (New Zealand, Ministry of Agriculture and Fisheries, Christchurch).
King JM and Louw D (1998). Instream flow assessments for regulated rivers in South Africa using the
building block methodology, Aquatic Ecosystem Health and Restoration 1 109-124.
King J, Brown C and Sabet H (2003). A scenario-based holistic approach to environmental flow
assessments for rivers. River Research and Applications 19 619-639.
Paster AV, Ludwig F, Biemans H and Hoff H (2014). Accounting for environmental flow requirements
in global water assessments. Hydrology and Earth System Science 18 5041-5059.
Richter BD, Baumgartner JV, Wigington R and Braun DP (1997). How much water does a river
need. Freshwater Biology 37 231-249.
Smakhtin VU (2001). Low flow hydrology: a review. Journal of Hydrology 240(3-4) 147-186.
Smakhtin VU, Revenga C and Doll P (2004). Taking into account environmental water requirements in
global scale water resources assessments. Research Report 2 of the CGIAR, Comprehensive Assessment
Programme of Water Use in Agriculture, IWMI, Colombo.
Smakhtin VU, Shilpakar RL and Hughes DA (2006). Hydrology-based assessment of environmental
flows: an example from Nepal. Hydrological Sciences Journal des Sciences Hydrologiques 51(2).
Smakhtin VU and Anupthas M (2006). An assessment of environmental flow requirements of Indian
river Basins, IWMI Research Report 107.
Smakhtin VU and Eriyagama N (2008). Developing a software package for global desktop assessment
of environmental flows. Environmental Modelling & Software 23(12) 1396-1406.
Stewardson MJ and Gippel CJ (1997). In: Stream Environmental Flow Design: A Review. Draft report,
(Cooperative Research Centre for Catchment Hydrology, Department of Civil and Environmental
Engineering, University of Melbourne: Victoria, Australia).
Tennant DL (1976). Instream Flow Regimes for Fish, Wildlife, Recreation and Related Environment
Resources. Fisheries 1(4) 6-10.
Tharme RE (2003). A global perspective on environmental flow assessment: emerging trends in the
development and application of environmental flow methodologies for rivers. River Research and
Applications 19 397-441.