Environmental Geochemistry of Soils and Stream Sediments from
Anka and Birnin-Gwari Artisanal Gold Mining Areas, NW Nigeria
© This copy of the thesis has been supplied on the condition that anyone who consults it is
understood to recognize that its copyright rests with the author and that use of any
information derived there from must be in accordance with current UK Copyright Law. In
addition, any quotation or extract must include full attribution.
Nuhu Musa Waziri
Submitted in candidature for the degree of Doctor of Philosophy
University of East Anglia
School of Environmental Sciences
September, 2012
2
Abstract
Environmental Geochemistry of Soils and Stream Sediments from Anka and Birnin-Gwari
Artisanal Gold Mining Areas, NW Nigeria
By
Nuhu Musa Waziri
The geochemistry of surface soils and stream sediments from two areas in the north-
western Nigeria Schist Belt was studied in order to assess the environmental impact of
artisanal mining of quartz-gold-sulfide mineralization. XRF determination of total
elemental concentration was carried out, along with sequential extraction procedures
(SEPs) and in vitro bioaccessibility tests using ICP-AES. The results show that the soils in
both the Anka and Birnin-Gwari area are highly enriched in silica, zirconium and markedly
depleted in base cations due to intense tropical weathering. The results further show that
artisanal mining has only caused severe contamination, especially with respect to Pb and
Cu, in the Anka area, highlighting the importance of mineralogical differences in the ore
deposits. Most trace elements partition strongly into the carbonate and Fe/Mn oxides
fractions in samples from the Anka area, indicating possible risk of mobilization under
reducing, slightly acidic conditions; the exchangeable phase being the least significant in
both areas. Very high bioaccessibility values, which correlate strongly with the sums of the
SEP steps, were obtained for Pb, Cu and to a lesser extent, As and Mn in soils of the Anka
area and the minimal risk levels and tolerable daily intakes are greatly exceeded. Low pH
was found to enhance the bioaccessibility of Pb, Cr and Cu, while rising pH appears to
favour the release of As. Only the bioaccessibility of Cr was found to change with the
length of extraction time and the ratio of the mass of sample to extraction fluid volume
only affects the extraction of As. The results show significant human health risks, mostly
in the Anka area due to processing of ores and improper disposal of tailings. Ore
processing at the mine sites and an end to using the tailings as construction materials may
reduce the exposure of the local population to potentially toxic elements.
3
Acknowledgements
All praise is due to Allah, by whose favour good works are accomplished.
This work has benefitted in no small measure from the input of very seasoned academics,
who as members of my supervisory team guided the conduct of the research from the
beginning to the end. I would like to sincerely thank my Primary Supervisor, Professor
Julian E. Andrews for ensuring the work remains on track and for his painstaking editorial
input throughout the writing up period. I am also grateful to Professor Alastair Grant,
especially for his advice with multivariate statistical treatment of data and very useful
comments and suggestions on the draft chapters.
Liz Claxton and her team of laboratory technicians have been very supportive during the
period of my study. I am particularly grateful to Bertrand Leze, Graham Chilvers, Judith
Mayne, Dr. John Brindle, Jenny Stevenson, Emily Shear (now of Cambridge University),
Chris Barkway and Simon Ellis for all the help they rendered.
This research would not have been possible without funding from the Petroleum
Technology Development Fund (PTDF), under the Overseas Scholarship Scheme and a
Study Fellowship from the Federal University of Technology (FUT), Minna, both, organs
of the Federal Government of Nigeria. I will forever remain indebted for this great
opportunity.
Let me acknowledge the support of my colleagues at the Geology Department of FUT
Minna and here in UEA. I am very grateful to Abubakar Sule (SCVA, UEA) and his
family for their support, especially with respect to caring for Sumayya during the difficult
times of her mum’s illness and Kabir Isa for his help with fieldwork. I am also grateful to
Dr. Paulette Posen (formerly of UEA) and Nadia Khalaf (SCVA, UEA) for help with
ArcGIS and Rachel Snow for her help with the diaries.
Finally, I am immensely grateful to all members of my family, too numerous to name here,
for the prayers, well wishes and untiring support and encouragement I have always
received from them. For the sake of brevity, I would like to single out for thanks, my wife,
Nafisatu and our daughter, Sumayya for their sacrifices and especially, for having to
endure my absence for long periods.
4
Table of contents
Abstract 2
Acknowledgements 3
List of Tables 8
List of Figures 9
Chapter One: Introduction and Literature Review 11
1.1 Background 11
1.2 Aim of the work 14
1.3 The Study Area 14
1.3.1 Location and General Geography 14
1.3.2 Geology of the Study Area 16
1.3.2.1 Regional Setting 16
1.3.2.2 Local Geology and Mineralization 18
1.4 Heavy Metals in the Environment 22
1.4.1 Routes of Entry of Heavy Metals into Soil 22
1.4.2 Sediments and Contaminant Transport 25
1.4.3 Mobility and Toxicity of Heavy Metals 30
1.4.4 Sequential Geochemical Extraction Tests 31
1.4.5 In vitro Bioaccessibility Tests 32
1.5 Thesis outline 34
Chapter Two: Methodology 35
2.1 Introduction 35
2.2 Fieldwork 35
2.3 Sample Preparation 39
2.3.1 Drying 39
2.3.2 Disaggregation and Sieving 39
2.4 Determination of pH 41
5
2.5 Determination of Organic Matter Content 41
2.6 Powder X-ray Diffraction Analysis 42
2.7 Scanning Electron Microscopy 42
2.8 X-ray Fluorescence Spectrometry 44
2.9 Sequential Extraction Procedures 48
2.9.1 Introduction 48
2.9.2 Exchangeable Fraction 48
2.9.3 Carbonate Fraction 48
2.9.4 Fe-Mn Oxides Fraction 49
2.10 In vitro Bioaccessibility Tests 50
2.10.1 The Effect of pH on In vitro Bioaccessibility 51
2.10.2 The Effect of Solid : Fluid Ratio on In vitro Bioaccessibility 52
2.10.3 The Effect of Incubation Time on In vitro Bioaccessibility 53
2.11 Inductively Coupled Plasma-Optical Emission Spectrometry 53
2.12 Statistical and Graphical Treatment of Data 54
Chapter Three: Results: Bulk Soil and Sediment Geochemistry 55
3.1 Introduction 55
3.2 Mineralogy and Major Elements Geochemistry 55
3.3 Trace Elements Geochemistry 64
3.3.1 Enrichment Ratios 70
3.3.2 Indices of Geoaccumulation 72
3.4 Geochemical Association 76
3.4.1 Correlation Analysis 76
3.4.2 Principal Component and Cluster Analysis 78
3.5 Chapter Summary 85
6
Chapter Four: Geochemical Partitioning of Heavy Metals 87
4.1 Introduction 87
4.2 Exchangeable Fraction 88
4.3 Carbonate Fraction 93
4.4 Fe-Mn Oxides Fraction 97
4.5 Recovery and Relative Mobility 100
4.6 Chapter Summary 106
Chapter Five: In vitro Bioaccessibility of Heavy Metals 109
5.1 Introduction 109
5.2 Bioaccessibility 109
5.2.1 Human Bioaccessibility 111
5.2.2 Correlation Analysis 115
5.3 Physicochemical Controls on In vitro Bioaccessibility 117
5.3.1 Effect of pH 118
5.3.2 Effect of Incubation Time 122
5.3.3 Effect of Sample Mass: Extraction Fluid Volume 126
5.4 Contaminant Daily Intake 130
5.5 Chapter Summary 133
Chapter Six Conclusions and Further Studies 136
6.1 Conclusion 136
6.2 Further Studies 141
References 143
Appendices 153
Appendix1 Location and description of samples 153
Appendix2 Test of XRF measurement accuracy 156
Appendix3 Major elements concentration (wt. %) in soils and sediments
from the Anka area. 157
7
Appendix 4 Trace elements concentration (µg g-1
) in soils and sediments
from the Anka area. 158
Appendix 5 Major elements concentration (wt. %) in soils and sediments
from the Birnin-Gwari area. 160
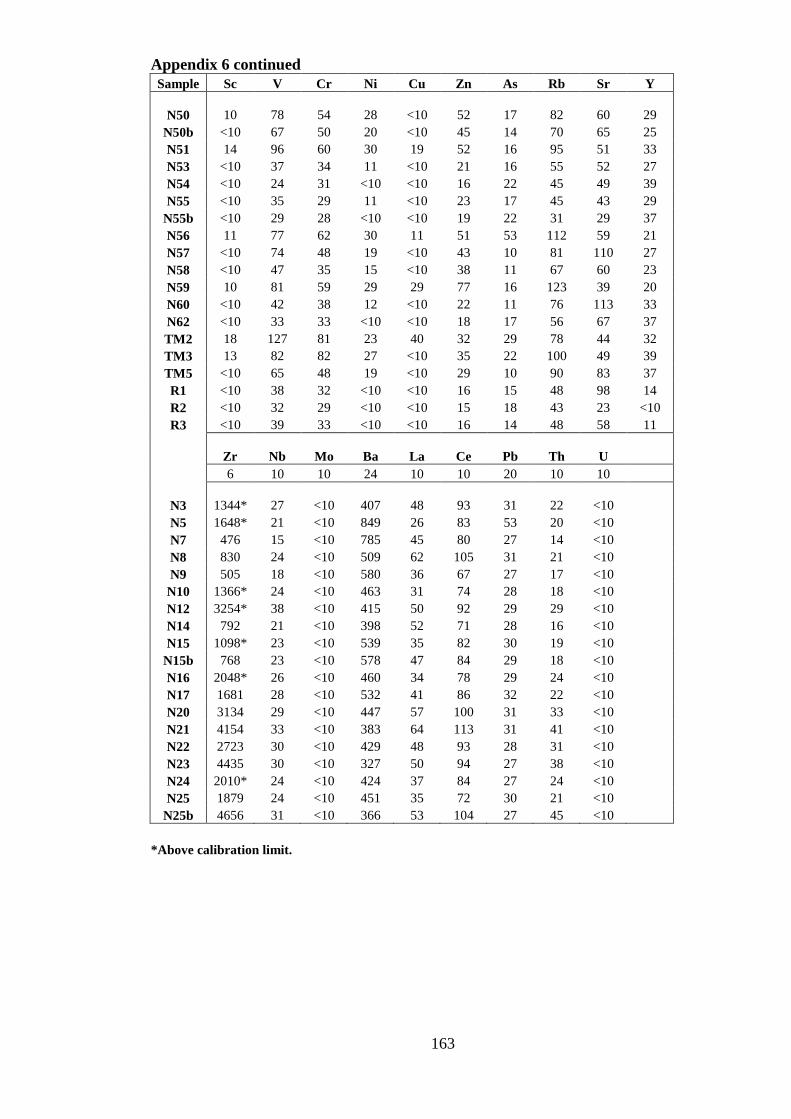
Appendix 6 Major elements concentration (µg g-1
) in soils and sediments
from the Birnin-Gwari area. 162
Appendix 7 Enrichment ratios for trace elements in soils and sediments
from the Anka area 165
Appendix 8 Indices of geoaccumulation of trace elements in soils and
sediments from the Anka area 165
Appendix 9 Enrichment ratios for trace elements in soils and sediments
from the Birnin-Gwari area 169
Appendix 10 Indices of geoaccumulation of trace elements in soils and
sediments from the Birnin-Gwari area 172
Appendix 11 Geochemical partitioning data (µg g-1
) for selected trace
elements in soils and sediments from the Anka area 175
Appendix 12 Geochemical partitioning data (µg g-1
) for selected trace
elements in soils and sediments from the Birnin-Gwari area 179
Appendix 13 In vitro bioaccessible concentration (µg g-1
) of selected trace
elements in soils and sediments from the Anka area 182
Appendix 14 Effect of pH on the in vitro bioaccessibility (µg g-1
) of selected
trace elements in soils and sediments from the Anka area 183
Appendix 15 Effect of incubation time on the in vitro bioaccessibility (µg g-1
)
of selected trace elements in soils and sediments from the Anka area 185
Appendix 16 Effect of solid: fluid ratio on the in vitro bioaccessibility (µg g-1
) of
selected trace elements in soils and sediments from the Anka area 186
8
List of Tables
1 Reproducibility of SEPs measurements 51
2a Summary statistics of major and trace element concentrations in
soils and sediments from the Anka area 63
2b Summary statistics of major and trace element concentrations in
soils and sediments from the Birnin-Gwari area 64
3 Summary of enrichment ratios 72
4 Classes of the index of geoaccumulation 73
5 Summary of the indices of geoaccumulation 75
6 Total variance explained for elements in soils and sediments from
Anka and Birnin-Gwari areas 80
7a Rotated component matrix for elements in soils and sediments from
Anka area 83
7b Rotated component matrix for elements in soils and sediments from
Birnin-Gwari area 84
8 Percentage of potentially toxic elements recovered from the three steps
sequential extraction procedures 103
9 In vitro bioaccessibility of potentially toxic elements in soils and
sediments from Anka area 113
10 Repeat measures ANOVA results for the effects of physicochemical
parameters on in vitro bioaccessibility of potentially toxic elements 120
11 Estimated chemical daily intake (CDI) for children living in the mining
contaminated villages in the Anka area 132
9
List of Figures
1 Average blood lead level in children in two villages of Anka area
contaminated by artisanal gold mining 13
2 Outline map of Nigeria showing the location of the two study areas 15
3 Outline geological map of Nigeria 17
4 Some common rock types in the two areas 20
5 Pathways of contaminants into the environment from artisanal gold
mining in the study areas 24
6 Ephemeral stream near Tsofon Birnin-Gwari showing the variation of
flow during the wet and dry seasons 27
7 Transport of contaminant and human exposure pathways for
potentially toxic elements in the study area 29
8a Map of the Birnin-Gwari study site showing sampling sites and
location of some mine pits 37
8b Map of the Anka study site showing sampling sites and location of
some mine pits 38
9 Summary of the analytical procedures used in this work 40
10 SEM micrograph with EDS spectra for a highly contaminated soil
sample from Anka area. 43
11 Plot of measured versus certified concentrations of elements in three
reference materials used in XRF analysis 46
12 Plot of RSD values showing the precision of the replicate in vitro
bioaccessibility tests 53
13 Non-normal nature of the distribution of trace element data 57
14 Powder X-ray diffraction patterns for two samples from Anka area 60
15 Correlation of Cu and Ba concentration in samples from Anka area 70
16 Plot of indices of geoaccumulation for Pb and Cu in samples from the
Anka area 76
17 Dendrogram showing the results of cluster analysis performed on the
Anka data 85
18a Partitioning of potentially toxic elements in three labile phases in soils
and sediments from the Anka area 91
10
18b Partitioning of potentially toxic elements in three labile phases in soils
and sediments from the Birnin-Gwari area 95
19 SEM micrograph and EDS spectra of a fine galena particle in a sample
from the Anka area and its chemical signature 106
20 Plot of total and in vitro bioaccessible concentration of Pb and Cu
concentrations in selected samples from Anka area 111
21 Correlation between in vitro bioaccessible and SEP concentrations of Pb 118
22 Effect of pH on the in vitro bioaccessibility of potentially toxic elements
in soils and sediments 121
23 Effect of incubation time on the in vitro bioaccessibility of potentially
toxic elements in soils and sediments 125
24 Effect of solid: fluid ratio on the in vitro bioaccessibility of potentially
toxic elements in soils and sediments 129
11
Chapter One
Introduction and Literature Review
1.1 Background
The environmental and health implications of mining have long been studied and scientific
literature (e.g, Kelly, 1988; Thornton, 1996; Dudca and Adriano, 1997; Lottermoser, 2007;
Plumlee and Morman, 2011) is full of documented cases of damage to the environment and
human health directly linked to mining related pollution. Since the advent of civilization,
we have continually exploited minerals and rocks for the production of goods, energy and
building materials (Hudson-Edwards et al., 2011) with its attendant environmental
consequences. Base metal mining results in a variety of wastes, ranging from host rock
debris and its associated gangue minerals, dusts from milling, to slags resulting from
smelting operations. These, often potentially toxic element (PTE, Alloway, 1995) laden
wastes serve as sources of contamination of the environment and provide pathways for
human exposure. In many parts of the world, metalliferous mining activities have been
shown to lead to heavy metal contamination of soils, sediments and water (Adriano, 1986;
Thornton, 1996; Jung, 2001; Bird et al., 2003; Dolenec et al., 2007). Heavy metal in soil is
one of the environmental problems resulting from mining on a global scale.
In the Tsofon Birnin-Gwari and Anka regions and many other parts of Nigeria, exploitation
of gold and associated sulfide minerals by artisans is a common practice and is thought to
introduce associated PTEs into the soils and stream sediments in the area. Environmental
problems related to artisanal gold mining are widely reported in the developing world, for
example, Ghana (Hilson, 2002; Babut et al., 2003); Ecuador (Appleton et al., 2001) and the
Brazilian Amazon (Hinton et al., 2003). As a result, elevated levels of the PTEs may be
found in and around the metalliferous mines due to the dispersion of mine wastes down
slope by surface runoff, wind action and effluent drainage into nearby soils and open water
systems (Jung, 2001). One implication of having excessive levels of these elements in soils
12
is that crops may take them up and pass them through the food chain to human beings.
Another route of transmission to humans, especially children, is hand to mouth ingestion,
in addition to contamination of surface and groundwater resources and inhalation of dusts.
These elements are known to be toxic to plants (Radojevic and Bashkin, 1999; Berman,
1980) and animals if taken up beyond certain limits. They pose potential health risk to
local residents, because they can accumulate in the body to cause heavy metal poisoning.
Little, if anything has been done to investigate the environmental impact of artisanal gold
mining in general and soil heavy metal concentrations and bioaccessibility in these areas of
Nigeria. Most previous work in the area has focused mainly on the geology (e.g. Russ,
1957; Truswell and Cope, 1963; McCurry and Wright, 1977; Ogezi, 1977; Holt et al.,
1978; Rahman and Ocan, 1978; Turner, 1983; Fitches et al., 1985) and mineralization
(Woakes et al., 1987), especially in relation to gold occurrences or deposits (Russ, 1957;
Garba, 2000; 2002; 2003; Danbatta et al., 2009) to mention but a few. Not much attention
has been paid to the possible implications of artisanal gold and base metal mining in the
area and the effect it will have on the quality of the environment and human health. It is
often viewed by many as a small-scale industry, incapable of posing any significant
environmental and human health risks. As pointed out by Olade (1987), most studies on
the biogeochemical cycling of heavy metals have been within temperate or sub-tropical
ecosystems and therefore little is known about their behavior in the semi-arid tropics, such
as northern Nigeria. A recent outbreak of acute lead poisoning among rural dwellers of the
Anka area, which killed hundreds of children (UNEP/OCHA, 2010) has been traced to
activities of the locals who try to extract gold from a mainly galena-chalcopyrite ore
deposit. In fact, the work conducted by UNEP reported concentrations of up to 60,000 µg/g
lead in the soil of some villages while the Blacksmith Institute (2011) reported soil lead
concentrations in seven villages to be in excess of 100,000 µg/g, resulting in blood lead
13
levels in children generally exceeding the internationally acceptable limit of 10 µg/dl
(Fig.1).
Figure 1 Average blood lead levels (µg/dl) in children in two villages of Anka area,
north-western Nigeria contaminated by artisanal gold mining over seven months in
2010 (from Blacksmith Institute, 2011)
It is therefore vital to study the effect of these small-scale mines on the quality of the
environment and the possible human health risks incident upon potentially toxic element
contamination of soils and sediments in the area. To address this gap, the present work has
investigated the geochemistry of soils and sediments from Anka and Birnin-Gwari areas
within the north-western Nigeria schist belts, both famous for artisanal gold mining. The
work involved the determination of the spatial distribution of the elements in soils and
sediments, along with their geochemical partitioning in different solid phases, which is a
measure of their mobility. Their relative in vitro bioaccessibility was estimated using
physiologically-based extraction tests.
BL
L(µ
g/d
l)
14
1.2 Aim of the work
The aim of this work is to assess the environmental and human health risks posed by
artisanal mining in parts of the Nigerian north-west region. The geochemistry of soils and
stream sediments in two mining areas was studied in terms of the total contaminant
distribution, comparing the concentration with reference values in order to determine the
extent of contamination. Geochemical mobility and relative bioaccessibility were estimated
using sequential extraction procedures (SEPs) and in vitro extraction procedure.
1.3 The Study Area
1.3.1 Location and general geography
The Tsofon Birnin-Gwari study area (Fig. 2) is located in Birnin-Gwari local government
area of Kaduna state in north-western Nigeria. It lies between latitude 10o55’N and
11o05’N and longitude 6
o45’E and 6
o52’E. The altitude of the area ranges from 518.16 m
to 712.28 m above mean sea level and is traversed by the Birnin-Gwari/ Funtua road. The
area, which covers about 226 km2
, is characterized by granitic inselbergs and roughly
north-south trending ridges, often in conformity with the general trend in the Nigerian
Basement Complex. It is drained mainly by the Kureta and Gora Rivers which are fed by a
number of other tributary channels such as the Baigado and Abuya Rivers (FSN, 1967).
15
Figure 2 Outline map of Nigeria showing the location of the two study areas. Detailed
maps of the areas are presented in Figure 8 (modified from DivaGIS).
The second site which lies to the northwest of the Birnin-Gwari site (Fig.2) and covering
about 990 km2 is in the Anka local government area of Zamfara state also in the north-
western part of Nigeria. It falls between latitude 11o51’N and 12
o08’N, and longitude
5o51’E and 6
o08’E and is characterized by generally gentler relief compared to the Tsofon
Birnin-Gwari area. The main surface water body in the area is the Anka River, which lies
about a kilometer to the north of the town from which it derives its name, but there are
numerous seasonal streams or channels which cut the entire landscape that feed into the
main river and many are used as sources of water for domestic use, irrigation and livestock
watering, especially during the wet season. A small number of these streams, such as the
one at Abare village were observed to remain running well into the dry season. Vegetation
in the entire region is generally sparse, and has been described by Russ (1957) as savannah
16
forest together with scrubs, which thin out in a northerly direction, with semi- deciduous
high forests along streams and depressions. Generally, the inhabitants of this area are
farmers, who are engaged in the cultivation of a large number of cereal and vegetable
crops.
1.3.2 Geology of the study area
1.3.2.1 Regional setting
The study area is in the schist belt of the Nigerian basement complex which is part of the
Pan-African mobile belt, sandwiched between the West African craton and the Congo
Craton. This Neoproterozoic to early Phanerozoic belt is covered in many places by
Cretaceous and younger sedimentary rocks. It has been described by McCurry and Wright
(1977) as a system of synclinorial belts of low-grade metasediments downfolded into high-
grade gneisses and migmatites, the whole intruded by batholitic granites. This was further
explained by Woakes et al., (1987, Fig. 3) who summarized the major geologic units in the
area to include a polycylic metamorphic migmatite- gneiss basement, with entrained supra-
crustal remains, ranging in age from Archaean (2700 Ma) to Palaeoproterozoic (2000 Ma).
This suite of rocks which constitutes about 60% of the Nigerian basement (Rahman and
Ocan, 1978) consisting of gneisses, migmatites and quartzites is of medium to high grade
amphibolite facies metamorphism. It is followed upwardly by the low- grade, deformed
schist belts developed mostly in the western flanks of Nigeria. These upper Proterozoic
generally north-south trending belts, have been infolded into the migmatite- gneiss
basement complex. Metamorphism in these belts is generally of low grade, falling within
the green-schist facies and characterized mainly (Turner, 1983) by schists, phyllites,
banded iron formations, carbonate rocks and mafic metavolcanics which are now in the
form of amhibolites and meta-conglomerates. These and the migmatite-gneiss basement
have been cut by Pan-African granites. The syn- to late tectonic igneous intrusions include
mainly granites, granodiorites, diorites and some gabbro, syenites and charnokites. Some
17
unmetamorphosed volcanic and hypabyssal rocks dated as late Pan-African by McCurry
and Wright (1977) overlie or intrude the basement rocks in the Anka area of north-western
Nigeria.
Figure 3 Outline geological map of Nigeria. The Anka (2) and Kushaka (7) Schist
Belts in the box at the top left have been described in this work as the study sites.
Reproduced from Woakes et al. (1987) with permission from Elsevier Limited,
Oxford.
18
1.3.2.2 Local geology and mineralization
The study sites for this work lie within the Anka and Kushaka schist belts of north-western
Nigeria. These belts although of different ages, have generally similar lithologies (Fig.
3&4a-c) and mineral paragenesis. They have both, like many other similar belts in Nigeria
and the entire West African region been the focus of artisanal gold exploitation for several
decades.
The Anka schist belt is the more westerly of the two and Holt et al. (1978, in Turner 1983)
has summarized the lithology in the area to include metaconglomerates, sandstones, slates,
phyllites and acid violcanics. According to Turner (1983), the metaconglomerates form
units of up to 150-200 m, interbedded with feldspathic metasandstones and contain
rounded to angular fragments of granites, quartzites, quartz, phyllites and volcanics.
Fitches et al. (1985) report that the belt is composed chiefly of poorly exposed,
homogenous quiet-water argillites, associated with coarse clastics and a province of acid-
intermediate volcanic and intrusive rocks. The coarse clastics are said to generally overlie
the argillites, but are intercalated with the latter in the lower parts of the coarse clastic
layers (Fitches et al., 1985). The coarse clastics in the form of green and purple grits
interbedded with shales and siltstones predominate in the eastern flanks of the belt,
whereas in the west, phyllites are the dominant lithology (Turner, 1983). The age of this
belt is not very certain, but Turner (1983) has reported a Rb/Sr date of 450±50Ma obtained
by Ogezi (1977) as placing the metamorphism in the late Pan-African.
As with the other schist belts in the western part of Nigeria, gold and sulfide mineralization
have been identified and exploited in the Anka area. Gold in this area is hosted by schists,
phyllites and quarzites related to sub-regional structural elements subsidiary to the Anka
fault (Garba, 2003) and metaconglomerates (Russ, 1957). The gold mineralizing fluids
were interpreted, based on Na2O/Al2O3-K2O/Al2O3 discrimination diagram and inter-
lithophile elements ratios to be of metamorphic origin (Danbatta et al., 2009). The
19
mineralized concordant veins are generally short, not exceeding half a kilometre of strike
length and trace metal concentration in altered wall rock reported by Garba (2003) of 647-
5410 ppm Cu; 7550-22600 ppm Pb; 1.5-8.6 ppm Ag and 123-6320 ppb Au show that the
ores are very rich in lead and copper minerals, mostly galena which has been observed
during field work and also chalcopyrite.
The Kushaka schist belt on its part is characterized by a number of curved schist belts. It is
underlain mainly by semi-pelitic biotite muscovite schist, along with phyllites,
metasiltstones and graphitic schists (Turner, 1983). Interbedded with these units is a
banded iron formation and the thick amphibolites in part of the area have been interpreted
by Turner as indication of large volcanic accumulation. Truswell and Cope (1963) have
described the rocks in the area as lying in a number of N-S trending isoclinal fold
structures; pelitic metasediments been the dominant lithology, with the presence however
of both psammites, pelites and amphibolites. The metasediments in this area, like those in
the other belts have been extensively invaded by granites and granodiorites of the Pan-
African series and the belt has been placed by Turner (1983) in the Kibaran (1100 ± 200
Ma). The granites were observed to form very prominent geomorphological features
especially in the southern part of the study area, while to the north-west, the older
migmatite-gneiss basement outcrops. According to Garba (2000) the entire sequence in this
area has been cut and displaced by the NE-SW trending Kalangai transcurrent fault.
20
Figure 4 Some common rock types in the study area: (a) slumping schist blocks on the
banks of Kureta river near Tsofon Birnin-Gwari, showing original bedding; (b)
outcrops of the older granites near the village of Jenruwa, south of Tsofon Birnin-
Gwari and (c) schist and quartzite exposed in artisanal mine east of Dareta village in
the Anka area (Photos by author).
21
The Tsofon Birnin-Gwari area which is in the Kushaka schist belt is associated with
extensive mineralization. Woakes and Bafor (1983) have named it as one of the areas
associated with gold mineralization within the Nigerian schist belt. Elueze (1981a) and
Bafor (1981) reported the presence of sulphide minerals in the schist belts. The Tsofon
Birnin-Gwari (TBG) gold-sulphide-quartz reef mineralization is the most extensive in
Nigeria with a strike length of over 7 km and the mineralization is hosted by graphitic and
micaceous phyllites of the Kushaka schist belt of the northwestern Nigeria Pan-African
(600 ± 150 Ma) terrane (Garba, 2002). The mineralization appears to lie in several narrow,
near parallel shear zones, exploiting strong vertical foliation parallel to the axial planes of
the fold structures (Garba, 2000). The mineral deposits, especially gold, have over the
years been exploited by small-scale mining outfits. The Tsofon Birnin-Gwari area has had
active gold mines since the 1930s and was reported to have yielded over 600 ounces (over
17kg) of reef and alluvial gold between 1932 and 1940 using the cyanide process (Russ,
1957). This, and the neighboring Kwaga site are still been exploited by artisanal miners.
Gold in this area is generally associated with pyrite and minor sphalerite, chalcopyrite,
pyrrhotite, galena and magnetite (Garba, 2003), with quartz, potassic feldspar and
carbonaceous matter constituting the gangue minerals.
22
1.4 Heavy Metals in the environment
One of the major environmental problems in parts of the world at present is the high levels
of heavy metals in soils and other components of the environment. The term “heavy
metals” describes a group of metallic elements and metalloids with considerably high
densities- typically exceeding 6g/cm3. Elements such as arsenic, cadmium, chromium,
copper, lead, mercury, nickel and zinc have been shown to be toxic to both human beings
and plants, in spite of some of them being essential elements.
1.4.1 Routes of entry of heavy metals into soil
There are various ways by which heavy metals find their way into soils. According to
Ward (1995), soils and sediments are considered as sinks for trace elements (including
heavy metals), and therefore they play an important role in the environmental recycling of
elements. The routes of entry have been classified into two broad categories-namely,
natural and cultural (anthropogenic).
Naturally, heavy metals are introduced into soils through the weathering of rocks.
According to Olade (1987), the overall abundance of trace elements in surficial materials
depends initially on their concentrations in bedrocks and mineralized zones. Rocks are
aggregates of minerals and the minerals are composed of certain elements including heavy
metals. Weathering processes release these metals from the mineral systems and they end
up in the environment as metal solutions in surface water, solids, and suspensions or
adsorbed to soil particles (Fifield, 1995). Soils overlying certain rock types are generally
richer in heavy metals. For example, the chromium content of soils overlying chromite
bearing rocks (serpentinites) is higher than other soils, and a similar situation exists for
lead in galena rich areas (Radojevic and Bashkin, 1999).
23
Cultural or anthropogenic sources of heavy metal pollution are linked to the activities of
man. Mining is one such human activity which introduces metals into the environment.
Because of the large volumes of materials handled, mining and smelting activities give rise
to varying degrees of contamination of soil, air and water that lead to perturbations in the
cycling of metals in the surficial environment (Thornton, 1996). Ciccu et al. (2003) have
pointed at acid mine drainage, tailing embankments, mining rock dumps and metallurgical
waste piles as some of the sources of pollution, posing serious threats to the environment.
The gradual abandonment of mines and the lack of maintenance or failure to adopt
appropriate safety measures have increased the risk of pollution spreading to areas far
removed from the mining sites. Mining introduces contaminants, including PTEs into the
environment through low grade ore, overburden and barren rocks heaps; tailings heaps and
acid mine drainage, especially where sulfide-bearing mine tailings are involved (Anju and
Banerjee, 2010).
The type and abundance of contaminants from mines is directly linked to the geologic
characteristics of the deposit being mined and type of host rock, local climatic conditions
and the processing methods and chemicals used (Lottermoser, 2010; Plumlee and Morman,
2011). For example, in humid environments acid mine drainage (AMD) is generated by
the oxidation of sulfide-bearing minerals in mine wastes exposed to weathering conditions,
resulting in low quality effluents characterized by acidic pH and a high level of dissolved
metals (Razo et al., 2003).
24
Figure 5 Pathways of contaminant elements into the environment from artisanal
mining in the study area: a; abandoned mine pit, b; mineralized rock moved in sacks
to processing sites, c; crushing and grinding mineralized rock in order to extract ore,
and c; using gravity method along a stream channel to separate minerals in a slurry
of powdered rock (Photos a, b and c are by the author; d, courtesy of Kabir Isa).
25
In artisanal gold mining areas of the world, the indiscriminate use of amalgamation to
separate gold from associated minerals has been widely blamed for the introduction of
mercury into the environment (Appleton et al., 2001; Hinton et al., 2003; Babut et al.,
2003, Wu et al., 2011). In drier climates however, the problem is not much about AMD,
but the movement of contaminants through fluvial and aeolian processes (Razo et al.,
2003). Artisanal mining and beneficiation methods, such as those shown in Figure 5 (a-d)
above are often very crude and under little or no regulation at all, leading to widespread
improper disposal of mine wastes and contamination (Hilson, 2002).
1.4.2 Sediment and contaminant transport
Sediment transport is an important means through which contaminants are moved mostly
in clastic form, but also hydromorphically from source to areas where their ecological and
human health risks are felt. Erosion and transport of contaminated soils ensure that
contaminants are taken to areas far away from their source environment (Breshears et al.,
2003) and this has implication for human exposure pathways. The sparse vegetation cover
in semi-arid environments, such as the study area for this work, which is, in itself a result
of scant precipitation in the area, provides little, if any protection to soils against the
erosive action of wind and water.
Both water and wind transport operates in much the same way, involving in the first
instance detachment of soil particles by water or wind action. The detached particle is
subsequently transported either as overland flow or aerosol movement and eventually
deposited when the water and wind velocities drop (Breshears, 2003). In semi-arid
environments, the process is event-based, often triggered, especially for water transport, by
occasional intense weather phenomena such as a storm, although wind transport may be a
more frequent occurrence compared to intense rainfall events.
26
Fluvial transport in this area is expected to be dominated by overland runoff during
rainfall. Rainfall may not be regular in the area, but when it occurs, it is very intense and
the erosive effectiveness of the rain is exacerbated by the intensity and the sparse
vegetation cover of hill slopes: rapid run off results even from low rainfall events (Tooth,
2000). The dominance of overland run off makes it easier to move particles down slope
and into temporary storage within the mostly ephemeral streams that are common features
of the area. Once within the ephemeral channels, contaminated particles are further
transported downstream either as bed load or as suspension within the water column
depending on the energy of the transporting medium, particle characteristics and the nature
of the stream bed. These streams carry very high sediment loads due to abundant supply
from overland run-off and bed scouring and the concentration of sediment in the water
increases as the flood discharge increases (Mather, 2007).
27
Figure 6 An ephemeral stream near Tsofon Birnin-Gwari: (a) dry stream channel;
(b) the same channel upstream of location (a) few days later following some rainfall
events. Rocks and vegetation on the stream bed provide the roughness needed for
turbulent flow, thus enhancing sediment entrainment (Photos by the author).
28
High energy, turbulent flows over rough stream beds (Fig. 6) are better able to keep more
particles, especially medium to fine fractions suspended within the water column and
therefore transported longer distances compared to quieter laminar flow which moves
sediments mainly by traction. The streams often overflow their banks, and when the energy
of the transporting medium wanes, deposit the suspended fine contaminated load along
floodplains as permanent deposits where they impact on soil, surface and ground water
quality (Hudson-Edwards, 2000), or until they are recycled by future flood events.
According to Razo et al. (2004) heavy rain falls during short rainy seasons contribute
largely to the dispersion of pollutants in a very extensive area, in this way impacting not
only streambeds and water bodies but also agricultural fields and urban soils. Physical
dispersion and dissolution of minerals from waste rock and tailings repositories are very
important pathways of contaminants (Fig. 7) into surrounding environments (Lottermoser
and Ashley, 2005; Lottermoser et al., 2005) with the possibility of long term off-site
release of contaminants (Lottermoser, 2010).
Wind transport has the potential to move contamination over longer distances distributing
it over wide areas, due on the one hand, to the multidirectional nature of wind flow and on
another, the ability to move finer particles vertically as a suspension (Breshears et al.,
2003), especially in drier climatic regions. According to EPA (2005), the amount of a
contaminant to be re-suspended by wind erosion is a function of the moisture content of
the soil, vegetation cover and wind velocity; along with particle size, contaminant
concentration in the soil and the areal extent of the contamination.
29
Figure 7 Transport to the environment and main human exposure pathways for
potentially toxic elements in the study area (modified from Kelly, 1988)
Irrespective of the transport mechanisms, mine-related contaminants will almost inevitably
get to populations living in an area through a number of pathways (Fig.7). Plumlee and
Morman (2011) have summarized the pathways to include hand-to-mouth ingestion,
inhalation and consumption of food grown on contaminated soils as well as drinking
contaminated water. Exposure to heavy metals is normally chronic due to food chain
transfer, however acute poisoning through ingestion or dermal contact though rare is
possible (USDA, 2000). Hand-to-mouth ingestion and inhalation of fine particles have
been blamed for recent acute lead poisoning in villages contaminated with mine wastes in
Anka area of north-western Nigeria due to extensive dispersion of lead dust in the villages
during grinding of the ore into fine powders (UNEP/OCHA, 2010). This is likely to
continue for a long time, in spite of remediation attempts made by the authorities because
30
the villagers reportedly use the contaminated powders as building materials for their
dwellings, thus turning their homes into contaminant repositories. This is similar to the
scenario reported in Kabwe, Zambia (WMC, 2006; Brannan, 2008 quoted by Plumlee and
Morman, 2011) where the soils and sediments in the city were heavily contaminated with
lead due to mining and processing of lead-zinc ores, leading to serious lead poisoning in
children.
1.4.3 Mobility and Toxicity of heavy metals
The geochemical mobility of heavy metals is controlled by a number of factors. Forstner
(1987) has identified pH, redox potential and the presence of organic chelators as
environmental conditions controlling the movement of heavy metals. For example, in low
pH soils and sediments, heavy metals are thought to be more mobile and therefore their
bioavailability and toxicity is enhanced. Soil type plays an important role in this regard.
The metals are more easily transported and taken up by plants in coarse grained soils than
in the finer grained types (RCEP, 1996). The low mobility rate of metals in fine grained
soils such as silt and clay may be due to the soils organic content and the net negative
charges on the soil particles. According to Singh et al. (1999), metals are generally
believed to associate more with finer grained soils due mainly to sorption, co-precipitation
and complexing of the metals on particle surfaces and coatings. Smaller grains have a
larger surface area: volume ratio and therefore show higher concentrations of metals. Clay
minerals may contain low levels of trace elements as structural components but their
surface properties (area and electrical charge) play a vital role in regulating the buffer and
sink properties of soils (Ward, 1995). Sharma et al. (2000) have also reported positive
relationship between metal concentration and smaller soil particles, with the silt-clay
fraction showing the strongest correlation.
31
Heavy metals exist in different chemical forms within soils and sediments. Pueyo et al.
(2004) have explained that the forms in which the metals exist (speciation) influences their
mobility and toxicity compared to the total element content. It has long been established
for example that mercury is more toxic in its organic form [CH3Hg+ or (CH2)2Hg]. This
has therefore led to a paradigm shift from simple determination of total metal
concentration to more detailed fractionation studies about the physiochemical forms of
elements which is required to understand their environmental behavior, including mobility,
pathways and bioavailability (Anju and Banerjee, 2010). The well-known Minimata
accident in Japan was linked to the consumption of methyl mercury in shell fish.
Chromium also behaves in a similar manner with the hexavalent form of the metal being
considered to be more toxic and carcinogenic than the trivalent form because it is more
readily absorbed and transported across cell membranes (Plumlee and Ziegler, 2004).
1.4.4 Sequential Geochemical Extraction Tests
Knowledge of total metal concentration in environmental matrices alone is not enough in
assessing the bioavailability, mobilization and the human risk in an environment. Neither
does the total concentration provide a good indication of the levels of metals potentially
available to plants (Ullrich et al., 1999). In order to assess the possible effects of heavy
metals and their complexities in soils, it is necessary to establish the forms in which the
elements exist in the soils. In the last few decades, attention has shifted from determination
of total or near total metal contents in soils to techniques aimed at quantifying the metal
distribution among solid chemical phases, such as exchangeable, carbonate, iron-
manganese oxides and the organic fractions.
32
Sequential extraction protocols (SEPs) have been used with some success to determine the
geochemical partitioning of metals in soils, the sources of the metals and to estimate the
potential environmental hazard (Kuo et al., 1983; Hickey and Kittrick, 1984; Adamo et al.,
1996; Henderson et al., 1998; Li and Thornton, 2001; Martley et al., 2004) and in
sediments (Tessier et al., 1979; Singh et al., 1998) among others. However, many workers
have pointed out some factors that limit the interpretation of sequential extractions.
Martley et al. (2004) summarized these factors as follows:
Limited selectivity of extractants, such that metals bound to a particular phase may
be partially dissolved in different leaches;
Possible redistribution of trace elements among phases during extraction with a
particular physiochemical phase;
Influence of soil type and grain size on the efficiency of the extraction protocols;
Results are likely to be influenced by the choice of reagents, extraction time and
ratio of extractant to sample; and
High metal content in a sample may lead to saturation of the extractant, thus,
leading to incomplete extraction.
1.5.5 In Vitro Extraction Tests
In vitro bioaccessibility tests (IVBA) are inexpensive, physiologically-based extraction
tests (PBET) designed to estimate the bioaccessibility of elements along exposure
pathways (Morman et al., 2009). This is achieved by measuring the geochemical reactivity
of the materials in simulated body fluids such as saliva, lung fluids and gastric juices or
blood plasma. It is used as a proxy for the more complicated, expensive and often ethically
constrained measurements of bioavailability using in vivo methods involving the use of
animal or human subjects.
33
The term bioaccessibility in relation to human exposure by ingestion has been defined by
Ruby et al. (1999) as the fraction of a potential toxicant in earth materials that becomes
solubilized in the stomach or lungs, thus, becoming available for absorption. This is closely
related to geoavailability, which is the portion of an element’s total content in an earth
material that can be liberated to the surface or near surface environment through
mechanical, chemical or biological processes (Morman et al., 2009). The two concepts are
related to the susceptibility and availability of the resident mineral phases to break down
through chemical weathering processes, which then mobilize the elements and release
them into the environment. For a given toxicant such as a potentially toxic element, the
total concentration in an earth material is far more than the quantity eventually absorbed
into the circulatory system of a subject (Plumlee and Ziegler, 2004). This means that,
bioavailability < bioaccessibility < total concentration of a contaminant in an earth
material.
Several methods of performing the in vitro studies have been reported in the geochemical
literature. Some advanced the use of complex fluids to simulate gastric fluids. For
example, Medlin (1997) used a fluid containing pepsin, admixed with citric, malic, lactic,
acetic and hydrochloric acids. The method of Drexler and Brattin (2007) which was
adopted by Morman et al. (2009) advances the combination of concentrated hydrochloric
acid and glycine in deionised water. The approach of EPA (2008) involved combinations
of sodium chloride, pepsin with hydrochloric acid and sodium bicarbonate, bile salts and
pancreatin for the stomach and intestinal phases respectively. This two stage procedure
earlier reported by Cave et al. (2006) was adopted by Button et al. (2009), while
investigating the risk to humans at arsenic contaminated sites at a former mine at the
Devon Great Consols, southwest England. However, the EPA (2008) in a subsequent study
appeared to question the necessity of using the complex fluids. They argued that
34
when the bioaccessibility of a series of test substances were compared using 0.4M glycine
buffer at (pH 1.5) with and without the enzymes and metabolic acids, no significant
difference was observed. They therefore concluded that the simplified buffer employed in
the procedure is appropriate, even though it lacked some constituents known to be present
in gastric fluids and that is the method adopted in this work.
1.5 Thesis outline
In this Chapter, the problems associated with artisanal small-scale exploitation of mineral
resources have been examined, including a review of pertinent literature. The focus has
been on two areas in the NW Nigerian Schist Belt where gold, often associated with
sulfides in quartz veins is won by local artisanal miners, with attendant environmental and
human health consequences. The work progresses in Chapter 2, with a detailed description
of the research methods used, including fieldwork and laboratory experiments. In Chapters
3, 4 and 5, the results of laboratory experiments have been presented and discussed,
beginning with the bulk soil and sediment geochemistry and continuing through
geochemical partitioning studies and ending with in vitro bioaccessibility results. Finally,
the main conclusions drawn from the results of this work are presented in Chapter 6, along
with identified possible future research areas.
35
Chapter two
Methodology
2.1 Introduction
In this chapter, the methods employed in this work are outlined. Fieldwork was conducted
in two stages, first during April and May, 2010 in the Birnin-Gwari area and subsequently
in December of the same year in Anka area. On both occasions, field reconnaissance was
carried out, followed by the collection of top soil and stream sediment samples. The
samples were analyzed for their elemental and mineralogical contents using a variety of
techniques, including x-ray diffraction (XRD) spectrometry, scanning electron microcopy
(SEM), x-ray fluorescence (XRF) spectrometry and inductively coupled plasma-optical
emission (ICP-OES) spectrometry. Figure 9 summarizes the main analytical methods used
in this work. This is in addition to drying, pH measurement and the determination of
organic matter content in the form of loss-on-ignition (LOI).
2.2 Fieldwork
(a) Field reconnaissance was carried out to improve on the information derived from the
desk study; and
(b) Sample collection using a pre-determined programme. This took the form of simple
random sampling along topographic lows and flood plains of streams. Top soil and
sediment samples were collected from 0 to 15cm using a plastic trowel and placed in
plastic self-seal bags. Care was taken to exclude surface vegetation, fresh litter, roots and
rock fragments (Kelly and Hudson, 2007; Salminen, 2008). The method is a combination
of exploratory and random sampling, where discrete grab samples were collected,
generally aimed at checking the presence or absence of contamination (Swyngedouw and
Crepin, 2008). At each sampling point, three samples were collected at the apices of a
roughly equilateral triangle with sides one meter long and subsequently mixed up to make
a composite sample. This was done in order to get a representative sample and check
36
against local variability. Control (background) samples were collected from a nearby area,
adjudged to be unaffected by the contamination (pristine) but with similar lithology and
soil type as the study site. In the Birnin-Gwari area, five samples were collected from
termite mounds (or ant hills) which occur in abundance within the study area. The aim is to
gain knowledge of the distribution of different chemical species at depth since the
burrowing animals have brought materials from deeper horizons of the soil or even
bedrock. Each termite mound was sampled by collecting small pieces at different levels
and mixing them to make a composite sample. In all, a total of 131 soil and sediment
samples were collected, comprising of 86 from Birnin-Gwari and 45 from Anka area.
The location of each sample was indicated on a topographic base map of the area and
geographic coordinates in the form of Latitude and Longitude were recorded using hand
held global position system (GPS). These were subsequently used to produce the sample
location maps (Fig. 8a&b) using ArcGIS (ArcMapTM
10.1) for Desktop from
Environmental System Research Institute (ESRI, 2012). Details of the coordinates and
sample description are presented in Appendix 1.
37
Figure 8a Map of Birnin-Gwari study area showing sampling sites and some artisanal
mine pits. The location of this area in Nigeria has been indicated in Figure 2
(modified from ESRI, 2012).
38
Figure 8b Map of the Anka study area showing sampling sites and location of some
artisanal mine pits. The location of this area in Nigeria has been indicated in Figure 2
(modified from ESRI, 2012).
39
2.3 Sample preparation
2.3.1 Drying
The samples were subjected to a two stage drying process. To make the soil and sediment
samples ready for sieving, they were air dried at room temperature. Samples were placed in
plastic containers labeled with sample numbers and air dried in the laboratory. The second
phase of drying was done on the sieved material in order to further expel moisture and
make them suitable for final preparation and analysis. The samples were placed in
disposable foil type containers and oven dried over night at a temperature of about 50oC.
2.3.2 Disaggregation and sieving
The dried samples were subsequently disaggregated by pressing with a plastic gardeners
scoop inside the containers. This was done in order to break lumps of soils, especially for
those samples which were very wet when collected. It was followed by removal of rock
fragments, pebbles and organic debris from the samples prior to sieving. 2 mm and 63 µm
stainless steel sieves were used to sieve the samples by closing the lid and manually
shaking the assembly for about 3 minutes until all the <63 µm fraction has been received in
the pan. The finer fraction (<63 µm) was then scooped from the receiving pan into clean,
self-seal poly bags and labeled appropriately. Prior to analysis, the sieved test material was
further dried overnight in an oven at 100oC in order to eliminate any moisture content.
Between samples, the sieve, pan, lid and scoop were thoroughly cleaned, first using a
plastic brush followed by wiping with clean, dry laboratory blue rolls. The aim of this was
to eliminate or minimize cross sample contamination.
40
Fig 9 Summary of the analytical procedures used in this work.
41
2.4 Determination of pH
1g of soil was weighed into a beaker. To this, 10ml of milliQ water was added and stirred
vigorously. The mixture was allowed to stand for 30 minutes until supernatant had formed.
The pH meter was calibrated using two point calibration with buffer solutions of pH 7 and
4. The electrode was then immersed in the supernatant and measurement taken. Care was
taken to ensure that the electrode was not in contact with soil, since this could cause an
error of up to 1 pH unit (Radojevic and Bashkin, 1999).
2.5 Determination of organic matter content
The weight of an empty, clean, and dry porcelain dish (WP) was determined. A portion of
an oven-dried (100oC) test material was placed in the porcelain dish and the weight of the
dish and soil specimen (WPDS) determined and recorded. The dish was then placed in a
muffle furnace and the temperature gradually increased to 300oC (J. Andrews, personal
communication). The specimen was left in the furnace overnight. The furnace was the
switched off and the specimens allowed to cool to room temperature. The weight of the
dish containing the ash (burned soil) (WPA) was determined and recorded.
The loss-on-ignition (LOI) which is a proxy for organic matter content of the sample was
then calculated as follows (Reddy, 2002):
Weight of the dry soil, WD=WPDS-WP ............................Eq 1
Weight of the ashed (burned) soil, WA=WPA-WP .............................Eq 2
Weight of organic matter, WO = WD - WA...........................Eq 3
The percentage organic matter, OM(%)= WO/WD × 100 ............Eq4
42
2.6 Powder X-ray Diffraction Analysis
The mineral composition of the soil samples was determined using X-ray diffraction
spectrometry (XRD). About 0.5g of a fine soil sample was mixed with distilled water to
make slurry. The soil paste was then spread evenly on an alcohol cleaned, dry glass slide
and allowed to dry (Andrews, 2009). This was then mounted on the X-ray diffractometer
(Thermo ARL). Samples were X-rayed from 5 to 65o 2θ using Cu K-alpha radiation, with
a step size of 0.02 degrees two theta, and a count time of at least two seconds per step
using a scintillation counter. The results were interpreted using the WinXRD 2.0-5
computer program and manually using published tables of mineral d-spacings of major
reflections of common minerals, d Å (Brown and Brindley, 1980).
2.7 Scanning Electron Microscopy
A scanning electron microscope equipped with an energy dispersive x-ray spectrometer
(SEM/EDS) was used to check the distribution of minerals, especially those contributing
potentially toxic elements (PTEs) in the samples (Fig. 10). The fine powder sample was
sprinkled on sticky carbon tabs on aluminum sample stubs and then carbon coated to allow
for flow of electrons. The samples were then viewed and the elemental content of sites of
interest was obtained using the in-built spectrometer.
43
Figure 10 SEM micrograph and EDS spectra for a highly contaminated soil sample
from Anka area, showing wide spread lead minerals (light particles) in the sample.
The particle sizes, generally less than 200 µm make them very suitable for hand-to-
mouth ingestion and amenable to suspension as dusts.
44
2.8 X-ray Fluorescence Spectrometry
Determination of total or near total concentration of the trace elements and major oxides in
soils and sediments was carried ou by x-ray fluorescence (XRF) spectrometry method.
In order to determine total trace element concentration, pressed powder pellets were
prepared. The procedure involved mixing 7.5 g of the sieved, oven-dried sample with
three (3) cellulose tablets in a ratio of 1 cellulose tablet to 2.50 g of sample and grinding
the mixture in an agate mill (Retsch RS 200) for 1 minute. This was followed by pressing
the powder into 25 mm pellets using a hydraulic press at a pressure of 20 tons. The
cellulose serves dual purposes as a binder and also reduces absorption of the target material
(Potts and Webb, 1992; Funtua, 2001).
Glass beads were prepared for determination of major constituents. This involved the
mixing of approximately 7.60g Lithium borate flux with 0.40g of the sample in a platinum
crucible. The mixture was then fused on an air-acetylene flame (800 to 1200oC) for fifteen
(15) minutes so that the flux melts and the sample dissolves (Bruker axs, 2004); the melt
was allowed to cool into a one-phase glass bead.
Analysis was carried out using a high performance sequential wavelength dispersive XRF
spectrometer, S4 PIONEER from Bruker AXS, Germany. This was done using the default
GEO-QUANT program for trace elements and the Beads-majors program for the major
elemental constituents (oxides), with both running on the SPECTRAplus
XRF software. The
GEO-QUANT method provides quantitative analyses of a suite of 22 trace elements in a
sample, with a typical analysis time of about 30 minutes per sample. The quantification
limits (LOQ) for the trace elements measured in this work are 10 µg/g for As, Sc, Cr, V,
Ni, Cu, Nb, Mo, Sr, Rb, Th, U, Y, La and Ce; 9 µg/g Zn; 5 µg/g Pb; 24 µg/g Ba and 6
µg/g Zr. In order to allow for data analysis, LOQ values have been replaced with half the
values for some of the trace elements (Nehls and Ackland, 1973; Kusner, 1976; USEPA,
45
2000). While those data points may not be very reliable, this is probably a better alternative
to assigning zero concentration or removing the affected samples from the database.
However, for some samples with very high contents of lead and copper, beyond the upper
calibration range of the GEOQUANT method (1000 µg/g Cu and 2500 µg/g Pb), a semi-
quantitative method was used to estimate their total concentrations. This involved
preparation of glass beads and determining Pb and Cu concentration as major oxides. The
quantification limits for this method are 0.01 % Cu and 0.02 % Pb respectively. The major
constituents program determines the ten (10) major elements as their oxides with a run
time of approximately 20 minutes per sample. The set-up consists of a 75µm ultra-thin x-
ray tube source and a LiF 220 high resolution analyzer crystal detector applicable for Ti or
V Kα to Mo Kα which gives higher resolution and reduces spectrum overlap interferences.
This is coupled with a sealed proportional counter and a scintillation counter.
In order to check analytical accuracy, four certified reference materials (CRMs) were
always included among each batch of samples (n = 10). These are SDO-1, W2a, MESS-2
and STSD-2 for the trace elements and major elements (STSD-2 was not used for major
elements). However, because the certificate of analysis of MESS-2 is missing a large
number of both major and trace elements, its use was discontinued. The measured results
of most of the elements for the remaining CRMs (Fig.11, Appendix 2) show very good
agreement with the certified values, therefore showing good measurement accuracy, as
indicated by the R2 values and the slopes of the lines. The SDO-1 (shale) and STSD-2
(stream sediment) are thought to closely reflect the samples used in this work in terms of
matrix.
46
Figure 11 Plot of measured versus certified concentrations of trace elements in three
certified reference materials: a, SDO-1 (shale, USGS); b, W2a (diabase, USGS); and
c, STSD-2 (stream sediment, NRC, Canada). The table of data is presented in
Appendix 2.
47
Figure 11 continued
48
2.9 Sequential Extraction Procedures
2.9.1 Introduction
Sequential extraction procedures are meant to determine the geochemical partitioning of
elements into the exchangeable, carbonate, Fe/Mn oxides, sulfides, organic and possibly
residual (lithic) fractions. Several extraction protocols have been developed over the last
few decades. The work of Tessier et al (1979) has been adapted and modified by many
subsequent workers (example, Ullrich et al, 1999; Singh et al, 1999; Martley et al, 2004;
Hou et al, 2006). The methods used in this work are based on combinations of these earlier
works and only the exchangeable, carbonate and iron/ manganese oxides fractions were
determined in this because they are considered to be the most readily mobilized in the
environment. Organic matter/ sulfide bound fraction and the residual fraction comprising
of metals held within silicate mineral frameworks or some resistates have not been
measured as they are not readily solubilized and released to the environment under a
reasonable span of time (Tessier et al., 1979) and thus pose little environmental problem
(Martley et al., 2004).
2.9.2 Exchangeable (adsorptive) Fraction
A 1g portion of (< 63 µm) soil sample was extracted in a 50 mL polypropylene centrifuge
tube using 8 mL of 0.5M magnesium chloride (MgCl2) at pH value of 7 and room
temperature with continuous agitation for 20 minutes.
2.9.3 Carbonate Fraction
To determine the amount of metals held in this phase, the soil residue from the
exchangeable experiments was extracted using 40ml 1M ammonium acetate (NH4OAc) at
pH 5 and room temperature for 2 hours. All through the period, the caps were kept tight
and the vials subjected to continuous agitation.
49
2.9.4 Fe-Mn Oxides (reducible) Fraction
The reducible fraction was determined by subjecting the residue from the carbonate
fraction test to extraction using 20 mL 0.04M hydroxylamine hydrochloride (NH2OH.
HCl) in 25% (v/v) acetic acid (HOAc). Temperature was kept at 96 ±3oC for 4 hours and
caps on tightly (Martley et al., 2004). Every 30 minutes, the pressure was vented and the
samples shaken.
The extraction was achieved for each fraction by centrifuging (Tessier et al., 1979) at
4800 rpm for 30 minutes followed in each case by collection of the supernatant into a
sample vile using a pipette to minimize sample loss. The sample was then stored in a fridge
at 4oC until analysis was carried out using ICP-OES. Between successive extractions, the
sample was rinsed with about 10 mL milliQ water and centrifuged for 15 minutes and the
supernatant discarded.
To check method reproducibility for each of the steps, three aliquots of a certified
reference material, STSD-2 (stream sediment) were extracted in triplicate. The results
(Table 1) show that the measurements are more reproducible for all elements in the Fe/Mn
oxide fractions compared to the carbonate and exchangeable fractions, with residual
standard deviations (RSD) generally below 5 %, except for As. The high RSD values
obtained for some of the elements in the exchangeable and carbonate fractions is
interpreted to be a result of very low concentration. The lower the concentration, the more
difficult it is to obtain reproducible results.
50
Table1 Reproducibility of the sequential extraction procedures for a certified reference
material, STSD-2. Exch - Exchangeable fraction, Carb - Carbonate fraction and Oxide –
Fe/Mn Oxides fraction. All units are µg/g except where otherwise stated.
As Cr Cu Mn Ni Pb Zn
Exch bdl 0.01 0.13 10.4 0.22 0.09 0.27
Exch 0.01 0.03 0.12 10.4 0.21 0.08 0.26
Exch 0.03 0.02 0.15 10.5 0.23 0.16 0.26
Mean 0.02 0.03 0.13 10.41 0.22 0.12 0.26
StDev 0.01 0.00 0.01 0.05 0.01 0.04 0.00
RSD% 26.1 19.0 11.0 0.5 4.6 34.6 0.5
Carb 2.83 0.14 1.49 34.12 0.96 4.93 3.24
Carb 2.73 0.15 1.44 32.57 0.88 3.65 3.04
Carb 3.30 0.24 1.92 38.39 0.95 8.39 3.62
Mean 3.01 0.20 1.68 35.48 0.92 6.02 3.33
StDev 0.28 0.05 0.24 2.91 0.04 2.37 0.29
RSD% 9.5 23.1 14.3 8.2 3.9 39.4 8.7
Oxide 5.06 1.69 3.08 298.79 3.48 11.48 11.44
Oxide 5.73 1.71 3.15 302.23 3.41 11.25 11.64
Oxide 6.49 1.75 3.12 325.34 3.52 11.44 11.84
Mean 6.11 1.73 3.13 313.79 3.46 11.34 11.74
StDev 0.38 0.02 0.02 11.56 0.05 0.09 0.10
RSD% 6.2 1.1 0.5 3.7 1.5 0.8 0.9
2.10 In vitro Bioaccessibility Tests
Physiologically-Based Extraction Techniques to assess the bioaccessibility of the elements
and their toxicity. This involved laboratory simulation of gut fluids and using them to
leach/ extract metals from the soils. Several procedures have been developed for in vitro
testing of bioaccessible metals, among them are those by Drexler and Brattin (2007),
USEPA (2007a,b; 2008), BARGE (2008).
The soil samples were air dried and sieved to < 60 µm. Gastric fluids were simulated by
adding approximately 60 ml concentrated hydrochloric acid to 2 L of 0.4 M glycine
solution. The glycine solution was prepared by adding 60.06g of glycine to 1.9 L of
deionized water and the solution made up to 2L. The solution was then warmed in an
incubator to a temperature of 37oC and its pH adjusted to 1.5± 0.05 by drop-wise addition
of concentrated hydrochloric acid.
51
The test material (1 g of the < 60 µm soil) and 50 ml of the extraction fluid were placed in
a high density, wide mouthed Nalgene bottles. The bottles were tightly closed and shaken
well to ensure that there was no leakage and that no soil was caked at the bottom of the
bottle. The bottles were then placed into a temperature controlled incubator (37 ±2oC) and
shaken side-to-side at 300 rpm for 1 hour. After 1 hour, the bottles were removed and
placed upright on a bench top to allow the soil to settle at the bottom. A 15 ml aliquot of
the supernatant was withdrawn using a syringe and filtered using a Luer-Lok attachment
fitted with 0.45µm cellulose acetate filter to remove any particulate matter. The extraction
solutions were stored in a fridge at about 4oC until they were analyzed and Figure 12
shows method precision on replicate measurements.
2.10.1 Effect of pH on In Vitro bioaccessibility
The gastric pH is said to range between 1 and 5 units depending on the presence or absence
of food (USEPA, 2008; Washington et al. 2001), with the fasted condition giving lower pH
values. This experiment was conducted at three pH values; 1.50, 2.20 and 2.90 which were
achieved by successively reducing the volume of concentrated hydrochloric acid used
(from 60ml to 30ml and 15ml) while keeping weight of glycine and total solution volume
constant. A set of fifteen samples was used in this study, where three equal aliquots of each
sample were each extracted with the solutions of varying pH in an incubator for one hour
at 37oC with constant shaking. In order to test the precision of the method, three samples in
each batch were extracted in triplicate and residual standard deviation (RSD) was found to
be generally below 10%.
52
Figure 12 Precision of replicate in vitro measurements for five elements indicated as
residual standard deviation, RSD %. Notice that most of the points lie well within an
acceptable limit of 10% (Lu et al., 2011) indicated by the solid horizontal line, except
for arsenic and chromium in few samples.
2.10.2 Effect of solid: fluid ratio on In Vitro bioaccessibility
To test the possibility that ratio of test material weight in the extraction bottle to volume of
extraction fluid has an impact on contaminant solubilization, this experiment was
conducted using three solid to fluid ratios. In addition to the 1:50 (1g test material: 50ml of
extraction solution) adopted in 2.10 above, extraction was also carried out on a sub-set
(n=10) of the samples used above at 0.5g: 50ml and 1g: 25ml test material to extraction
solution respectively. The procedure involved placing three aliquots of the test material
and adding the required volume of extraction solution. The set-up was then incubated for
one hour at 37oC with constant agitation, after 10ml aliquots of the supernatant were
collected and filtered for analysis.
53
2.10.3 Effect of incubation time on in vitro bioaccessibility
In order to study the effect of incubation time on the in vitro bioaccessibility of
contaminant elements, the extraction process was repeated at different time intervals. This
is aimed at testing the impact of time of contact between the test material and extraction
solution, within the stomach emptying time which is reported to be about 1 hour (USEPA,
2008) and between 30 minutes and a few hours (Drexler and Brattin, 2007) for a child. For
this purpose, a sub-set (n=10) of the samples used in 2.10 above were subjected to
incubation for one hour and two hours and finally left standing on bench top for 17 hours.
The procedure involved placing 1g of the test material into a bottle and adding 50ml of the
extraction solution prepared as above and incubating for one hour. After the first hour, the
bottles were removed and placed on the bench top as usual to cool and allow the materials
to settle. A 10 ml aliquot was then collected and filtered into sample vials. The remaining
solution was then returned to incubator and shaken for another hour and a second 10 ml
aliquot collected for analysis. Another aliquot was collected the following day after the set
up was left to stand on bench for 17 hours.
2.11 ICP-OES Analysis
All sequential extraction and in vitro bioaccessibility solutions were analyzed by
inductively coupled plasma-optical emission spectrometry (ICP-OES) using a Varian Vista
Pro CCD Simultaneous spectrometer, equipped with a Varian Sample Preparation System
(SPS-5) for As(188.980 nm), Cr(267.716 nm), Cu(324.754 nm, 327.395 nm), Ni(231.604
nm), Mn(259.372 nm), Pb(220.353 nm) and Zn(213.857 nm). This spectrometer features a
Charge Coupled Device (CCD) detector, high resolution echelle polychromator and a
rugged 40 MHz RF system. The CCD detector has continuous wave length coverage, from
167nm to 789nm, which helps to easily eliminate spectral interferences (EVISA, 2010).
The limits of detection (LOD) for the measurement in parts per billion (ppb) are 1.59 (As),
54
0.11 (Cr), 0.18-0.67 (Cu), 0.23 (Mn), 0.72 (Ni), 1.07 (Pb) and 0.51 for Zn. Calibration
standards were prepared using commercially available analytical grade stock solutions
from Fisher Scientific, UK. In order to the check the quality of the analyses, an analytical
spike was included within each batch of samples, coupled with at least three blank samples
(milliQ) water in each case and replicate measurements were done on samples selected at
random. The analytical blank gave values generally very close to the LOD for all elements.
The residual standard deviation (RSD) for the duplicate measurements on blanks and
samples has generally been within or slightly above the acceptable limit of 10% (Lu et al.
2011) or 15% (Smith et al. 2009), thus indicating good method precision.
2.12 Statistical and Graphical Treatment of Data
The geochemical data was submitted to multivariate statistical analysis using SPSS
(PASW 18) for Windows using methods described by Field (2009). Descriptive statistics
(DS), correlation matrix (CM), principal component factor analysis (PCFA) and One-way
repeat-measures ANOVA were performed on the data. While carrying out DS, CM and
PCFA, it was assumed that the data was normally distributed and therefore no
normalization was done before statistical treatment. For the repeat-measures ANOVA, a
correction for data sphericity was carried out using Bonferroni method. Descriptive
statistics provide a summary of the data in terms of its statistical parameters of minimum
and maximum, mean and standard deviation. Correlation matrix was used to obtain the
Pearson relationship between the elements on the one hand and with organic matter content
of the sediments on the other. The PCFA was performed in order to identify possible
sources and fate of the various elements (geogenic, anthropogenic or both). Repeat-
measures ANOVA was performed in order to assess the effect of pH, time and solid to
fluid ratio on element bioaccessibility. Similarly, the effect of grain size on total elemental
concentration evaluated using this method. Multi- element graphs of the data were plotted
using the chart option in Microsoft Office Excel 2007.
55
Chapter Three
Results: Bulk Geochemistry
3.1 Introduction
Soils and stream sediments from the Anka and Tsofon Birnin-Gwari areas of NW Nigeria
were analyzed in order to assess the environmental impact of artisanal gold mining and
processing. A total of 101 samples, consisting of 56 from the Birnin-Gwari and 45 from
the Anka areas were analyzed for total element composition using x-ray fluorescence
(XRF) spectrometry. The aim was to determine the distribution of major and trace
elements in soils and stream sediments in these areas. The organic matter content (LOI %)
of all the samples was determined by measuring the weight loss of a sample ignited in a
furnace to burn off the volatile components. In order to identify and possibly quantify
some of the mineral phases, a subset of the samples was studied using powder x-ray
diffraction (XRD) analysis. Details of the analytical procedures have been given in Chapter
2. An observation of the results from both the Anka and Birnin-Gwari areas shows that the
data is generally not normally distributed (Fig.13 a&b). As a result, the mean may not a
good measure of the centre of the distribution for most of the elements and is therefore
presented along with the median in the summary tables.
3.2 Mineralogy and Major Element Geochemistry
Table 2 (a and b) present the summary statistics of the concentrations of major and trace
elements, organic matter contents and pH for the soil and sediment samples from the Anka
and Birnin-Gwari areas of NW Nigeria. The tables present the results of this work, along
with the crustal averages (Andrews et al., 2004; Taylor and McLennan, 1985, 1995;
Wedepohl, 1995) and soil guideline values for some of the potentially toxic elements
(ICRCL; USEPA) and the concentration of the elements in stream sediments from a
similar terrane in central Nigeria recently published by Lapworth et al. (2012).
56
Figure 13a Histograms showing the non-normal nature of the distribution of trace
elements data in the samples from the Birnin-Gwari area.
57
Figure 13b Histograms showing the non-normal nature of the distribution of trace
elements data in the samples from the Anka area.
58
The data show that for the Anka area (Table 2a), the mean (± std. dev) concentrations (wt
%) of SiO2, TiO2, Al2O3 and Fe2O3 are 75.3 ± 11, 1.1 ± 0.5, 8.6 ± 4 and 4.5± 2.6
respectively. The results for MgO, CaO, K2O and Na2O are 0.5 ± 0.9, 0.7 ± 0.1, 1.8 ± 0.7
and 0.3 ± 0.5, while MnO and LOI give 0.1± 0.1 and 4.8 ± 2.2 respectively. Similarly,
Table 1b shows that for the Birnin-Gwari area, the results for SiO2, TiO2, Al2O3 and Fe2O3
are 78.4 ± 8 wt %, 1.2 ± 0.4 wt %, 9.2 ± 4 wt % and 4.6 ± 3 wt % respectively. The results
further show that the mean concentrations of MgO, CaO, K2O, Na2O, MnO and LOI are
similar to those obtained in the Anka area. A major feature of these results is the elevated
silica contents and depletion in alumina and the alkalis relative to their published crustal
average values (Andrews et al., 2004; Taylor and McLennan, 1985, 1995; Wedepohl,
1995). Similarly, the soils of this area have generally low organic matter content as
indicated by the low mean percentage loss on ignition, LOI %. Iron content is however
similar to the global average values.
The high silica contents, coupled with depletion in alumina and the alkalis, relative to the
upper continental crust, is a reflection of the preponderance of quartz relative to feldspar,
mafic, carbonate and clay minerals in the soils and sediments from the two areas, as shown
by the powder XRD results (Fig. 14). The very high silica concentrations in soils and
sediments from both the Anka and Birnin-Gwari areas are similar to those obtained by
Tijani et al. (2006) for bedrock and soils overlying granite-gneiss and pegmatite (60.3-72.2
%) and schist-quartzite (81-91.3 %) in SW Nigeria. The results are similar (except for
SiO2) to those reported for stream sediments in central Nigeria (Table 1a&b) by Lapworth
et al. (2012), who attributed the depletion in aluminum and the alkalis in the sediments
relative to the upper continental crust, to the maturity of the chemical weathering process,
which involves the progressive loss of the alkalis accompanied by an enrichment of
sesquioxides (Tijani et al., 2006). Many previous workers (e.g. Price and Velbel, 2003;
59
Tijani et al, 2006) have used the chemical index of alteration, CIA (Nesbitt and Young,
1982) as a measure of the degree of weathering and is calculated according to the equation:
......................................................................Eq 5.
Figure 14 Powder x-ray diffraction patterns for randomly selected samples from
Anka area, NW Nigeria showing the dominance of quartz (Qtz) in the samples.
B1
TD10
60
Figure 14 cont’d.
61
The computed CIA values for the Anka samples range from 60.3 to 89.6 (mean, 75.1),
while for the Birnin-Gwari area the values lie between 69.1 and 88.3, with a mean of 79.
These generally indicate that the soils and sediments from both study areas have undergone
intense weathering and removal of alkali metals from feldspars by aggressive soil solutions
(Nesbitt and Young, 1982), with the Birnin-Gwari samples again appearing to be more
weathered. It may also be a result of considerable leaching of bases in the upper horizons
of the soils as evidenced by low base saturation and low pH values (Pullan, 1970), which
leaves the soils enriched in silica. The mean pH value obtained for the Anka samples is 6.7
± 1: whether this is sufficiently low to cause the leaching of base cations faster than they
are re-supplied by weathering (Kirchner, 1992; 1995) is not clear.
An observation of the whole data (Appendix 3 & 5) shows that the Birnin-Gwari samples
are slightly more depleted in Mg, Ca and Na compared to the samples from the Anka area,
while the two areas have broadly similar K concentrations. Given the broadly similar
geology and climate of the two areas, topography is thought to be a contributory factor: the
higher relief of the Birnin-Gwari area facilitating greater loss of base cations through
overland runoff, which is consistent with the higher mean CIA value obtained for the area.
Similarly, the results for three termite mound samples (TM2, TM3 and TM5) from the
Birnin-Gwari area (Appendix 5), although few in number, have high alumina
concentrations (~ 11 – 16.5 wt %) compared to most of the surface soil samples, but their
alkali contents do not differ significantly from those of the surface soils and stream
sediments. A possible reason for this is the origin of the termataria samples from deeper
soil environments that have not undergone leaching relative to the top soils.
62
Table 2a Summary of XRF data for major (wt. %) and trace elements (µg g-1
) in soils
and sediments from Anka area, NW Nigeria, along with published concentrations and
soil guideline values for some potentially toxic elements.
Element This work Cont. Crust Soils Sediment
Min Max Mean
Med Std. Dev. a b* c d e f
*
SiO2 40 89 75.3
77.4 11 65 66 62
59.5
TiO2 0.2 2.9 1.1 1.0 0.5 0.6 0.5 0.7
1.7
Al2O3 3.7 18.1 8.6 7.4 4 15 15 15
10.9
MnO 0 0.5 0.1 0.6 0.1
0.1 0.1
0.1
MgO 0.1 6.4 0.5 0.3 0.9 2.4 2.2 3.7
0.5
Fe2O3 1.2 10.5 4.5 4.0 2.6 4.9 5 6.3
4.5
CaO 0.1 5.8 0.7 0.4 1.0 4.1 4.2 5.5
1.2
P2O5 0 1.6 0.24 0.09 0.4
0.2 0.2
0.04
K2O 0.4 4.3 1.8 1.8 0.7 3.1 3.4 2.4
2.3
Na2O 0 2.4 0.3 0.2 0.5 3.5 3.9 3.2
LOI 1.6 10.51 4.8 4.5 2.2
pH 4.9 9.24 6.7 6.6 1.0
Sc 10 28 11 5 3.3
11 16
V 24 213 78 67 45
60 98
80.4
Cr 17 327 72 48 60
35 126 54 68 56.4
Ni 10 175 35 27 30
20 56 19 22 16.9
Cu 10 3600 506 14 958
25 25 25 22 16.5
Zn 13 395 83 52 90
71 65 60 66 41
As 10 533 25 5 78
1.5
10
1.62
Rb 10 139 47 52 31
112 78
76.7
Sr 34 312 115 95 69
350 333
201
Zr 122 4367 1321 638 928
190 203
2100
Nb 10 35 19 21 6
25 19
29.1
Mo 10 23 10 10 2
1.5
0.73
Ba 272 2320 813 566 626
550 584
808
La 10 64 27 26 14
30 30
99.9
Ce 39 160 78 67 26
64 60
211
Pb 22 221600 17522 497 40161
20 15 19 30 28
Th 5 10766 597 23 1736
11 8.5
40.8
U <10 <10 <10 <10 0
2.8 1.7
8.09 a: Andrews et al, 2004; b: Upper continental crust, Taylor and McLennan, 1985, 1995; c:
Wedepohl, 1995; d: ICRCL/DEFRA Trigger concentrations for domestic gardens/allotments ; e: US
EPA soil guideline values; f: stream sediments from central Nigeria (Lapworth et al., 2012). *Major
elements oxides worked out from elemental concentrations.
63
Table 2b Summary of XRF data for major (wt.%) and trace elements (µg g-1
) in soils
and sediments from Birnin-Gwari area, NW Nigeria, along with published
concentrations and soil guideline values for some potentially toxic elements.
Element This work Cont. Crust Soils Sediment
Min Max Mean
Med Std. Dev. a b* c d e f
*
SiO2 64.6 92.2 78.4
79.4 8 65 66 62
59.5
TiO2 0.2 2.0 1.2 1.2 0.4 0.6 0.5 0.7
1.7
Al2O3 4.0 17.6 9.2 8.1 4 15 15 15
10.9
MnO 0.01 0.7 0.1 0.08 0.1
0.1 0.1
0.1
MgO 0.1 0.9 0.3 0.2 0.2 2.4 2.2 3.7
0.5
Fe2O3 0.8 12.1 4.6 3.4 3 4.9 5 6.3
4.5
CaO 0.03 0.6 0.2 0.2 0.1 4.1 4.2 5.5
1.2
P2O5 0.01 0.1 0.05 0.04 0.02
0.2 0.2
0.04
K2O 0.9 3.4 1.8 1.76 0.5 3.1 3.4 2.4
2.3
Na2O 0.1 0.5 0.2 0.2 0.1 3.5 3.9 3.2
-
LOI 1.3 9.3 5 4.4 2
-
Sc 10 18 11 10 2
11 16
-
V 24 127 58 56 20
60 98
80.4
Cr 28 100 51 48 15
35 126 54 68 56.4
Ni 10 30 16 15 6
20 56 19 22 16.9
Cu 10 40 11 10 5
25 25 25 22 16.5
Zn 15 77 30 27.5 12
71 65 60 66 41
As 10 94 24 19 14
1.5
10 - 1.62
Rb 31 148 74 67 28
112 78
76.7
Sr 23 127 56 52 19
350 333
201
Zr 251 4656 1597 1321 1207
190 203
2100
Nb 10 38 23 23 6
25 19
29.1
Mo 10 10 10 10 0
1.5
0.73
Ba 162 849 467 447.5 146
550 584
808
La 20 67 39 37 12
30 30
99.9
Ce 40 115 77 76.5 16
64 60
211
Pb 20 53 28 28 5
20 15 19 30 28
Th 10 45 21 19 8
11 8.5
40.8
U 10 10 10 10 0
2.8 1.7
8.09
a: Andrews et al, 2004; b: Upper continental crust, Taylor and McLennan, 1985, 1995; c: Wedepohl,
1995; d: ICRCL/DEFRA Trigger concentrations for domestic gardens/allotments ; e: US EPA soil
guideline values; f: stream sediments from central Nigeria (Lapworth et al., 2012). *Major elements
oxides worked out from elemental concentrations.
64
Termites are known to actively transport materials rich in clay minerals from deeper
regolith to the surface horizons (Sako et al., 2009).
The low organic matter content of the soils is consistent with the findings of Pullan (1970)
perhaps due to the sparse vegetation cover of the area, which is further exacerbated by
intensive slash and burn agricultural practices which destroy the organic matter and
overgrazing by cattle. According to Andrews et al. (2004), soil organic matter is mainly
contributed by vegetation, although they note that most soils contain less than 5 wt %
organic matter. The destroyed organic material may have also facilitated the removal of
elements such as K, Ca, Mg and Na through leaching and overland runoff, thus, helping to
explain their depletion in these soils. The paucity of exchangeable metals in these soils
may be the reason for the low partitioning of heavy metals with the exchangeable fraction
obtained in this work (Chapter 4). This might also have implications for water chemistry in
the catchment; water pH may be lowered due to low buffering capacity of the surface soils
and sediments.
3.3.1 Trace Element Geochemistry
The results of potentially toxic element analysis are summarized in Table 1a&b, along with
published concentrations and trigger and / or guideline soil concentrations for As and five
heavy metals. The data shows that the concentration of Pb, Cu, As, Cr and Zn in the Anka
samples (Table 2a) ranges from 22 to 221,600 µg/g with a mean (± standard deviation) of
17,522 ± 40,161 µg/g; 10 to 3600 with a mean of 506 ± 958 µg/g; 10 to 533 with a mean
of 25 ± 78 µg/g; 17 to 327 with a mean of 72 ± 60 µg/g and 13 to 395 µg/g with a mean of
83 ± 90 µg/g respectively, while the concentration of Ni ranges from 10 to 175 µg/g with a
mean of 35 ± 30 µg/g. These concentrations are generally higher than those obtained for
these elements from the Birnin-Gwari area, except for As, which has comparatively higher
concentrations in the area. In fact higher mean As concentration in the Anka area is as a
result of few anomalous samples which cause a positive skewing of the data set. The
65
concentrations of Pb and Cu in particular are very high in the samples from Anka
compared to those from the Birnin-Gwari study area. Similarly the mean concentrations of
all the above six elements obtained from the Anka samples are above their crustal
concentrations (Taylor and McLennan, 1985, 1995; Wedepohl, 1995), except for Cr which
has a mean concentration less than 126 µg/g (Wedepohl, 1995).
In the Birnin-Gwari area however, only Pb and As have mean concentrations above the
published crustal abundances (Table 2b), whereas the concentration of Cr exceeded only
the Taylor and McLennan (1995) value of 35 µg/g. The results were also compared with
the trigger and guideline value for potentially toxic elements in soils (ICRCL; US EPA)
and this shows that the concentration of Pb in the Anka area is above the values set for
soils by both the Interdepartmental Committee for the Reclamation of Contaminated Land
(ICRCL) in the UK and the United States Environmental Protection Agency (US EPA),
while the concentration of Cu exceeds only the ICRCL trigger concentration for domestic
gardens and allotments. The elevated levels of these elements in soils and sediments,
beyond the maximum allowable limits, especially Pb and Cu in the Anka area pose serious
environmental and human health problems. Recently, acute Pb poisoning which resulted in
the death of hundreds of children has been reported in several villages in the Anka area
(UNEP/OCHA, 2010), owing to contamination of soils within residential areas by artisanal
processing of Pb- (Plumlee and Morman, 2011) and Cu- rich gold ores. On the other hand,
the concentrations of Cr, Ni and Zn from both study areas are within the limits set by both
regulatory bodies.
In both study areas, the mean concentration of As is above the limit set for domestic
gardens and allotments (ICRCL), although the majority of samples from the Anka area
have levels below or within the set limits compared to those from Birnin-Gwari area. The
mining of gold is an important source of As in the environment (Inam et al., 2011;
Carvalho et al., 2009), but the results of this work do not show a significant elevation of As
66
concentration in areas severely affected by artisanal gold processing, especially in the
Anka area. Only a few samples have relatively high As contents, the maximum being 533
µg As/g. In the Birnin-Gwari area where As content of soils and sediments is consistently
above the trigger concentrations (ICRCL, Appendix 6), there is no significant variation
between As concentration in soils and sediments in the vicinity of the mine pits (Fig. 8a)
and in those from background areas.
The Anka and Birnin-Gwari areas have broadly similar geology and the same artisanal
mining methods have been and are still been used in both areas to win gold from
hydrothermal veins. However, the results of this work show a marked difference in the way
this activity has impacted on the chemical quality of soils and sediments in the two areas,
with the Anka area experiencing intense contamination, especially with Pb and Cu,
compared to the Birnin-Gwari area. This can be attributed to the mineralogy and
geochemistry of the deposits being exploited: the Anka ores are clearly richer in Pb- and
Cu- sulfides than those of the Birnin-Gwari area. According to Garba (2003), the wall
rocks of the Anka deposits contain elevated levels of Cu (647-5410 µg/g) and Pb (7550-
22600 µg/g), but the gold in Birnin-Gwari is associated with only minor sphalerite,
chalcopyrite, pyrrhotite, galena and magnetite. Lead and Cu concentrations of up to 22 %
and 0.4 % respectively were obtained in some of the Anka samples, and scanning electron
microscopy analysis (with energy dispersive spectrometry, EDS ) shows widespread
presence of galena (and probable chalcopyrite) particles in the soils and sediments.
Similarly, results of sequential extraction experiments (Chapter 4) show high
concentrations of Pb in the carbonate fraction, due to the presence of very soluble
secondary Pb carbonates (Plumlee and Morman, 2011). As contaminants were introduced
into the soils only recently, the carbonate is likely to control the release of Pb in the
immediate future depending on the pH of surface or meteoric water in the area. But as
weathering progresses with time, the oxidation of fine galena particles exposed to the
67
atmosphere, for example, to anglesite (PbSO4, Plumlee, 1999) is expected to make Pb even
more mobile and therefore available for uptake. The results therefore underscore the
importance of deposit mineralogy and chemistry to the environmental geology of mineral
deposits (Plumlee, 1999).
The concentrations of Zr, Th and, to a lesser extent, Ba have been found to be very high in
both study areas (Table 2a&b), although the Anka samples have generally higher
concentrations of the three elements. Mean concentrations (± standard deviation) of Zr and
Th in both the Anka and Birnin-Gwari areas are greater than the crustal abundances
(Taylor and McLennan, 1995; Wedepohl, 1995), whereas the concentration of Ba is only
elevated above baseline concentrations in the Anka area. These results, except for Th in the
Anka area, are broadly very similar to those obtained by Lapworth et al. (2012) for stream
sediments in a survey in central Nigeria. The possible sources of these elements in the
areas is not clear, but heavy minerals like zircon and monazite are likely sources of Zr and
Th, while Ba may have been contributed by feldspars or associated barites mineralization.
According to Key et al. (2012), anomalously high levels of Zr found in stream sediments in
Nigeria may not be a reflection of the concentration of the element and other heavy
mineral borne elements in surrounding Basement rocks. They instead interpreted it to be a
product of intense tropical-chemical weathering, and persistent physical weathering aided
by wet season flash floods and dry season winds, which effectively removed most of the
clay minerals, thus, leaving the sediments enriched in zircon and the other resistates. The
concentration of Zr obtained in this work for three metasedimentary rock samples, R1, R2
and R3 (Appendix 6) from the Birnin-Gwari area ranges from 251 to 276 µg Zr/g, similar
to the results obtained by Key et al. (2012) for older granite samples from the Minna area
in central Nigeria and Tijani et al. (2006) for schist-quartzites in SW Nigeria: further
supporting the argument that the high Zr content of soils and sediments in the area does not
indicate the presence of anomalous concentrations of the element in the bedrocks.
68
While this may help to explain the high Zr concentrations found in both the Anka and
Birnin-Gwari areas, it does not account for the high concentrations of Th and its strong
association with Pb and Cu in soils and sediments contaminated by artisanal gold mining
and processing in the Anka area. The high concentration of Th, without a corresponding
enrichment in associated elements such as U, La, Ce and Nb is a geochemically unusual
situation. This, along with the strong correlation between Th and Pb in the samples could
signify that the XRF determination of Th has been affected by interferent species,
typically, Bi and Ag (Gawen Jenkin, personal communication). Under suitable conditions
Ag and Bi may be present in galena in substantial amounts in solid solution (Foord et al.,
1988). The substitution of Bi3+
for Pb2+
is made possible by the Bi3+
-Ag+ couple
(Blackburn and Schwendeman, 1977) and is generally thought to function according to the
scheme 2Pb2+
↔ Bi3+
+ Ag+
(Foord et al., 1988). Other than by ionic substitution for Pb,
the presence of Ag and Bi may be accounted for by coexistence in solid solution of galena
and matildite, AgBiS2 (Blackburn and Schwendeman, 1977; Foord et al., 1988). However,
when the six samples with the highest Th concentrations were scanned on a Wavelength
Dispersive XRF Spectrometer, no silver or bismuth peaks were detected at detection limits
of 100 µg/g Ag and 200 µg/g Bi, respectively. It is therefore still not clear what is
responsible for the elevated Th values in some of the samples from Anka area. While it is
still postulated that there may have been interferences on the determination of Th, no
empirical data has been obtained to support the argument.
In the Anka area, the concentration of Ba appears to co-vary with those of Cu and Pb, such
that samples with high Cu and Pb levels also have elevated Ba concentrations (Fig. 15,
Appendix 4). This is perhaps as a result of associated barite mineralization or the presence
of Ba in K-feldspar. Irrespective of their sources, the elevated levels of these metals in
soils and sediments of the study area may present some environmental and human health
problems. Thorium for example may be a source of radioactivity, with attendant long term
69
adverse health effects. The concentrations of most of the remaining elements in both study
areas (Table 2a&b) are low compared to the crustal baseline values, the exception being La
and Ce in the Anka area and V and Ce in the Birnin-Gwari area. While the concentrations
of Mo and U in both areas appear to be above the baseline values, it is important to note
that the figures represent instrument detection limits and therefore may not necessarily be
accurate.
Figure 15 Relationship between Cu and Ba in samples from Anka area, northwestern
Nigeria. See Fig.8b for location of of the samples.
70
3.3.2 Enrichment ratios
Element enrichment ratios (Albright, 2004; Tijani et al., 2006) were calculated in order to
assess the extent of enrichment and /or depletion of trace elements in the soils of the two
study areas relative to their crustal concentrations. In this work, the Upper Continental
Crust concentrations of the elements published by Taylor and McLennan (1995) were used
as baseline or background values and the enrichment ratio (ER) was calculated using the
equations:
............................................................................................................... Eq 6,
where Cn is the concentration of an element measured in a sample and Bn is the
background or baseline concentration, in this case, the upper crustal concentration of the
element (Taylor and McLennan, 1985, 1995).
The results are summarized in Table 3 and show the factor by which the concentration of
an element in the samples from the two areas exceeds their crustal abundances. Details of
the results are available in Appendix 7 and 9. An enrichment ratio, ER of 1 indicates that
the soil or sediment is neither enriched nor depleted in a particular element relative to the
average crustal concentration. On the other hand an ER of > 1 or < 1 is an indication of
enrichment or depletion, as the case may be. Based on this criterion, and using the mean
ER values, only four elements (Rb, Sr, Nb and La) are found to be depleted in the soils and
sediments from the Anka area, whereas all the remaining elements are enriched relative to
the their crustal abundance. The ER for Pb (Table 3), which is about 900 times the crustal
average concentration, is an indication of the severity of Pb contamination of the soils and
sediments of the area.
The results further show that other elements with very high enrichments include Th (56
times), Cu (20 times) and Zr which is found to be about 7 times more concentrated in these
samples, compared to its average abundance in upper crustal environments. The high levels
71
of Pb and Cu in the soils and sediments of the Anka area has already been noted and it is
linked to the artisanal mining activities in the area. Although the results indicate very
strong enrichment in As, its concentration in the area is generally low; the high mean ER
value is obviously affected by few samples with anomalously high concentrations of the
metalloid.
Table 3 Summary of enrichment ratios, ER for the samples from Anka and Birnin-
Gwari areas, NW Nigeria
Element
Enrichment ratios, ER
Anka (n = 45) Birnin-Gwari (n = 56)
Min Max Mean Min Max Mean
Sc <0.9 2.5 1.0 <0.9 1.4 0.9
V 0.4 3.5 1.3 0.4 1.7 0.96
Cr 0.5 9.3 2.0 0.8 2.9 1.5
Ni 0.3 8.7 1.7 0.5 1.5 0.8
Cu <0.4 14 20.2 <0.4 1.2 0.4
Zn 0.2 5.6 1.7 0.23 1.1 0.4
As 6.7 355.3 16.4 6.7 62.7 16.2
Rb <0.1 1.2 0.4 0.3 1.3 0.7
Sr 0.1 0.9 0.3 0.1 0.4 0.2
Y 0.8 5.3 2.7 0.7 3.3 1.7
Zr 0.6 22.9 6.9 1.4 24.5 9.0
Nb 0.4 1.4 0.7 0.6 1.5 0.9
Mo <6.7 15.3 6.9 <6.7 <6.7 <6.7
Ba 0.5 4.2 1.5 0.4 1.5 0.9
La 0.3 2.1 0.9 0.8 2.2 1.3
Ce 0.6 2.5 1.2 0.8 1.8 1.2
Pb 1.1 11080 876 1.0 2.6 1.4
Th 0.5 1006.17 55.8 1.1 4.2 2.0
U <3.6 <3.6 <3.6 <3.6 <3.6 <3.6
Min: minimum; Max: maximum.
Furthermore, the enrichment data for Mo and U may not necessarily be a true reflection of
their abundance in the samples from the Anka area. The concentration was found to be
generally low and the value used in the computation of their ER is the lower limit of
detection of the instrument.
72
Compared with the Anka area, the Birnin-Gwari study site has more elements at
concentrations generally below their average crustal values. Seven elements (Sc, V, Ni,
Rb, Sr, Nb and Ba) have mean enrichments ratios of less than 1 and are therefore depleted
with respect to upper continental crust. The results (Table 3) show that As is the most
enriched element relative to the baseline value, with an ER of 16. This tallies very closely
with the generally higher As concentrations obtained in the Birnin-Gwari samples
compared to those from Anka. The concentration of Zr in the Birnin-Gwari is about 9
times its upper crustal concentration, slightly higher than that found for the Anka area.
Unlike in the Anka area, the Birnin-Gwari samples are only slightly enriched in Th (2
times) and Pb (1.4 times), while Cu is depleted relative to the continental crust with an ER
of 0.4; further indicating that artisanal mining activities have not contaminated the
environment with these elements as it did in the Anka area.
3.3.3 Index of geoaccumulation
One of the methods used in estimating the enrichment of the concentration of an element
above the background or baseline values is to calculate the index of geoaccumulation, Igeo,
proposed by Muller (1969). This method is used to assess the severity of pollution using
seven enrichment classes based on an increase on the numerical value of the scale (Table
3).
Table 4 Classes of the index of geoaccumulation, Igeo (Muller, 1969).
Igeo value Igeo class Pollution intensity
>5 6 Extremely polluted
4–5 5 Strongly to extremely polluted
3–4 4 Strongly polluted
2–3 3 Moderately to strongly polluted
1–2 2 Moderately polluted
0–1 1 Unpolluted to moderately polluted
0 0 Unpolluted
73
The index of geoaccumulation, Igeo was calculated for all the samples from the Anka and
Birnin-Gwari areas according to the equations (Muller, 1969):
Igeo (
) .............................................................................................. Eq 7,
where Cn is the concentration of the element measured in a sample and Bn is its
concentration in some reference sample or background concentration, which in this case is
the average crustal value (Table 2a&b, Taylor and McLennan, 1985, 1995), while 1.5 is a
constant which is introduced to minimize the effect of the variation of background values
(Abrahim and Parker, 2008). Table 5 is a summary of the results for both Anka and Birnin-
Gwari areas, where as the complete results are presented in appendix 6 and 8.
Based on the Igeo classes in Table 4, the results of this work (Table 5) show that both the
Anka and Birnin-Gwari areas may have problems relating to As contamination, although
as noted earlier on, only few samples in the Anka area have significantly high levels of As.
The mean Igeo value of 3.3 for the Birnin-Gwari area falls within class 4 of the Muller,
1969 scale, indicating that the soils from this area are strongly polluted with respect to As.
The mean for the Anka soils on the other hand corresponds to class 2 or moderately
polluted. However, in some sample points in both study areas (Appendix 8 & 10), the
results correspond to class 6 or very strongly polluted, as indicated by maximum Igeo values
> 5.
74
Table 5 Summary of indices of geoaccumulation, Igeo for the samples from Anka and
Birnin-Gwari areas, NW Nigeria
Indices of geoaccumulation, Igeo
Element Anka (n= 45) Birnin-Gwari (n = 56)
Min Max Mean Min Max Mean
Sc -0.7 0.8 -0.6 -0.7 -0.1 -0.7
V -1.9 1.2 -0.4 -1.9 -0.2 -0.7
Cr -1.6 2.6 0.1 -0.9 0.9 -0.1
Ni -1.5 2.5 -0.1 -1.6 0 -1
Cu -1.9 6.6 0.5 -1.9 -0.4 -1.8
Zn -3.0 1.9 -0.9 -2.7 -0.5 -1.9
As 2.1 7.9 2.5 2.1 5.4 3.3
Rb -4.2 -0.3 -2.3 -2.4 -0.2 -1.2
Sr -3.9 -0.7 -2.4 -4.2 -2.0 -3.3
Y -0.9 1.8 0.3 -1.0 1.1 0.1
Zr -1.2 3.9 1.9 -0.1 4.0 2.2
Nb -1.9 -0.1 -1.1 -1.3 0.0 -0.7
Mo 2.1 3.3 2.2 2.1 2.1 2.1
Ba -1.6 1.5 0.3 -1.9 0.0 -0.8
La -2.2 0.5 -0.9 -0.9 0.6 -0.2
Ce -1.3 0.7 -0.4 -0.8 0.3 -0.3
Pb -0.4 12.8 5.1 -0.5 0.8 -0.1
Th -1.7 9.4 2.1 -0.4 1.5 0.3
U <1.2 <1.2 <1.2 <1.2 <1.2 <1.2
Min: minimum; Max: maximum.
However, only the Anka area has pollution problem with respect to Pb, with a mean Igeo
value of 5.1, corresponding to class 6 of the Muller (1969) scale or very strongly polluted.
In fact, at more than 45 % of the sample sites, the value is far greater than the maximum
Igeo value of 5 proposed by Muller (1969), similar to the trend already noticed with the
enrichment ratios. The maximum value of 12.8 underscores the intensity of Pb pollution in
this area due to artisanal mining and processing of lead-rich gold ores (Plumlee and
Morman, 2011). All samples from the Birnin-Gwari area on the other hand have values
below 1, corresponding to unpolluted to moderately polluted conditions, showing that the
area has no problem with respect to Pb contamination of surface soils and stream
sediments.
75
The mean index of geoaccumulation for Cu in both the Anka and Birnin-Gwari areas is
below 1, indicating no pollution to moderate pollution. But about a third of the Anka
samples, mainly those from Abare and Bagega sampling sites (Fig. 8b), actually have
values generally falling between 2.2 (moderately to strongly polluted) and 6.6 (very
strongly polluted), consistent with the total concentration data and enrichment ratios. A
plot of the Igeo values for Pb and Cu in the area (Fig. 16) shows a similar, though not exact
pattern of Pb and Cu enrichment and/ or depletion in soils of the area. The close
association of the two metals in these samples is an indication that the soils were
contaminated by the processing of similar ores, rich in Pb and Cu minerals.
Figure 16 Plot of indices of geoaccumulation (Igeo) of Pb and Cu in samples from the
Anka area, NW Nigeria, showing very similar pattern of enrichment of the two
elements in the samples.
76
The results for Sc, V, Rb and Sr in both study areas fall within class 0 of the scale, showing
that there has not been any contamination of the soils with these elements. Similarly, the
results show that both areas are not polluted by Cr, Zn, Y and Ba except in few places in
the Anka area, where these elements are found to cause moderate to strong pollution.
Similar results were obtained for Zr, Th and U in the Birnin-Gwari area.
3.4 Geochemical association
An attempt was made to hunt for geochemical associations using the data from both Anka
and Birnin-Gwari study sites. This was done with a view to determining the possible
sources of elements, especially potentially toxic elements in the soils and sediments of the
two areas. Multivariate statistical methods in the form of correlation matrix (CM),
principal component analysis (PCA), along with hierarchical cluster analysis (HCA) were
used to classify the elements into groups that may signify common origin. All multivariate
statistical tests were performed using SPSS (PASW Statistics 18) for Windows.
3.4.1 Correlation Analysis
Spearman correlation (rs) was used in order to assess the strength of the relationships
between different elements (Gong et al., 2010), particularly as it relates to the effect of
artisanal mining activities. This non-parametric correlation method was chosen in order to
avoid problems associated with non-normally distributed (Fig. 13) data (Field, 2009). The
Spearman correlation coefficient, rs, is significant in all cases reported in this section at
0.01 level of significance (that is, p = 0.01).
The results show that for the Anka area, there is a very strong relationship between Pb and
each of Cu and P2O5 and to a lesser extent Fe2O3, with rs values of 0.89, 0.95, 0.84 and
0.50 respectively. These elements also show strong to very strong correlation with each
other, the correlation coefficients being 0.66 for Cu/Fe and 0.62 for Fe/ P2O5. While
correlation does not necessarily indicate causality, in theory it is expected that a strong
77
positive correlation between two or more elements will indicate similar source or origin
(Wu et al., 2011). These relationships, especially the strong association of Pb and Cu
which is consistent with the findings of Wu et al. (2011), are thought to be a reflection of
the contamination of the soils and sediments of this area already noted in section 3.3
above. Similar results were obtained (Section 3.4.2) using principal component analysis,
along with cluster analysis. In the Birnin-Gwari area however, this relationship was not
found, with only Cu and Fe2O3 exhibiting a fairly strong correlation (rs = 0.45, p < 0.01),
further confirming the observation that gold exploitation in the Birnin-Gwari area has not
had a similar effect on soil and sediment chemistry compared to that observed in the Anka
area.
An interesting feature of the correlation data for Birnin-Gwari area is the very strong
correlation observed between the lithophile elements Y, Nb, Th, TiO2, Zr, Ce and La, with
the correlation coefficient between Y and the other elements ranging from 0.51 to 0.92 (p =
0.01). When compared with each other, the relationships were also found to be very strong,
with the correlation coefficients of Nb/Th, TiO2/Zr, Nb/TiO2 and La/Ce being 0.91, 0.81,
0.89 and 0.83 respectively. The close association of these elements in the samples from the
Birnin-Gwari area may be an indication of the effect of resistant heavy minerals from felsic
rocks (mainly granites and gneisses) on the geochemistry of soils and sediments in the
area.
Similarly, there is a strong positive correlation between iron oxide and manganese oxide in
each study area (rs = 0.77 for Anka and 0.76 for Birnin-Gwari, p = 0.01) and between the
two oxides and each of Sc, V, Cr, Ni, Cu, Zn and to a lesser extent, Sr. This shows the
importance of Fe/Mn oxides in controlling the geochemistry of trace elements in soils and
sediments (Lapworth et al., 2012), although the correlation appears to be stronger between
iron oxide and the trace elements than between them and manganese oxide. These
relationships, as well as those between the trace elements and magnesium oxide are similar
78
to the loadings of component 1 of the principal component factor analysis for both study
areas.
The results do not show any particularly strong correlation between As and any other
element in both study sites, probably indicating a different source. The highest coefficients
of correlation obtained are 0.39 and 0.41 for As/TiO2 in the Anka and Birnin-Gwari areas
respectively. Considering that the concentration of As in samples from the Birnin-Gwari
area have been consistently higher than those of majority of the other trace elements
(Appendix 6), which resulted in high ER and Igeo values (Section 3.3.3); the seeming lack
of association with other elements, including the major oxides is probably an indication of
a different origin or source for the metalloid in the soils and sediments of the area. It is
speculated that a possible source of As in these soils and sediments is the use of pesticides
in farmlands.
3.4.2 Principal component and cluster analysis
Based on the high concentrations of some elements obtained in certain sampling sites and
the strong correlation between the elements indicated by the Spearman correlation matrix,
the data was treated using principal component analysis, along with hierarchical cluster
analysis to further assess the relationship patterns. Varimax orthogonal rotation with Kaiser
normalization was applied to the PCA in order to minimize the effects of non-normal data
(Gong et al., 2010), especially the effects of high concentrations, and components were
extracted for both the Anka and Birnin-Gwari areas based on Kaiser’s default Eigenvalue
of 1 (Field, 2009). On the other hand, CA was performed using the Squared Euclidean
Distance method. The results are presented in Tables 6 and 7a &b and Figure 17.
For the Anka samples, seven components explaining 88 % of the variance were extracted
(Table 6). However, only four of the seven components, representing about 67 % of the
variance have significant loadings of elements and when the test was repeated by
79
specifying only four factors, a similar distribution was obtained, with a total variance of
about 73 %. Therefore only the first four components are interpreted in this work.
The factor loadings (Table 7a) show that component 1 which explains 22 % of the variance
is strongly positively correlated with MgO, CaO, Cr, Sc, Ni, Na2O, Al2O3 and V. The
second component also explains about 22 % of the variance and is very strongly positively
correlated with Pb, P2O5, Cu, Th, Fe2O3 and Mn. Both C1 and C2 have a strong negative
correlation with SiO2. Components 3 and 4, both explaining about 11 % of the variance are
correlated with TiO2, Nb, Zr and La, Ce, K2O, Sr respectively.
Table 6 Total variance explained for element contents in soils and stream sediments
from Anka and Birnin-Gwari areas of NW Nigeria.
In contrast, five components were extracted for the Birnin-Gwari area (Table 6, 7b) and
they account for about 84 % of the variance. Component 1 is associated with the loadings
Anka
Comp
Initial Eigenvalue
Extraction Sums of
Squared Loadings
Rotation Sums of
Squared Loadings
Total
%
Var
Cumul
% Total
%
Var
Cumul
% Total
%
Var Cumul%
1 9.2 32.8 32.8 9.2 32.8 32.8 6.2 22.2 22.2
2 5.1 18.3 51.1 5.1 18.3 51.1 6.1 21.8 44.0
3 3.3 11.7 62.9 3.3 11.7 62.9 3.2 11.5 55.5
4 2.5 8.8 71.7 2.5 8.8 71.7 3.2 11.4 66.9
5 1.9 6.8 78.5 1.9 6.8 78.5 2.5 9.0 75.9
6 1.6 5.6 84.1 1.6 5.6 84.1 1.9 6.7 82.6
7 1.2 4.3 88.4 1.2 4.3 88.4 1.6 5.7 88.4
8 0.8 2.8 91.1
Birnin-Gwari
Comp
Initial Eigenvalue
Extraction Sums of
Squared Loadings
Rotation Sums of
Squared Loadings
Total
%
Var
Cumul
% Total
%
Var
Cumul
% Total
%
Var Cumul%
1 9.6 34.4 34.4 9.6 34.4 34.4 6.6 23.5 23.5
2 5.7 20.4 54.8 5.7 20.4 54.8 5.7 20.2 43.7
3 3.8 13.5 68.3 3.8 13.5 68.3 5.2 18.5 62.2
4 2.7 9.7 78.0 2.7 9.7 78.0 3.2 11.5 73.6
5 1.6 5.7 83.7 1.6 5.7 83.7 2.8 10.1 83.7
6 0.9 3.2 86.9
80
of P2O5, CaO, MgO, Fe2O3, MnO, along with Zn and Ni, while component 2 is strongly
positively correlated with Y, Nb, Th, TiO2, Zr, La and Ce. The third component is
associated mainly with Sc, Al2O3, V, Cr, Cu, along with less strong correlation with Ni, Rb
and K2O. The last two components have Sr, Ba, Pb, K2O and As, Na2O and Rb
respectively.
Principal component analysis does not show with certainly what controls the distribution of
elements in environmental matrices, but useful inferences may be drawn from the data.
Probably, the most interesting aspect of this result is component 2 for the Anka area, which
is strongly correlated with the two most important elements in the ores, the processing of
which leads to the contamination of soils and sediments in the area. The strong association
of Pb and Cu, along with P2O5, Fe2O3 and MnO in this component further strengthens the
findings from the Spearman correlation matrix and closely similar pattern of Pb and Cu
enrichment/ depletion highlighted by the geoaccumulation indices (Fig. 16), and this is, to
a large extent supported by results of cluster analysis (Fig. 17). However, the loading of U
and Th in different components in Table 6a and at opposite ends of Figure 17 is clearly due
to the uncertainty about the XRF measurement of Th, which has already been noted. That
this pattern is not observed for the Birnin-Gwari area goes on to confirm the importance of
mineralogy and chemistry in controlling the environmental effects of mineral deposits. The
possible source of Th in the samples from Anka area has not become any clearer as a result
of these tests, but it appears to be related to the Pb-Cu ores and its mineralogy and
geochemistry may need to be further investigated in order to assess possible radioactivity
risks.
Component 1 for the Anka area is correlated with the loadings for MgO, CaO, Cr, Sc, Ni,
Na2O, Al2O3, V as well as some Fe2O3. The same component for the Birnin-Gwari area has
the association of P2O5, Fe2O3, MnO, Zn, Ni, MgO and CaO and to some extent, La and V.
The correlation of this component in both cases with MgO and CaO (Table 7a&b) may be
81
an indication of the similar lithology, probably the acidic igneous rocks and their
metamorphic products (Zibret and Sajn, 2010). But the presence of Al, Cr as well as Fe in
the Anka case (Table 7a), similar to the association in component 3 in the Birnin-Gwari
area may well be an indication of the low grade metamorphic hosts of the mineralization.
The association of the lithophile elements Y, Nb, Th, Ti, Zr, Ce and La in component 2 in
the Birnin-Gwari area (Table 7b) has already been observed from the correlation matrix
and is again interpreted as an indication of the influence of the granitic rocks (Zibret and
Sajn, 2010) and heavy mineral grains concentrated by placer processes on the chemistry of
soils and sediments in the area. In the Anka area however, the interpretation becomes
rather difficult because the correlation of these elements straddles two groups and therefore
no clear pattern is readily observable. The strong positive correlation between component 4
in the Birnin-Gwari area and Sr, Ba, Pb and K2O is similar to the pattern in the correlation
matrix for the area and may indicate that the distribution of these elements in the soils and
sediments of the area is controlled by clay minerals and mica (Lapworth et al., 2012). This
further strengthens the view that Pb in the Birnin-Gwari samples may not be related to the
artisanal mining, but is contributed by lithogenic sources, such as the weathering of mica.
82
Table 7a Rotated component matrixa
for element contents in soils and stream
sediments from Anka area, NW Nigeria
Element Component
1 2 3 4 5 6 7
MgO 0.93
CaO 0.88 0.33
Cr 0.85
Sc 0.85
Ni 0.83
Na2O 0.69
Al2O3 0.61 0.55 0.44
V 0.56 0.40 0.53
Pb 0.92
P2O5 0.89
Cu 0.88
Th 0.85
SiO2 -0.53 -0.69
Fe2O3 0.54 0.63 0.46
MnO 0.35 0.53 0.49
TiO2 0.87
Nb 0.87
Zr 0.58
Ce 0.86
La 0.42 0.76
K2O 0.63 0.35
Sr 0.43 0.61
As 0.77
Ba 0.41 0.59
pH 0.89
Zn 0.79
Rb 0.69
LOI 0.33 0.45 0.39 0.39 0.49
Extraction Method: Principal Component Analysis.
Rotation Method: Varimax with Kaiser Normalization.
a. Rotation converged in 15 iterations.
83
Table 7b Rotated component matrixa
for element contents in soils and stream
sediments from Birnin-Gwari area, NW Nigeria
Element Component
1 2 3 4 5
P2O5 0.93
Fe2O3 0.93
MnO 0.91
Zn 0.80
LOI 0.79
Ni 0.78 0.52
SiO2 -0.72 -0.58
MgO 0.54 0.50
CaO 0.54
Y 0.95
Nb 0.94
Th 0.93
TiO2 0.91
Zr 0.84
Ce 0.81
La 0.47 0.66
Sc 0.91
Al2O3 0.81
V 0.49 0.81
Cr 0.74 0.49
Cu 0.65
Sr 0.90
Ba 0.82
Pb 0.75
K2O 0.52 0.56 0.53
As 0.83
Na2O 0.72
Rb 0.58 0.63
Extraction Method: Principal Component Analysis.
Rotation Method: Varimax with Kaiser Normalization.
a. Rotation converged in 6 iterations.
84
Figure 17 Dendrogram showing the result of cluster analysis performed on the Anka
data. This shows similar pattern to the results of principal component analysis (Table
3.6a). Note for example the clustering of Pb, Cu and P at the top end of the plot. The
loading of Th and U at opposite ends of the plot is clearly a result of the effect of high
Pb concentration on Th data already noted at page 69.
85
3.5 Chapter summary
The results presented in this Chapter show that surface soils and sediments from both the
Anka and Birnin-Gwari areas are depleted in base cations and alumina, but enriched in
silica, relative to the upper continental crust, consistent with the findings of other workers
in Nigeria. This is attributed to intensive tropical chemical weathering, coupled with
physical removal of fine clay minerals through the combined effect of wet season overland
runoff and dry season winds on the one hand, and the movement of base cations into
deeper horizons of soils through leaching. This may have implications for surface water
quality by lowering of pH due to reduced capacity of soils to supply alkalis and the
mobility of contaminant trace elements. The same mechanism is identified as the reason
for the high concentration of Zr found in soils and sediments of both study areas; the
bedrocks were found not to have high concentrations of zirconium.
There is clear evidence, in the form of high concentrations of Pb and Cu, high enrichment
ratios and indices of geoaccumulation, that artisanal mining and processing of Pb-Cu rich
ores in the Anka area has resulted in serious Pb and Cu and to a lesser extent, As
contamination of soils and sediments. However, this activity has not had the same effect in
the Birnin-Gwari area, where Pb and Cu concentrations are generally low. Similarly, high
concentrations of Th obtained in samples from Anka and the very strong positive
correlation of Th with Pb and Cu, and the loading of these elements in the same factor of
the principal component analysis is an indication that the concentration of Th in the ores is
high. There is therefore the need to investigate the geochemistry and mineralogy of this
metal in the ores and the contaminated media in order to understand the potential human
health risks associated with it, especially in terms of radioactivity.
86
The main concern identified in the Birnin-Gwari area is the comparatively high As
concentrations in soils and sediments, which does not appear to be controlled by the
artisanal gold mining activities. In the next two chapters (Chapter 4 &5), the environmental
and human health risks of some of the potentially toxic elements have been further
investigated, by using sequential extractions protocols (SEPs) and in vitro bioaccessibility
(IVBA) tests.
87
Chapter Four
Results: Geochemical partitioning of heavy metals
4.1 Introduction
Knowledge of total concentration of potentially toxic elements in environmental matrices
alone is not enough to assess their mobilization, bioaccessibility and the environmental and
human health risks they pose (Ullrich et al., 1999). In order to assess the mobilization of
heavy metals held within soils and sediments and their possible environmental and health
effects, it is necessary to establish the forms in which the elements exist. This has led to the
shift of attention from determination of total or near total metal contents to techniques
aimed at quantifying element distribution among solid geochemical phases. Sequential
extraction protocols (SEPs) have been used with some success to determine the
geochemical partitioning of elements within different fractions, namely, exchangeable,
carbonate, iron-manganese oxides, organic matter bound and residual fractions.
But various previous workers (e.g. Nirel and Morel, 1990; Whalley and Grant, 1994;
Kerstan, 2002) have highlighted the issue of possible non-specificity of the reagents, along
with analyte reabsorption after release. However, this operationally defined speciation,
though not able to definitively determine the specific mineralogical phases to which
potentially toxic elements are bound (Ure and Davidson, 2002), is still a useful tool in the
determination of the ease with which toxic species may be mobilized from environmental
matrices. The progressively increasing rigour of the procedures provides a means for
evaluating the mobility of metals and other toxic elements in geologic materials.
In this chapter, results of geochemical fractionation experiments showing the percentages
of potentially toxic elements thought to be associated with the exchangeable, carbonate and
iron- manganese oxides fractions are presented. A total of thirty nine (39) samples were
analyzed in order to compare geochemical partitioning between contaminated and near
88
pristine samples. Twenty five soil and stream sediment samples collected from villages in
the Anka area, where artisanal gold mining has led to contamination of soils, in and around
living compounds, were extracted using the sequential extraction protocols (SEPs). Details
of the methods used have been outlined in chapter two and the results are summarized in
Figure 18a. A further batch of 14 less contaminated samples from the Birnin-Gwari area
was also analyzed and the results (Fig. 18b) compared with those from the Anka area. As
highlighted in chapter two, the fraction of elements held within sulphide/ organic matter
and residual phases have not been determined, chiefly because they are considered to be of
comparatively low mobility and therefore less likely to constitute immediate
environmental or human health concerns.
4.2 Exchangeable fraction
Elements held within the exchangeable fraction of soils and sediments are the most mobile
and readily available for uptake in the environment. However, in the samples from Anka
area, the amount of elements associated with this fraction is generally very low, ranging
from nearly zero for As and Cr in all the samples up to about 0 to 5 % (mean, 1 %) for Cu
and 0 to 16 % (mean, 2.2 %) for manganese. The percentage of Ni associated with the
exchangeable fraction ranges from 0.35 % to about 6 % with a mean of 1.36 %, while the
range for Pb is 0 to 6 % with an average of about 1 %. Similar low values of between 0 and
4 % (mean, 1.4 %) were obtained for Zn in this fraction. The partitioning of metals in this
phase was found to decrease in the order Mn > Ni > Zn > Cu > Pb > As and Cr.
In the Birnin-Gwari samples, the proportion of metals associated with the exchangeable
fraction is similarly very low, especially for As, Cr and Pb; their concentration in this
fraction generally falling below the detection limit. Mn however shows some significant
concentration in this fraction similar to that in the Anka samples; the extracted amounts
ranging from 0.2 to 12 % (mean, 3.28 %) of total Mn in the samples. Partitioning of Cu, Ni
and Zn in this phase have been found to be comparatively lower with only 0 to 1 % (mean,
89
0.62 %) of total Cu extracted in this step. The range of extractability for Ni and Zn is 0 to 3
% with mean values of 1.67 % and 1.57 % respectively. Based on these results, the
fractionation of the metals with respect to the exchangeable fraction is found to decrease in
the order Mn > Ni > Zn > Cu > Cr, As and Pb.
The results obtained for the exchangeable fraction in this work are similar to those reported
by Singh et al. (1999) for Cu, Mn and Zn in sediments of the Damodar River in India;
Maskall and Thornton (1998) for Pb and Zn in soils contaminated by historical lead
smelting in parts of Derbyshire, England and Clwyd, Wales, UK; Burt et al. (2003) for Cr,
Cu, Pb and Zn in smelter-contaminated soils from Anaconda and Deer Lodge Valley,
Montana, USA and Navas and Lindhorfer (2003) for Mn, Zn and Cr in semi-arid soils of
the central Ebro Valley, Spain. Ullrich et al. (1999) also found low to moderate values for
Pb and Zn in the exchangeable fraction in soils from an area of Pb/Zn mining and smelting
near Bytom, Upper Silesia, Poland, although they reported these to increase significantly
below pH 6. No significant differences appear to exist in the way metals partition in the
exchangeable fraction in samples from the two study areas.
90
Figure 18a Partitioning of potentially toxic elements in three labile phases in soils
and sediments of Anka area, north-western Nigeria. In this work, the Org/Sulf+Res
fraction is the difference between the sum of the SEP steps and the near total
concentration of each element. Locations of the samples are shown in figure 8b.
91
Figure 16a(cont’d)
Most of the elements measured, with the exception of Mn have shown very low association
with this phase in all samples, irrespective of the area they came from (Fig. 18a& Fig.
18b). It seems also that the fact that the samples from Anka had generally higher total
concentrations of some of the elements, especially Pb and Cu, did not affect their
distribution in terms of the exchangeable fraction. Similarly, comparatively higher total As
concentration in the samples from Birnin-Gwari did not appear to enhance its
concentration in this phase relative to the samples from Anka.
92
The low mobilization of all the elements in this step from both areas (Fig. 18a& Fig. 18b)
may be due in part, to the relatively high pH (4.89 – 9.24) obtained for the Anka samples,
which may decrease the solubility and availability of most metals and their ability to form
chelates (Burt et al., 2003; Forstner and Whittmann, 1983). This may be a reflection of the
influence of broadly similar geology, climate and therefore soil type. The generally low
alumina and base contents of these samples (Chapter 3) may be an indication of the paucity
of fine grained clay mineral particles in the sample matrix, which in turn limits the ability
of the soils to sorb trace elements both in terms of low surface area: volume ratios and
negatively charged surfaces.
However, the possibility that these results are affected to some extent by extraction
methods cannot be ruled out; for example, the 0.5 M MgCl2 may not have been able to
completely extract metals bound to this fraction over the 30 minute period used, and some
of the metals associated with this phase may end up extracted together with the carbonate
fraction. The exchangeable fraction is therefore the least geochemically significant of the
three phases determined in the soils and sediments of the Anka and Birnin-Gwari areas of
north-western Nigeria. Mobilization of contaminants bound to this fraction is therefore
considered to unlikely to cause any serious environmental and/or human health problems
of metal toxicity in the two areas; although it may limit the availability of essential
elements to plants and subsequently livestock.
93
4.3 Carbonate fraction
This is the second most labile fraction of heavy metals which can be both authigenic and
detrital. According to Singh et al (1999), this fraction may account for over 50 % of non-
lithogenic heavy metals in polluted sediments. The carbonate fraction contributed a
significant amount of most of the elements measured in these samples (Fig. 18a),
accounting for between 1 and 40 % (mean, 21.6 %) of total As and 0 to 21 % (mean 6 %)
of total Cu in the samples similar to the about 20 % obtained by Van-Herreweghe et al.
(2002) in contaminated soils from, Flanders, northern Belgium. Most of the extractable Pb
was found to be associated with this fraction (Fig.18a), ranging from 1.5 to 61 % of total
Pb in the samples with an average extractability of 24.56 %. Zinc too showed a relatively
strong association with this phase, with about 8 % of the total zinc extracted in this step
(range, 0.6 to 32 %). Manganese, Ni and Cr showed weaker association with the carbonate
fraction compared to the rest, with mean values of 2.91 %, 1.74 % and 0.24 % respectively.
The results show that Pb has a strongest affinity with this fraction, and the amount of
carbonate bound metals was found to follow the order Pb > As > Zn > Cu > Mn > Ni > Cr.
94
Figure 18b Partitioning of potentially toxic elements in three labile phases in soils
and sediments from Birnin-Gwari area, north-western Nigeria. In this work, the
Org/Sulf+Res fraction is the difference between the sum of the SEP steps and the
near total concentration of each element. Locations of the samples are shown in figure
8a.
95
Figure 18b (cont’d)
96
In the case of the Birnin-Gwari samples (Fig. 18b), the partitioning of most of the metals in
this fraction is generally not strong, except for As which showed considerable lability; with
3.5 to 32 % (mean, 16.68 %) of the total As extracted in this phase. This is followed by Cu
(0.4-13 %, mean 4.86 %) and Zn (1-7 %) with an average of 3.51 %. The results for Pb,
Mn and Ni are 0.5 to 9 % (mean, 2.80 %), 0.7 to 3.7 % (mean, 2.04 %) and 0.5 to 3 %
(mean, 1.79 %) respectively; while Cr has the lowest solubility of between 0.1 and 0.4 %
(mean, 0.23 %,). The association of metals with this phase was therefore found to follow
the order As > Cu > Zn > Pb >Mn > Ni > Cr.
The very strong association of Pb with this phase in samples from Anka area (Fig. 18a) is
probably due to the abundance of secondary lead carbonates in the ore that has been
processed for gold by local artisanal miners (Plumlee and Morman, 2011), which serves as
a source of contamination of soils and sediments in the area. Cerussite (PbCO3) has been
shown to be among the most readily solubilised carbonate minerals under acidic conditions
compared to for example, calcite and aragonite (Plumlee, 1999). This also appears to be
the reason for the relatively high concentrations of Cu and Zn in this phase in the Anka
samples due to the similarity of their ionic charge with that of Pb and possibly Ca. The
strong association of Pb and Zn with this phase is consistent with the findings of Li et al.
(2001) in urban soils and road dusts in Hong Kong, although they did not find much Cu in
the fraction.
The data from Anka however contrast markedly with the results from the Birnin-Gwari
area, where the affinity of Pb, Cu and Zn for this fraction was found to be comparatively
low in all samples. This is probably due in part to the low total concentrations of these
metals in the soils and sediments of the area, but it may also be an indication of a geogenic
input of the metals, where the elements are held within structures of less labile minerals.
The reason for the strong fractionation of As in this phase observed for both sample areas
is not clear, but it may be a result of the metalloid occurring in the form of readily soluble
97
arsenate or oxide minerals. On the contrary, the results for Mn, Ni and Cr across the two
sites are broadly similar, showing generally low concentrations in the carbonate fraction.
Cr has consistently been the least soluble of all the elements measured in both the Anka
and Birnin-Gwari areas.
The results show that this fraction is geochemically very significant in terms of the
mobilization of potentially toxic elements into the environment, particularly in the Anka
area. In this area, mainly Pb, but also Cu, Zn and As have been found to be labile and
likely to become readily available for uptake by plants and passed on through the food
chain. In the Birnin-Gwari area however, only As was found to have significant association
with this phase and its release is considered to be the main environmental concern in the
area. Overall, based on these results, we do not envisage any environmental problems
related to the mobilization of Cr, Ni and Mn from this fraction in either area due to their
low association with the phase.
4.4 Fe/Mn Oxide fraction
The Fe and Mn oxide fraction is also known as the reducible phase and constitutes a
significant sink for heavy metals in soils and sediments. It represents the contents of each
element bound to iron and manganese oxides that would be mobilized if the conditions in
the solid matrix became more reducing (Anju and Banerjee, 2010) because the oxides are
thermodynamically unstable under anoxic conditions (Tessier et al., 1979). Mn oxides have
been reported (Hudson-Edwards, 2000) to take up heavy metals mainly through the agency
of adsorption, cation exchange and coprecipitation. But depending on the efficiency of the
previous extractions, the amount of each element extracted in the step may include portions
from the carbonate and exchangeable fractions. This has the tendency to make results
obtained in this step either too high or too low, depending on whether the carbonate bound
and exchangeable fractions have been completely removed, or whether in fact some oxide
bound metals were co-extracted during the carbonate step.
98
Nearly all the elements measured in the samples from the Anka area have shown a strong
to very strong association with this phase (Fig. 18a). The strongest affinity is shown by As
with a range of 2.2 to 67 % (mean, 32.70 %), followed by Mn with a mean of 20.04 %
(range, 4 to 44 %). Except in two samples in which 96% and 35 % was extracted in this
step, the percent extractability of Cu in this phase ranges generally from 2 to18 % (mean,
13.55 %). Zn also shows a wide range of values, between 1.9 and 42 % with an average of
10.64 %, lower than 11.06 % for Pb (range, 3 to 21%). About 0.5 to 20 % (mean, 3.45%)
of total Cr was found to be associated with the oxide phase, while Ni was much less
soluble with only 0.5 to 8 % (mean, 3.19%) recovered in this step.
Based on the mean of the percent extraction, the association of the elements with this phase
generally appears to follow the order As > Mn > Cu > Pb > Zn > Cr > Ni. However, when
the two samples with high to very high Cu values are taken out, then Pb will appear to
show stronger affinity to the phase than does Cu, which is in agreement with the findings
of Li et al. (2001). Contrary to these data, their result shows that the phase has a stronger
affinity for Zn compared to Cu. However, experiments by Murray (1975) and McKenzie
(1980) have shown that the affinity of manganese oxides for heavy metals decreases in the
order Pb > Cu > Zn > Ni, which is broadly similar to that obtained in this work for samples
from Anka, but more especially the Birnin-Gwari area. McKenzie (1980) has found that
Pb was more strongly adsorbed by manganese oxides than by iron oxides, and the
partitioning of Pb onto the oxides was much stronger than that for other metals studied.
This is similar to the results of O’Reilly and Hochella (2003), who concluded that Mn-
oxides are generally more efficient sorbents of Pb than Fe-oxides. Tessier et al. (1979) also
obtained relatively high levels of Cu, Ni, Pb and Mn in this fraction for bottom sediments
from Saint-Marcel and Pierreville, Canada, with more than 20 % of total of each of Cu, Ni
and Pb and 15-24 % Mn found to be associated with the fraction.
99
Similar to its behaviour in the Anka samples, As shows a strong affinity for the Fe/Mn
oxide fraction in the Birnin-Gwari area (Fig. 18b) relative to the other elements: about 4.5
to 41 % (mean, 21.67 %) of the total As was extracted in this step. This is very similar to
that of Mn, which has a percentage extraction in this step of between 4 and 43 % (mean
18.36 %). Compared with As and Mn, most of the other elements show generally weaker
association with this phase, with only Pb showing slightly significant partitioning to the
oxide minerals; 4.5 to 15 % (mean 9.44 %) of total lead was dissolved by the treatment
with hydroxylamine hydrochloride. However, compared with results from Anka, the
Birnin-Gwari samples have more Pb associated with Fe-Mn oxides than with carbonate
phases. This is followed closely by Cu (0.9 to 18 %, mean 6.39 %) and Zn (1.90 to 7.4 %)
with an average of 4.31 %, while the solubility of Ni ranges from 0.6 to 5 % (mean 2.23
%). Cr has consistently been least soluble in these samples, with only 0.2 to 1.6 % (mean
0.79 %) of the total Cr associated with this phase. Based on the mean values, the strength
of the affinity of metals with the Fe/Mn oxide minerals in the samples from Birnin-Gwari
area was found to decrease in the order As > Mn > Pb > Cu > Zn > Ni > Cr.
The mobilization of potentially toxic elements from this fraction is dependent on the pH
and oxidation-reduction (redox) conditions of the environment. Redox reactions have a
controlling influence on the solubility and eventual mobilization of some trace elements in
different geologic systems (Krauskopf and Bird, 2003). For example, the reduction of Mn
and Fe oxides can lead to their mobilization, with oxides of Mn III and IV being more
soluble than Fe III oxides (Hudson-Edwards, 2000). Low pH (acidic conditions) will then
ensure that these ions do not form precipitates with carbonates, sulphates, chlorides or
some of the other anions commonly met in natural solutions (Krauskopf, 1957). This has
implication for the release of associated heavy metals and other potentially toxic elements
bound to Fe/Mn oxides in soils and stream sediments into surface and ground water
systems or making them phytoavailable. The results of this work have shown that this
100
phase is geochemically very significant in terms of the sequestration of most of the PTEs
measured in the samples from both the Anka and Birnin-Gwari areas, and any changes in
Eh conditions, causing the reduction of Fe/Mn oxides in the soils and sediments in the area
may lead to the mobilization of mainly As and Mn in the Birnin-Gwari area and Cu, Pb
and Zn in the Anka region. The results did not, however, show any risks of metal toxicity
associated with the release of Ni and Cr from this fraction in samples from either area.
4.5 Recovery and relative mobility
Element recovery was calculated in order to determine the amount of contaminants held
within the more labile fractions relative to the less reactive forms. While sequential
extraction procedures do not extract elements bound to a given solid fraction, they may be
used to infer the mobility of metals under changing environmental conditions, such as pH
and Eh (Anju and Banerjee, 2010). Considering that only the more labile fractions were
extracted in this work, the partitioning of elements in each of the three fractions, and sum
of the three steps expressed as a percentage of the total concentration, are used in
estimating the possible risk of metal toxicity associated with its mobilization from labile
repositories. It is worth noting that although the sulphide / organic matter bound fraction
was not considered in this work as being very labile, oxidation of sulphide minerals,
especially in the Anka area, will mean that metals held in that fraction will become more
susceptible to mobilization.
101
Recovery is calculated according to the equation:
(∑ )
Eq 8.
The result summarized in Table 8 shows that for samples from Anka, the amount of As
extracted in the three steps as a percent of total concentration ranges from 3.50 to 204 %
with a mean of 97.1 %. The very high percentage recoveries recorded for As in most of the
samples are almost certainly due to the use of total arsenic concentration estimated at half
the detection limit. The true concentration of As may be higher than the estimated 5 µg/g.
For the few samples with total concentration above the instrument detection limit of 10 µg
As/g, the recoveries were found to be generally below 50 %, whereas in one sample with
over 500 µg As/g, only 3.5 % was extracted across the three steps. Similarly, the results for
the Birnin-Gwari samples show that the amount of As extracted across the three fractions
is high, ranging between 8 and 73 %, with an average of 38.4 % of total As in the soils and
sediments of the area. However, unlike the case with the Anka samples, the recovery
values obtained for As in the Birnin-Gwari area do not suffer from the problem of
estimated total concentrations; the mean total As concentration in these samples is 26.8
µg/g, well above the instrument detection limit of 10 µg/g.
A similar pattern was observed for Cu and Pb, where samples with higher total
concentrations gave comparatively lower recoveries relative to those with low
concentrations, especially those close to, or below, the detection limits. Although Cu
recovery seems to span a wide range (3.3-118.6%, Table 8) in the Anka samples, nearly
80% of the samples have values not exceeding the mean of 20.6 %, indicating that the
larger values are contributed by just few samples, while for the Birnin-Gwari area, Cu
recovery was slightly lower, falling in the range of 1.5 to 31 % (mean, 11.9 %).
Discounting the samples from Anka with very high values, the difference between the two
data sets is quite small. However, the data indicates that there is more likely to be problems
102
of Cu toxicity in the Anka area than in Birnin-Gwari, because of the existence of the metal
in comparatively more labile forms in the former area.
Table 8 Results of recovery calculation for the three step extraction of samples from
Anka and Birnin-Gwari areas.
Element Anka area Birnin-Gwari area
Range Mean Range Mean
As 3.6 – 204 97.1 8 - 73 38.4
Cr 0.6 - 20.8 3.6 0.4 - 2 1
Cu 3.3 - 118.6 20.6 1.50 - 30.7 11.9
Ni 3.3 - 15.2 6.6 3.4 - 7.4 5.7
Mn 6 - 45.5 25.2 6.3 - 46.5 23.7
Pb 8 – 65 38 5.6 - 19 12.3
Zn 4 – 74 22 4.6 - 12.4 9.4
Similarly, the amount of Pb dissolved across the three steps generally falls between 20 and
65 % (mean, 38%) of total metal in the Anka samples, with only three samples with very
high total concentrations (~60, 000 – 120, 000 µg Pb/g) giving recoveries of between 8
and 10 %. In the Birnin-Gwari samples, however, the recovery of Pb is comparatively low,
falling between 5.6 and 19 % (mean, 12.3 %). Overall, Pb was found to be very soluble in
the Anka samples, to a large extent contributed by the dissolution of Pb from the carbonate
fraction, but also the oxide phases. The high rates of mobilization of Pb in the Anka area
have the potential to make the metal more environmentally accessible, through for example
drinking water, hand-to-mouth ingestion of contaminated soils and sediments and uptake
by crops, thus increasing the risk of Pb toxicity in the area. In vitro bioaccessibility of Pb
in selected samples from this area has been found (Chapter 5) to be very high, resulting in
the minimal risk level for Pb being exceeded in all samples. In the Birnin-Gwari area
however, Pb toxicity is less likely to be a problem, due to the generally low total
concentrations coupled with its low mobility in the samples as indicated by these data.
103
The amount of manganese recovered in both the Anka and Birnin-Gwari samples is
relatively high, ranging from 5.9 to 45.4 % (mean, 25.2 %, Table 8) and 6 to 47 % with a
mean of 23.7 % for the two areas respectively. This is contributed mainly by the metal
extracted from the Fe/Mn oxide phases by hydroxylamine hydrochloride which is thought
to be specific to Fe/Mn oxides, but also some significant input from the carbonate and to a
lesser extent, exchangeable fractions. The mobilization of Zn in the Anka samples is highly
variable across the samples, ranging from 4 to 74 % (mean, 22 %), without any clear
pattern. In the Birnin-Gwari samples, however, Zn recovery was very low, only 4.5 to 12.5
% (mean, 9.4 %) being mobilized.
The result for Ni in the Anka area is in the range of 3.3 to 15.2 % (mean, 10.2 %), slightly
higher than 3.3 to 7.5 % (mean, 5.7 %) for samples from Birnin-Gwari area. The
dissolution of Cr in both study sites has been found to be very low, yielding recoveries in
the range of 0.6 to 20 % with mean value of 3.2 % for the Anka samples and 0.4 to 2 %
(mean, 1.0 %) for Birnin-Gwari respectively, reflecting the very low concentration of Cr in
all the three fractions. These recovery values obtained for Cr and Ni are not commensurate
with their total concentrations in samples from both areas: the results therefore show that
the two metals are bound to less labile fractions in the soils. Giving the generally low loss
on ignition (LOI, %) obtained for these samples (Chapter 3), the organic matter bound
fraction is less likely to be a significant store for these elements; the bulk of their
concentration is expected to reside within the residual silicate mineral phases, consistent
with the findings of previous workers (Morillo et al. 2002; Shikazono et al., 2012) in
sediments of Odiel River, Spain and Tamagawa River in central Japan respectively and
Burt et al. (2003) who found that > 80 % Cr and > 78 % Ni are bound to the residual
fraction in soils from the Anaconda and Deer-Lodge Valley, Montana, USA. The low
solubility of Ni and Cr in all the samples from both areas, points to their low accessibility
104
in the environment and therefore are considered to be potentially of low toxicity in both
areas.
In spite of the high concentrations obtained for some of the elements, especially in the
Anka samples, the results (Table 8) show that less than 50 % of the total concentration of
most of the elements is easily mobilizable. In the Anka area for example, the percentage of
total As, Cr, Cu and Ni that remained intact in the samples after the three extractions is
estimated to be approximately 3 %, 97 %, 79 % and 93 % respectively. The same for Mn,
Pb and Zn is 75 %, 62 % and 78 % respectively. The figures are even higher for the Birnin-
Gwari samples, ranging from about 62 % for As to 99 % for Cr. The fact that more than 50
% of the total concentration of all the elements, except As in the Anka area, is held within
the less labile phases, illustrates the difficulty of assessing the risk posed by toxic elements
on the basis of their total concentration in geologic materials. However, Pb and to a lesser
extent Cu, is likely to become more mobile in the Anka area in the future due to oxidation
of sulfide minerals in the soils. Metal sulphides are said to be easily oxidizable under
surficial conditions to soluble sulphides and sulphates (Anju and Banerjee, 2010) that are
subsequently mobilized into the environment.
105
Figure 19 Scanning electron micrograph and energy dispersive spectra showing a
fine galena particle and its chemical signature.
106
Scanning electron microscopy analysis (Fig.19) has shown that the soils in the area contain
fine particles of galena (PbS), which was introduced into the soils through the extraction of
gold from lead rich ores. These results, along with the in vitro bioaccessibility results
presented in Chapter 5 confirm that the sequential extraction protocols, despite their
apparent shortcomings are better predictors of the mobilization and human bioaccessibility
of heavy metals and other toxic elements in soils and stream sediments compared to using
total concentration alone (Tessier et al., 1979; Ullrich et al., 1999; Singh et al., 1999;
Romaguera et al., 2008).
4.6 Chapter Summary
The aim of this chapter has been to study the geochemical partitioning of potentially toxic
elements (As, Cr, Cu, Ni, Pb and Zn) in soils and sediments from the Anka and Birnin-
Gwari areas of north-western Nigeria. Unlike most previous studies, this work considered
only that portion of contaminant elements associated with the three most labile fractions,
namely, the exchangeable, carbonate and Fe/Mn oxide bound fractions.
The results show that in both study areas, most of the elements are generally weakly
associated with the exchangeable fraction of the soils and sediments. This is thought to be
on the one hand, a result of the paucity of fine clay particles and exchangeable base
cations, which have been depleted by leaching into deeper horizons of the tropical
weathering profile and overland runoff. On the other hand, soils, most especially in the
Anka area, may not have had long enough to interact with contaminant elements, which
have only recently been introduced into the environment by artisanal mining to allow for
the sorption of trace metal ions onto sorbent particles.
107
There is, however, a strong association of most of the elements, especially Pb and Zn with
the carbonate fraction in soils and sediments of the Anka area. The high concentration of
Pb obtained in this step is thought to be due to presence, in the contaminating ores, of
highly soluble secondary Pb carbonates (Plumlee and Morman, 2011). This has a serious
implication for the mobility and bioaccessibility of the metal and is considered to be the
main reason for the high bioaccessible Pb obtained in this work (Chapter 5). Only As
showed a significantly strong affinity for this phase in the samples from the Birnin-Gwari
area; all the other elements only weakly portioning into the carbonate fraction. This is
probably an indication of geogenic contribution of the elements into the soils, as opposed
to the clearly anthropogenic signature of the samples from the Anka area.
The Fe/Mn oxides phase showed strong to very strong association with most of the
elements in the Anka area, but slightly less so for the Birnin-Gwari study area. As and Mn
partition more strongly into this phase in both study areas compared to the other elements.
Similarly, Pb was found to be associated more with this fraction in the Birnin-Gwari soils
and sediments, compared to its partitioning in the carbonate fraction in the same area,
which contrasts with its behaviour in the Anka area. The generally strong partitioning of
elements into this phase, particularly in the Anka area may be an indication of the strong
affinity between the Fe/Mn oxides and trace elements, or the presence of secondary oxide
minerals in the contaminating ores (Plumlee and Morman, 2011). However, there is the
possibility that the yield in this step is affected by the co-extraction of portions of elements
held within the previous two phases.
The results show that despite the high concentrations of some of the elements obtained in
the carbonate and oxide phases, less than 50 % of the total concentrations of all the
elements were extracted across the three extraction steps. This shows that the bulk of the
elements is held within, or associated with, the less labile organic matter/ sulfide and
residual silicate fractions. The elements associated with these low solubility phases are not
108
likely to be of serious environmental and human health concern over short periods,
although some may become more mobile over the long term. However, these results have
shown that in spite of earlier criticisms, the sequential extraction procedures are useful in
inferring the ease with which contaminant elements are mobilized; making them better
indicators of the ecological and human health risks of potentially toxic elements, compared
to the determination of total concentrations alone. Their risk assessment potential may be
further enhanced if they are combined with the in vitro bioaccessibility measurements
discussed in the next chapter.
109
Chapter Five
Results: In vitro Bioaccessibility of Heavy Metals
5.1 Introduction
The bioaccessibility of arsenic, chromium, copper, manganese, nickel, lead and zinc in the
soils and sediments of the Anka area was determined using in vitro extraction procedure
described in the materials and methods section. In this chapter, the results are presented,
beginning with the bioaccessibility and estimated contaminant daily intake for a child 2-6
years old. The relationship between total concentration presented in chapter three and
bioaccessible concentrations of potential toxicants is presented in the form of a correlation
matrix and its implication examined. The effects of physicochemical variables, namely,
pH, time and the ratio of solid test material weight to extraction fluid volume on
contaminant bioaccessibility are presented in the next section.
5.2 Bioaccessibility
The bioaccessible concentration of potentially toxic elements in the samples is presented in
Appendix 13 and the same concentrations for lead and copper are shown in Figure 20
plotted against their total concentration. The range and mean (± standard deviation) of oral
bioaccessible concentration of arsenic, chromium, copper and manganese measured in 25
samples from the Anka area are 0.9 to 14.1 µg/g (mean 2.4 ± 2.7 µg/g), 0.1 to 8.7 (mean
2.2 ± 2.7 µg/g), 1.5 to 384.6 µg/g (mean 87.1 ± 121.8 µg/g) and 20.2 to 335.9 µg/g (mean
112.7 ± 90.6 µg/g) respectively. For nickel, lead and zinc, the values lie between 0.2 and
5.3 µg/g (mean 1.5 ± 1.4 µg/g), 197.5 and 41740 µg/g (mean, 9731.7 ± 12058 µg/g) and
0.8 and 295.2 µg/g (mean 37 ± 71.6 µg/g) respectively.
110
Figure 20 Total and in vitro bioaccessible lead and copper concentrations in randomly
selected samples from the different sampling sites in the Anka area.
111
5.2.1 Human Bioaccessible fraction
The human bioaccessible fraction (HBA%) which is the proportion of arsenic, chromium,
copper, manganese, nickel, lead and zinc that is extracted into the simulated gastric fluid as
a percentage of their total concentration in the 25 soil and sediment samples was worked
out according to the equations:
.…………………………………Eq 9.
The bioaccessibility (BA%) for these elements is presented in Table 9 and it shows that
the range of arsenic bioaccessibility is 2.6 to 105.1 %, the mean of 29.1 % appearing to be
a better indication of the bioaccessibility on a sample-by-sample basis. Chromium
bioaccessibility is generally low, falling between 0.2 and 17.1 % with an average of 3.5 %;
while the minimum bioaccessibility for copper is 2.6 %, the maximum been 92.0%. The
mean of 30.3 % again reflects the fact that the variability of copper bioaccessibility in all
the samples is not as wide spread as indicated by the range; with only few samples having
very high values. The range is 3.2 to 37.3 % (mean, 15.1 %) for manganese and 1 to 11%
(mean, 4.3 %) for nickel. In this work, lead has the highest bioaccessibility, which ranges
from 28.7 to 100.4 % (mean, 60.3 %) while the result for zinc is between 2.2 and 74.7 %
with an average of 21.1 %.
The bioaccessibility values above 100%, especially for arsenic may be in part a result of
the use of an estimated total concentration in samples with low concentrations, which is
taken as half the limit of quantification of the XRF instrument (Nehls and Akland, 1973;
Kushner, 1976), but could as well have resulted from sample heterogeneity (Morman et al.,
2009).
112
Table 9 In vitro bioaccessibility (IVBA%) of potentially toxic elements in soils and
sediment of Anka at pH 1.50.
Sample As Cr Cu Mn Ni Pb Zn
A1 29.1 3.2 2.6 9.3 1.1 28.7 6.0
A2 7.5 0.3 29.0 8.2 1.1 65.3 3.7
A4 28.3 2.8 21.0 11.5 11.1 57.6 43.2
A5 25.7 0.9 41.8 19.3 2.6 60.6 7.3
A6 27.0 15.1 19.6 32.7 6.6 35.5 9.3
A7 30.2 8.8 23.8 16.9 2.0 100.4 4.3
A8 24.5 1.5 15.0 7.7 5.1 66.0 9.9
A10 21.2 0.7 70.4 19.3 6.1 68.1 58.4
B1 97.2 11.2 13.3 8.5 4.7 34.0 8.7
B2 11.5 4.3 17.2 15.2 3.9 60.0 4.5
B3 2.6 2.5 28.7 27.9 5.9 57.1 25.8
B4 4.1 1.0 23.5 27.6 5.4 52.3 10.8
B5 7.8 0.2 32.3 4.1 2.3 59.0 6.1
B7 46.1 0.7 19.7 18.2 4.0 56.8 58.0
D1 26.9 1.4 5.9 3.4 1.0 49.2 2.2
D2 28.4 2.3 13.8 3.2 1.7 74.2 10.6
D4 18.1 1.0 92.0 5.1 3.4 69.3 4.7
D5 33.6 0.7 28.0 7.5 2.1 65.6 9.2
D7 26.3 17.1 6.9 9.7 1.9 61.9 6.6
D9 19.7 0.8 34.5 10.4 2.8 66.0 4.4
TS3 9.3 0.3 42.2 9.9 4.7 69.8 21.8
TS4 75.0 8.2 7.5 26.5 5.0 41.4 42.0
TS5 9.5 0.4 45.5 18.5 4.7 60.4 43.2
TD6 105.1 2.3 43.6 37.3 8.2 78.9 74.7
TD10 12.9 0.8 79.2 20.9 9.8 69.0 52.5
Min 2.6 0.2 2.6 3.2 1.0 28.7 2.2
Max 105.1 17.1 92.0 37.3 11.1 100.4 74.7
Mean 29.1 3.5 30.3 15.1 4.3 60.3 21.1
113
Although As bioaccessibility obtained in this work appears to be widely variable, in reality
only four samples have above 40 % bioaccessibility, with the majority of the samples
falling around 10-35 %. These values for As compare well with the results of Button et al.
(2009), who obtained values in the range of 10-34 % human bioaccessible As in
contaminated soils from the Devon Great Consols in south-west England and 42% from an
uncontaminated comparison site at Nottingham, also in England. Arsenic can occur in
many primary or secondary minerals either as a dominant or trace component (Plumlee or
Morman, 2011) and results of gastric extraction show that the arsenate and oxide forms are
more readily bioaccessible while arseno-pyrite and the crystalline iron arsenate (scorodite)
have lower solubility respectively (Plumlee and Ziegler, 2004).
Similarly, except for four of these twenty five samples, the results show a rather close
agreement with the data of Morman et al. (2009), where Cr bioaccessibility in background
soils was reported to range between 0.3-3.5 percent for the < 2mm fraction and 0.5-7.5
percent for the < 250 µm fraction, whereas the mean value obtained in this study is 3.5 %.
A similar result was obtained by Sialelli et al. (2010), where less than 3% of the near total
chromium was available in the gastric leachate of soils in Glasgow, UK. In spite of its
relatively high total concentration in the samples, which is in turn a reflection of the natural
abundance of the element especially in basalt and shale (Callender, 2004), Cr appears to
have low solubility and therefore bioaccessibility. The fact that Cr3+
is able to form stable
crystalline oxyhydroxides with iron and aluminium (Callender, 2004) may explain why it
is less soluble, but it could equally point to the possibility of Cr in these samples residing
in less soluble oxide mineral structures, such as chromite.
The higher bioaccessibility of lead across all the samples (Table 9) is in part a function of
the higher total concentration of the element in the samples (Fig. 20). But it is also
influenced by the abundance of very labile residual lead oxide and lead carbonate minerals
in the ores reported by Plumlee and Morman (2011) and also confirmed by strong
114
partitioning of lead into these phases seen during the SEPs experiments (Chapter 4) in this
work. Casteel et al. (2006) have shown that oral lead bioaccessibility in human children is
highest in lead carbonates and lead associated with manganese oxides. According to them,
lead phosphates and oxide minerals and lead associated with iron oxides show intermediate
bioaccessibilities, while lead sulphides and silicates (residual phases) are the least
bioaccessible. The mean lead bioaccessibility obtained in this work is very similar to that
reported (64 %) for mining contaminated soils in Brazil and 75-80 % for a certified
reference soil, SRM 2710 by Bosso and Enzweiler (2008) using the PBET method, while
the mean lead bioaccessibility of 39.1 % for urban soils in Guanzhou, China (Lu et al.,
2011) is also within the range obtained here. Similarly, gastric bioaccessibilities of
between 23 and 69 % obtained in lead-rich mine wastes by Jaggard (2012) are also broadly
similar to the results of this work. However the results of this study are higher than median
lead bioaccessibilities of 23 % for the < 2 mm and 18 % for < 250 µm fractions
respectively obtained by Morman et al. (2009) from uncontaminated background soils in
the United States, which is perhaps a pointer to the important role mineralogy and total
element concentration can play in its bioaccessibility.
In this study, copper exhibited the second highest bioaccessibility, it too has high total
concentration in samples (Fig. 20), owing to the fact that the contamination results from
the extraction of gold from ores rich in Pb and Cu minerals. Like Pb, the bioaccessibility of
Cu, is higher when present in the carbonate minerals, such as malachite and azurite
compared to the sulphide minerals chalcopyrite and chalcochite, although some sulphate
minerals of Cu have been shown to be very soluble (Plumlee and Ziegler, 2004). The
mobilization of Zn and Ni are also enhanced by the presence of carbonate and sulphate
phases in soils and sediments compared to the sulphide minerals (Plumlee and Ziegler,
2004).
115
5.2.2 Correlation Analysis
A Pearson correlation analysis was carried out (significant at p = 0.01) between total
elemental concentration in the samples and the bioaccessible concentration. The results
indicate that there is a generally strong to very strong positive correlation between total
concentration and bioaccessibility of most of the elements, with correlation coefficients of
0.89 for As, 0.70 for Cu, 0.74 for Ni, 0.94 for Pb and 0.86 for Zn. This relationship is
depicted in Figure 20 for lead and copper, where in all samples, there is a generally
positive linear relationship between total lead and bioaccessible lead (less so for copper).
However, the plot shows a more linear relationship between total and bioaccessible lead
than for copper, especially in samples with relatively lower total lead concentration. But
the relationship appears to be less linear in samples with very high total lead contents. The
relationship is, however, not so strong for manganese (r = 0.45) and totally absent for
chromium (r = 0.07) which may show that these two elements are not contributed by the
mine wastes, but come largely from geogenic sources. The strong relationships which
appear to exist between the total and bioaccessible concentrations especially for Pb, but
also Cu, Zn, Ni and As may be a result of the introduction of the elements into soils and
sediments during the processing of ores, the higher bioaccessibilities occur because the
elements had relatively short time to bind to soil and sediment phases (Button et al., 2009).
The results do not show any correlation between the bioaccessible concentration of the
elements and soil pH except for Zn (r = 0.70, p < 0.01), indicating that the pH of the soils
and sediments may not have any effect on the bioaccessibility of the elements.
Similarly, the correlation analysis reveals a generally strong to very strong relationship
between the bioaccessible concentration of these elements and their concentration in two of
the three fractions determined in the sequential extraction procedures (SEPs, Chapter 4)
and the sum of the three fractions. The correlation (at p = 0.01 level of significance)
between the bioaccessible and carbonate fraction concentrations range from r = 0.60 for Pb
116
to 0.99 for Zn (the values for As, Cr, Cu, Mn and Ni been 0.98, 0.70, 0.97, 0.91 and 0.89
respectively). For the relationship with the Fe/Mn oxide fraction, the range is 0.73 for Ni to
0.99 for Zn, the r values for As, Cr, Cu and Pb been 0.96, 0.89, 0.77 and 0.92 respectively.
Mn exhibits a different behaviour, showing a rather weak correlation (r = 0.41) between
the bioaccessible and oxide bound concentrations. This may be due to very high
concentrations of manganese in the Fe/Mn fraction of the SEPs, occasioned by the fact that
the extraction step was developed specifically for manganese and iron oxides bound
metals. All the elements showed a weak correlation with the exchangeable fraction, with
only Cu, Pb and Mn showing fairly strong relationship (r= 0.46, 0.48, and 0.49
respectively). That manganese has the strongest correlation with this fraction may be an
indication of stronger geogenic contribution of the element in the samples relative to the
others.
When all the three SEP fractions were combined, the sums correlated positively strongly
with the bioaccessible concentration, the r values generally lying between 0.58 for Mn and
0.99 for Zn. This strong relationship between the results, such as that for Pb (Fig. 21) from
the two different leaching protocols may be used as a check on the quality of each of the
extraction methods. While the sequential extraction procedures try to mimic mobilization
of contaminants from the natural geologic environment, the in vitro bioaccessibility tests
explore the release of these species into body fluids, in this case, gastric juices. However,
the object of both schemes is to estimate the risk to human health associated with the
uptake of contaminants from geological materials. The strong agreement between these
datasets raises the question of whether one of the methods could be used as a proxy for the
other, especially where rapid screening is needed to guide decision making about the
existence of human health risks. Under such conditions, the in vitro bioaccessibility test
may be a method of choice because the procedure is less time consuming and more
reproducible (Fig. 12) compared to the SEPs. However, the in vitro method generally
117
seems to yield higher concentrations as indicated by the slope of Figure 21, relative to the
sum of the SEPs. This is mainly due to the lower pH of the (1.5) of the bioaccessibility
solutions, which is unlikely to be achieved in the natural environmental settings which the
SEPs attempt to mimic, except for example, under the influence of acid rock drainage.
Figure 21 Relationship between measured bioaccessible concentration of Pb and the
sum of its concentration in the three SEP extraction steps.
5.3 Physicochemical controls on oral bioaccessibility
The physicochemical parameters that are likely to affect the oral bioaccessibility of
contaminants have been identified by previous workers (e.g, Drexler and Brattin, 2007) to
include the pH of the extraction solution, extraction temperature, and length of extraction
time; the feed or fast status and the ratio of the extraction fluid to the weight of test
material. Different schemes have been proposed in the literature, using various
combinations of these variables. In this work, the effects of pH, extraction time and solid/
fluid ratio have been investigated and the results are presented in the sections that follow in
the form of comparison graphs.
118
5.3.1 Effect of pH
The bioaccessibility of six potentially toxic elements at three pH levels is presented in
Figure 22 (a-g) and Appendix 14. This indicates that Cr, as expected is most accessible at
the lower pH of 1.5, followed pH 2.9 and pH 2.2 in that order. The situation is completely
different for As, where the extraction of the element seems to be enhanced with increasing
pH, with the trend showing a decrease in As bioaccessibility as the pH decreases from 2.9
to 1.5. A similar but not exactly the same behaviour is exhibited by Mn, Ni and Zn (Fig.
22), where the highest of the three pH levels appear to leach out more of the metals
compared to the more acidic treatments. Cu and Pb extraction on their part have a more
linear relationship with the pH of the extraction solution, generally decreasing as the pH of
the solution increases, except in few samples, especially B2, where the bioaccessible
concentration of Pb appears to rise with the rising of pH. Repeat Measures ANOVA was
performed on this data in order to verify the observations made from the graphs. While the
results of this statistical test (Table 10) could not discriminate which pH level was more
effective in extracting the elements, it does show that pH has a significant effect (p < 0.05)
on the leaching of As, Cr, Cu and Pb, but not of Mn, Ni and Zn. The link between the two
data sets is not very clear, but a pattern seems to form for Cr, Cu and Pb which shows that
pH has had an effect on their solubilization. It becomes more difficult to explain the
pattern in terms of the effect on As and to some extent Mn, Ni and Zn, because of the
irregular nature of the responses.
120
Figure 22 Effect of pH on the bioaccessibilityof potentially toxic elements in soils and
sediments: a, arsenic; b, chromium; c, copper and d, nickel.
121
Figure 22 (continued): e, manganese; f, lead and g, zinc.
122
According to Drexler and Brattin (2007) human gastric pH generally falls between 1 and 4
under fasted conditions, but may reach 5 for a few hours after the intake of food. The pH
range used in this work therefore falls within the fasted range and in general, a reduction in
pH is expected to result in an increase in the dissolution of contaminant elements from an
earth material. The effect of gastric pH is important when assessing the risk associated
with ingestion of soil borne toxic elements, especially in economically deprived areas
(Bosso and Enzweiler, 2008) such as this study area. In such areas, irregular feeding habits,
often exemplified by the skipping of certain meals, means stomach pH remains low enough
over long periods of time to ensure effective dissolution of contaminants incidentally
ingested by children. Turner (2011) points out, however, that the pH dependence of
mobilization in the gastric environment is metal specific: co-variation of pH and chloride
concentration in the human stomach allows the formation of very soluble metal
chlorocomplexes. According to Plumlee and Ziegler (2004), within the acidic human
stomach, most base metals, including Pb, Fe, Cu, Zn, Cd, Ni and Co are likely to be
complexed chiefly by chloride. Turner (2011) reports that the accessibilities of Cr and Pb
are more sensitive to pH, showing significant reduction in going from low to high pH, but
Zn accessibility is comparatively less affected. This is similar to the results of this work,
which show Cr and Pb accessibilities decreasing with increase in pH, but not that of Zn
(Fig. 22).
5.3.2 Effect of incubation time
Three sample incubation times were used to assess the effect of extraction time on
accessibilities of elements in soils against the background of the reported half-time of
stomach emptying time in human beings of about 1 hour (Washington et al., 2001). The
results presented in Figure 23 (a-g) and Appendix 15 show that the accessibility of Cr
changed consistently with length of time of extraction, the highest values obtained when
the set up was left standing for seventeen hours. Among the other elements tested, only Cu
123
and Mn showed marginal increases in accessibility after 2 hours and 17 hours compared to
the 1 hour extraction time. The solubility of As, Pb and Zn remained unchanged over the
entire period (Fig. 23). Repeated Measures ANOVA analysis (Table 10, p < 0.05) indicates
the length of extraction time was not a significant factor affecting As, Mn, Pb and Zn
solubilization, but it did affect the mobilization of Cr F(1.20, 10.83) = 141.13, p < 0.05
and to a lesser extent, Cu, F(1.01, 9.10) = 6.99, p < 0.05. The high F value for Cr shows
the high significance of incubation time on the bioaccessibility of the element in these
samples (Fig.23b).
Stomach emptying rate or residence time is said to be a complex function of the degree of
smooth muscle stimulation, humoral signalling in the gut, and food composition if present,
time of day and other physiological factors (Drexler and Brattin, 2007). Whatever the
factors controlling stomach emptying, it does appear that for most of the elements studied
in this work, longer extraction time does not enhance their accessibility. Drexler and
Brattin (2007) and US EPA (2008) also found no significant difference in the in vitro
bioaccessibility of Pb when the time was varied from 1 to 4 hours and therefore adopted an
extraction time of 1 hour, in order to minimize testing time.
124
Figure 23 Effect of incubation time on bioaccessibility of potentially toxic elements in
soils and sediments: a, arsenic; b, chromium, c, copper and d, nickel. Notice the jump
in chromium mobilization after samples were left to stand overnight.
125
Figure 23 (continued): e, manganese; f, lead and g, zinc. The different shape of the
zinc plot is as a result of removal of a sample which appeared to be an outlier.
126
5.3.3 Effect of solid: fluid ratio
The ratio of fluids to solid in the human stomach varies depending on feeding status and
the amount of contaminated earth material ingested. In this work, the effect of solid/ fluid
ratio on the accessibility of PTEs was investigated using three combinations of the test
material to the extraction fluid. The results are presented in Figure 24 (a-f) and Appendix
16 and these show that As mobilization decreased as the weight of the test material
increased against the volume of the extraction solution in the order 0.5 g: 50 mL > 1 g :50
mL > 1 g : 25 mL respectively. However, this pattern is restricted to As and to an
insignificant extent Ni; as the accessibilities of Cr, Cu, Mn and Pb did not appear to change
with variation in the ratio of solid sample to extraction fluid volume (Fig. 21). Results of
One-way Repeat Measures ANOVA (Table 10) confirmed these observations. Arsenic
mobilization in the three treatments is very significantly different F(1.65, 14.80) = 210.65,
p < 0.05, but only slightly so for Ni F(1.20, 9.63) = 14.20, p < 0.05, whereas the
concentrations of each of Cr, Cu, Mn and Pb were not significantly different across the
three combinations of sample to extraction fluid (Fig. 24).
A wide range of ratios have been reported in the literature, ranging from 1: 100 to 1: 500
(Turner, 2011) and as high as 1: 1000 (Wragg et al., 2011). Drexler and Brattin (2007)
performed tests on a variety of standard reference materials and reported no significant
variation in the in vitro bioaccessibility with soil masses as low as 0.2 g per 100 mL of
extraction fluid (1:500). Because actual test materials may not be as homogenous as
reference materials and because of weighing errors, they proposed a ratio of no less than
0.4 g test material per 100 mL of fluid to reduce possible variability in bioaccessibility.
However, Wragg et al. (2011) have reported the use of a ratio of 1: 1000 in order to
eliminate poor reproducibility occasioned by high As concentration in soils contaminated
with mine wastes and slag, although they too acknowledged the possible effects of sample
in-homogeneity. The use of ratios of between 1: 25 to 1: 100 (Fig. 24) in this work did not
127
result in a significant difference in bioaccessibility, except for As and to a lesser extent, Ni.
The comparatively lower total Pb concentration in samples used for this experiment may
have helped to avoid the problem of extraction fluid saturation and lead chloride
precipitation (Drexler and Brattin, 2007; US EPA, 2008) reflected in samples with highly
soluble Pb minerals such as lead acetate, lead oxide and lead carbonates . Even when a
ratio of 1 g in 25 mL fluid was used, no significant difference was observed in spite of the
presence of more sample mass and surface area. Unless one is dealing with highly
contaminated samples exceeding the 50,000 µg Pb/g limit set by previous workers, it
appears that the ratios used in this work are useful when there is limited sample supply.
128
Figure 24 Effect of solid: fluid ratio on the bioaccessibility of potentially toxic
elements in soils and sediments: a, arsenic; b, chromium; c, copper and d, nickel.
129
Figure 24 (continued): e, manganese and f, lead.
130
5.4 Contaminant Daily Intake
The chemical or contaminant daily intake is used to assess the exposure of humans,
especially children to contaminant elements through ingestion of contaminated soil. For a
child 2 to 6 years old, weighing 17.8 kg (USEPA, 1997), the daily chemical intake (CDI,
µg kg-1
day-1
) is calculated using the following formula:
………………………………………………………...Eq 10,
where CS is the total concentration of the contaminant element in the sample (µg/g), IR is
the ingestion rate set at (USEPA, 2002) 200 mg soil per day, BA is the mean
bioaccessibility of the element in the test materials, EF represent the exposure frequency,
in this case 0.5 (182 days per year, Hemond and Solo-Gabriele, 2004), BW denotes body
weight and CF is the unit conversion factor (10-3
).
The CDI estimates for this work are shown in Table 11 including the range, mean and the
minimal risk levels, tolerable daily intake or lowest observable adverse effect levels (MRL;
TDI; LOAEL, µg kg-1
day-1
) for the elements. These show that children exposed to these
soils are likely to ingest between 0.8 to 87.2 µg As /kg per day with a mean of 5.2
µg/kg/day, while the range for chromium is 0.6 to 3.5 µg/kg/day, the average being 1.5 µg
Cr /kg per day. The results show that the CDI for copper ranges between 0.9 and 612.5 µg
Cu /kg per day with an average dose of 117.2 µg /kg/day. Manganese intake is estimated to
fall between 25.5 and 170.2 µg Mn /kg /day with a mean of 64.8 µg Mn/kg/day. For nickel,
the results range from 0.1 to 2.2 µg Ni /kg per day, with a mean daily intake of 0.9 µg
Ni/kg.
131
Table 11 Estimated contaminant daily intake (CDI, µg/Kg/day) for children 2-6 years
old living in the contaminated villages, at a gastric pH of 1.5.
Sample As Cr Cu Mn Ni Pb Zn
A1 0.8 0.7 612.5 170.2 1.7 20895 14.5
A2 2.0 0.8 0.9 25.5 0.4 128 3.2
A4 0.8 0.9 85.1 59.6 0.9 8229 11.3
A5 0.8 1.0 8.3 42.5 0.7 685 3.9
A6 0.8 1.1 306.2 68.1 1.0 25738 6.9
A7 0.8 0.9 68.1 59.6 1.3 3454 10.9
A8 0.8 0.9 34.0 51.0 0.4 2879 3.2
A10 0.8 0.7 0.9 42.5 0.3 111 9.5
B1 0.8 1.6 493.4 59.6 1.6 41587 25.4
B2 5.4 1.8 238.2 51.0 1.4 20015 27.4
B3 87.2 3.5 221.2 97.4 2.2 9584 28.5
B4 14.6 3.2 29.8 76.6 1.8 451 7.7
B5 2.3 2.8 1.7 102.1 0.9 136 4.6
B7 0.8 3.5 7.0 119.1 1.7 938 42.6
D1 0.8 1.7 78.4 68.1 0.8 1287 7.8
D2 0.8 2.0 70.6 93.6 0.7 4098 5.8
D4 0.8 0.7 0.9 34.0 0.1 417 1.9
D5 0.8 1.6 3.6 68.1 0.8 881 5.2
D7 0.8 0.9 391.3 68.1 0.8 12937 6.6
D9 0.8 1.0 2.4 42.5 0.4 291 2.7
TS3 2.0 1.4 0.9 25.5 0.3 121 3.8
TS4 0.8 1.3 255.2 51.0 0.9 16730 35.8
TS5 2.1 1.2 0.9 34.0 0.3 111 5.3
TD6 0.8 0.6 17.0 76.6 0.5 5283 46.9
TD10 1.6 0.7 0.9 34.0 0.2 168 9.1
Min 0.8 0.6 0.9 25.5 0.1 111 1.9
Max 87.2 3.5 612.5 170.2 2.2 41587 46.9
Mean 5.2 1.4 117.2 64.8 0.9 7086 13.2
Median 0.8 1.1 29.8 59.6 0.8 1287 7.7
MRL 0.3 1 10 60+ 12* ~3.6* 300
MRL- minimal risk levels (ATSDR, 2008); *TDI- Tolerable daily intake worked out from the
provisional tolerable weekly intake (PTWI) of 25 µg/kg (DEFRA, 2002). +LOAEL- lowest
observable adverse effect level (Greger, 1998).
132
More significant however, is the data for lead, which shows that the possible daily intake
of lead from soil ranges from 110 to 41,585µg Pb /kg per day with a mean of 7,086 µg Pb
/kg of body weight daily. The situation is less severe for zinc, having values in the range
of 1.9 to 46.9µg/kg/day and a mean of 13.2µg Zn/kg/day.
The mean values for arsenic, chromium and copper generally exceed the oral chronic
minimal risk levels (MRLs) published by ATSDR (2008) of 0.30, 1.00 and 10.00
µg/kg/day respectively and tolerable daily intake (TDI) of ~3.6 µg/kg/day for lead worked
out from a provisional tolerable weekly intake (PTWI) of 25 µg/kg body weight (DEFRA,
2002). However, the mean CDI of 13.2 µg Zn /kg/day is very much within the 300
µg/kg/day oral minimal risk level for zinc. No oral MRLs or TDI have been found for
manganese, but using the lowest observable adverse effect level (LOAEL, Greger, 1998)
of 60 µg Mn/kg/day, it is apparent that the mean CDI of 64.8 µg Mn /kg/day is likely to
result in some adverse health effects. The TDI for Ni of 12 µg /kg /day (EA, 2005) is far
greater than the mean CDI obtained in this study.
The results (Table 11) show that at all the sample sites, the tolerable daily intake of Pb is
far exceeded. This may explain the excessively high blood lead levels reported by the
Blacksmith Institute (Chapter 1, Fig.1) in children of the affected villages leading to high
levels of childhood mortalities. This is brought about by a combination of high total lead
concentration in the soils and sediments of the area and the abundance of highly soluble
secondary lead carbonate and lead oxide minerals within the ores (Plumlee and Morman,
2011) resulting in high extractability of lead observed in both the PBET and SEPs studies
carried out in this work. Similarly, all the samples have CDI values above MRL for
arsenic, although the magnitude is not as high as in the case of lead except in three samples
(B2, B3 & B4), which have consistently shown high loadings for arsenic. For copper, 64%
of the samples have exceeded the set limits, with some of them showing very high
loadings. The pattern for chromium is similar to that of arsenic in terms of magnitude,
133
although only 56% of the samples have CDI values in excess of the published MRLs.
Fewer samples representing 44% of total exceeded the LOAEL for manganese, while all of
the samples have values below the MRL for zinc and TDI for nickel, indicating that no
chronic health effects may result from the two elements as a result of hand-to-mouth
transmission of the soils.
These estimates have been based on an assumption that the only way of transmission is
through the ingestion of fine particles which stick to the hands of children. But the daily
ingestion of soil in these villages may be higher than the conservative figure of 200 mg per
day used in this estimate, due to the possibility of other routes of exposure, such as eating
poorly washed vegetables and the deliberate consumption of soil, called geophagy. Where
poor people live in contaminated areas such as this study site, sub-nutrition and direct
contact with wastes and soils are common (Bosso and Enzweiler, 2008). This may result in
the ingestion of up to 10 g of soil in a single day (US EPA, 2002) leading to much higher
contaminant uptake. If the latter scenario is taken into account, the health risks posed by
the ingestion of these soils will be much higher than this data indicates, considering
especially the very high levels of bioaccessible lead, copper and arsenic.
5.5 Chapter summary
A total of 25 samples of soils and sediments contaminated by artisanal mining and
processing of Pb-Cu rich gold ores in the Anka area of north-western Nigeria were
subjected to in vitro bioaccessibility tests. The results show very high bioaccessible
concentrations and therefore in vitro bioaccessibility (IVBA) for Pb and Cu, and to a lesser
extent, As and Mn. The high levels of bioaccessibility for Pb and Cu are influenced in part
by high concentrations of the elements in the soils and sediments of the area, and by the
presence in the contaminating ores, of highly soluble secondary oxide and carbonate
minerals. Multivariate statistical analysis shows generally strong positive correlation
between total and bioaccessible concentrations of most of the elements tested, except for
134
Mn which showed weak correlation and Cr, for which no correlation was observed. The
very poor correlation between total and bioaccessible concentration of Cr is a reflection of
the low solubility of the element, probably occasioned by its presence in the structures of
less labile minerals such as silicates that are unrelated to the contaminating Pb-Cu-Au ores.
Furthermore, the bioaccessible concentration is found to correlate strongly with the
concentrations of these elements in either of the carbonate or Fe-Mn oxide fractions and
the sums of the three fractions determined; correlation with the exchangeable fraction is
generally weak.
An investigation into the effects of three physicochemical factors on in vitro
bioaccessibility shows that the effect of varying pH changes from one element to another.
The solubility of Cr, Pb and Cu are enhanced by lowering the pH, not so for As, Mn, Ni
and Zn. In fact, the bioaccessible concentration of As increased significantly with a rise in
pH. On the other hand, the length of extraction time was found to significantly influence
the dissolution of Cr, its bioaccessible concentration increasing with increase in the length
of time of contact between the sample and the simulated gastric fluid. However, the results
do not show the same behaviour for the other elements, only Cu and Mn show marginal
increase in bioaccessible concentration with time. Similarly, the results show that only the
concentration of As is influenced by the variation in the ratio of sample mass to extraction
fluid volume, it being highest at 0.5g sample: 50 mL of extraction solution. All other
elements showed no significant difference in concentration due to the variation in this
parameter. This has implication for the choice of optimum sample to fluid to fluid
combination, especially in situations involving low sample supply.
Estimates of the chemical daily intake (CDI), which is the quantity of bioaccessible
potentially toxic elements (PTEs) a child in the study area is likely to be exposed to daily
through the agency of hand-to-mouth ingestion of contaminated soils indicate that for most
135
of the elements, the tolerable limits have been exceeded. The situation is, however, very
serious with respect to Pb and Cu, and to a lesser extent, As and Mn because the estimated
CDI values show that even the ingestion of much smaller amounts of the contaminated
soils can result in the delivery of dangerously high doses of bioaccessible PTEs. This is
especially true for Pb, but also Cu with mean CDI values of 7086 µg /kg /day and 117.2 µg
/kg /day against the tolerable daily intake and minimal risk level of ~3.6 µg /kg /day and 10
µg /kg /day respectively.
These results have highlighted the problems associated with the contamination of soils in
residential areas and farm lands in artisanal mining communities in north-western Nigeria.
Considering that the CDI estimates have been based on hand-to-mouth ingestion scenario
alone, while neglecting other routes of exposure especially in these socio-economically
deprived areas such as the consumption of improperly washed vegetables, deliberate
consumption of soil, inhalation of dusts both indoor and outdoor, and drinking
contaminated surface water, the bioaccessible amounts of these elements, especially Pb
and Cu ingested by children and even adults in these communities may have been
underestimated.
136
Chapter Six
Conclusions and further studies
6.1 Summary and Conclusions
The work in this thesis has focused on the environmental geochemistry of surface soils and
stream sediments in the Anka and Birnin-Gwari areas of north-western Nigeria. The
operation included determination of bulk geochemistry, geochemical partitioning and in
vitro human oral bioaccessibility estimates of some potentially toxic elements. The
following conclusions can be drawn from the experimental results:
Intense tropical weathering, aided by the physical removal of fine clay particles by
wet season overland runoff and dry season winds, and the leaching of bases, has led
to enrichment in silica and marked depletion in Mg, Ca, Na and K. This has
similarly led to very high soil and sediment Zr concentrations due to surficial
processes which preferentially accumulate detrital zircon and other heavy mineral
grains.
Artisanal gold mining and processing has led to extensive Pb and Cu contamination
of surface soils and stream sediments in and around a large number of communities
in the Anka area, but this has not been found for the Birnin-Gwari area.
In both study areas, a weak association exists between PTEs and the exchangeable
fraction in soils and sediments due mainly, to the paucity of fine clay particles and
depletion in exchangeable base cations.
Most of the elements, especially Pb and Zn in the Anka area and As in the Birnin-
Gwari area partition strongly into the carbonate geochemical phase, indicating a
high potential for mobilization of contaminants under slightly acidic environmental
conditions.
137
Reducing environmental conditions may lead to the release of high concentrations
of contaminant elements found to be associated with the Fe/Mn Oxides in these
study areas.
In vitro bioaccessibility experiments show very high bioaccessibility for Pb and Cu,
and to a lesser extent As and Mn, in soils and sediments from the Anka area.
Change in pH has different effects on the in vitro bioaccessibility of different
elements. The bioaccessibility of Cr, Pb and Cu is higher at low pH, whereas that of
As is enhanced by the rise in pH value. There is no evidence to show that the
bioaccessibility of Mn, Ni and Zn have been affected by the range of pH used in
this work.
The length of contact time between the solid sample and the simulated gastric fluid
does not appear to have a significant effect on the extraction of Pb, Cu, As, Mn, Ni
and Zn, but it does clearly influence the amount of Cr extracted into the solution.
The ratio of solid sample mass to extraction fluid volume is not an important
constraint on the bioaccessibility of Pb, Cu, Ni, Mn, Zn and Cr, but it significantly
affects the release of As into the gastric fluids. A ratio of 0.5 g sample to 50 mL
extraction solution was found to give the highest bioaccessible concentration of As.
In the contaminated villages of the Anka area, hand-to-mouth ingestion of soils by
children delivers dangerously high doses of bioaccessible PTEs, especially Pb and
Cu into the gastric fluids. The chemical daily intake estimates show that the
tolerable daily limits have been exceeded for most of the elements.
138
The prevalence of artisanal mining of gold and associated base metals in these study areas
has adverse environmental and human health consequences. Compared with the crustal
averages and soil guideline values, the soils and sediments in the mining communities of
the Anka area have suffered extensive contamination with potentially toxic elements,
especially Pb and Cu. The very high concentration of Pb and Cu in soils within living
compounds and surrounding farmlands in communities such as Abare and Bagega is a
serious threat to the health and wellbeing of the population, particularly children. Grinding
of ores using machines hitherto employed for food processing, the resultant dust generation
and the indiscriminate disposal of the mineralized waste rock powders within compounds
and along stream channels are all important pathways for human exposure to contaminant
elements. In these semi-arid tropical environments, dust re-suspension by dry season winds
ensures constant availability of inhalable contaminants, while transport of the soils and
sediments by wet season floods, following storm events disperses contaminated materials
to areas far away from their sources.
The results of this study show however, that the effects of artisanal mining are not the
same everywhere. While the activity has resulted in severe contamination of soils and
stream sediments in the Anka area, with adverse health consequences, the main problem in
the Birnin-Gwari region is the creation of badlands. The chains of relatively deep mine
pits, often filled with water during the wet season, are not only unsightly, but render the
land virtually useless and even dangerous to humans and livestock. This therefore
underscores the importance of site specific assessment of the environmental effects of
artisanal mining in Nigeria and elsewhere in the world.
One reason why remediation attempts may not completely clean up the contaminated
villages is the practice of using the mineralized powders for the construction of dwellings.
Where such mud houses and perimeter walls are built, they can constitute a long term local
source of contaminants due to the erosion of particles from exposed walls. As well as
139
stopping this, the local population, especially those involved in artisanal mining could help
to reduce contamination of their villages by processing the ore at the mine sites. The
mineralized waste rock powders could then be disposed of in the mine pits, where eventual
natural re-vegetation may in the long term, help to reduce the mobility of contaminant
elements. A possible incentive to processing the ore at the mine sites will be provision of
water, which at the moment is only available through water wells in the villages and
ephemeral streams.
In spite of the high concentrations of some of the elements, such as Pb, Zn and As obtained
in the carbonate and Fe-Mn oxides fractions, less than 50 % of the total concentrations of
all the elements were extracted across the three sequential extraction steps. The bulk of the
elements in the soils and sediments of the two study areas is therefore held within less
labile organic matter/ sulfide fraction and in the structures of residual silicates and other
resistates. This is a confirmation that not all elements present in geological materials are
readily mobilizable and biogeoaccessible. The results show that despite apparent
weaknesses, sequential extraction procedures are useful in assessing the environmental and
human health risks associated with PTEs in soils and sediments. However, because of the
very high concentration of Pb and Cu in most of the samples from the Anka area, a real
risk exists even at these levels of bioaccessibility. For example, up to 40,000 µg/g Pb has
been obtained as the sum of the three SEP steps. In interpreting the results therefore, it is
important to consider the percentage recoveries along with elemental concentration in
individual samples. The results show that given a reducing, slightly acidic environmental
condition, dangerously high doses of Pb and Cu can be mobilized from Fe/Mn oxides and
carbonate phases and become readily available for uptake by plants, animals and
eventually humans.
In vitro bioaccessibility measurement based on hand-to-mouth ingestion of soils in the
contaminated Anka villages has also given high concentrations of PTEs, especially, Pb and
140
Cu. In most of the samples, the concentrations have been higher than the sums of the three
SEP steps, but there is a generally strong relationship between the two datasets. The higher
concentration obtained in vitro is a function of the lower pH of the simulated gastric fluids,
and in nature, bioaccessibility may even be enhanced by the near anoxic condition of the
human stomach. In spite of the more aggressive nature of the in vitro extraction test, the
results compare favourably with those from the SEPs and both datasets indicate similar
levels of environmental and human health risks posed by exposure to soils and sediments
contaminated by artisanal mining. Compared with the SEPs, the in vitro bioaccessibility
extraction test is faster, less operationally demanding and probably even more easily
reproducible. This may make it a preferred method where quick screening is needed to
guide risk assessment and remediation planning. But to gain a broader understanding of the
problem, it needs to be used along with other techniques (such as SEPs) that are capable of
providing an insight into the different geochemical phases that exist in the contaminated
media. The strong correlation between the sums of the SEP steps, which is mainly
contributed by the concentration of PTEs in the carbonate and Fe/Mn oxide fractions and
the in vitro bioaccessible fraction, underscores the importance of mineralogy in
determining the bioaccessibility of contaminant elements. This is further buttressed by the
fact that the correlation between bioaccessible concentration and the sum of SEPs is
generally stronger than that between the former and the total element concentration in the
samples. This is consistent with the results of previous workers, who found for example,
that Pb is more readily released from cerrusite (PbCO3) compared to galena (PbS).
The chemical daily intake (CDI), computed for children in the Anka area based on hand-
to-mouth ingestion of contaminated soil shows that the tolerable daily limits for Pb, Cu,
Mn, As and Cr have been exceeded. The mean CDI for Pb was found to be nearly 2000
times the tolerable daily intake for a 2-6 year child weighing 17.8 kg; the minimum value
being about 31 times the limit. These results, along with those for Cu and to a lesser extent,
141
Mn, As and Cr, further highlight the severity of the contamination of soils in the affected
villages. Hand-to-mouth ingestion is the only exposure scenario investigated in this study.
However, given the poor socioeconomic status of the residents of this study area, children
and even adults can be exposed to lethal doses of PTEs through consumption of improperly
washed vegetables, inhalation of indoor and outdoor dusts and drinking contaminated
surface water. Similarly, factors such as low body weights due to sub-nutrition together
with poor sanitation, which may increase the exposure frequency, are likely to increase the
risks. While high blood lead levels have been reported in children in these villages by a
combined team from the UNEP/OCHA, Blacksmiths Institute and other organizations, it
will be interesting to study adult subjects, especially those actively involved with ore
processing in order to assess possible chronic Pb and other PTE toxicity.
The results of this work underscore the need to study more closely, the effects of artisanal
mining and processing of ores on the quality of the environment and the attendant human
health consequences. Determining the spatial distribution of mining related potentially
toxic elements relative to baseline concentrations, together with an assessment of their
geochemical partitioning and in vitro bioaccessibility would be useful for artisanal mining
areas in Nigeria and other parts of the developing world. The knowledge gained can guide
remediation efforts and help to mitigate the harm to resident populations of contaminated
areas.
6.2 Further studies
This work has investigated the geochemistry of soils and stream sediments in the artisanal
gold mining areas of Anka and Birnin-Gwari in north-western Nigeria. However, further
studies are required in order to increase our understanding of the environmental and human
health risks brought about by the artisanal mining activities, especially in the Anka area. It
is recommended that future investigations may include, but are not limited to the
following:
142
1. Further geochemical fractionation and speciation studies should be carried to
identify and estimate the abundances of the different phases or minerals in the
contaminated soils in order to better understand the possible mobilization of
contaminants in the area.
2. Future in vitro tests should be extended to include intestinal and lung phases. This
will shed more light on the bioaccessibility of the contaminants.
3. Field and laboratory based experiments to investigate the immobilization of
potentially toxic elements (PTEs) in soils of the Anka area using locally available
materials such as phosphate nodules from the neighbouring Sokoto Basin, bone
phosphate and eggshells. In these soils, treatment with phosphate may help in the
immobilization of Pb which has been found to be the major contaminant, through
the formation of pyromorphite [Pb5 (PO4)3Cl].
4. Field sampling and laboratory based experiments to shed light on the uptake of
potentially toxic elements (PTEs) by crops and livestock and their possible
transmission through the food chain.
5. Continued, long term monitoring of the distribution of PTEs in surface soils and
stream sediments in the contaminated villages of the Anka area, with a view to
understanding their dispersal or attenuation, especially in areas where remediation
has been attempted.
6. Finally, to expand the study to other areas in Nigeria where artisanal mining
activities are prevalent in order to establish a database of the possible harmful
effects of the unregulated small-scale exploitation of mineral resources by artisans.
143
References
Abrahim, G.M.S., Parker, R.J. 2008. Assessment of heavy metal enrichment factors and
the degree of contamination in marine sediments from Tamaki Estuary,
Auckland, New Zealand. Environ Monit Assess 136, 227-238.
Adamo, P., Di, S., Wison, M.J., Mchardy, W.J. 1996. Chemical and mineralogical forms
of Cu and Ni in contaminated soils from the Sudbury mining and smelting region,
Canada. Environ Poll. 91, 11-19.
Adriano, C. D. 1986. Heavy metals in terrestrial environment. Springer, Berlin.
Alloway, B.J. 1995. Heavy metals in soils. Chapman and Hall publishers, London.
Albright, E.I. 2004. Background concentrations of trace elements in soils and rocks of
the Georgia Piedmont. M.Sc thesis, The University of Georgia.
Andrews, J.E., Brimblecombe, P., Jickells, T.D., Liss, P.S., Reid, B. 2004. An
introduction to environmental chemistry. 2nd
edition, Blackwell Publishing,
Oxford.
Anju, M., Banerjee, D.K. 2010. Comparison of two sequential extraction procedures for
heavy metal partitioning in mine tailings. Chemosphere 78, 1393-1402.
Appleton, J.D., Williams, T.M., Orbea, H., Carrasco, M. 2001. Fluvial contamination
associated with artisanal gold mining in the Ponce Enriquez, Portovelo-Zaruma
and Nambija areas, Ecuador. Water Air Soil Poll 131, 19-39.
ATSDR.2008. Minimal risk levels. [Online] www.atsdr.cdc.gov/mrls/. [30/06/2011]
Babut, M., Sekyi, R., Rambaud, A., Potin-Gautier, M., Tellier, S., Bannerman, W et al.
2003. Improving the environmental management of small-scale gold mining in
Ghana: a case study of Dumasi. Journ. Cleaner Prod 11, 215-221.
Bafor, B.E. 1981. The occurrence of sulphide mineralization in the Egba area of south-
western Nigeria. Nigeria J. Mining Geol 18, 175-179.
BARGE (The Bioaccessibility Research Group of Europe) 2008. [online]
www.bgs.ac.uk/barge
Berman, E. 1980. Toxic metals and their analysis. Heyden and sons, London.
Bird, G., Boewer, P. A., Macklin, M. G., Baltenan, P., Driga, B., Serban, M et al.
2003.The solid state partitioning of contaminant metals and As in river channel
sediments of the mining affected drainage basin, north-western Romania and
eastern Hungary. Appl Geochem 18, 1583–1595.
Blackburn, W.H., Schwendeman, J.F. 1977. Trace element substitution in galena.
Canadian Mineralogist 15, 365-373.
Blacksmith Institute. 2011. Lead poisoning crisis in Nigeria, Project Completion
Report.[online]http://www.blacksmithinstitute.org/files/FileUpload/files/Additio
nal%20Reports/Zamfara_Nigeria_PCR%20April%202011.pdf. [27/02/2012]
144
Bosso, S.T., Enzweiler, J. 2008. Bioaccessible lead in soils, slag and mine wastes from
an abandoned mining district in Brazil. Environ Geochem Health 30, 219-229.
Brannan, N. 2008. Mining leaves nasty legacy in Zambia. Geotimes 1-2008. [online]
www.geotimes.org/jan08/article.html?id=nn_zambia.htm1#top. [15/03/2012]
Breshears, D.D., Whickr, J.J., Johansen, M.P., Pinder, J.E. 2003. Wind and water erosion
and transport in semi-arid shrubland, grassland and forest ecosystems:
quantifying dominance of horizontal wind-driven transport. Earth Surf. Process.
Landforms 28, 1189-1209.
Brown, G., Brindley, G. W. 1980. X-ray diffraction procedures for clay mineral
identification. In G. W. Brindley and G. Brown, Eds., Crystal Structures of Clay
Minerals and their X-ray identification, 305-359. Mineralogical Society, London.
Bruker Advanced X-rays Solutions. 2004. Introduction to x-ray fluorescence analysis
(XRF). User’s manual.
Button, M., Watts, M. J., Cave, M. R., Harrington, C. F., Jenkin, G. T. 2009. Earthworms
and in vitro physiologically-based extraction tests: complementary tools for a
holistic approach towards understanding risk at arsenic-contaminated sites.
Environ Geochem Health 31, 273-282.
Burt, R., Wilson, M.A., Keck, T.J., Dougherty, B.D., Strom, D.E., Lindahl, .J.A. 2003.
Trace element speciation in selected smelter-contaminated soils in Anaconda
and Deer Lodge Valley, Montana, USA. Adv. Environ Res. 8, 51-67.
Cave, M., Wragg, J., Klinck, B., Gron, C., Oomen, A., van de Wiele, T. et al. 2006.
Preliminary assessment of a unified bioaccessibility method for potentially
harmful elements in soils. Epidem. 17, 39.
Callender, E. 2004. Heavy metals in the environment- historical trends. In H.D. Holland
and K.K. Turekian, Eds., Treatise on Geochemistry 9, 67-105.
Carvalho, P.C.S., Neiva, A.M.R., Silva, M.M.V.G. 2009. Geochemistry of soils, stream
sediments and waters close to abandoned W-Au-Sb mines at Sarzedas, Castelo
Branco, central Portugal. Geochem: Explor Environ Anal 9, 341-352.
Chandrajith, R., Kudavidanage, E., Tobschall, H.J., Dissanayake, C.B. 2009.
Geochemical and mineralogical characteristics of elephant geophagic soils in
Udawalawe National Park, Sri Lanka. Environ Geochem Health 31,391–400
Ciccu, R., Ghiani, M., Serci, A., Fadda, S., Peretti, R., Zucca, A. 2003. Heavy Metal
Immobilization in the Mining Contaminated Soils using various industrial wastes.
Mineral Eng’g 16, 187-192.
Danbatta, U.A., Abubakar, Y.I., Ibrahim, A.A. 2009. Geochemistry of gold deposits in the
Anka Schist Belt, northwestern Nigeria. Nigerian Journ Chem Res 14, 19-29.
DEFRA and EA.2002. Contaminants in soils: Collation of toxicological data and intake
values for humans. R&D Publications Tox 4 Chromium; Tox 6 Lead.
Drexler, J.W., Brattin, W.J. 2007. An In Vitro procedure for estimation of lead relative
bioavalability: with validation. Human. Ecol. Risk Assess. 13, 383-401.
145
Dolenec, T., Serafimovski, T., Tasev, G., Dobnikar, M., Dolenec, M., Rogan, N. 2007.
Major and trace element in paddy soil contaminated by Pb-Zn mining: a case of
Kocani Field, Macedonia. Environ Geochem Health 29, 21–32.
Dudka, S., Adriano, D.C. 1997. Environmental impacts of metal mining and processing:
A review. Journ. Environ. Qual. 26(3), 590-602.
EA.2009. Contaminants in soil: updated collation of toxicological data and intake values
for humans: nickel. Environment Agency Better science programme, Science
report SC0550021/Tox8.
Elueze, A.A. 1981a. Petrographic study of metabasites and meta-ultramafites in relation
to mineralization in Nigerian Schist Belts. Nigeria J. Mining Geol 18, 31-36.
European Virtual Institute for Speciation Analysis. 2010. Instrument Database: Vista-
PRO Simultaneous ICP-OES. [Online]
http://www.speciation.net/Database/Instruments/Varian-Inc/VistaPRO-
Simultaneous-ICPOES-;i245[09/01/2012]
Federal Surveys of Nigeria. 1967. Quarter degree topographic maps of Kwaimbana SE
(sheet 100SE) and Kushaka NE (sheet 122NE).
Field, A.2009. Discovering statistics using SPSS, 3rd
edition, SAGE London.
Fitches, W.R., Ajibade, A.C., Egbuniwe, I.G., Holt, R.W., Wright, J.B. 1985. Late
Proterozoic schist belts and plutonism in NW Nigeria. J. Geol Soc. London 142,
319-337.
Foord, E.E., Shawe, D.R., Conklin, N.M. 1988. Coexisting galena, PbSss and sulfosalts:
Evidence for multiple episodes of mineralization in the Round Mountain and
Manhattan gold district, Nevada. Canadian Mineralogist 26, 355-376.
Forstner, U., Whitmann, G.T.W. 1983. Metal pollution in the aquatic environment.
Springer-Verlag, Berlin.
Garba, I. 2000. Gold prospects of the Nigerian Pan-African terrain of West Africa. J.
Min. Geol. 36(2), 123-136.
Garba, I. 2002. Geochemical Characteristics of the Gold Mineralization near Tsohon
Birnin-Gwari, north-western Nigeria. Chem. Erde 62, 160–170.
Garba, I. 2003. Geochemical characteristics of mesothermal gold mineralization in
the Pan-African (600±150Ma) basement of Nigeria. Trans. Inst. Min. Metall.
112, 319-325.
Gong, M., Wu, L., Bi, X., Ren, L., Wang, L., Ma, Z. et al. 2010. Assessing heavy-metal
contamination and sources by GIS-based approach and multivariate analysis of
urban-rural top soils in Wuhan, central China. Environ Geochem Health 32, 59–
72.
Greger, J.L. 1998. Dietary standards for manganese: overlap between nutritional and
toxicological studies. Journ. Nutrition, 128, 368S-371S.
146
Hemond, H.F., Solo-Gabriele, H.M. 2004. Children’s exposure to arsenic from CCA-
treated wooden decks and playground structures. Risk Anal. 24, 51-64.
Henderson, P.J., McMartis, L., Hall, G.E., Percival, J.B., Walker, D.A. 1998. The chemical
and physical characteristics of heavy metals in humus and till in the vicinity
of the base metal smelter at Flin Flon, Manitoba, Canada. Environ. Geology 34, 39-
58.
Hickey, M.G., Kittrick, J.A. 1984. Chemical partitioning of cadmium, copper, nickel and
zinc in soils and sediments containing high levels of heavy metals. Journ. Environ.
Qual. 13, 372-376.
Hilson, G. 2002. The environmental impact of small-scale mining in Ghana: identifying
problems and possible solutions. The Geogr. Jour. 168 (1), 57-72.
Hinton, J.H., Veiga, M.M., Tadeu, A., Veiga, C. 2003. Clean artisanal gold mining: a
utopian approach? Jour. Cleaner Prod. 11, 99-115.
Holt, R., Egbuniwe, I.G., Fitches, W.R., Wright, J.B. 1978. The relationship between
low-grade meta-sedimentary belts, calc-alkaline volcanism and the Pan-African
orogeny in NW Nigeria. Geol Rundsch 67, 631-646.
Hou, X., Parent, M., Savard, M.M., Tasse, N., Begin, C., Marion, J. 2006. Lead
concentrations and isotope ratios in exchangeable fraction: tracing soil
contamination near a copper smelter. Geochem: Explor. Environ. Anal. 6, 229-
236.
Hudson-Edwards, K.A. 2000. Heavy metal-bearing Mn oxides in river channel and
floodplain sediments. In (J.D. Cotter-Howells, L.S. Campbell, E. Valsami-Jones
and M. Batchelder, Eds Environmental Mineralogy: Microbial Interactions,
Anthropogenic Influences, Contaminated Land and Waste Management.
Mineralogical Society 9, 207-226.
Hudson-Edwards, K.A., Jamieson, H.E., Lottermoser, B.G. 2011. Mine wastes: past,
present, future. Elements 7 (6), 35-380.
Inam, E., Khantotong, S., Kim, K., Tumendemberel, B., Erdenetsetseg, S., Puntsag, T.
2011. Geochemical distribution of trace element concentrations in the vicinity of
Boroo gold mine, Selenge Province, Mongolia. Environ Geochem Health 33,
57-69.
Jaggard, H.N. 2012. Mineralogical characterization of tailings and respirable dust from
lead-rich mine waste and its control on bioaccessibility. MSc thesis, Queen’s
University, Ontario.
Jung, M.C. 2001. Heavy metal contamination of soils and waters in and around the
Imcheon Au-Ag mine, Korea. Appl Geochem 16, 1369-1375.
Kelly, M. 1988. Mining and the fresh water environment. Elsevier Science Publishers,
London. p.231.
147
Kelly, K.D., Hudson, T. 2007. Natural versus anthropogenic dispersion of metals to the
environment in the Wulik River area, western Brooks Range, northern Alaska.
Geochem: Explor. Environ. Anal. 7, 87-96.
Kersten, M. 2002. Speciation of trace metals in sediments. In A.M. Ure and C.M.
Davidson, Eds Chemical Speciation in the Environment, 2nd
edition. Blackie
Academic and Professional, London, 301-319.
Key, R.M., Johnson, C.C., Horstwood, M.S.A., Lapworth, D.J., Knights, K.V., Kemp,
S.J. et al. 2012. Investigating high zircon concentrations in the fine fraction of
stream sediments draining the Pan-African Dahomeyan Terrane in Nigeria.
Appl Geochem 27(8), 1525-1539.
Kirchner, J.W. 1992. Heterogeneous geochemistry of catchment acidification. Geochim
Cosmochim Acta 56, 2311-2327.
Kirchner, J.W. 1995. Base cation depletion and potential long-term acidification of
Norwegian catchments. Environ Science Tech 29 (8), 1953-1960.
Krauskopf, K.B. 1957. Separation of manganese from iron in sedimentary processes.
Geochim. Cosmochim. Acta, 12, 61-84.
Krauskopf, K.B., Bird, D.K. 2003. Introduction to Geochemistry, 3rd
edition. McGraw-
Hill Companies, Inc., New York, p. 647.
Kuo, S., Heilman, P.E., Baker, A.S. 1983. Distribution and forms of copper, zinc, iron
and manganese in soils near a copper smelter. Soil Science 135, 101-109.
Kushner, E.J. 1976. On determining the statistical parameters for pollution
concentration from a truncated data set. Atmosph. Environ. 10, 975-979.
Lapworth, D.J., Knights, K.V., Key, R.M., Johnson, C.C., Ayoade, E., Adekanmi, M.A.
et al. 2012. Geochemical mapping using stream sediments in west-central Nigeria:
Implications for environmental studies and mineral exploration in West Africa.
Appl. Geochem. 27, 1035-1052.
Li, X., Thornton, I. 2001. Chemical partitioning of trace and major elements in soils
contaminated by mining and smelting activities. Appl. Geochem. 16, 1693-1706.
Li, X., Poon, C., Liu, P.S. 2001. Heavy metal contamination of urban soils and street
dusts in Hong Kong. Appl. Geochem. 16, 1361-1368.
Lottermoser, B. G., Ashley, P. M. 2005. Tailings dam seepage at the rehabilitated Mary
Kathleen uranium mine, Australia J. Geochem Explor 85, 119-137.
Lottermoser, B. G., Ashley, P. M., Costelloe, M. T. 2005. Contaminant dispersion at the
rehabilitated Mary Kathleen uranium mine, Australia. Environ. Geol. 48,748–
761.
Lottermoser, B.G. 2007. Mining environments: the good, the bad and the ugly. Paper
presented at the Mining and Environment IV Conference, Sudbury, Ontario,
Canada, October, 2007.
148
Lottermoser, B.G. 2010. Mine wastes: characterization, treatment and environmental
impacts. Springer-Verlag, Berlin.
Lu, Y., Yin, W., Huang, L., Zhang, G., Zhao, Y. 2011. Assessment of bioaccessibility and
exposure risk of arsenic and lead in urban soils of Guanhzhou City, China.
Environ Geochem Health 33, 93-102.
Martley, E., Gulson, B., Louie, H., Wu, M., Di, P. 2004. Metal partitioning in soil profiles
in the vicinity of an industrial complex, New South Wales, Australia.
Geochem: Explor. Environ. Anal. 4, 171-179.
Maskall, J.E., Thornton, I. 1998. Chemical partitioning of heavy metals in soils, clays
and rocks at historical lead smelting sites. Water Air Soil Pollution 108, 391-
409.
Mather, A. 2007. Arid Environments. In C. Perry and K. Taylor, Eds Environmental
sedimentology. Blackwell Publishing Ltd., Oxford, 144-189.
McCurry, P., Wright, J.B. 1977. Geochemistry of calcalkaline volcanics in north- western
Nigeria and a possible Pan-African suture zone. Earth Planetary Science Letters
37, 90-96.
McKenzie, R.M. 1980. The adsorption of lead and other heavy metals on oxides of
manganese and iron. Aust. J. Soil Res. 18, 61-73.
Medlin, E.A. 1997. An in vitro method for estimating the relative bioavailability of lead
in humans. Masters Thesis. University of Colarado, Boulder.
Morillo, J., Usero, J., Gracia, I. 2002. Partitioning of metals in sediments from the Odiel
River, Spain. Environ International 28, 263-271.
Morman, S.A., Plumlee, G.S., Smith, D.B. 2009. Application of in vitro extraction studies to
evaluate element bioaccessibility in soils from a transect across the United States
and Canada. Appl. Geochem. 24, 1454–1463.
Muller, G. 1969. Index of geoaccumulation in sediments of the Rhine River. Geojournal
2, 108-118.
Murray, J.W. 1975. The interaction of metal ions at the manganese dioxide-solution
interface. Geochim. Cosmochim. Acta 39, 505-519.
Navas, A., Lindhorfer, H. 2003. Geochemical speciation of heavy metals in semiarid
soils of the central Ebro Valley, Spain. Environ International 29 (1), 61-68.
Nehls, G.J., Akland, G.G. 1973. Procedures for handling aerometric data. J. Air Pollut.
Control Ass. 23, 180-184.
Nesbitt, H.W., Young, G.M. 1982. Early Proterozoic climates and plate motions inferred
from major element chemistry of lutites. Nature 299, 715-717.
Nirel, P.M.V., Morel, F.M.M. 1990. Pitfalls of sequential extractions. Water Res. 24,
1055-1056.
149
Ogezie, A.E.O. 1977. Geochemistry and geochronology of basement rocks from north
western Nigeria. PhD Thesis, University of Leeds.
Olade, M.A. 1987. Dispersion of Cadmium, Lead and Zinc in Soils and Sediments of a
Humid Tropical Ecosystem in Nigeria. In T.C. Hutchinson and K.M. Meema,
Eds Lead, Mercury, Cadmium and Arsenic in the Environment. 303-313.
O’Reilly, S.E., Hochella, M.F. 2003. Lead sorption efficiencies of natural and synthetic
Mn and Fe-oxides. Geochim Cosmochim Acta 67(23), 4471-4487.
Plumlee, G. S. 1999. The environmental geology of mineral deposits, in Plumlee, G. S.,
and Logsdon, M. J., eds., The Environmental Geochemistry of Mineral Deposits
Part A: Processes, Techniques and Health Issues, Reviews in Econ. Geology,
vol. 6B: Littleton, CO, Soc. Econ. Geologists, p. 71-116
Plumlee, G.S., Morman, S.A. 2011. Mine wastes and human health. Elements 7 (6),
399-404.
Plumlee, G.S., Ziegler, T.L. 2004. The Medical Geochemistry of Dusts, Soils and Other
Earth Materials. In B.S. Holland and K.K. Turekian, Eds., Treatise on
Geochemistry 9, 263-310.
Potts, J.P., Webb, P.C. 1992. X-ray fluorescence spectrometry. J.Geochem. Explor. 44,
251-296.
Price, J.R., Velbel, M.A. 2003. Chemical weathering indices applied to weathering
profiles developed on heterogeneous felsic metamorphic rocks. Chem Geol 202,
397-416.
Pueyo, M., Lopez-Sanchez, J.F., Rauret, G. 2004. Assessment of CaCl2, NaNO3 and
NH4NO3 extraction procedures for the study of Cd, Cu, Pb and Zn extractability
in contaminated soils. Anal Chemica Acta 504, 217-226.
Pullan, R.A. 1970. The soils, soil landscapes and geomorphological evolution of a
metasedimentary area in northern Nigeria. Research Paper No 6, Department of
Geography, University of Liverpool, UK, p.144.
Radojevic, M., Bashkin, V.N. 1999. Practical environmental analysis. Royal Soc. Chem.,
Cambridge.
Rahaman, M.A., Ocan, O. 1978. On relationships in the Pre-Cambrian migmatic gneisses
of Nigeria. Nigeria J. Min. Geol. 15, 23-32.
Razo, I., Carrizales, L., Castro, J., Diaz-Barriga, F., Monroy, M. 2004. Arsenic and
heavy metal pollution of soil, water and sediments in a semi-arid mining area in
Mexico. Water Air Soil Poll. 152, 129-152.
Reddy, K. 2002. Engineering properties of soils based on laboratory testing. [Online]
www.uic.edu/classes/cemm [23/11/09]
Royal Commission on Environmental Pollution. 1996. Sustainable use of Soil.
Nineteenth Report. HMSO London.
150
Romaguera, F., Boluda, R., Fornes, F., Abad, M. 2008. Comparison of three sequential
extraction procedures for trace partitioning in three contaminated Mediterranean
soils. Environ Geochem Health 30, 171-175.
Ruby, M.V., Schoof, R., Brattin, W., Goldade, M., Post, G., Harnois, M et al. 1999.
Advances in evaluating the oral bioavailability of inorganics in soil for use
in human health risk assessment. Environ. Sci. Technol. 33, 3697- 3705.
Russ, W. 1957. The geology of parts of Niger, Zaria and Sokoto Provinces. Geological
Survey of Nigeria Bulletin no. 27, pp. 35.
Sako, A., Mills, A.J., Roychoudhry, A.N. 2009. Rare earth and trace element
geochemistry of termite mounds in central and northeastern Namibia:
Mechanisms for micro-nutrient accumulation. Geoderma 153, 217-230.
Salminen, R. 2008. Field methods in regional geochemical surveys. In B. de Vivo,
H.E. Belkin, A. Lima Eds Environmental Geochemistry: Site
Characterization, Data Analysis and Case Histories. Elsevier, Oxford,1-12.
Sharma, K., Rhudy, K.B., Cargill, J.C., Tacker, M.E., Vazquez, F.G. 2000. Metals and
grain size distribution in soils of the middle Rio Grande basin, Texas USA.
Environ. Geol .39, 698-703.
Shikazono, N., Tatewaki, K., Mohiuddin, K.M., Nakano, T., Zakir, H.M. 2012. Sources,
spatial variation and speciation of heavy metals in sediments of the Tamagawa
River in Central Japan. Environ Geochem Health 34, 13-26.
Sialelli, J., Urquhart, G.J., Davidson, C.M., Hursthouse, A.S. 2010. Use of
physiologically based extraction test to estimate human bioaccessibility of
potentially toxic elements in urban soils from the city of Glasgow, UK. Environ
Geochem Health 32, 517-527.
Singh, A.K., Hasnain, S.I., Banerjee, D.K. 1999. Grain size and geochemical
partitioning of heavy metals in sediments of the Damodar River- a tributary of
the lower Ganga, India. Environ Geol 39, 90-98.
Smith, D.B., Woodruff, L.G., O’Leary, R.M., Cannon, W.F., Garrett, R.G., Kilburn, J.E
et al. 2009. Pilot studies for the North American Soil Geochemical Landscape
project- Site selection, sampling protocols, analytical methods, and quality
control protocols. Appl. Geochem. 24,1357- 1368.
Swyngedouw, C., Crepin, J.M. 2008. Sampling Methods for Site Characterization. In B. de
Vivo, H.E. Belkin, A. Lima Eds Environmental Geochemistry: Site
Characterization, Data Analysis and Case Histories. Elsevier, Oxford, 13-26.
Taylor, S.R., McLennan, S.M. 1985. The Continental Crust: its Composition and
Evolution. Blackwell Scientific Publication, Oxford.
Taylor, S.R., McLennan, S.M. 1995. The geochemical evolution of continental crust.
Rev Geophysics 33(2), 241-265.
Tessier, A., Campbell, P.G.C., Bisson, M. 1979. Sequential extraction procedure for the
speciation of particulate trace metals. Anal. Chem. 51, 844-851.
151
Thornton, I. 1996. Impacts of mining on the environment; some local, regional and
global issues. Appl Geochem 11, 355-361.
Tijani, M.N., Okunlola, O.A., Abimbola, A.F. 2006. Lithogenic concentrations of trace
metals in soils and saprolites over crystalline basement rocks: a case study from
SW Nigeria. J. Afr. Earth Sci. 46, 427-438.
Tooth, S. 2000. Process, form and change in dryland rivers: a review of recent research.
Earth Sci. Rev. 51, 67-107.
Turner, A. 2011. Oral bioaccessibility of trace metals in household dust: a review.
Environ Geochem Health 33, 331-341.
Turner, D.C. 1983. Upper Proterozoic schist belts in the Nigerian sector of the Pan-
African province of West Africa. Precambrian Res. 21, 55-79.
Ullrich, S.M., Ramsey, M.H., Helios-Rybicka, E. 1999. Total and exchangeable
concentrations of heavy metals in soils near Bytom, an area of Pb/Zn mining and
smelting in Upper Silesia, Poland. Appl. Geochem. 14, 187-196.
UNEP/OCHA Environment Unit 2010. Lead pollution and poisoning crisis,
Environmental Emergency Response Mission, Zamfara State, Nigeria. [online]
http://ochaonline.un.org/OchalinkClick.aspx?link=ocha&docld=1178375
[28/01/2011]
Ure, A.M., Davidson, C.M. 2002. Chemical speciation in soils and related materials by
selective chemical extraction. In A.M. Ure and C.M. Davidson, Eds Chemical
Speciation in the Environment, 2nd
edition. Blackie Academic and Professional,
London, 265-300.
USDA.2000. Heavy metal soil contamination: Soil quality- urban technical note no.3.
Soil Quality Institute, United States Department of Agriculture.
USEPA.1997. Exposure factors handbook volume 1: General factors; EPA/600/P-
95/002Fa. Washington D.C: Office of Research and Development, US
Government Printing Office.
USEPA. 2000. Assigning values to non-detected/ non-quantified pesticide residue in
human food exposure assessments. Office of Pesticide Programs. [Online]
http://www.epa.gov/oppfead1/trac/science/trac3b012.pdf [15/11/2012].
USEPA.2002. Child-specific exposure factors handbook, EPA/600/P.00/002B.
Washington D.C.: National Centre for Environmental Assessment.
USEPA. 2007a. Guidance for evaluating the oral bioavailability of metals in soils for
use in human risk assessment. OSWER 9285.7-80.
USEPA. 2007b. Estimation of relative bioavailability of lead in soil and soil-like
materials using in vivo and in vitro methods. OSWER 9285.7-77.
USEPA. 2008. Mine Waste Technology Program: Linking Waterfowl with Contaminant
Speciation in Riparian Soils. EPA/600/R-08/060.
152
USEPA. 2008. Standard Operating Procedure for an In Vitro Bioaccessibility Assay for
Lead in Soil. EPA 9200.
Van-Herreweghe, S., Swennen, R., Cappuyns, V., Vandecasteele, C. 2002. Chemical
associations of heavy metals and metalloids in contaminated soils near former
ore treatment plants: a differentiated approach with emphasis on pH stat-
leaching. Journ Geochem Explor. 76, 113-138.
Ward, N.I. 1995. Trace Elements. In: Fifield, F.W and Haines, P.J. (Eds) Environmental
Analytical Chemistry. Blackie Academic and Professional, London.
Washington, N., Washington, C., Wilson, C. 2001. Physiological Pharmaceutics: Barriers
to drug absorption. Taylor and Francis, New York.
Wedepohl, K.H. 1995. The composition of the continental crust. Geochim Cosmochim
Acta 59 (7), 1217-1232.
Whalley, C., Grant, A. 1994. Assessment of the phase selectivity of the European
Community Bureau of Reference (BCR) sequential extraction procedure for
metals in sediment. Anal. Chim. Acta 291, 287-295.
WMC. 2006. Copperbelt Environment Project, Kabwe Scoping and Design Study,
Project Synthesis. Water Management Consultants, Swan Hill, Shrewsbury,
United Kingdom.
Woakes, M., Bafor, B.E. 1983. Primary gold mineralization in Nigeria. In R.P. Foster,
Ed GOLD ’82: The Geology, Geochemistry and Genesis of gold deposits. Geol
Soc Zimbabwe Spec Publication no.1. Balkema, Rotterdam.
Woakes, M., Rahaman, M.A., Ajibade, A.C. 1987. Some metallogenetic features of the
Nigerian basement. Journ. African Earth Sci. 6(5), 655-664.
Wragg, J., Cave, M., Basta, N., Brandon, E., Casteel, S., Denys, S et al. 2011. An inter-
laboratory trial of the unified BARGE bioaccessibility method for arsenic,
cadmium and lead. Science Total Environment 409, 4016-4030.
Wu, Y., Xu, Y., Zhang, J., Hu, S., Liu, K. 2011. Heavy metal pollution and the
identification of their sources in soil over Xiaoqinling gold-mining region,
Shaanxi, China. Environ Earth Sci 64, 1585-1592.
Zibret, G., Sajn, R. 2010. Hunting for geochemical associations of elements: factor
analysis and self-organizing maps. Math Geosci 42, 681-703.
153
Appendix 1a Location and description of samples from the Anka area, northwestern
Nigeria
Sample Latitude Longitude Location Sample description
A1 12.06167 5.97041 Abare Soil, near mine pit
A2 12.06160 5.97010 Abare Soil, generally dark brown
A3 12.06130 5.96940 Abare Soil, generally dark brown
A4 12.07477 5.95755 Abare Soil, brown, close to abandoned milling area
A5 12.07418 5.95628 Abare Soil, in farmland downslope from A4
A6 12.06103 5.97031 Abare Sediment downstream from mine pit
A7 12.06038 5.96915 Abare Sediment downstream from A6
A8 12.06072 5.96690 Abare Sediment downstream of A7
A9 12.06216 5.96707 Abare Soil, reddish brown
A10 12.07894 5.95503 Abare Farmland soil
A11 12.08375 5.95094 Abare Contaminated soil removed to a dump site
B1 11.86370 6.00440 Bagega Soil, light brown
B2 11.86210 6.00490 Bagega Soil, light brown
B3 11.86340 6.00440 Bagega Soil, light brown
B4 11.86206 6.00598 Bagega Stream sediment
B5 11.86253 6.00405 Bagega Farmland soil, light brown
B6 11.86235 6.00216 Bagega Farmland soil, light brown
B7 11.86392 6.00077 Bagega Brown soil, within village
B8 11.86571 6.00410 Bagega Soil, near a house
D1 11.99210 5.95960 Dareta Soil, near mine pit
D2 11.99210 5.95940 Dareta Soil, near mine pit
D3 12.03140 5.95500 Dareta Soil within village
D4 12.03719 5.95566 Dareta Soil close to old milling site
D5 12.03155 5.95496 Dareta Soil around water well in the village
D6 11.99212 5.95991 Dareta Brown soils, near mine pit
D7 11.99204 5.95890 Dareta Sediment, downstream of D6
D8 11.99382 5.95788 Dareta Sediment, downstream of D7
D9 11.99630 5.95763 Dareta Sediment, downstream of D8
D10 12.01258 5.95936 Dareta Background soil, brown, near gully
TD1 11.90410 6.11270 Tungar Daji Soil, near mine pit
TD2 11.90498 6.11247 Tungar Daji Sediment, downstream of mine pit
TD3 11.90390 6.11126 Tungar Daji Sediment, downstream of TD2
TD4 11.90345 6.10934 Tungar Daji Sediment, downstream of TD3
TD5 11.90182 6.10392 Tungar Daji Brown farmland soil
TD6 11.90487 6.09398 Tungar Daji Soil, brown, within a compound
TD7 11.90516 6.09236 Tungar Daji Materials scrapped from walls of a house
TD8 11.90573 6.09332 Tungar Daji Soil, brown in farmland near village
TD9 11.90216 6.09496 Tungar Daji Sediment
TD10 11.90103 6.08111 Tungar Daji Soil from reclamation dumpsite
TS1 11.89413 5.92010 Tsunke Soil from reclamation dumpsite
TS2 11.86685 5.93946 Tsunke Soil, close to mine pit
TS3 11.89445 5.91198 Tsunke Farmland soil
TS4 11.89537 5.91207 Tsunke Soil within a compound
TS5 11.89697 5.91084 Tsunke Soil, close to TS4 site
TS6 11.90530 5.90292 Tsunke Sediment, from background area
154
Appendix 1b Location and description of samples from the Birnin-Gwari area,
northwestern Nigeria
Sample Latitude Longitude Location Sample description
N3 10.9286 6.7919 B-Gwari Stream bank soil, brown
N5 10.9581 6.7914 B-Gwari Stream sediment
N7 10.9933 6.8142 B-Gwari Sediment+mine waste rock
N8 10.9928 6.8131 B-Gwari Sediment, downstream of N7
N9 10.9903 6.8192 B-Gwari Sediment, downstream of N8
N10 10.9950 6.8208 B-Gwari Sediment, downstream of N9
N12 10.9917 6.8258 B-Gwari Soil
N14 11.0253 6.7939 B-Gwari Soil
N15 11.0233 6.7975 B-Gwari Stream bank soils
N15b 11.0233 6.7978 B-Gwari "
N16 11.0183 6.7992 B-Gwari River bank deposits, light brown
N17 11.0131 6.8044 B-Gwari Soil
N20 11.0211 6.8050 B-Gwari Soil
N21 11.0272 6.8031 B-Gwari Stream sediment
N22 11.0236 6.8019 B-Gwari Sediment, upstream of N21
N23 11.0316 6.8106 B-Gwari River bank soils
N24 11.0350 6.7992 B-Gwari Soil, upstream of N23
N25 11.0361 6.8011 B-Gwari Sediment
N25b 11.0372 6.8011 B-Gwari "
N27 11.0375 6.8108 B-Gwari Sediment
N28 11.0400 6.8106 B-Gwari Soil on farmland
N29 11.0447 6.8108 B-Gwari Sediment on river bank
N30 11.0480 6.8106 B-Gwari River bed sediment
N30b 11.0488 6.8008 B-Gwari "
N32 11.0505 6.8050 B-Gwari Soil
N34 11.0531 6.7956 B-Gwari Soil, base of ridge
N35 11.0553 6.7983 B-Gwari Pebbly brown soil
N35b 11.0544 6.7983 B-Gwari "
N36 11.0417 6.7939 B-Gwari Soil
N37 10.9964 6.8217 B-Gwari Flood plain soils, farmland
N38 10.9986 6.8178 B-Gwari Sediment from small channel
N39 10.9894 6.8167 B-Gwari River bank soils
N42 11.0075 6.8072 B-Gwari Soil on farmland, close to river bank
N43 11.0108 6.8106 B-Gwari Waste rock heap, mostly of phyllites
N46 11.0192 6.8042 B-Gwari Soil
N47 11.0203 6.8080 B-Gwari Soil, close to mine pit
N48 11.0214 6.8169 B-Gwari Soil
N50 11.0147 6.8175 B-Gwari Pebbly brown soil
N50b 11.0147 6.8172 B-Gwari "
155
Appendix 1b cont’d
Sample Latitude Longitude Location Sample description
N51 10.9997 6.8150 B-Gwari Channel sediment
N53 10.9953 6.8094 B-Gwari Farmland soil
N54 11.0775 6.7869 B-Gwari Farmland soil, light brown
N55 11.0769 6.7844 B-Gwari Soil, upslope from N54
N55b 11.0769 6.7842 B-Gwari "
N56 11.0731 6.7769 B-Gwari Channel sediment
N57 11.0661 6.7719 B-Gwari Light brown soil
N58 11.0603 6.7731 B-Gwari Brown soils
N59 11.0403 6.7906 B-Gwari Grey-looking soils, base of hill
N60 10.9369 6.7556 B-Gwari Farmland soil, light brown
N62 10.9358 6.7592 B-Gwari "
TM2 11.0177 6.7941 B-Gwari Termite mount soil
TM3 11.0556 6.8103 B-Gwari "
TM5 10.9378 6.7567 B-Gwari "
R1 10.97722 6.7986 B-Gwari Rock, altered phyllite
R2 " " B-Gwari "
R3 11.01083 6.8105 B-Gwari "
156
Appendix 2 XRF measurement accuracy on three certified reference materials (oxides, wt
%, trace elements, µg/g)
Element SDO-1(Shale, USGS) W2a(Diabase, USGS) STSD-2(S/sediment(NRCC)
Certified Measured Certified Measured Certified Measured
MgO 1.54 1.51 6.37 6.38 nd nd
Al2O3 12.27 12.34 15.45 15.27 nd nd
SiO2 49.28 49.36 52.68 52.27 nd nd
P2O5 0.11 0.13 0.14 0.13 nd nd
CaO 1.05 1.07 10.86 10.65 nd nd
TiO2 0.71 0.71 1.06 1.04 nd nd
MnO 0.04 0.04 0.167 0.16 nd nd
K2O 3.35 3.40 0.63 0.64 nd nd
Fe2O3 9.34 9.81 10.83 10.84 nd nd
Na2O 0.38 0.67 2.2 2.5 nd nd
Sc 13.2 12 36 32 16 15
V 160 170 260 271 101 105
Cr 66.4 49 92 64 116 103
Ni 99.5 88 70 65 53 57
Cu 60.2 61 110 118 47 47
Zn 64.1 58 80 73 246 237
As 68.5 63 1.2 3 42 40
Rb 126 129 21 22 104 98
Sr 75.1 71 190 186 400 409
Y 40.6 38 23 21 37 36
Zr 165 160 100 91 185 180
Nb 36.6 14 7.9 10 20 20
Mo 134 127 na 3 13 13
Ba 397 396 170 131 540 529
La 38.5 43 10 7 59 61
Ce 79.3 81 23 40 93 114
Pb 27.9 34 9.3 14 66 71
Th 10.5 13 2.4 6 17 21
U 48.8 44 0.5 1 19 16
Note: nd = not determined, na = not available.
157
Appendix 3 Major elements concentration (wt. %) in soils and sediments from the
Anka area, NW Nigeria. Details of samples can be found in Appendix 1 and Figure 8.
Sample SiO2 TiO2 Al2O3 MnO MgO Fe2O3 CaO P2O5 K2O Na2O LOI Total
A1 55.25 0.73 15.32 0.46 0.69 8.99 0.17 1.58 2.53 0.09 7.04 92.85
A2 84.81 1.29 7.46 0.03 0.15 2.53 0.35 0.03 1.53 <0.05 3.24 101.42
A3 40.21 0.18 4.46 0.12 0.11 9.58 0.25 1.08 0.55 <0.05 8.71 65.25
A4 81.87 1.75 4.91 0.07 0.12 3.42 0.17 0.31 1.48 0.16 2.68 99.42
A5 80.44 1.09 8.66 0.05 0.25 3.35 0.18 0.06 1.85 0.23 4.05 100.21
A6 70.27 0.57 6.36 0.08 0.31 7.48 0.16 1.14 1.13 0.03 3.76 99.07
A7 80.69 0.84 7.35 0.07 0.3 4.17 0.2 0.19 1.22 0.2 3.83 100.12
A8 86.14 1.83 4.49 0.06 0.11 2.48 0.13 0.15 1.22 0.05 1.84 99.37
A9 81.80 1.15 9.50 0.03 0.19 2.17 0.09 0.02 1.63 0.07 3.60 100.25
A10 84.79 1.02 5.93 0.05 0.19 2.03 0.54 0.10 1.79 0.17 3.99 100.60
A11 73.33 0.72 6.60 0.04 0.31 5.43 0.60 0.37 1.67 0.14 5.63 94.84
B1 62.58 0.39 3.74 0.07 0.16 7.98 0.46 1.27 0.51 <0.05 6.59 83.75
B2 70.87 0.75 6.24 0.06 0.33 7.46 0.44 0.45 1.03 <0.05 6.01 93.64
B3 61.79 1.00 11.22 0.09 0.72 10.41 1.11 0.45 1.79 <0.05 9.12 97.70
B4 58.76 1.43 16.43 0.09 0.60 10.48 0.38 0.10 1.47 <0.05 10.51 100.25
B5 80.76 2.86 6.34 0.12 0.23 5.13 0.21 0.06 1.20 0.19 3.24 100.34
B6 79.55 2.37 6.86 0.11 0.32 5.22 0.29 0.07 1.05 0.05 4.64 100.53
B7 63.65 1.79 9.72 0.14 1.01 7.93 3.43 0.38 2.15 0.19 9.85 100.24
B8 77.17 2.23 7.12 0.11 0.31 7.57 0.42 0.08 1.38 0.05 4.18 100.62
D1 64.6 0.52 17.97 0.08 1.02 6.27 0.64 0.12 4.3 <0.05 4.82 100.34
D2 76.07 1.98 8.98 0.11 0.4 5.3 1.6 0.18 1.38 0.07 3.64 99.71
D3 51.63 0.79 18.14 0.16 6.37 8.45 5.82 0.05 0.4 2.44 6.35 100.60
D4 88.97 1.04 4.78 0.04 0.10 1.58 0.14 0.03 1.84 0.19 1.56 100.27
D5 73.54 1.55 10.12 0.08 0.89 5.29 1.04 0.09 2.00 0.89 4.01 99.50
D6 77.29 1.33 9.77 0.06 0.34 4.34 0.91 0.03 1.38 0.41 4.51 100.37
D7 63.57 0.76 13.16 0.08 0.63 5.95 0.41 0.29 3.16 0.13 6.28 98.47
D8 82.94 1.36 6.23 0.07 0.25 3.34 0.85 0.03 1.32 0.35 2.31 99.05
D9 83.76 1.02 6.96 0.05 0.27 3.05 0.60 0.03 1.54 0.36 2.92 100.56
D10 89.05 0.85 4.87 0.04 0.08 1.20 0.20 0.02 1.79 0.17 1.72 99.99
TD1 83.79 0.65 8.15 0.02 0.25 2.16 0.7 0.02 1.82 0.7 2.80 101.06
TD2 76.43 0.87 10.68 0.06 0.60 3.04 0.82 0.04 2.18 0.84 4.62 100.18
TD3 69.60 0.78 13.05 0.12 0.99 4.49 1.90 0.07 2.19 1.49 5.32 100.00
TD4 66.64 0.82 14.88 0.11 1.25 5.28 1.34 0.09 2.88 1.47 5.46 100.22
TD5 88.00 0.85 5.25 0.03 0.10 1.21 0.24 0.02 2.17 0.33 1.68 99.88
TD6 77.38 0.9 5.74 0.09 0.45 1.74 1.15 0.28 2.44 0.19 8.62 100.55
TD7 72.06 1.08 12.64 0.05 0.44 4.01 0.63 0.10 2.26 0.13 7.06 100.46
TD8 88.35 1.13 4.59 0.04 0.09 1.26 0.15 0.03 1.92 0.25 1.79 99.60
TD9 79.87 1.09 9.40 0.06 0.27 2.69 0.32 0.04 2.27 0.43 4.03 100.47
TD10 83.56 0.99 5.88 0.04 0.23 1.70 0.57 0.13 2.12 0.24 5.13 100.59
TS1 77.77 0.98 8.44 0.06 0.43 3.02 0.62 0.20 2.39 0.28 5.95 100.14
TS2 79.98 1.15 8.96 0.05 0.38 3.17 0.18 0.04 1.54 0.12 5.06 100.63
TS3 86.30 1.09 5.65 0.03 0.15 1.79 0.20 0.04 1.76 0.16 2.99 100.16
TS4 73.35 0.91 6.3 0.06 0.32 3.89 1.12 0.71 1.88 0.18 5.7 99.51
TS5 85.40 1.06 6.27 0.04 0.18 1.99 0.23 0.07 1.90 0.28 3.82 101.24
TS6 72.99 1.03 11.17 0.08 0.77 4.49 0.77 0.07 1.95 0.62 5.93 99.87
Mean 75.28 1.12 8.59 0.08 0.53 4.54 0.73 0.24 1.78 0.32 4.81 98.53
Min 40.21 0.18 3.74 0.02 0.08 1.2 0.09 0.02 0.4 0.03 1.56 65.25
Max 89.05 2.86 18.14 0.46 6.37 10.48 5.82 1.58 4.3 2.44 10.51 101.42
PAAS 62.80 1.00 18.90 0.11 2.20 6.50 1.30 0.16 3.70 1.20 6.00 103.87
Note: For samples A1, A3, A4, A6, A8, A11, B1-B3, D7 and TS4, their totals should be read in conjunction
with the lead and copper concentrations in Appendix 2 below.
158
Appendix 4 Trace element concentration (µg/g) in soils and sediments of Anka area,
NW Nigeria. Details of samples can be found in Appendix 1 and Figure 8.
Sample pH Sc V Cr Ni Cu Zn As Rb Sr Zr
DL 10 10 10 10 10 9 10 10 10 6
A1 5.15 10 165 34 72 3600 122 5 5 233 472
A2 5.08 5 43 42 17 5 27 12 52 52 1816*
A3 5.63 5 88 17 74 3400 130 5 5 143 122
A4 6.97 5 53 44 36 500 95 5 5 66 4009*
A5 5.32 5 60 48 27 49 33 5 57 58 1011*
A6 6.08 11 86 55 40 1800 58 5 5 62 1457*
A7
5 95 45 52 400 92 5 5 104 854
A8 6.33 5 43 45 15 200 27 5 5 44 4367*
A9 5.27 5 38 39 18 5 28 13 58 45 1833*
A10 7.49 5 37 36 13 5 80 5 54 81 1460*
A11 6.36 5 196 28 40 1900 128 5 5 177 1017*
B1 6.68 12 111 78 67 2900 214 5 5 106 276
B2 6.44 11 123 90 60 1400 231 33 5 106 638
B3 7.39 14 148 176 90 1300 240 533 5 128 307
B4 4.89 21 213 159 76 175 65 89 71 56 458
B5 5.80 11 77 139 36 10 39 14 48 35 1587*
B6 7.03 12 75 123 41 5 59 11 48 36 1067*
B7 9.24 16 124 177 69 41 359 5 58 169 962
B8 7.85 11 124 224 51 14 61 14 56 40 1714*
D1
16 119 87 34 461 66 5 139 159 382
D2 6.28 14 88 100 30 415 49 5 5 232 3253*
D3 7.48 28 158 327 175 5 75 5 10 262 126
D4 7.29 5 33 34 5 5 16 5 51 63 1691*
D5 7.65 5 75 78 32 21 44 5 66 111 3502*
D6 6.45 11 70 62 16 5 24 13 47 133 1241*
D7 6.28 5 78 43 33 2300 56 5 5 243 603
D8 6.37 5 58 63 17 5 24 13 40 90 2068*
D9 6.95 10 53 50 18 14 23 5 46 82 1228*
D10 6.11 5 28 28 5 5 16 10 52 64 549
TS1 8.32 5 53 61 24 25 52 5 68 94 970
TS2 6.24 5 49 40 15 13 31 5 45 34 939
TS3 7.17 5 38 68 12 5 32 12 55 57 1586*
TS4 8.29 5 60 65 36 1500 302 5 5 131 1525*
TS5 7.20 5 40 58 13 5 45 13 58 61 1404*
TS6 6.62 11 79 90 32 14 48 10 80 114 938
TD1 6.08 5 39 26 10 5 20 5 56 148 754
TD2 5.31 5 67 40 15 5 34 5 86 165 1076*
TD3 6.04 5 87 44 19 5 46 5 85 312 889
TD4 6.57 5 96 45 23 14 55 5 114 257 789
TD5 6.77 5 32 27 5 5 13 11 60 83 1303*
TD6 8.52 5 34 32 21 100 395 5 18 166 1444*
TD7 8.2 5 67 50 25 11 72 5 91 95 959
TD8 6.71 5 24 32 28 5 17 15 58 65 1905*
TD9 5.44 5 45 45 14 5 27 11 86 106 1343*
TD10 7.80 5 33 36 10 5 77 10 64 94 1532*
UCC
11 60 35 20 25 71 1.5 112 350 190
PAAS
16 150 110 55 90 85
160 200 210
*Above upper calibration range of the instrument.
159
Appendix 4 continued
Sample Nb Mo Ba La Ce Pb Th U
DL 10 10 24 10 10 20 10 10
A1 <10 <10 2315 59 116 61700 1664* <10
A2 24 <10 455 30 67 378 25 <10
A3 <10 <10 695 10 39 221600 10766* <10
A4 26 <10 597 53 100 24300 565 <10
A5 20 <10 537 10 65 2023 48 <10
A6 18 <10 528 27 64 76000 407 <10
A7 <10 <10 753 20 60 10200 2140* <10
A8 30 <10 352 64 101 8500 214 <10
A9 24 <10 467 31 73 74 21 <10
A10 20 <10 523 26 67 327 21 <10
A11 <10 10 2319 10 127 40300 942 <10
B1 <10 23 2317 10 67 122800 4287* <10
B2 <10 11 2318 10 87 59100 1604* <10
B3 14 10 2316 27 99 28300 678 <10
B4 22 10 637 34 104 1333 55 <10
B5 35 <10 305 10 48 403 23 <10
B6 26 <10 272 22 41 83 12 <10
B7 22 <10 573 23 76 2771 59 <10
B8 30 <10 355 23 63 236 21 <10
D1 11 <10 1295 31 80 3800 74 <10
D2 25 10 675 51 116 12100 278 <10
D3 <10 <10 288 10 59 73 <10 <10
D4 20 <10 545 23 63 1232 39 <10
D5 25 <10 776 44 97 2600 77 <10
D6 21 <10 470 28 62 61 17 <10
D7 <10 10 2320 20 160 38200 892 <10
D8 21 <10 396 26 71 204 22 <10
D9 19 <10 488 10 61 858 29 <10
D10 16 <10 519 20 48 26 <10 <10
TS1 21 <10 562 32 68 2038 48 <10
TS2 20 <10 468 21 54 137 12 <10
TS3 21 <10 432 10 62 357 24 <10
TS4 12 <10 562 26 66 49400 1276* <10
TS5 21 <10 471 26 64 327 23 <10
TS6 22 <10 614 47 95 31 16 <10
TD1 15 <10 566 20 61 120 <10 <10
TD2 18 <10 710 37 110 35 16 <10
TD3 16 <10 906 35 120 39 14 <10
TD4 15 <10 968 47 121 39 18 <10
TD5 17 <10 589 10 64 22 14 <10
TD6 17 <10 1013 20 76 15600 334 <10
TD7 24 <10 547 43 76 225 20 <10
TD8 22 <10 482 24 55 27 18 <10
TD9 22 <10 665 43 73 35 20 <10
TD10 20 <10 618 20 56 497 27 <10
UCC 25 1.5 550 30 64 20 10.7 2.8
PAAS 1.9
650
64 20 14.6 3.1
*Above upper calibration range of the instrument.
160
Appendix 5 Major elements concentration (wt.%) in soils and sediments from Birnin-
Gwari area, NW Nigeria. Details of samples can be found in Appendix 1 and Figure 8. Sample SiO2 TiO2 Al2O3 MnO MgO Fe2O3 CaO P2O5 K2O Na2O LOI Total
N3 74.96 1.47 10.88 0.1 0.22 4.91 0.14 0.04 1.68 0.27 5.99 100.66
N5 78.23 1 9.75 0.09 0.18 3.21 0.15 0.04 2.6 0.32 4.99 100.56
N7 69.9 0.77 16.88 0.03 0.47 3.87 0.04 0.04 3.39 0.34 4.21 99.9
N8 68.36 1.2 14.68 0.33 0.38 6.27 0.1 0.05 2.19 0.21 6.85 100.62
N9 71.12 0.88 16.12 0.03 0.3 4.17 0.05 0.04 3 0.3 4.29 100.3
N10 82.58 1.15 7.68 0.08 0.24 3.02 0.24 0.03 1.88 0.26 3.16 100.32
N12 83.07 1.69 6.97 0.1 0.19 3.12 0.24 0.04 1.76 0.29 2.88 100.35
N14 69.34 1.03 8.92 0.46 0.24 11.18 0.33 0.14 1.03 0.21 8.38 101.26
N15 78.14 1.05 9.63 0.11 0.3 4.12 0.25 0.04 2.13 0.33 4.12 100.22
N15b 71.4 1.03 12.96 0.21 0.36 5.81 0.17 0.05 2.20 0.30 6.17 100.62
N16 83.23 1.33 6.91 0.08 0.21 2.96 0.26 0.04 1.85 0.29 3.25 100.41
N17 78.9 1.26 8.94 0.11 0.29 3.85 0.27 0.04 2.03 0.28 4.40 100.33
N20 82.44 1.64 7.31 0.06 0.19 3.03 0.19 0.03 1.87 0.3 nd 97.06
N21 83.1 1.98 6.74 0.07 0.18 3.12 0.20 0.04 1.70 0.26 2.67 100.05
N22 81.14 1.7 7.83 0.07 0.2 3.49 0.21 0.04 1.85 0.25 nd 96.78
N23 87.51 1.84 4.92 0.06 0.12 2.23 0.2 0.03 1.45 0.21 nd 98.57
N24 83.35 1.25 7.33 0.05 0.19 2.84 0.19 0.03 1.75 0.24 3.01 100.23
N25 83.7 1.29 7.33 0.07 0.22 3.02 0.23 0.03 1.84 0.23 2.93 100.87
N25b 86.68 1.93 5.25 0.06 0.12 2.32 0.2 0.04 1.58 0.23 nd 98.41
N27 80.6 1.19 8.67 0.07 0.25 3.51 0.23 0.03 1.91 0.24 3.75 100.46
N28 80.53 1.4 7.41 0.09 0.27 3.64 0.3 0.05 1.84 0.32 nd 95.85
N29 87.09 1.93 5.1 0.06 0.11 2.33 0.18 0.03 1.52 0.19 nd 98.54
N30 89.28 1.64 4.47 0.05 0.1 1.91 0.18 0.03 1.52 0.22 nd 99.4
N30b 85.63 1.91 5.42 0.07 0.14 2.69 0.19 0.04 1.49 0.32 nd 97.9
N32 79.91 1.87 7.67 0.08 0.27 3.59 0.24 0.05 1.74 0.33 nd 95.75
N34 73.96 1.15 10.29 0.08 0.31 3.01 0.57 0.07 1.72 0.28 9.26 100.7
N35 64.6 0.96 13.40 0.49 0.33 10.92 0.14 0.08 1.44 0.20 8.39 100.93
N35B 69.66 1.04 11.49 0.49 0.28 8.81 0.24 0.07 1.45 0.29 7.11 100.93
N36 69.13 0.66 15.36 0.11 0.83 5.75 0.1 0.04 3.34 0.2 5.04 100.56
N37 78.8 1.18 9.84 0.15 0.25 4.28 0.14 0.03 1.99 0.26 3.74 100.67
N38 65.3 1.17 17.56 0.08 0.40 6.32 0.08 0.05 3.35 0.28 5.90 100.45
N39 83.16 1.22 7.53 0.08 0.2 2.94 0.27 0.03 1.88 0.3 2.75 100.36
N42 85.37 1.43 5.92 0.1 0.15 2.52 0.22 0.03 1.76 0.23 2.87 100.6
N43 77.5 1.08 11.56 0.05 0.29 3.29 0.11 0.03 2.12 0.36 3.87 100.27
N46 86.8 1.30 5.37 0.05 0.12 2.21 0.16 0.03 1.54 0.19 2.00 99.8
N47 74.12 1.3 11.78 0.07 0.53 5.33 0.12 0.05 2.48 0.35 3.88 100.01
N48 80.44 1.36 8.12 0.13 0.23 3.33 0.23 0.05 1.19 0.21 5.54 100.83
nd: not determined
161
Appendix 5 continued
Sample SiO2 TiO2 Al2O3 MnO MgO Fe2O3 CaO P2O5 K2O Na2O LOI Total
N50 67.91 1.04 10.64 0.46 0.42 10.68 0.31 0.1 1.39 0.17 7.76 100.88
N50b 73.47 1.21 8.01 0.32 0.36 9.23 0.4 0.09 1.37 0.17 6.04 100.67
N51 67.65 1.34 12.46 0.44 0.38 10.15 0.14 0.09 1.63 0.17 6.38 100.83
N53 86.59 1.15 5.95 0.08 0.13 2.46 0.1 0.03 1.64 0.21 2.31 100.65
N54 90.44 1.27 4 0.05 0.12 1.27 0.17 0.04 1.48 0.14 nd 98.98
N55 85.0 0.97 5.92 0.16 0.15 2.76 0.15 0.06 1.15 0.14 4.41 100.84
N55b 89.35 1.24 4.15 0.12 0.08 2.41 0.05 0.03 0.85 0.1 2.05 100.43
N56 65.3 0.68 11.75 0.67 0.85 12.09 0.24 0.09 2.14 0.51 6.68 101.03
N57 66.5 0.95 10.20 0.39 0.49 11.16 0.47 0.08 1.75 0.34 8.72 101.02
N58 77.6 0.99 7.58 0.18 0.36 5.39 0.35 0.06 1.40 0.18 6.83 100.89
N59 68.5 0.90 11.10 0.34 0.62 11.13 0.15 0.10 1.84 0.22 6.17 101.03
N60 78.7 1.09 8.45 0.04 0.19 2.00 0.30 0.05 2.30 0.22 7.28 100.57
N62 87.08 1.17 5.69 0.04 0.09 1.64 0.12 0.03 1.9 0.23 nd 97.99
TM2 64.83 1.39 16.41 0.16 0.35 7.49 0.16 0.05 2.01 0.22 7.25 100.32
TM3 71.2 1.52 13.78 0.08 0.29 5.44 0.09 0.05 1.8 0.21 5.96 100.42
TM5 70.81 1.23 15.17 0.03 0.27 3.65 0.15 0.04 2.18 0.18 7.18 100.89
R1 86.5 0.28 8.15 0.02 0.24 1.06 0.05 0.03 1.48 0.36 2.55 100.72
R2 92.19 0.21 5.09 0.01 0.19 0.84 0.03 0.01 1.14 0.12 1.26 101.09
R3 88.96 0.26 6.78 0.02 0.21 1.09 0.04 0.01 1.3 0.21 1.98 100.86
PAAS 62.80 1.00 18.90 0.11 2.20 6.50 1.30 0.16 3.70 1.20 6.00 103.87
PAAS: Post Archaean Australian Average Shale
162
Appendix 6 Trace elements concentration (µg/g) in soils and sediments from Birnin-
Gwari area, NW Nigeria. Details of samples can be found in Appendix 1 and Figure 8.
Sample Sc V Cr Ni Cu Zn As Rb Sr Y
DL 10 10 10 10 10 9 10 10 10 10
N3 11 79 57 16 <10 28 19 64 53 35
N5 <10 45 35 10 <10 29 15 89 127 31
N7 12 85 92 19 <10 30 43 148 80 21
N8 12 87 69 28 18 38 19 96 52 37
N9 13 80 77 15 <10 26 37 131 60 18
N10 <10 49 45 14 <10 24 17 66 52 33
N12 <10 48 48 13 <10 24 23 61 47 53
N14 <10 66 48 22 <10 37 39 48 49 37
N15 <10 60 49 17 <10 28 14 81 57 32
N15b 10 76 58 22 <10 35 13 92 59 33
N16 <10 50 45 12 <10 24 17 64 51 41
N17 10 61 51 16 <10 28 18 76 56 41
N20 <10 52 48 14 <10 26 26 63 51 61
N21 <10 53 51 13 <10 27 36 57 48 73
N22 <10 60 51 15 <10 27 22 65 51 58
N23 <10 41 46 11 <10 21 31 45 39 63
N24 <10 48 44 13 <10 22 20 62 49 41
N25 <10 49 45 13 <10 23 19 63 55 38
N25b <10 42 45 11 <10 23 35 49 43 71
N27 <10 57 49 16 <10 25 16 70 54 36
N28 <10 58 57 15 <10 30 22 67 56 43
N29 <10 42 46 11 <10 21 30 48 42 67
N30 <10 37 42 10 <10 19 26 43 43 53
N30b <10 46 46 11 <10 22 31 48 40 64
N32 10 61 57 17 <10 28 31 64 63 67
N34 <10 55 61 15 <10 42 13 70 69 29
N35 13 78 55 25 <10 38 19 79 45 32
N35B 10 72 56 20 <10 36 18 74 53 26
N36 13 68 52 16 <10 42 11 134 41 23
N37 <10 62 51 18 <10 29 24 77 53 36
N38 15 102 100 22 13 36 38 144 63 24
N39 <10 50 46 <10 <10 21 28 68 48 33
N42 <10 39 39 11 <10 22 21 60 52 39
N43 10 59 68 14 <10 32 48 108 48 25
N46 <10 38 39 10 <10 20 22 51 46 39
N47 10 63 72 12 <10 50 94 137 65 16
N48 <10 52 46 17 <10 26 17 56 43 33
163
Appendix 6 continued
Sample Sc V Cr Ni Cu Zn As Rb Sr Y
N50 10 78 54 28 <10 52 17 82 60 29
N50b <10 67 50 20 <10 45 14 70 65 25
N51 14 96 60 30 19 52 16 95 51 33
N53 <10 37 34 11 <10 21 16 55 52 27
N54 <10 24 31 <10 <10 16 22 45 49 39
N55 <10 35 29 11 <10 23 17 45 43 29
N55b <10 29 28 <10 <10 19 22 31 29 37
N56 11 77 62 30 11 51 53 112 59 21
N57 <10 74 48 19 <10 43 10 81 110 27
N58 <10 47 35 15 <10 38 11 67 60 23
N59 10 81 59 29 29 77 16 123 39 20
N60 <10 42 38 12 <10 22 11 76 113 33
N62 <10 33 33 <10 <10 18 17 56 67 37
TM2 18 127 81 23 40 32 29 78 44 32
TM3 13 82 82 27 <10 35 22 100 49 39
TM5 <10 65 48 19 <10 29 10 90 83 37
R1 <10 38 32 <10 <10 16 15 48 98 14
R2 <10 32 29 <10 <10 15 18 43 23 <10
R3 <10 39 33 <10 <10 16 14 48 58 11
Zr Nb Mo Ba La Ce Pb Th U
6 10 10 24 10 10 20 10 10
N3 1344* 27 <10 407 48 93 31 22 <10
N5 1648* 21 <10 849 26 83 53 20 <10
N7 476 15 <10 785 45 80 27 14 <10
N8 830 24 <10 509 62 105 31 21 <10
N9 505 18 <10 580 36 67 27 17 <10
N10 1366* 24 <10 463 31 74 28 18 <10
N12 3254* 38 <10 415 50 92 29 29 <10
N14 792 21 <10 398 52 71 28 16 <10
N15 1098* 23 <10 539 35 82 30 19 <10
N15b 768 23 <10 578 47 84 29 18 <10
N16 2048* 26 <10 460 34 78 29 24 <10
N17 1681 28 <10 532 41 86 32 22 <10
N20 3134 29 <10 447 57 100 31 33 <10
N21 4154 33 <10 383 64 113 31 41 <10
N22 2723 30 <10 429 48 93 28 31 <10
N23 4435 30 <10 327 50 94 27 38 <10
N24 2010* 24 <10 424 37 84 27 24 <10
N25 1879 24 <10 451 35 72 30 21 <10
N25b 4656 31 <10 366 53 104 27 45 <10
*Above calibration limit.
164
Appendix 6 continued
Sample Zr Nb Mo Ba La Ce Pb Th U
N27 1467 23 <10 480 35 72 29 20 <10
N28 2370 25 <10 467 43 92 31 26 <10
N29 4266 31 <10 355 51 95 27 39 <10
N30 3255 27 <10 357 35 73 26 30 <10
N30b 4321 31 <10 344 55 99 28 39 <10
N32 3755 31 <10 456 67 115 32 39 <10
N34 888 20 <10 478 37 71 26 16 <10
N35 562 20 <10 448 55 77 27 17 <10
N35B 609 21 <10 476 42 73 25 15 <10
N36 371 17 <10 614 28 61 24 16 <10
N37 1348 23 <10 506 41 83 30 20 <10
N38 953 23 <10 675 39 69 34 19 <10
N39 1899* 26 <10 433 35 76 29 19 <10
N42 2099* 27 <10 437 31 72 28 21 <10
N43 1343 19 <10 374 25 56 26 17 <10
N46 2106 23 <10 374 24 67 28 23 <10
N47 596 20 <10 379 37 69 34 15 <10
N48 1234* 25 <10 295 31 77 26 16 <10
N50 555 19 <10 649 42 75 27 15 <10
N50b 691 19 <10 513 36 63 22 13 <10
N51 658 22 <10 586 51 83 26 16 <10
N53 1150* 21 <10 398 23 59 23 15 <10
N54 2131 23 <10 315 26 60 22 19 <10
N55 986 20 <10 358 25 56 23 13 <10
N55b 1755 22 <10 224 23 54 21 16 <10
N56 388 15 <10 669 41 78 26 12 <10
N57 760 19 <10 843 42 82 28 15 <10
N58 645 17 <10 405 25 58 24 12 <10
N59 261 17 <10 505 34 57 21 13 <10
N60 1424 23 <10 788 34 77 37 19 <10
N62 2034 22 <10 494 27 68 33 21 <10
TM2 395 22 <10 447 38 69 28 16 <10
TM3 1240* 28 <10 404 67 101 26 21 <10
TM5 1299* 27 <10 631 41 85 38 22 <10
R1 276 <10 <10 254 21 62 23 <10 <10
R2 251 <10 <10 162 <20 40 20 <10 <10
R3 262 <10 <10 214 <20 54 22 <10 <10
165
Appendix 7 Enrichment ratios, ER for trace elements in soils and sediments from
Anka area, NW Nigeria. Details of samples can be found in Appendix 1 and Figure 8. Sample Sc V Cr Ni Cu Zn As Rb Sr Zr
A1 0.91 2.75 0.97 3.60 144.00 1.72 6.67 0.09 0.67 2.48
A2 0.91 0.72 1.20 0.85 0.40 0.38 8.00 0.46 0.15 9.56
A3 0.91 1.47 0.49 3.70 136.00 1.83 6.67 0.09 0.41 0.64
A4 0.91 0.88 1.26 1.80 20.00 1.34 6.67 0.09 0.19 21.10
A5 0.91 1.00 1.37 1.35 1.96 0.46 6.67 0.51 0.17 5.32
A6 1.00 1.43 1.57 2.00 72.00 0.82 6.67 0.09 0.18 7.67
A7 0.91 1.58 1.29 2.60 16.00 1.30 6.67 0.09 0.30 4.49
A8 0.91 0.72 1.29 0.75 8.00 0.38 6.67 0.09 0.13 22.98
A9 0.91 0.63 1.11 0.90 0.40 0.39 8.67 0.52 0.13 9.65
A10 0.91 0.62 1.03 0.65 0.40 1.13 6.67 0.48 0.23 7.68
A11 0.91 3.27 0.80 2.00 76.00 1.80 6.67 0.09 0.51 5.35
B1 1.09 1.85 2.23 3.35 116.00 3.01 6.67 0.09 0.30 1.45
B2 1.00 2.05 2.57 3.00 56.00 3.25 22.00 0.09 0.30 3.36
B3 1.27 2.47 5.03 4.50 52.00 3.38 355.33 0.09 0.37 1.62
B4 1.91 3.55 4.54 3.80 7.00 0.92 59.33 0.63 0.16 2.41
B5 1.00 1.28 3.97 1.80 0.40 0.55 9.33 0.43 0.10 8.35
B6 1.09 1.25 3.51 2.05 0.40 0.83 7.33 0.43 0.10 5.62
B7 1.45 2.07 5.06 3.45 1.64 5.06 6.67 0.52 0.48 5.06
B8 1.00 2.07 6.40 2.55 0.56 0.86 9.33 0.50 0.11 9.02
D1 1.45 1.98 2.49 1.70 18.44 0.93 6.67 1.24 0.45 2.01
D2 1.27 1.47 2.86 1.50 16.60 0.69 6.67 0.09 0.66 17.12
D3 2.55 2.63 9.34 8.75 0.40 1.06 6.67 0.09 0.75 0.66
D4 0.91 0.55 0.97 0.25 0.40 0.23 6.67 0.46 0.18 8.90
D5 0.91 1.25 2.23 1.60 0.84 0.62 6.67 0.59 0.32 18.43
D6 1.00 1.17 1.77 0.80 0.40 0.34 8.67 0.42 0.38 6.53
D7 0.91 1.30 1.23 1.65 92.00 0.79 6.67 0.09 0.69 3.17
D8 0.91 0.97 1.80 0.85 0.40 0.34 8.67 0.36 0.26 10.88
D9 0.91 0.88 1.43 0.90 0.56 0.32 6.67 0.41 0.23 6.46
D10 0.91 0.47 0.80 0.25 0.40 0.23 6.67 0.46 0.18 2.89
TD1 0.91 0.88 1.74 1.20 1.00 0.73 6.67 0.61 0.27 5.11
TD2 0.91 0.82 1.14 0.75 0.52 0.44 6.67 0.40 0.10 4.94
TD3 0.91 0.63 1.94 0.60 0.40 0.45 8.00 0.49 0.16 8.35
TD4 0.91 1.00 1.86 1.80 60.00 4.25 6.67 0.09 0.37 8.03
TD5 0.91 0.67 1.66 0.65 0.40 0.63 8.67 0.52 0.17 7.39
TD6 1.00 1.32 2.57 1.60 0.56 0.68 6.67 0.71 0.33 4.94
TD7 0.91 0.65 0.74 0.50 0.40 0.28 6.67 0.50 0.42 3.97
TD8 0.91 1.12 1.14 0.75 0.40 0.48 6.67 0.77 0.47 5.66
TD9 0.91 1.45 1.26 0.95 0.40 0.65 6.67 0.76 0.89 4.68
TD10 0.91 1.60 1.29 1.15 0.56 0.77 6.67 1.02 0.73 4.15
TS1 0.91 0.53 0.77 0.25 0.40 0.18 7.33 0.54 0.24 6.86
TS2 0.91 0.57 0.91 1.05 4.00 5.56 6.67 0.16 0.47 7.60
TS3 0.91 1.12 1.43 1.25 0.44 1.01 6.67 0.81 0.27 5.05
TS4 0.91 0.40 0.91 1.40 0.40 0.24 10.00 0.52 0.19 10.03
TS5 0.91 0.75 1.29 0.70 0.40 0.38 7.33 0.77 0.30 7.07
TS6 0.91 0.55 1.03 0.50 0.40 1.08 6.67 0.57 0.27 8.06
Min 0.91 0.40 0.49 0.25 0.40 0.18 6.67 0.09 0.10 0.64
Max 2.55 3.55 9.34 8.75 144.00 5.56 355.33 1.24 0.89 22.98
Mean 1.03 1.30 2.05 1.73 20.23 1.17 16.40 0.42 0.33 6.95
166
Appendix 7 continued Sample Nb Mo Y Ba La Ce Pb Th U
A1 0.40 6.67 5.18 4.21 1.97 1.81 3085.00 155.51 3.57
A2 0.96 6.67 1.59 0.83 1.00 1.05 18.90 2.34 3.57
A3 0.40 6.67 5.32 1.26 0.33 0.61 11080.00 1006.17 3.57
A4 1.04 6.67 4.32 1.09 1.77 1.56 1215.00 52.80 3.57
A5 0.80 6.67 1.41 0.98 0.33 1.02 101.15 4.49 3.57
A6 0.72 6.67 2.50 0.96 0.90 1.00 3800.00 38.04 3.57
A7 0.40 6.67 5.23 1.37 0.67 0.94 510.00 200.00 3.57
A8 1.20 6.67 3.59 0.64 2.13 1.58 425.00 20.00 3.57
A9 0.96 6.67 1.91 0.85 1.03 1.14 3.70 1.96 3.57
A10 0.80 6.67 1.27 0.95 0.87 1.05 16.35 1.96 3.57
A11 0.40 6.67 3.36 4.22 0.33 1.98 2015.00 88.04 3.57
B1 0.40 15.33 5.27 4.21 0.33 1.05 6140.00 400.65 3.57
B2 0.40 7.33 4.55 4.21 0.33 1.36 2955.00 149.91 3.57
B3 0.56 6.67 2.50 4.21 0.90 1.55 1415.00 63.36 3.57
B4 0.88 6.67 1.27 1.16 1.13 1.63 66.65 5.14 3.57
B5 1.40 6.67 1.45 0.55 0.33 0.75 20.15 2.15 3.57
B6 1.04 6.67 1.09 0.49 0.73 0.64 4.15 1.12 3.57
B7 0.88 6.67 1.18 1.04 0.77 1.19 138.55 5.51 3.57
B8 1.20 6.67 1.27 0.65 0.77 0.98 11.80 1.96 3.57
D1 0.44 6.67 1.36 2.35 1.03 1.25 190.00 6.92 3.57
D2 1.00 6.67 3.59 1.23 1.70 1.81 605.00 25.98 3.57
D3 0.40 6.67 1.14 0.52 0.33 0.92 3.65 0.47 3.57
D4 0.80 6.67 1.55 0.99 0.77 0.98 61.60 3.64 3.57
D5 1.00 6.67 2.09 1.41 1.47 1.52 130.00 7.20 3.57
D6 0.84 6.67 1.45 0.85 0.93 0.97 3.05 1.59 3.57
D7 0.40 6.67 3.41 4.22 0.67 2.50 1910.00 83.36 3.57
D8 0.84 6.67 1.59 0.72 0.87 1.11 10.20 2.06 3.57
D9 0.76 6.67 1.23 0.89 0.33 0.95 42.90 2.71 3.57
D10 0.64 6.67 0.77 0.94 0.67 0.75 1.30 0.47 3.57
TD1 0.84 6.67 1.45 1.02 1.07 1.06 101.90 4.49 3.57
TD2 0.80 6.67 1.86 0.85 0.70 0.84 6.85 1.12 3.57
TD3 0.84 6.67 1.45 0.79 0.33 0.97 17.85 2.24 3.57
TD4 0.48 6.67 4.59 1.02 0.87 1.03 2470.00 119.25 3.57
TD5 0.84 6.67 1.41 0.86 0.87 1.00 16.35 2.15 3.57
TD6 0.88 6.67 1.59 1.12 1.57 1.48 1.55 1.50 3.57
TD7 0.60 6.67 0.82 1.03 0.67 0.95 6.00 0.47 3.57
TD8 0.72 6.67 1.09 1.29 1.23 1.72 1.75 1.50 3.57
TD9 0.64 6.67 0.91 1.65 1.17 1.88 1.95 1.31 3.57
TD10 0.60 6.67 0.82 1.76 1.57 1.89 1.95 1.68 3.57
TS1 0.68 6.67 1.00 1.07 0.33 1.00 1.10 1.31 3.57
TS2 0.68 6.67 2.27 1.84 0.67 1.19 780.00 31.21 3.57
TS3 0.96 6.67 1.41 0.99 1.43 1.19 11.25 1.87 3.57
TS4 0.88 6.67 1.68 0.88 0.80 0.86 1.35 1.68 3.57
TS5 0.88 6.67 1.55 1.21 1.43 1.14 1.75 1.87 3.57
TS6 0.80 6.67 1.32 1.12 0.67 0.88 24.85 2.52 3.57
Min 0.40 6.67 0.77 0.49 0.33 0.61 1.10 0.47 3.57
Max 1.40 15.33 5.32 4.22 2.13 2.50 11080.00 1006.17 3.57
Mean 0.76 6.87 2.17 1.48 0.91 1.22 876.12 55.82 3.57
167
Appendix 8 Indices of geoaccumulation, Igeo for trace elements in soils and sediments
from Anka area, NW Nigeria. Details of samples can be found in Appendix 1 and
Figure 8.
Sample Sc V Cr Ni Cu Zn As Rb Sr Zr
A1 -0.72 0.87 -0.63 1.26 6.58 0.20 2.15 -4.07 -1.17 0.73
A2 -0.72 -1.07 -0.32 -0.82 -1.91 -1.98 2.42 -1.69 -3.34 2.67
A3 -0.72 -0.03 -1.63 1.30 6.50 0.29 2.15 -4.07 -1.88 -1.22
A4 -0.72 -0.76 -0.25 0.26 3.74 -0.16 2.15 -4.07 -2.99 3.81
A5 -0.72 -0.58 -0.13 -0.15 0.39 -1.69 2.15 -1.56 -3.18 1.83
A6 -0.58 -0.07 0.07 0.42 5.58 -0.88 2.15 -4.07 -3.08 2.35
A7 -0.72 0.08 -0.22 0.79 3.42 -0.21 2.15 -4.07 -2.34 1.58
A8 -0.72 -1.07 -0.22 -1.00 2.42 -1.98 2.15 -4.07 -3.58 3.94
A9 -0.72 -1.24 -0.43 -0.74 -1.91 -1.93 2.53 -1.53 -3.54 2.69
A10 -0.72 -1.28 -0.54 -1.21 -1.91 -0.41 2.15 -1.64 -2.70 2.36
A11 -0.72 1.12 -0.91 0.42 5.66 0.27 2.15 -4.07 -1.57 1.84
B1 -0.46 0.30 0.57 1.16 6.27 1.01 2.15 -4.07 -2.31 -0.05
B2 -0.58 0.45 0.78 1.00 5.22 1.12 3.87 -4.07 -2.31 1.16
B3 -0.24 0.72 1.75 1.58 5.12 1.17 7.89 -4.07 -2.04 0.11
B4 0.35 1.24 1.60 1.34 2.22 -0.71 5.31 -1.24 -3.23 0.68
B5 -0.58 -0.23 1.40 0.26 -1.91 -1.45 2.64 -1.81 -3.91 2.48
B6 -0.46 -0.26 1.23 0.45 -1.91 -0.85 2.29 -1.81 -3.87 1.90
B7 -0.04 0.46 1.75 1.20 0.13 1.75 2.15 -1.53 -1.64 1.76
B8 -0.58 0.46 2.09 0.77 -1.42 -0.80 2.64 -1.58 -3.71 2.59
D1 -0.04 0.40 0.73 0.18 3.62 -0.69 2.15 -0.27 -1.72 0.42
D2 -0.24 -0.03 0.93 0.00 3.47 -1.12 2.15 -4.07 -1.18 3.51
D3 0.76 0.81 2.64 2.54 -1.91 -0.51 2.15 -4.07 -1.00 -1.18
D4 -0.72 -1.45 -0.63 -1.58 -1.91 -2.73 2.15 -1.72 -3.06 2.57
D5 -0.72 -0.26 0.57 0.09 -0.84 -1.28 2.15 -1.35 -2.24 3.62
D6 -0.58 -0.36 0.24 -0.91 -1.91 -2.15 2.53 -1.84 -1.98 2.12
D7 -0.72 -0.21 -0.29 0.14 5.94 -0.93 2.15 -4.07 -1.11 1.08
D8 -0.72 -0.63 0.26 -0.82 -1.91 -2.15 2.53 -2.07 -2.54 2.86
D9 -0.72 -0.76 -0.07 -0.74 -1.42 -2.21 2.15 -1.87 -2.68 2.11
D10 -0.72 -1.68 -0.91 -1.58 -1.91 -2.73 2.15 -1.69 -3.04 0.95
TD1 -0.72 -0.76 0.22 -0.32 -0.58 -1.03 2.15 -1.30 -2.48 1.77
TD2 -0.72 -0.88 -0.39 -1.00 -1.53 -1.78 2.15 -1.90 -3.95 1.72
TD3 -0.72 -1.24 0.37 -1.32 -1.91 -1.73 2.42 -1.61 -3.20 2.48
TD4 -0.72 -0.58 0.31 0.26 2.32 1.50 2.15 -4.07 -2.00 2.42
TD5 -0.72 -1.17 0.14 -1.21 -1.91 -1.24 2.53 -1.53 -3.11 2.30
TD6 -0.58 -0.19 0.78 0.09 -1.42 -1.15 2.15 -1.07 -2.20 1.72
TD7 -0.72 -1.21 -1.01 -1.58 -1.91 -2.41 2.15 -1.58 -1.83 1.40
TD8 -0.72 -0.43 -0.39 -1.00 -1.91 -1.65 2.15 -0.97 -1.67 1.92
TD9 -0.72 -0.05 -0.25 -0.66 -1.91 -1.21 2.15 -0.98 -0.75 1.64
TD10 -0.72 0.09 -0.22 -0.38 -1.42 -0.95 2.15 -0.56 -1.03 1.47
TS1 -0.72 -1.49 -0.96 -1.58 -1.91 -3.03 2.29 -1.49 -2.66 2.19
TS2 -0.72 -1.40 -0.71 -0.51 1.42 1.89 2.15 -3.22 -1.66 2.34
TS3 -0.72 -0.43 -0.07 -0.26 -1.77 -0.56 2.15 -0.88 -2.47 1.75
TS4 -0.72 -1.91 -0.71 -0.10 -1.91 -2.65 2.74 -1.53 -3.01 2.74
TS5 -0.72 -1.00 -0.22 -1.10 -1.91 -1.98 2.29 -0.97 -2.31 2.24
TS6 -0.72 -1.45 -0.54 -1.58 -1.91 -0.47 2.15 -1.39 -2.48 2.43
Min -0.72 -1.91 -1.63 -1.58 -1.91 -3.03 2.15 -4.07 -3.95 -1.22
Max 0.76 1.24 2.64 2.54 6.58 1.89 7.89 -0.27 -0.75 3.94
Mean -0.58 -0.43 0.13 -0.15 0.52 -0.94 2.48 -2.29 -2.44 1.86
168
Appendix 8 continued
Sample Nb Mo Y Ba La Ce Pb Th U
A1 -1.91 2.15 1.79 1.49 0.39 0.27 11.01 6.70 1.25
A2 -0.64 2.15 0.08 -0.86 -0.58 -0.52 3.66 0.64 1.25
A3 -1.91 2.15 1.83 -0.25 -2.17 -1.30 12.85 9.39 1.25
A4 -0.53 2.15 1.53 -0.47 0.24 0.06 9.66 5.14 1.25
A5 -0.91 2.15 -0.09 -0.62 -2.17 -0.56 6.08 1.58 1.25
A6 -1.06 2.15 0.74 -0.64 -0.74 -0.58 11.31 4.66 1.25
A7 -1.91 2.15 1.80 -0.13 -1.17 -0.68 8.41 7.06 1.25
A8 -0.32 2.15 1.26 -1.23 0.51 0.07 8.15 3.74 1.25
A9 -0.64 2.15 0.35 -0.82 -0.54 -0.40 1.30 0.39 1.25
A10 -0.91 2.15 -0.24 -0.66 -0.79 -0.52 3.45 0.39 1.25
A11 -1.91 2.15 1.17 1.49 -2.17 0.40 10.39 5.88 1.25
B1 -1.91 3.35 1.81 1.49 -2.17 -0.52 12.00 8.06 1.25
B2 -1.91 2.29 1.60 1.49 -2.17 -0.14 10.94 6.64 1.25
B3 -1.42 2.15 0.74 1.49 -0.74 0.04 9.88 5.40 1.25
B4 -0.77 2.15 -0.24 -0.37 -0.40 0.12 5.47 1.78 1.25
B5 -0.10 2.15 -0.04 -1.44 -2.17 -1.00 3.75 0.52 1.25
B6 -0.53 2.15 -0.46 -1.60 -1.03 -1.23 1.47 -0.42 1.25
B7 -0.77 2.15 -0.34 -0.53 -0.97 -0.34 6.53 1.88 1.25
B8 -0.32 2.15 -0.24 -1.22 -0.97 -0.61 2.98 0.39 1.25
D1 -1.77 2.15 -0.14 0.65 -0.54 -0.26 6.98 2.20 1.25
D2 -0.58 2.15 1.26 -0.29 0.18 0.27 8.66 4.11 1.25
D3 -1.91 2.15 -0.40 -1.52 -2.17 -0.70 1.28 -1.68 1.25
D4 -0.91 2.15 0.04 -0.60 -0.97 -0.61 5.36 1.28 1.25
D5 -0.58 2.15 0.48 -0.09 -0.03 0.01 6.44 2.26 1.25
D6 -0.84 2.15 -0.04 -0.81 -0.68 -0.63 1.02 0.08 1.25
D7 -1.91 2.15 1.18 1.49 -1.17 0.74 10.31 5.80 1.25
D8 -0.84 2.15 0.08 -1.06 -0.79 -0.44 2.77 0.45 1.25
D9 -0.98 2.15 -0.29 -0.76 -2.17 -0.65 4.84 0.85 1.25
D10 -1.23 2.15 -0.96 -0.67 -1.17 -1.00 -0.21 -1.68 1.25
TD1 -0.84 2.15 -0.04 -0.55 -0.49 -0.50 6.09 1.58 1.25
TD2 -0.91 2.15 0.31 -0.82 -1.10 -0.83 2.19 -0.42 1.25
TD3 -0.84 2.15 -0.04 -0.93 -2.17 -0.63 3.57 0.58 1.25
TD4 -1.64 2.15 1.61 -0.55 -0.79 -0.54 10.69 6.31 1.25
TD5 -0.84 2.15 -0.09 -0.81 -0.79 -0.58 3.45 0.52 1.25
TD6 -0.77 2.15 0.08 -0.43 0.06 -0.02 0.05 0.00 1.25
TD7 -1.32 2.15 -0.87 -0.54 -1.17 -0.65 2.00 -1.68 1.25
TD8 -1.06 2.15 -0.46 -0.22 -0.28 0.20 0.22 0.00 1.25
TD9 -1.23 2.15 -0.72 0.14 -0.36 0.32 0.38 -0.20 1.25
TD10 -1.32 2.15 -0.87 0.23 0.06 0.33 0.38 0.17 1.25
TS1 -1.14 2.15 -0.58 -0.49 -2.17 -0.58 -0.45 -0.20 1.25
TS2 -1.14 2.15 0.60 0.30 -1.17 -0.34 9.02 4.38 1.25
TS3 -0.64 2.15 -0.09 -0.59 -0.07 -0.34 2.91 0.32 1.25
TS4 -0.77 2.15 0.17 -0.78 -0.91 -0.80 -0.15 0.17 1.25
TS5 -0.77 2.15 0.04 -0.31 -0.07 -0.40 0.22 0.32 1.25
TS6 -0.91 2.15 -0.19 -0.42 -1.17 -0.78 4.05 0.75 1.25
Min -1.91 2.15 -0.96 -1.60 -2.17 -1.30 -0.45 -1.68 1.25
Max -0.10 3.35 1.83 1.49 0.51 0.74 12.85 9.39 1.25
Mean -1.07 2.18 0.29 -0.31 -0.93 -0.37 5.14 2.13 1.25
169
Appendix 9 Enrichment ratios, ER for trace elements in soils and sediments from
Birnin-Gwari area, NW Nigeria. Details of samples can be found in Appendix 1 and
Figure 8.
Sample Sc V Cr Ni Cu Zn As Rb Sr Y
N3 1.00 1.32 1.63 0.80 0.40 0.39 12.67 0.57 0.15 1.59
N5 0.91 0.75 1.00 0.50 0.40 0.41 10.00 0.79 0.36 1.41
N7 1.09 1.42 2.63 0.95 0.40 0.42 28.67 1.32 0.23 0.95
N8 1.09 1.45 1.97 1.40 0.72 0.54 12.67 0.86 0.15 1.68
N9 1.18 1.33 2.20 0.75 0.40 0.37 24.67 1.17 0.17 0.82
N10 0.91 0.82 1.29 0.70 0.40 0.34 11.33 0.59 0.15 1.50
N12 0.91 0.80 1.37 0.65 0.40 0.34 15.33 0.54 0.13 2.41
N14 0.91 1.10 1.37 1.10 0.40 0.52 26.00 0.43 0.14 1.68
N15 0.91 1.00 1.40 0.85 0.40 0.39 9.33 0.72 0.16 1.45
N15b 0.91 1.27 1.66 1.10 0.40 0.49 8.67 0.82 0.17 1.50
N16 0.91 0.83 1.29 0.60 0.40 0.34 11.33 0.57 0.15 1.86
N17 0.91 1.02 1.46 0.80 0.40 0.39 12.00 0.68 0.16 1.86
N20 0.91 0.87 1.37 0.70 0.40 0.37 17.33 0.56 0.15 2.77
N21 0.91 0.88 1.46 0.65 0.40 0.38 24.00 0.51 0.14 3.32
N22 0.91 1.00 1.46 0.75 0.40 0.38 14.67 0.58 0.15 2.64
N23 0.91 0.68 1.31 0.55 0.40 0.30 20.67 0.40 0.11 2.86
N24 0.91 0.80 1.26 0.65 0.40 0.31 13.33 0.55 0.14 1.86
N25 0.91 0.82 1.29 0.65 0.40 0.32 12.67 0.56 0.16 1.73
N25b 0.91 0.70 1.29 0.55 0.40 0.32 23.33 0.44 0.12 3.23
N27 0.91 0.95 1.40 0.80 0.40 0.35 10.67 0.63 0.15 1.64
N28 0.91 0.97 1.63 0.75 0.40 0.42 14.67 0.60 0.16 1.95
N29 0.91 0.70 1.31 0.55 0.40 0.30 20.00 0.43 0.12 3.05
N30 0.91 0.62 1.20 0.50 0.40 0.27 17.33 0.38 0.12 2.41
N30b 0.91 0.77 1.31 0.55 0.40 0.31 20.67 0.43 0.11 2.91
N32 0.91 1.02 1.63 0.85 0.40 0.39 20.67 0.57 0.18 3.05
N34 0.91 0.92 1.74 0.75 0.40 0.59 8.67 0.63 0.20 1.32
N35 1.18 1.30 1.57 1.25 0.40 0.54 12.67 0.71 0.13 1.45
N35B 0.91 1.20 1.60 1.00 0.40 0.51 12.00 0.66 0.15 1.18
N36 1.18 1.13 1.49 0.80 0.40 0.59 7.33 1.20 0.12 1.05
N37 0.91 1.03 1.46 0.90 0.40 0.41 16.00 0.69 0.15 1.64
N38 1.36 1.70 2.86 1.10 0.52 0.51 25.33 1.29 0.18 1.09
N39 0.91 0.83 1.31 0.50 0.40 0.30 18.67 0.61 0.14 1.50
N42 0.91 0.65 1.11 0.55 0.40 0.31 14.00 0.54 0.15 1.77
N43 0.91 0.98 1.94 0.70 0.40 0.45 32.00 0.96 0.14 1.14
N46 0.91 0.63 1.11 0.50 0.40 0.28 14.67 0.46 0.13 1.77
N47 0.91 1.05 2.06 0.60 0.40 0.70 62.67 1.22 0.19 0.73
N48 0.91 0.87 1.31 0.85 0.40 0.37 11.33 0.50 0.12 1.50
N50 0.91 1.30 1.54 1.40 0.40 0.73 11.33 0.73 0.17 1.32
N50b 0.91 1.12 1.43 1.00 0.40 0.63 9.33 0.63 0.19 1.14
N51 1.27 1.60 1.71 1.50 0.76 0.73 10.67 0.85 0.15 1.50
N53 0.91 0.62 0.97 0.55 0.40 0.30 10.67 0.49 0.15 1.23
N54 0.91 0.40 0.89 0.50 0.40 0.23 14.67 0.40 0.14 1.77
N55 0.91 0.58 0.83 0.55 0.40 0.32 11.33 0.40 0.12 1.32
N55b 0.91 0.48 0.80 0.50 0.40 0.27 14.67 0.28 0.08 1.68
170
Appendix 9 continued
Sample Sc V Cr Ni Cu Zn As Rb Sr Y
N56 1.00 1.28 1.77 1.50 0.44 0.72 35.33 1.00 0.17 0.95
N57 0.91 1.23 1.37 0.95 0.40 0.61 6.67 0.72 0.31 1.23
N58 0.91 0.78 1.00 0.75 0.40 0.54 7.33 0.60 0.17 1.05
N59 0.91 1.35 1.69 1.45 1.16 1.08 10.67 1.10 0.11 0.91
N60 0.91 0.70 1.09 0.60 0.40 0.31 7.33 0.68 0.32 1.50
N62 0.91 0.55 0.94 0.50 0.40 0.25 11.33 0.50 0.19 1.68
Min 0.91 0.40 0.80 0.50 0.40 0.23 6.67 0.28 0.08 0.73
Max 1.36 1.70 2.86 1.50 1.16 1.08 62.67 1.32 0.36 3.32
Mean 0.95 0.96 1.46 0.80 0.43 0.43 16.19 0.67 0.16 1.71
Zr Nb Mo Ba La Ce Pb Th U
N3 7.07 1.08 6.67 0.74 1.60 1.45 1.55 2.06 3.57
N5 8.67 0.84 6.67 1.54 0.87 1.30 2.65 1.87 3.57
N7 2.51 0.60 6.67 1.43 1.50 1.25 1.35 1.31 3.57
N8 4.37 0.96 6.67 0.93 2.07 1.64 1.55 1.96 3.57
N9 2.66 0.72 6.67 1.05 1.20 1.05 1.35 1.59 3.57
N10 7.19 0.96 6.67 0.84 1.03 1.16 1.40 1.68 3.57
N12 17.13 1.52 6.67 0.75 1.67 1.44 1.45 2.71 3.57
N14 4.17 0.84 6.67 0.72 1.73 1.11 1.40 1.50 3.57
N15 5.78 0.92 6.67 0.98 1.17 1.28 1.50 1.78 3.57
N15b 4.04 0.92 6.67 1.05 1.57 1.31 1.45 1.68 3.57
N16 10.78 1.04 6.67 0.84 1.13 1.22 1.45 2.24 3.57
N17 8.85 1.12 6.67 0.97 1.37 1.34 1.60 2.06 3.57
N20 16.49 1.16 6.67 0.81 1.90 1.56 1.55 3.08 3.57
N21 21.86 1.32 6.67 0.70 2.13 1.77 1.55 3.83 3.57
N22 14.33 1.20 6.67 0.78 1.60 1.45 1.40 2.90 3.57
N23 23.34 1.20 6.67 0.59 1.67 1.47 1.35 3.55 3.57
N24 10.58 0.96 6.67 0.77 1.23 1.31 1.35 2.24 3.57
N25 9.89 0.96 6.67 0.82 1.17 1.13 1.50 1.96 3.57
N25b 24.51 1.24 6.67 0.67 1.77 1.63 1.35 4.21 3.57
N27 7.72 0.92 6.67 0.87 1.17 1.13 1.45 1.87 3.57
N28 12.47 1.00 6.67 0.85 1.43 1.44 1.55 2.43 3.57
N29 22.45 1.24 6.67 0.65 1.70 1.48 1.35 3.64 3.57
N30 17.13 1.08 6.67 0.65 1.17 1.14 1.30 2.80 3.57
N30b 22.74 1.24 6.67 0.63 1.83 1.55 1.40 3.64 3.57
N32 19.76 1.24 6.67 0.83 2.23 1.80 1.60 3.64 3.57
171
Appendix 9 continued
Sample Zr Nb Mo Ba La Ce Pb Th U
N34 4.67 0.80 6.67 0.87 1.23 1.11 1.30 1.50 3.57
N35 2.96 0.80 6.67 0.81 1.83 1.20 1.35 1.59 3.57
N35B 3.21 0.84 6.67 0.87 1.40 1.14 1.25 1.40 3.57
N36 1.95 0.68 6.67 1.12 0.93 0.95 1.20 1.50 3.57
N37 7.09 0.92 6.67 0.92 1.37 1.30 1.50 1.87 3.57
N38 5.02 0.92 6.67 1.23 1.30 1.08 1.70 1.78 3.57
N39 9.99 1.04 6.67 0.79 1.17 1.19 1.45 1.78 3.57
N42 11.05 1.08 6.67 0.79 1.03 1.13 1.40 1.96 3.57
N43 7.07 0.76 6.67 0.68 0.83 0.88 1.30 1.59 3.57
N46 11.08 0.92 6.67 0.68 0.80 1.05 1.40 2.15 3.57
N47 3.14 0.80 6.67 0.69 1.23 1.08 1.70 1.40 3.57
N48 6.49 1.00 6.67 0.54 1.03 1.20 1.30 1.50 3.57
N50 2.92 0.76 6.67 1.18 1.40 1.17 1.35 1.40 3.57
N50b 3.64 0.76 6.67 0.93 1.20 0.98 1.10 1.21 3.57
N51 3.46 0.88 6.67 1.07 1.70 1.30 1.30 1.50 3.57
N53 6.05 0.84 6.67 0.72 0.77 0.92 1.15 1.40 3.57
N54 11.22 0.92 6.67 0.57 0.87 0.94 1.10 1.78 3.57
N55 5.19 0.80 6.67 0.65 0.83 0.88 1.15 1.21 3.57
N55b 9.24 0.88 6.67 0.41 0.77 0.84 1.05 1.50 3.57
N56 2.04 0.60 6.67 1.22 1.37 1.22 1.30 1.12 3.57
N57 4.00 0.76 6.67 1.53 1.40 1.28 1.40 1.40 3.57
N58 3.39 0.68 6.67 0.74 0.83 0.91 1.20 1.12 3.57
N59 1.37 0.68 6.67 0.92 1.13 0.89 1.05 1.21 3.57
N60 7.49 0.92 6.67 1.43 1.13 1.20 1.85 1.78 3.57
N62 10.71 0.88 6.67 0.90 0.90 1.06 1.65 1.96 3.57
Min 1.37 0.60 6.67 0.41 0.77 0.84 1.05 1.12 3.57
Max 24.51 1.52 6.67 1.54 2.23 1.80 2.65 4.21 3.57
Mean 9.02 0.94 6.67 0.87 1.33 1.23 1.42 2.02 3.57
172
Appendix 10 Indices of geoaccumulation, Igeo for trace elements in soils and sediments
from Birnin-Gwari area, NW Nigeria. Details of samples can be found in Appendix 1
and Figure 8.
Sample Sc V Cr Ni Cu Zn As Rb Sr Y
N3 -0.58 -0.19 0.12 -0.91 -1.91 -1.93 3.08 -1.39 -3.31 0.08
N5 -0.72 -1 -0.58 -1.58 -1.91 -1.88 2.74 -0.92 -2.05 -0.09
N7 -0.46 -0.08 0.81 -0.66 -1.91 -1.83 4.26 -0.18 -2.71 -0.65
N8 -0.46 -0.05 0.39 -0.1 -1.06 -1.49 3.08 -0.81 -3.34 0.17
N9 -0.34 -0.17 0.55 -1 -1.91 -2.03 4.04 -0.36 -3.13 -0.87
N10 -0.72 -0.88 -0.22 -1.1 -1.91 -2.15 2.92 -1.35 -3.34 0
N12 -0.72 -0.91 -0.13 -1.21 -1.91 -2.15 3.35 -1.46 -3.48 0.68
N14 -0.72 -0.45 -0.13 -0.45 -1.91 -1.53 4.12 -1.81 -3.42 0.17
N15 -0.72 -0.58 -0.1 -0.82 -1.91 -1.93 2.64 -1.05 -3.2 -0.04
N15b -0.72 -0.24 0.14 -0.45 -1.91 -1.61 2.53 -0.87 -3.15 0
N16 -0.72 -0.85 -0.22 -1.32 -1.91 -2.15 2.92 -1.39 -3.36 0.31
N17 -0.72 -0.56 -0.04 -0.91 -1.91 -1.93 3 -1.14 -3.23 0.31
N20 -0.72 -0.79 -0.13 -1.1 -1.91 -2.03 3.53 -1.42 -3.36 0.89
N21 -0.72 -0.76 -0.04 -1.21 -1.91 -1.98 4 -1.56 -3.45 1.15
N22 -0.72 -0.58 -0.04 -1 -1.91 -1.98 3.29 -1.37 -3.36 0.81
N23 -0.72 -1.13 -0.19 -1.45 -1.91 -2.34 3.78 -1.9 -3.75 0.93
N24 -0.72 -0.91 -0.25 -1.21 -1.91 -2.28 3.15 -1.44 -3.42 0.31
N25 -0.72 -0.88 -0.22 -1.21 -1.91 -2.21 3.08 -1.42 -3.25 0.2
N25b -0.72 -1.1 -0.22 -1.45 -1.91 -2.21 3.96 -1.78 -3.61 1.11
N27 -0.72 -0.66 -0.1 -0.91 -1.91 -2.09 2.83 -1.26 -3.28 0.13
N28 -0.72 -0.63 0.12 -1 -1.91 -1.83 3.29 -1.33 -3.23 0.38
N29 -0.72 -1.1 -0.19 -1.45 -1.91 -2.34 3.74 -1.81 -3.64 1.02
N30 -0.72 -1.28 -0.32 -1.58 -1.91 -2.49 3.53 -1.97 -3.61 0.68
N30b -0.72 -0.97 -0.19 -1.45 -1.91 -2.28 3.78 -1.81 -3.71 0.96
N32 -0.72 -0.56 0.12 -0.82 -1.91 -1.93 3.78 -1.39 -3.06 1.02
N34 -0.72 -0.71 0.22 -1 -1.91 -1.34 2.53 -1.26 -2.93 -0.19
N35 -0.34 -0.21 0.07 -0.26 -1.91 -1.49 3.08 -1.09 -3.54 -0.04
N35B -0.72 -0.32 0.09 -0.58 -1.91 -1.56 3 -1.18 -3.31 -0.34
N36 -0.34 -0.4 -0.01 -0.91 -1.91 -1.34 2.29 -0.33 -3.68 -0.52
N37 -0.72 -0.54 -0.04 -0.74 -1.91 -1.88 3.42 -1.13 -3.31 0.13
N38 -0.14 0.18 0.93 -0.45 -1.53 -1.56 4.08 -0.22 -3.06 -0.46
N39 -0.72 -0.85 -0.19 -1.58 -1.91 -2.34 3.64 -1.3 -3.45 0
N42 -0.72 -1.21 -0.43 -1.45 -1.91 -2.28 3.22 -1.49 -3.34 0.24
N43 -0.72 -0.61 0.37 -1.1 -1.91 -1.73 4.42 -0.64 -3.45 -0.4
N46 -0.72 -1.24 -0.43 -1.58 -1.91 -2.41 3.29 -1.72 -3.51 0.24
N47 -0.72 -0.51 0.46 -1.32 -1.91 -1.09 5.38 -0.29 -3.01 -1.04
N48 -0.72 -0.79 -0.19 -0.82 -1.91 -2.03 2.92 -1.58 -3.61 0
N50 -0.72 -0.21 0.04 -0.1 -1.91 -1.03 2.92 -1.03 -3.13 -0.19
N50b -0.72 -0.43 -0.07 -0.58 -1.91 -1.24 2.64 -1.26 -3.01 -0.4
N51 -0.24 0.09 0.19 0 -0.98 -1.03 2.83 -0.82 -3.36 0
N53 -0.72 -1.28 -0.63 -1.45 -1.91 -2.34 2.83 -1.61 -3.34 -0.29
N54 -0.72 -1.91 -0.76 -1.58 -1.91 -2.73 3.29 -1.9 -3.42 0.24
N55 -0.72 -1.36 -0.86 -1.45 -1.91 -2.21 2.92 -1.9 -3.61 -0.19
N55b -0.72 -1.63 -0.91 -1.58 -1.91 -2.49 3.29 -2.44 -4.18 0.17
173
Appendix 10 continued
Sample
Sc V Cr Ni Cu Zn As Rb Sr Y
N56 -0.58 -0.23 0.24 0 -1.77 -1.06 4.56 -0.58 -3.15 -0.65
N57 -0.72 -0.28 -0.13 -0.66 -1.91 -1.31 2.15 -1.05 -2.25 -0.29
N58 -0.72 -0.94 -0.58 -1 -1.91 -1.49 2.29 -1.33 -3.13 -0.52
N59 -0.72 -0.15 0.17 -0.05 -0.37 -0.47 2.83 -0.45 -3.75 -0.72
N60 -0.72 -1.1 -0.47 -1.32 -1.91 -2.28 2.29 -1.14 -2.22 0
N62 -0.72 -1.45 -0.67 -1.58 -1.91 -2.56 2.92 -1.58 -2.97 0.17
Min -0.72 -1.91 -0.91 -1.58 -1.91 -2.73 2.15 -2.44 -4.18 -1.04
Max -0.14 0.18 0.93 0 -0.37 -0.47 5.38 -0.18 -2.05 1.15
Mean -0.66 -0.71 -0.09 -0.99 -1.83 -1.88 3.27 -1.25 -3.28 0.09
Zr Nb Mo Ba La Ce Pb Th U
N3 2.24 -0.47 2.15 -1.02 0.09 -0.05 0.05 0.45 1.25
N5 2.53 -0.84 2.15 0.04 -0.79 -0.21 0.82 0.32 1.25
N7 0.74 -1.32 2.15 -0.07 0 -0.26 -0.15 -0.2 1.25
N8 1.54 -0.64 2.15 -0.7 0.46 0.13 0.05 0.39 1.25
N9 0.83 -1.06 2.15 -0.51 -0.32 -0.52 -0.15 0.08 1.25
N10 2.26 -0.64 2.15 -0.83 -0.54 -0.38 -0.1 0.17 1.25
N12 3.51 0.02 2.15 -0.99 0.15 -0.06 -0.05 0.85 1.25
N14 1.47 -0.84 2.15 -1.05 0.21 -0.44 -0.1 0 1.25
N15 1.95 -0.71 2.15 -0.61 -0.36 -0.23 0 0.24 1.25
N15b 1.43 -0.71 2.15 -0.51 0.06 -0.19 -0.05 0.17 1.25
N16 2.85 -0.53 2.15 -0.84 -0.4 -0.3 -0.05 0.58 1.25
N17 2.56 -0.42 2.15 -0.63 -0.13 -0.16 0.09 0.45 1.25
N20 3.46 -0.37 2.15 -0.88 0.34 0.06 0.05 1.04 1.25
N21 3.87 -0.18 2.15 -1.11 0.51 0.24 0.05 1.35 1.25
N22 3.26 -0.32 2.15 -0.94 0.09 -0.05 -0.1 0.95 1.25
N23 3.96 -0.32 2.15 -1.34 0.15 -0.03 -0.15 1.24 1.25
N24 2.82 -0.64 2.15 -0.96 -0.28 -0.19 -0.15 0.58 1.25
N25 2.72 -0.64 2.15 -0.87 -0.36 -0.42 0 0.39 1.25
N25b 4.03 -0.27 2.15 -1.17 0.24 0.12 -0.15 1.49 1.25
N27 2.36 -0.71 2.15 -0.78 -0.36 -0.42 -0.05 0.32 1.25
N28 3.06 -0.58 2.15 -0.82 -0.07 -0.06 0.05 0.7 1.25
N29 3.9 -0.27 2.15 -1.22 0.18 -0.02 -0.15 1.28 1.25
N30 3.51 -0.47 2.15 -1.21 -0.36 -0.4 -0.21 0.9 1.25
N30b 3.92 -0.27 2.15 -1.26 0.29 0.04 -0.1 1.28 1.25
N32 3.72 -0.27 2.15 -0.86 0.57 0.26 0.09 1.28 1.25
174
Appendix 10 continued
Sample Zr Nb Mo Ba La Ce Pb Th U
N34 1.64 -0.91 2.15 -0.79 -0.28 -0.44 -0.21 0 1.25
N35 0.98 -0.91 2.15 -0.88 0.29 -0.32 -0.15 0.08 1.25
N35B 1.1 -0.84 2.15 -0.79 -0.1 -0.4 -0.26 -0.1 1.25
N36 0.38 -1.14 2.15 -0.43 -0.68 -0.65 -0.32 0 1.25
N37 2.24 -0.71 2.15 -0.71 -0.13 -0.21 0 0.32 1.25
N38 1.74 -0.71 2.15 -0.29 -0.21 -0.48 0.18 0.24 1.25
N39 2.74 -0.53 2.15 -0.93 -0.36 -0.34 -0.05 0.24 1.25
N42 2.88 -0.47 2.15 -0.92 -0.54 -0.42 -0.1 0.39 1.25
N43 2.24 -0.98 2.15 -1.14 -0.85 -0.78 -0.21 0.08 1.25
N46 2.89 -0.71 2.15 -1.14 -0.91 -0.52 -0.1 0.52 1.25
N47 1.06 -0.91 2.15 -1.12 -0.28 -0.48 0.18 -0.1 1.25
N48 2.11 -0.58 2.15 -1.48 -0.54 -0.32 -0.21 0 1.25
N50 0.96 -0.98 2.15 -0.35 -0.1 -0.36 -0.15 -0.1 1.25
N50b 1.28 -0.98 2.15 -0.69 -0.32 -0.61 -0.45 -0.3 1.25
N51 1.21 -0.77 2.15 -0.49 0.18 -0.21 -0.21 0 1.25
N53 2.01 -0.84 2.15 -1.05 -0.97 -0.7 -0.38 -0.1 1.25
N54 2.9 -0.71 2.15 -1.39 -0.79 -0.68 -0.45 0.24 1.25
N55 1.79 -0.91 2.15 -1.2 -0.85 -0.78 -0.38 -0.3 1.25
N55b 2.62 -0.77 2.15 -1.88 -0.97 -0.83 -0.51 0 1.25
N56 0.45 -1.32 2.15 -0.3 -0.13 -0.3 -0.21 -0.42 1.25
N57 1.42 -0.98 2.15 0.03 -0.1 -0.23 -0.1 -0.1 1.25
N58 1.18 -1.14 2.15 -1.03 -0.85 -0.73 -0.32 -0.42 1.25
N59 -0.13 -1.14 2.15 -0.71 -0.4 -0.75 -0.51 -0.3 1.25
N60 2.32 -0.71 2.15 -0.07 -0.4 -0.32 0.3 0.24 1.25
N62 2.84 -0.77 2.15 -0.74 -0.74 -0.5 0.14 0.39 1.25
Min -0.13 -1.32 2.15 -1.88 -0.97 -0.83 -0.51 -0.42 1.25
Max 4.03 0.02 2.15 0.04 0.57 0.26 0.82 1.49 1.25
Mean 2.23 -0.7 2.15 -0.83 -0.23 -0.32 -0.1 0.34 1.25
175
Appendix 11 Geochemical partitioning (µg/g) of selected trace elements in soils and
sediments from Anka area, NW Nigeria. Details of samples can be found in Appendix
1 and Figure 8.
Sample Arsenic Chromium
Sample Ex Carb Oxide Sum % Recov Ex Carb Oxide Sum % Recov
A1 0.06 2.14 3.46 5.67 113.33 0.01 0.14 1.04 1.20 3.52
A2 bdl 2.42 2.31 4.72 39.37 0.02 0.06 0.41 0.49 1.17
A4 bdl 2.40 3.37 5.77 115.34 0.02 0.08 1.10 1.21 2.74
A5 bdl 2.31 3.87 6.18 123.51 0.03 0.11 0.77 0.91 1.90
A6 0.04 2.31 3.57 5.92 118.45 bdl 0.40 11.04 11.44 20.80
A7 bdl 2.14 3.28 5.42 108.39 0.03 0.13 2.72 2.88 6.40
A8 bdl 2.11 3.07 5.19 103.75 bdl 0.07 1.05 1.12 2.49
A10 0.07 2.64 3.57 6.28 125.57 0.02 0.05 0.32 0.39 1.08
B1 bdl 3.01 6.70 9.71 194.26 0.02 0.58 11.14 11.74 15.05
B2 bdl 2.98 6.04 9.02 27.34 0.02 0.36 6.73 7.11 7.90
B3 bdl 7.18 11.69 18.87 3.54 0.02 0.53 6.00 6.56 3.73
B4 0.06 3.01 5.44 8.51 9.57 bdl 0.38 4.17 4.55 2.86
B5 bdl 2.41 3.63 6.03 43.09 0.02 0.08 0.73 0.83 0.60
B7 bdl 2.87 3.14 6.01 120.24 0.03 0.21 1.09 1.33 0.75
D1 0.12 2.38 4.51 7.01 140.28 bdl 0.12 1.07 1.19 1.37
D2 bdl 2.08 3.53 5.61 112.23 bdl 0.12 1.57 1.69 1.69
D4 bdl 2.31 2.68 4.99 99.75 0.02 0.05 0.51 0.57 1.69
D5 bdl 2.43 3.85 6.28 125.67 0.02 0.07 0.56 0.66 0.85
D7 bdl 2.49 4.13 6.62 132.39 bdl 0.12 3.58 3.70 8.61
D9 bdl 2.28 2.97 5.25 104.94 0.02 0.10 0.82 0.95 1.90
TD6 0.25 3.96 5.98 10.19 203.83 0.03 0.15 0.35 0.52 1.64
TD10 bdl 2.50 3.31 5.81 58.12 bdl 0.06 0.33 0.38 1.07
TS3 bdl 2.41 3.47 5.87 48.95 0.02 0.05 0.36 0.43 0.63
TS4 bdl 2.68 4.17 6.86 137.13 0.02 0.08 1.03 1.13 1.74
TS5 bdl 2.39 3.27 5.66 43.55 0.03 0.06 0.45 0.54 0.93
Min 0.04 2.08 2.31 4.72 3.54 0.01 0.05 0.32 0.38 0.60
Max 0.25 7.18 11.69 18.87 203.83 0.03 0.58 11.14 11.74 20.80
Mean 0.12 2.81 4.42 7.26 97.13 0.02 0.17 2.23 2.41 3.15
176
Appendix 11 continued
Sample Copper Manganese
Ex Carb Oxide Sum
%
Recov Ex Carb Oxide Sum
%
Recov
A1 2.58 20.63 193.46 216.66 6.02 30.09 30.51 640.45 701.05 35.05
A2 0.14 0.47 0.90 1.50 29.98 11.89 1.97 13.55 27.41 9.14
A4 0.79 33.07 39.95 73.81 14.76 3.87 13.07 146.92 163.86 23.41
A5 0.74 6.51 8.04 15.29 31.20 30.75 10.45 50.11 91.30 18.26
A6 2.28 172.96 175.45 350.69 19.48 39.31 41.63 228.82 309.76 38.72
A7 0.19 11.98 33.89 46.06 11.51 10.11 9.57 265.00 284.68 40.67
A8 0.16 6.59 15.61 22.37 11.18 8.69 6.57 40.10 55.35 9.23
A10 0.26 0.45 0.40 1.11 22.19 4.44 27.62 81.73 113.79 22.76
B1 0.55 167.13 160.19 327.87 11.31 0.97 10.35 85.12 96.44 13.78
B2 0.48 73.30 99.22 173.01 12.36 3.84 19.92 92.94 116.70 19.45
B3 1.06 146.57 120.84 268.46 20.65 6.22 47.73 236.14 290.09 32.23
B4 1.11 10.79 9.41 21.31 12.18 150.74 31.35 63.49 245.58 27.29
B5 0.13 0.38 0.83 1.34 13.35 15.28 6.40 48.96 70.65 5.89
B7 0.48 0.95 1.80 3.22 7.86 3.28 66.21 402.09 471.59 33.68
D1 0.34 6.50 95.46 102.30 22.19 5.89 4.30 353.36 363.55 45.44
D2 0.22 6.13 66.48 72.83 17.55 4.55 5.99 214.23 224.77 20.43
D4 0.06 1.04 4.83 5.93 118.58 3.32 3.31 61.74 68.37 17.09
D5 0.12 0.68 2.75 3.55 16.90 8.27 10.43 78.26 96.95 12.12
D7 0.41 34.06 125.82 160.30 6.97 2.58 14.31 314.84 331.73 41.47
D9 0.08 1.69 4.87 6.63 47.39 8.27 9.62 165.69 183.58 36.72
TD6 0.84 4.47 3.95 9.26 9.26 1.52 73.01 242.89 317.42 35.27
TD10 0.21 0.35 0.36 0.92 18.47 7.07 31.33 54.31 92.70 23.18
TS3 0.09 0.17 0.40 0.66 13.22 6.31 7.84 18.49 32.64 10.88
TS4 0.97 13.11 34.87 48.95 3.26 3.84 27.00 194.41 225.25 37.54
TS5 0.15 0.24 0.44 0.82 16.45 15.60 18.24 38.82 72.66 18.16
Min 0.06 0.17 0.36 0.66 3.26 0.97 1.97 13.55 27.41 5.89
Max 2.58 172.96 193.46 350.69 118.58 150.74 73.01 640.45 701.05 45.44
Mean 0.39 24.33 39.12 63.84 20.64 13.54 21.55 152.63 187.72 25.16
177
Appendix 11 continued
Sample Nickel Lead
Ex Carb Oxide Sum % Recov Ex Carb Oxide Sum % Recov
A1 0.48 0.25 1.64 2.36 3.28 291 941 3418 4649 8
A2 0.35 0.17 0.09 0.60 3.56 22 56 71 150 40
A4 0.32 0.41 0.70 1.43 3.98 47 7666 978 8691 36
A5 0.45 0.29 0.24 0.98 3.65 77 238 323 638 32
A6 0.40 0.70 3.24 4.35 10.87 208 19739 2990 22937 30
A7 0.32 0.34 1.09 1.74 3.35 32 1510 886 2428 24
A8 0.27 0.26 0.32 0.85 5.65 9 937 795 1741 20
A10 0.19 0.40 0.69 1.28 9.83 1 101 51 153 47
B1 0.40 1.01 2.70 4.11 6.14 123 5663 3748 9534 8
B2 0.39 0.86 2.01 3.26 5.44 105 2905 2951 5961 10
B3 0.32 1.66 3.22 5.19 5.76 9 11271 2652 13931 49
B4 1.35 1.36 1.62 4.33 5.70 41 215 203 459 34
B5 0.44 0.35 0.43 1.23 3.41 6 64 78 148 37
B7 0.30 0.93 2.66 3.89 5.64 0 818 217 1035 37
D1 0.33 0.24 0.69 1.25 3.69 108 424 518 1050 28
D2 0.30 0.23 0.57 1.10 3.65 348 4336 752 5436 45
D4 0.30 0.21 0.25 0.76 15.11 4 262 264 530 43
D5 0.23 0.44 1.21 1.88 5.86 2 705 313 1019 39
D7 0.29 0.30 0.90 1.50 4.54 353 17512 2049 19914 52
D9 0.31 0.35 0.77 1.44 7.97 2 366 182 550 64
TD6 0.21 0.48 0.58 1.27 6.07 2 9528 635 10164 65
TD10 0.20 0.34 0.59 1.13 11.31 1 191 60 251 51
TS3 0.23 0.33 0.34 0.89 7.43 1 100 60 161 45
TS4 0.20 0.71 1.51 2.41 6.70 1 13680 1953 15634 32
TS5 0.27 0.46 0.41 1.14 8.79 0 70 59 129 40
Min 0.19 0.17 0.09 0.60 3.28 0 56 51 129 8
Max 1.35 1.66 3.24 5.19 15.11 353 19739 3748 22937 65
Mean 0.34 0.56 1.13 2.03 6.60 57 3533 921 4511 38
178
Appendix 11 continued
Sample Zinc
Ex Carb Oxide Sum
%
Recov
A1 0.91 0.76 3.93 5.60 5
A2 0.68 0.28 0.52 1.48 5
A4 2.89 11.74 13.08 27.71 29
A5 1.00 0.43 1.41 2.84 9
A6 0.56 1.29 2.61 4.45 8
A7 0.66 0.90 1.75 3.31 4
A8 0.42 0.48 0.77 1.68 6
A10 0.47 18.24 28.21 46.92 59
B1 0.64 5.01 8.86 14.51 7
B2 0.48 2.46 5.92 8.87 4
B3 0.39 17.98 37.89 56.26 23
B4 2.30 1.46 4.65 8.40 13
B5 0.99 0.46 1.29 2.74 7
B7 0.39 113.23 151.74 265.36 74
D1 0.69 0.42 1.54 2.65 4
D2 0.74 0.87 2.06 3.67 7
D4 0.41 0.44 0.54 1.39 9
D5 0.33 1.49 2.31 4.13 9
D7 0.51 0.65 1.54 2.70 5
D9 0.40 0.53 0.87 1.79 8
TD6 0.40 98.84 100.86 200.10 51
TD10 0.48 16.57 21.22 38.27 50
TS3 0.69 2.93 3.59 7.22 23
TS4 0.37 31.97 65.56 97.90 32
TS5 1.18 10.05 6.92 18.15 40
Min 0.33 0.28 0.52 1.39 4
Max 2.89 113.23 151.74 265.36 74
Mean 0.65 16.25 22.40 39.30 22
179
Appendix 12 Geochemical partitioning (µg/g) of selected trace elements in soils and
sediments of Birnin-Gwari area, NW Nigeria. Details of samples can be found in
Appendix 1 and Figure 8.
Arsenic Chromium
Ex Carb Oxide Sum %Recov Ex Carb Oxide Sum %Recov
N3 bdl 3.59 3.72 7.32 38.50 0.02 0.16 0.64 0.82 1.44
N5 bdl 3.33 4.47 7.80 51.97 bdl 0.13 0.56 0.69 1.98
N7 bdl 3.23 4.85 8.08 18.79 bdl 0.11 0.37 0.49 0.53
N8 0.07 3.52 4.44 8.03 42.24 bdl 0.13 0.65 0.79 1.14
N10 bdl 3.37 4.78 8.15 47.92 bdl 0.12 0.39 0.51 1.12
N25 bdl 3.46 4.76 8.21 43.23 0.02 0.17 0.52 0.71 1.57
N28 bdl 3.32 4.34 7.65 34.79 bdl 0.11 0.36 0.48 0.83
N37 0.14 3.57 3.81 7.52 31.34 0.03 0.17 0.51 0.72 1.40
N38 bdl 3.32 4.37 7.69 20.25 bdl 0.12 0.35 0.47 0.47
N46 bdl 3.32 4.47 7.79 35.43 bdl 0.11 0.32 0.42 1.08
N47 bdl 3.25 4.34 7.59 8.07 0.01 0.09 0.18 0.28 0.39
N50 bdl 3.19 4.66 7.85 46.15 0.02 0.12 0.54 0.68 1.25
N57 bdl 3.18 4.06 7.24 72.36 bdl 0.10 0.24 0.34 0.70
N59 bdl 3.29 4.19 7.48 46.77 bdl 0.09 0.22 0.30 0.52
Min 0.07 3.18 3.72 6.97 8.07 0.01 0.09 0.18 0.28 0.39
Max 0.14 3.59 4.85 8.58 72.36 0.03 0.17 0.65 0.86 1.98
Mean 0.10 3.35 4.37 7.83 38.42 0.02 0.12 0.42 0.56 1.03
180
Appendix 12 continued
Appendix 12 continued
Sample Nickel Lead
Ex Carb Oxide Sum %Recov Ex Carb Oxide Sum %Recov
N3 0.31 0.27 0.16 0.74 4.62 0.07 0.82 2.85 3.75 12.08
N5 0.31 0.28 0.16 0.74 7.41 Bdl 2.47 7.59 10.06 18.98
N7 0.30 0.17 0.29 0.76 3.98 Bdl 0.96 1.48 2.44 9.03
N8 0.41 0.43 1.07 1.91 6.84 0.05 0.39 4.67 5.12 16.50
N10 0.30 0.32 0.26 0.88 6.29 Bdl 0.52 2.32 2.84 10.14
N25 0.21 0.35 0.19 0.75 5.77 Bdl 1.69 2.85 4.54 15.13
N28 0.23 0.34 0.36 0.92 6.14 Bdl 0.70 2.58 3.29 10.60
N37 0.33 0.23 0.36 0.93 5.14 Bdl 0.61 4.00 4.61 15.35
N38 0.26 0.23 0.24 0.74 3.36 Bdl 2.96 3.45 6.41 18.84
N46 0.25 0.27 0.06 0.58 5.80 Bdl 0.72 1.89 2.61 9.33
N47 0.25 0.32 0.13 0.70 5.81 Bdl 0.32 1.57 1.89 5.57
N50 0.21 0.39 1.42 2.02 7.22 Bdl 0.20 2.38 2.58 9.55
N57 0.18 0.21 0.77 1.17 6.14 Bdl 0.35 2.06 2.42 8.63
N59 0.21 0.22 1.06 1.50 5.16 Bdl 0.23 2.31 2.54 12.10
Min 0.18 0.17 0.06 0.42 3.36 0.05 0.20 1.48 1.73 5.57
Max 0.41 0.43 1.42 2.26 7.41 0.07 2.96 7.59 10.62 18.98
Mean 0.27 0.29 0.47 1.02 5.69 0.06 0.92 3.00 3.99 12.27
Sample Copper Manganese
Ex Carb Oxide Sum %Recov Ex Carb Oxide Sum %Recov
N3 0.04 0.34 0.25 0.63 12.60 39.45 25.98 251.49 316.92
1.69
N5 0.03 0.20 0.15 0.38 7.60 108.21 33.06 277.27 418.54 46.50
N7 0.04 0.63 0.85 1.53 30.68 5.04 4.32 64.96 74.32 24.77
N8 0.04 0.55 1.21 1.80 10.00 313.49 65.70 133.59 512.78 15.54
N10 0.03 0.22 0.38 0.63 12.68 35.16 19.34 201.32 255.82 31.98
N25 0.03 0.37 0.43 0.83 16.54 1.26 18.91 171.26 191.43 27.35
N28 0.04 0.15 0.17 0.36 7.15 33.99 25.45 199.56 258.99 28.78
N37 0.04 0.54 0.88 1.46 29.22 27.86 11.04 643.54 682.44 45.50
N38 0.04 0.52 0.40 0.95 7.33 23.92 13.81 241.46 279.19 34.90
N46 0.03 0.19 0.27 0.49 9.76 9.45 7.87 58.08 75.39 15.08
N47 0.04 0.12 0.12 0.28 5.52 8.23 9.52 36.10 53.85 7.69
N50 0.04 0.16 0.30 0.49 9.89 46.95 98.26 209.94 355.15 7.72
N57 0.04 0.11 0.14 0.29 5.73 36.43 94.59 171.66 302.68 7.76
N59 0.03 0.13 0.27 0.43 1.50 18.28 32.74 161.39 212.41 6.25
Min 0.03 0.11 0.12 0.26 1.50 1.26 4.32 36.10 53.85 6.25
Max 0.04 0.63 1.21 1.89 30.68 313.49 98.26 643.54 682.44 46.50
Mean 0.04 0.30 0.42 0.75 11.87 50.55 32.90 201.54 284.99 23.68
181
Appendix 12 continued
Sample Zinc
Ex Carb Oxide Sum %Recov
N3 0.65 1.83 0.97 3.45 12.33
N5 0.65 1.20 1.27 3.13 10.79
N7 0.65 1.08 1.05 2.78 9.25
N8 0.43 0.94 1.31 2.68 7.05
N10 0.40 1.02 0.82 2.25 9.38
N25 0.23 1.08 0.84 2.15 9.34
N28 0.51 1.54 1.65 3.70 12.32
N37 0.84 0.76 1.14 2.73 9.43
N38 0.74 1.39 1.85 3.98 11.06
N46 0.41 0.69 0.71 1.82 9.08
N47 0.43 0.89 0.97 2.30 4.59
N50 0.29 1.31 3.81 5.41 10.40
N57 0.32 1.05 2.82 4.19 9.75
N59 0.46 1.24 3.44 5.14 6.67
Min 0.23 0.69 0.71 1.63 4.59
Max 0.84 1.83 3.81 6.47 12.33
Mean 0.50 1.15 1.62 3.26 9.39
182
Appendix 13 Bioaccessible concentration of selected trace elements in soils and
sediments of Anka area, NW Nigeria. Details of samples can be found in Appendix 1
and Figure 8.
Sample As Cr Cu Mn Ni Pb Zn
A1 1.5 1.1 93.6 185.1 0.8 17702 7.3
A2 0.9 0.1 1.4 24.6 0.2 247 1.0
A4 1.4 1.2 105.2 80.3 4.0 14007 41.1
A5 1.3 0.4 20.5 96.3 0.7 1226 2.4
A6 1.4 8.3 352.4 261.8 2.6 26948 5.4
A7 1.5 3.9 95.2 118.2 1.0 10239 3.9
A8 1.2 0.7 30.0 46.4 0.8 5612 2.7
A10 1.1 0.3 3.5 96.3 0.8 223 46.7
B1 4.9 8.7 384.6 59.7 3.1 41740 18.7
B2 3.8 3.9 240.7 91.5 2.4 35470 10.4
B3 14.1 4.3 373.4 251.3 5.3 16173 61.9
B4 3.6 1.6 41.2 248.2 4.1 697 7.0
B5 1.1 0.3 3.2 48.9 0.8 238 2.4
B7 2.3 1.2 8.1 254.5 2.7 1574 208.3
D1 1.3 1.2 27.3 27.0 0.4 1869 1.5
D2 1.4 2.3 57.4 35.0 0.5 8978 5.2
D4 0.9 0.3 4.6 20.2 0.2 853 0.8
D5 1.7 0.5 5.9 59.9 0.7 1705 4.0
D7 1.3 7.4 159.1 77.2 0.6 23662 3.7
D9 1.0 0.4 4.8 52.0 0.5 566 1.0
TS3 1.1 0.2 2.1 29.6 0.6 249 7.0
TS4 3.7 5.3 113.0 159.0 1.8 20464 126.7
TS5 1.2 0.3 2.3 74.1 0.6 198 19.4
TD6 5.3 0.7 43.6 335.9 1.7 12312 295.2
TD10 1.3 0.3 4.0 83.6 1.0 343 40.4
Min 0.9 0.1 1.4 20.2 0.2 198 0.8
Max 14.1 8.7 384.6 335.9 5.3 41740 295.2
Mean 2.4 2.2 87.1 112.7 1.5 9732 37.0
SD 2.7 2.7 121.8 90.6 1.4 12058 71.6
183
Appendix 14 Effect of pH on the in vitro bioaccessibility of selected trace elements in
soils and sediments of Anka area, NW Nigeria. Details of samples can be found in
Appendix 1 and Figure 8.
Sample As Cr Ni
pH1.5 pH2.2 pH2.9 pH1.5 pH2.2 pH2.9 pH1.5 pH2.2 pH2.9
A1 1.46 1.61 1.15 1.09 0.50 0.15 0.80 0.45 0.42
A2 0.90 1.24 1.21 0.14 0.09 0.06 0.18 0.17 0.15
A4 1.41 1.62 13.85 1.24 0.42 1.26 3.98 0.60 4.41
A5 1.28 1.38 1.38 0.44 0.19 0.10 0.70 0.59 0.55
A6 1.35 1.64 12.07 8.31 3.23 5.20 2.65 1.52 10.51
A8 1.22 1.73 1.15 0.65 0.27 0.08 0.76 0.26 0.21
A10 1.06 1.36 1.34 0.25 0.13 0.08 0.79 0.63 0.49
B1 4.86 2.49 15.53 8.70 2.62 6.02 3.15 2.01 13.13
B2 3.81 2.35 13.62 3.88 1.25 2.80 2.37 1.63 11.98
B3 14.08 9.04 4.56 4.33 1.50 3.63 5.27 3.22 22.58
B4 3.63 2.73 2.53 1.59 0.56 0.22 4.12 3.61 3.04
B5 1.09 1.51 1.38 0.26 0.13 0.08 0.83 0.66 0.55
B7 2.31 1.92 1.95 1.17 0.54 0.34 2.75 1.90 1.43
D2 1.42 1.74 15.85 2.34 0.61 1.63 0.50 0.27 1.62
D4 0.90 1.32 1.42 0.33 0.13 0.08 0.17 0.10 0.10
D7 1.32 1.70 15.18 7.37 0.77 1.56 0.64 0.27 2.23
TS3 1.12 1.47 1.40 0.19 0.07 0.07 0.57 0.36 0.37
TS4 3.75 1.96 18.01 5.35 0.34 1.43 1.82 1.04 7.69
TS5 1.24 1.43 1.34 0.26 0.10 0.09 0.61 0.39 0.44
TD10 1.29 1.37 1.46 0.28 0.10 0.09 0.98 0.51 0.56
Cu
Mn
Zn
pH1.5 pH2.2 pH2.9 pH1.5 pH2.2 pH2.9 pH1.5 pH2.2 pH2.9
A1 93.57 66.21 41.47 185.07 155.31 108.88 7.29 1.81 1.06
A2 1.45 1.06 0.96 24.65 22.26 22.68 1.00 0.83 0.35
A4 105.21 79.55 69.88 80.27 63.70 418.25 41.08 32.34 193.69
A5 20.50 15.96 14.28 96.31 77.44 71.91 2.40 1.89 1.13
A6 352.36 279.34 236.40 261.79 211.15 1328.80 5.40 3.26 16.59
A8 30.02 19.80 12.70 46.44 39.18 27.54 2.68 1.12 0.42
A10 3.52 2.18 1.70 96.27 78.46 68.30 46.72 39.57 31.06
B1 384.56 276.33 213.83 59.69 51.94 244.06 18.65 14.83 71.67
B2 240.74 152.44 110.77 91.47 84.50 450.47 10.41 6.76 33.68
B3 373.38 288.31 249.27 251.27 207.78 125.41 61.87 50.50 259.83
B4 41.18 33.18 29.67 248.17 219.75 195.58 6.99 5.19 3.59
B5 3.23 2.15 1.79 48.90 39.19 34.96 2.38 1.66 1.04
B7 8.07 4.90 4.53 254.51 175.56 138.27 208.30 167.02
D2 57.44 25.03 16.48 35.00 28.78 176.51 5.20 3.07 14.43
D4 4.60 2.86 2.17 20.23 13.24 12.67 0.76 0.43 0.20
D7 159.07 103.06 83.65 77.25 63.26 294.03 3.71 1.60 8.16
TS3 2.11 1.10 0.98 29.62 21.70 23.43 6.98 4.40 4.10
TS4 113.01 54.16 49.16 159.03 126.05 669.45 126.74 104.51 538.09
TS5 2.27 1.44 1.27 74.07 51.86 58.41 19.43 12.77 13.47
TD10 3.96 2.04 1.90 83.59 53.46 61.45 40.43 24.21 25.44
184
Appendix 14 continued
Sample Pb
pH1.5 pH2.2 pH2.9
A1 17702.00 5060 1410
A2 246.89 145.42 70
A4 14007.33 8439 7306
A5 1226.10 638.91 301
A6 26948.00 22450 19078
A8 5611.97 2690 983
A10 222.63 130.60 71
B1 41740.00 64408 50872
B2 35469.67 33704 25023
B3 16173.33 13832 9136
B4 696.50 384.44 212
B5 237.60 137.41 69
B7 1573.67 783.72 584
D2 8977.57 5442 4350
D4 853.26 403.07 255
D7 23662.00 20870 16512
TS3 249.31 106.49 74
TS4 20464.00 16236 12963
TS5 197.51 79.20 53
TD10 342.70 156.18 121
185
Appendix 15 Effect of the time of extraction on the in vitro bioaccessibility of selected
trace elements in soils and sediments of Anka area, NW Nigeria. Details of samples
can be found in Appendix 1 and Figure 8.
Sample As
Cr
Cu
1hr 2hrs 17hrs 1hr 2hrs 17hrs 1hr 2hrs 17hrs
A2 1.55 1.58 1.52 0.13 0.17 1.52 1.48 1.66 2.11
A5 1.7 1.62 1.76 0.38 0.51 1.76 21.1 22.5 24.6
A8 1.58 1.55 1.69 0.6 0.81 1.69 22.2 25.4 31.1
B4 3.72 3.97 3.79 1.3 1.94 3.79 44 46.7 49.9
B5 1.62 1.7 1.47 0.22 0.31 1.47 3.24 3.54 3.79
B7 2.8 2.73 2.4 1.15 1.43 2.4 9.42 10.3 11
D4 1.28 1.76 1.62 0.37 0.42 1.62 4.85 5.6 7.46
TS3 1.72 1.79 1.68 0.2 0.25 1.68 2.5 2.64 2.74
TS5 1.85 1.85 1.7 0.27 0.33 1.7 2.58 2.73 2.83
TD10 1.72 1.93 1.51 0.27 0.34 1.51 3.98 4.25 4.34
Mn Pb
1hr 2hrs 17hrs 1hr 2hrs 17hrs
A2 24.9 26.4 32.8 233 237 241
A5 91.1 112 134 1108 1142 1146
A8 40.7 52.9 71.1 6374 7542 7722
B4 247 347 387 619 655 675
B5 47.5 62 93.1 218 225 230
B7 251 405 593.02 1449 1503 1510
D4 20.2 28 46.7 811 809 810
TS3 31.4 35.2 41.2 237 237 241
TS5 77.6 87 104 201 203 207
TD10 86.3 94.6 116 328 326 329
Ni Zn
1hr 2hrs 17hrs 1hr 2hrs 17hrs
A2 0.19 0.17 0.27 0.86 0.77 0.7
A5 0.67 0.76 0.84 2.06 2.24 2.59
A8 0.34 0.41 0.53 0.98 0.92 1
B4 3.9 4.19 4.61 6.11 6.83 8.05
B5 0.77 0.87 1 1.87 2.02 2.37
B7 2.72 3.23 4.13 - - -
D4 0.16 0.22 0.31 0.73 0.63 0.64
TS3 0.69 0.73 0.85 6.78 7.07 7.69
TS5 0.6 0.66 0.76 19.2 19.4 20.1
TD10 0.94 1.06 1.18 39.9 41.3 44.5
186
Appendix 16 Effect of the ratio of solid sample mass to extraction fluid volume on the
in vitro bioaccessibility of selected trace elements in soils and sediments of Anka area,
NW Nigeria. Details of samples can be found in Appendix 1 and Figure 8.
Sample As Cr
1g/25mL 0.5g/50mL 1g/50mL 1g/25mL 0.5g/50mL 1g/50mL
A2 0.67 2.75 0.90 0.10 0.16 0.14
A10 0.81 2.60 1.06 0.19 0.28 0.25
B4 2.60 5.59 3.63 1.39 1.49 1.59
B5 0.94 2.92 1.09 0.21 0.28 0.26
B7 1.59 3.36 2.31 1.26 1.12 1.17
D2 1.05 2.73 1.42 1.82 2.05 2.34
D4 0.74 2.65 0.90 0.26 0.37 0.33
TS3 0.80 2.73 1.12 0.15 0.18 0.19
TS5 1.03 2.72 1.24 0.23 0.27 0.26
TD10 1.00 2.73 1.29 0.24 0.27 0.28
Cu Pb
1g/25mL 0.5g/50mL 1g/50mL 1g/25mL 0.5g/50mL 1g/50mL
A2 1.53 1.61 1.45 218.07 211.69 246.9
A10 3.55 4.20 3.52 180.66 177.45 222.6
B4 54.11 47.25 41.18 578.73 580.38 696.5
B5 3.47 3.97 3.23 196.69 188.51 237.6
B7 14.61 9.98 8.07 3018.70 1349.70 1574
D2 55.08 45.61 57.44 9124.30 9333.60 8978
D4 5.28 5.17 4.6 686.32 672.84 853.3
TS3 2.18 2.50 2.11 202.23 208.05 249.3
TS5 2.35 2.71 2.27 160.14 160.51 197.5
TD10 4.07 4.94 3.96 275.79 262.70 342.7
Mn Ni
1g/25mL 0.5g/50mL 1g/50mL 1g/25mL 0.5g/50mL 1g/50mL
A2 23.11 23.05 24.65 0.19 0.11 0.18
A10 85.87 87.98 96.27 0.66 0.61 0.79
B4 311.77 227.32 248.17 3.68 3.55 4.12
B5 47.34 43.25 48.90 0.76 0.68 0.83
B7 316.01 227.09 254.51 2.18 2.30 2.75
D2 28.30 26.08 35.00 0.29 0.21 0.50
D4 18.94 17.59 20.23 0.15 bdl 0.17
TS3 28.34 24.85 29.62 0.48 0.40 0.57
TS5 69.43 65.24 74.07 0.53 0.43 0.61
TD10 76.54 72.60 83.59 0.80 0.77 0.98