19
LG/14/6 14th Meeting of the London Group on Environmental Accounting Canberra, 27 – 30 April 2009 Environmental Goods and Services Sector Julie Hass, Anda Marina Georgescu, Mats Eberhardson

LG/14/6
14th Meeting of the London Group on Environmental Accounting Canberra, 27 – 30 April 2009
Environmental Goods and Services Sector
Julie Hass, Anda Marina Georgescu, Mats Eberhardson

20/04/2009 1/18
EUROPEAN COMMISSION
EUROSTAT
Directorate E: Agriculture and environment statistics;
Statistical cooperation
Unit E3: Environmental statistics and accounts
Revision of SEEA 2003: Environmental Goods and Services Sector: Document to the London Group meeting in Canberra, April 2009, following the meeting in Brussels, October 2008
Version 2(corrections to section 2.4)
Authors : Julie Hass, Eurostat: [email protected] Anda Marina Georgescu, Eurostat: [email protected] Mats Eberhardson, Statistics Sweden : [email protected]
The paper is based on the Doc. ENV/EXP/WG/07(2009) and ENV/EXP/WG/07.b(2009) presented at the Working Group “Environmental Expenditure Statistics” Joint Eurostat/EFTA group meeting of 25 March 2009 in Luxembourg. The mentioned documents were prepared by ICEDD with the help of the Task Force on Environmental Goods and Services.
20/04/2009 2/18
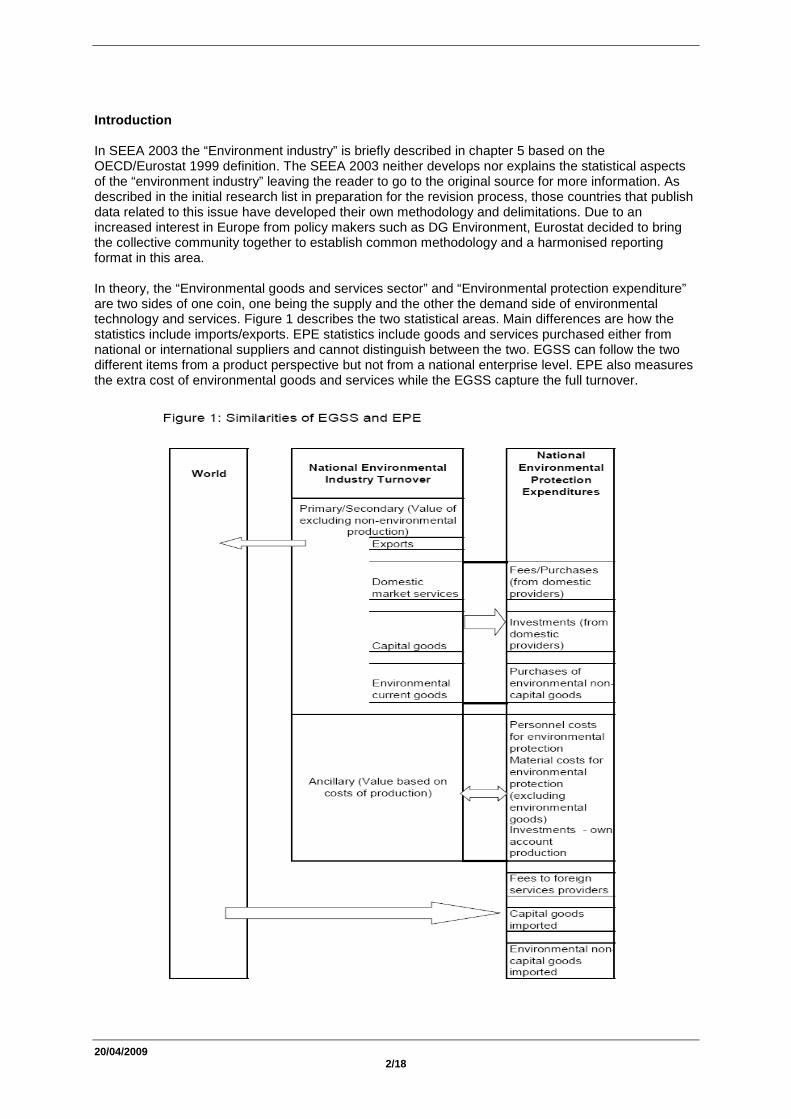
Introduction In SEEA 2003 the “Environment industry” is briefly described in chapter 5 based on the OECD/Eurostat 1999 definition. The SEEA 2003 neither develops nor explains the statistical aspects of the “environment industry” leaving the reader to go to the original source for more information. As described in the initial research list in preparation for the revision process, those countries that publish data related to this issue have developed their own methodology and delimitations. Due to an increased interest in Europe from policy makers such as DG Environment, Eurostat decided to bring the collective community together to establish common methodology and a harmonised reporting format in this area. In theory, the “Environmental goods and services sector” and “Environmental protection expenditure” are two sides of one coin, one being the supply and the other the demand side of environmental technology and services. Figure 1 describes the two statistical areas. Main differences are how the statistics include imports/exports. EPE statistics include goods and services purchased either from national or international suppliers and cannot distinguish between the two. EGSS can follow the two different items from a product perspective but not from a national enterprise level. EPE also measures the extra cost of environmental goods and services while the EGSS capture the full turnover.

20/04/2009 3/18
PART I. History and limits of the handbook...................................................................................................... 4
1. Background ...................................................................................................................................................... 4
2. Limits of the handbook..................................................................................................................................... 7
2.1. Technologies goods and services nomenclature......................................................................................... 7
2.2. Collecting data on integrated technologies and adapted goods ................................................................. 8 2.2.1. The boundaries of adapted goods ......................................................................................................8 2.2.2. Data reporting for adapted goods......................................................................................................9
2.3. CReMA 2008, in particular activities in management of forest resources and management of wild flora and fauna.......................................................................................................................................................... 10
2.4. Estimation of variables using existing statistics, for example the production of energy from renewable sources as an ancillary activity ........................................................................................................................ 10
PART II. Contextual information for EGSS .................................................................................................... 11
3. Standard tables on EGSS statistics................................................................................................................ 11
4. Presentation and interpretation of data ........................................................................................................ 16

20/04/2009 4/18
PART I. History and limits of the handbook
1. Background
In order to respond to current policy interests in Europe and help to implement future policy measures directed towards the environmental goods and services sector, there is a need to produce and compile comparable statistics between countries. For this reason, Eurostat re-started work in May 2005 to develop a new collection of data for the Environmental Goods and Services Sector (referred to in this document as environmental sector or EGSS). It was agreed that the manual "The environmental goods & services industry – manual for data collection and analysis" produced in 1999 by OECD/Eurostat was to be used as starting point.
Several countries in Europe have already produced statistics on EGSS using as a reference for their work the OECD/Eurostat manual. They have all developed their own procedures to overcome the difficulties experienced in interpreting the manual.
In order to have a data collection both harmonised and comparable, Eurostat decided to develop standard tables (ST) for the collection of statistics on EGSS and a more detailed and updated handbook explaining how to handle the data compilation and how to fill in the tables.
The standard tables essentially aim at identifying some important variables (e.g., employment, turnover, value added and exports) by different actors and activities of the EGSS.
The handbook provides methods to develop new data collection systems on EGSS at national level. It contains definitions, examples and recommendations to ensure that data are compiled and maintained on a consistent basis.
A task force consisting of statisticians from National statistical offices was set up in 2006 to cooperate with the consultant (ICEDD) and Eurostat in order to produce the handbook and the standard tables.
Its mandate was to work on definitions, delimitations and methodological issues for the collection and interpretation of EGSS statistics. Participant countries to the task force were Austria, Finland, France, Germany, the Netherlands, Hungary, Italy, Norway, Spain, Sweden, United Kingdom and Canada.
A consulting group of users was also set up to help the Task Force identify user needs. Participants of the consulting group came from DG Environment, DG Enterprise and Eurostat.
From the user perspective, DG Environment expressed an interest in particular for the domain of cleaner technologies and products. Since they believe end-of-pipe equipment is an approach being phased out, it is important to follow the development of integrated technologies. The innovation potential of EGSS is also of great interest. In addition, the Environmental Technologies Action Plan (ETAP) will be in need of indicators to follow up their actions. The possibility of comparison with other important economies (USA, China, etc) has been also underlined by DG Enterprise.
The proposals from the consulting group have been taken under serious consideration. Nevertheless their requests suffer from a problem of practicality, i.e. feasibility and possibility of producing the desired statistics and indicators. For this reason, during the elaboration of the standard tables and the handbook, the task force has focused on determining the practicality of developing the EGSS statistics.
The final version of the handbook and ST were presented to the Working Group on Environmental Expenditure Statistics on 25 March 2009. All the documents are available on Circa.

20/04/2009 5/18
The Working Group on Environmental Expenditure Statistics approved the final version of the handbook presented at the meeting and the corresponding standard tables. The standard tables in their current version represent the whole picture of the environmental goods and services sector. Also the manual gives the guidance as regards to filling in these tables. The tables were designed based on the Task Force members’ experience in the field and on existing manuals.
A pilot data collection will be launched before a regular collection procedure will start. The working group recommended that the standard tables be sent to countries to identify which areas can be filled in and then suggested that Eurostat either colour the areas where countries should focus their efforts initially (as is done in the OECD/Eurostat Joint Questionnaire for Environmental Protection and Revenues (EPER)) or reduce the reporting tables to those areas that countries can report.
The handbook and the related standard tables are expected to be published by summer 2009.
The handbook on EGSS statistics The handbook on EGSS explains the scope and the reasoning behind the terms of the standard tables. It also provides extra information necessary to allow a consistent collection and interpretation of the data to be reported by countries.
The handbook has its roots in the experience acquired during the work done on the EGSS by members of the task force.
To a large degree the handbook follows the principles of the OECD/Eurostat 1999 Manual because it is intended to represent the reference handbook used by national statistics offices to carry out studies on EGSS. At the same time it is intended to be a further development of the OECD/Eurostat 1999 Manual.
The handbook provides an analysis of the concepts related to the EGSS, supplemented by a definition and a classification of the sector, practical hands-on and methodological guidance for data collection.
It also recommends methods and approaches for analysis. A great deal of effort has been put in increasing coherency and providing users of the handbook with practical recommendations. Full implementation of these recommendations should help to ensure that data are compiled and maintained on a consistent basis in all Member States of the European Statistical System (ESS).
It is not possible to offer a standard compilation method that can be applied to the circumstances of all countries without adaptation. There are two main reasons this cannot be done: the EGSS does not follow standard industries classifications of products and services (HS/PRODCOM etc) or industries (ISIC/NACE) and there are various approaches used by countries to identify the populations to be included. The countries working on these statistics have developed their own country-specific compilation procedures typically tailored towards policy demand and data availability at national level. This approach means that the statistics are often not comparable between countries.
Some patterns of best practices have emerged from experience so far but the focus can differ across countries. Thus, the handbook outlines the various options that may be available for the collection of data on the EGSS.
The handbook is designed for improvement of existing data collection systems and/or development of new ones. It has been designed so that it can be consulted on a chapter-by-chapter basis if required.
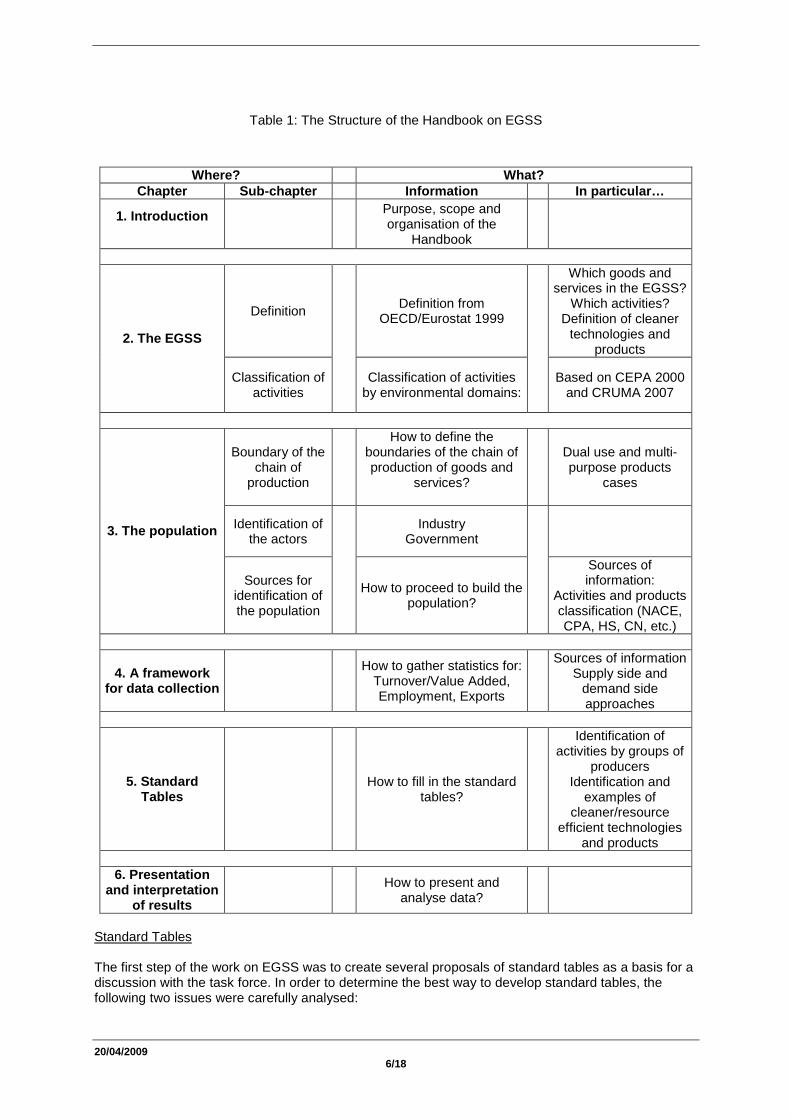
For this reason, each chapter must be capable of being read separately, whilst still forming part of a coherent set. The following table gives a brief overview of the contents of the handbook.
20/04/2009 6/18
Table 1: The Structure of the Handbook on EGSS
Where? What? Chapter Sub-chapter Information In particular…
1. Introduction
Purpose, scope and organisation of the
Handbook
Definition Definition from
OECD/Eurostat 1999
Which goods and services in the EGSS?
Which activities? Definition of cleaner
technologies and products
2. The EGSS
Classification of activities
Classification of activities by environmental domains:
Based on CEPA 2000 and CRUMA 2007
Boundary of the chain of
production
How to define the boundaries of the chain of production of goods and
services?
Dual use and multi-purpose products
cases
Identification of the actors
Industry Government 3. The population
Sources for identification of the population
How to proceed to build the
population?
Sources of information:
Activities and products classification (NACE, CPA, HS, CN, etc.)
4. A framework for data collection
How to gather statistics for: Turnover/Value Added, Employment, Exports
Sources of information Supply side and
demand side approaches
5. Standard Tables
How to fill in the standard tables?
Identification of activities by groups of
producers Identification and
examples of cleaner/resource
efficient technologies and products
6. Presentation
and interpretation of results
How to present and
analyse data?
Standard Tables
The first step of the work on EGSS was to create several proposals of standard tables as a basis for a discussion with the task force. In order to determine the best way to develop standard tables, the following two issues were carefully analysed:
20/04/2009 7/18
- Current and future objectives and policy needs and uses concerning EGSS;
- Inventory of countries which already produce these data and the comparison between countries’ data and methodologies.
The general principle behind the elaboration of standard tables was the wish to take into account all sectors and activities related to environmental issues, leaving the countries the freedom to decide what is feasible.
Several proposals of standard tables were discussed. In the tables, economic activities were classified by NACE (ISIC) codes and the environmental activities were split using a modified version of the classification of the environmental activities proposed by the OECD/Eurostat 1999 Manual. The one area that required substantial further development related to resource use and management (such as energy use) which is excluded from the definition of “environmental protection activities” but needed to be included in the EGSS in a systematic way. In addition areas such as reduction in material use also needed a more systematic way of inclusion. This has led to the further development of a classification of resource use and management – portions of which are used in the EGSS standard tables.
2. Limits of the handbook The EGSS Handbook is a major step forward towards a better collection of data on the environmental industry. However there are still a number of issues which will require further efforts. The following summarises the main limitations of the EGSS Handbook as it has been accepted by the Eurostat WG on Environmental Accounts in March 2009. Difficulties come from the inclusion in the scope of the Handbook of resource management activities (definitions for Environmental Protection are well established, but for Resource Management it is difficult to classify variables in environmental services, adapted goods, connected goods, integrated technologies and end of pipe technologies), as well as “cleaner” goods and technologies (both issues were left unsolved by the OECD Eurostat 1999 Environmental Industry Manual).
- Technologies goods and services nomenclature, for example the distinction between environmental goods and services and environmental technologies.
- CReMA 2008, in particular activities in management of forest resources and management of wild flora and fauna.
- Estimation of variables using existing statistics, for example the production of renewable energy as an ancillary activity
- Collecting data on integrated technologies and adapted goods
2.1. Technologies goods and services nomenclature The definition of the EGSS system boundaries includes specific services, connected products (goods and services) and adapted goods. These definitions are well established in the framework of environmental accounts. Nevertheless from a practical point of view, guidelines for the collection of data on these products have not been implemented (e.g. the SERIEE states that list of connected and adapted goods should be established but this has not been the case yet). In the case of the EGSS it has been decided to rely on these definitions in order to (1) rely on a well established framework and (2) be able to compare data from other parts of environmental accounts which are based on those definitions.
In practice some problems arise for the identification of EGSS products and technologies. For example: What is a connected service? Where to draw the line between connected and environmental specific services?

20/04/2009 8/18
Furthermore the EGSS Handbook adds to environmental goods and services a third category (environmental technologies) which overlaps the first two so the categories are not exclusive.
Environmental technologies (both end of pipe and integrated technologies) include many different things. The starting point used in the Handbook is the definition of the OECD/Eurostat 1999 manual which includes methods, practices and knowledge to transform resources into output.
For the scope of EGSS handbook it has been decided to proxy this knowledge by the production of equipment and facilities for the environment. The problem is that these producers are providers of services and producers of goods: which means that the technology group can overlaps with the services and goods category. It can be said that technology should be a subset of goods and services: this should include the provider of new methods of production which are environmental services (producers of methods who hold and sell e.g. the patents of the end-of-pipe or integrated technologies), the activities which put together components for building up environmental goods (i.e. the building of facilities for EP or for RM such as renewable energy production; the service of designing and assembling end-of-pipe or integrated technologies).
In order to reduce the possibility of overlapping between the three categories of environmental output (goods, services and technologies) the handbook offers a number of examples for illustrating the products to be included in the technology group.
2.2. Collecting data on integrated technologies and adapted goods
Two main issues regarding adapted goods and integrated technologies will need to be further investigated:
- The boundaries of adapted goods and adapted technologies: which are adapted goods and integrated technologies? How to distinguish them in practice?
- Data reporting for adapted goods: the inclusion of total figures for some adapted goods (e.g. recycled materials) could be “problematic” since it could easily overwhelm the rest of the sector.
The SERIEE framework and definitions have been used in the Handbook for solving these problems. Though, since no collection of data focused on adapted goods and integrated technology has been made yet, further effort should be placed on it.
2.2.1. The boundaries of adapted goods It should be noted that adapted goods differ from specific services as well as connected products due to the fact that while the latter have no use except for environmental protection or resource management, the former do not have environmental protection or resource management as their primary purpose. According to SERIEE, goods (durable or non-durable) have to be considered as “adapted” if, on the basis of their technical nature, comply with the following criteria:
- are less polluting at the time of their consumption and/or scrapping, than equivalent normal products (Environmental Protection adapted goods)
- have less content of natural resource inputs in the production stage and/or in the use stage (Resource Management adapted goods).
Adapted goods are not produced for satisfying a primary environmental purpose but their technical characteristics make them less pollutant or less resource-consuming.
The definition of adapted goods is based on technical characteristics of goods. According to this definition there may be often the case that adapted products are used as intermediate consumption and are incorporated in other (thereby also adapted) products (SERIEE § 2031). For example recycled row paper and books printed on recycled paper are to be considered both adapted goods. Another

20/04/2009 9/18
example is the use of CFC-free foams for refrigerators. In this case either the CFC-free foams (for that part incorporated in the refrigerators) and the refrigerators are adapted goods1.
2.2.2. Data reporting for adapted goods 2 As it has been stressed above, adapted goods differ from specific services as well as connected products due to the fact that while the later have no use except for environmental protection or resource management, the former do not have environmental protection or resource management as their primary purpose. Due to such peculiarity of adapted goods, SERIEE recommends not including in statistics the total amount of economic aggregates related to adapted goods, but only the part related to the characteristics of the products less harmful for the environment. As a matter of fact only the “environmental share” of adapted goods complies with environmental purposes, while the remaining part of these products relate to purposes other than environmental. To include in environmental statistics and accounts the total amount of aggregates related to adapted products would certainly lead to an overestimation of the size of the environmental market.
Generally, adapted goods are more costly than equivalent “normal” products. The SERIEE recommends calculating the “environmental share” of adapted goods by calculating the extra costs due to the adaptation of the good to environmental purposes3.
Adapted goods may exist – now or more likely in the future – which are not more expensive than normal equivalent products or normal products may disappear making it impossible to have an equivalent normal product to which a comparison can be made. In these cases to assess the environmental share of adapted goods would require going beyond the extra cost criterion and would require, e.g., technical knowledge, the consultation of experts, etc.
For the purpose of producing statistics on EGSS, the “environmental share” of adapted goods should be calculated. This would be correct from the point of view of the definition of the sector. The problem of having overwhelming figures of adapted goods hiding the rest of the sector would be solved at the source.
Since a priority of our work is to ensure a well timed production of quality statistics on the EGSS, if it is impossible to asses the “environmental share” by means of the extra cost or other methods, the total figures should be included. In this case, in order to ensure comparability and a proper interpretation of data, the compiler of EGSS statistics is recommended to clearly explain that the total figures for adapted goods (and not just the environmental share) are accounted for and to exclude such figures if possible – in the standard tables – from the total size of the EGSS since the figures would clearly overestimate the adaptation of these goods for environmental purpose, which is the only part to be included in the EGSS sector.
In practice the EGSS Handbook recommends a list of adapted goods to be established by collecting these from countries in order to ensure consistency and comparability between countries. A reporting row should perhaps be added to the standard tables showing the “environmental share” of these products clarifying how countries have dealt with this problem. If it is not possible, only the total would be filled in (and in this case particular attention should be paid in presenting the figures).
1 Such cases can lead to double counting. In order to avoid double counting the intermediate consumption of adapted goods by producers of other adapted goods should be quantified and deducted, as it is always done in the SERIEE accounts in the case of specialised producers of specific services which in turn purchase specific services as intermediate consumption. For adapted products SERIEE(pg. 91) also suggests that “when such double counting is expected to be important it is necessary to make an assessment of the technical relations and to decide at which stage of the manufacturing process extra cost should be measured”. 2 The following arguments can be applied to the case of integrated technologies, ceteris paribus. 3 To assess extra cost, adapted and equivalent normal products should be compared at the level of their cost of production excluding any taxes on products and excluding any subsidies on products or on production, i.e. prior to subsidies to producers or fiscal incentive measures for consumers.

20/04/2009 10/18
In this way:
- The consistency with the SNA, SEEA and SERIEE framework would be assured.
- If the calculation of “environmental share” is possible, there should not be any more problems in summing up figures of adapted goods to the rest of the sector because the definition of the sector itself includes this part of the adapted goods.
- If the calculation of “environmental share” is not possible, everything should be as it is in the handbook: compilers and users should be aware they are overestimating the sector and thus adapted goods figures should not be added to the rest of the sector.
2.3. CReMA 2008, in particular activities in manage ment of forest resources and management of wild flora and fauna The CReMA 2008 is a brand new classification for resource management activities. This classification derives from and it is fully compatible with the CRUMA which is being proposed to be an international standard classification.
Nevertheless, the CReMA presents some limits which come in particular from the level of detail of its classes. In particular, the activities which should go into each class are not always very well established. This is the case for example of the management of forest resources and the management of wild flora and fauna.
This classification includes 7 classes as follows:
10: Management of waters
11: Management of forest resources
11 A: Management of non-cultivated forest areas
11 B: Minimisation of the intake of forest resources
12: Management of wild flora and fauna
13: Management of energy resources
13 A: Production of energy from renewable sources
13 B: Heat/Energy saving and management
13 C: Minimisation of the intake of fossil resources as raw material for other use than energy production
14: Management of minerals
15: Research and development
16: Other natural Resource Management activities
2.4. Estimation of variables using existing statist ics, for example the production of energy from renewable sources as an ancillary activity The Handbook focuses on a supply side approach for estimating four main variables of the EGSS: Turnover, Value Added, Employment and Exports, Using existing statistics is the main object of the Handbook since the burden of launching new surveys is seldom feasible for National statistical offices.
Unfortunately finding data on the EGSS from existing statistics can be very difficult because the statistics developed using the standard statistical classifications (such as ISIC/NACE,

20/04/2009 11/18
PRODCOM/HS/CPA/CPC) do not allow for an easy identification of EGSS activities. This is the case, for example, for resource management ancillary activities, in particular auto production of energy from renewable energy sources (heat pumps, biogas, solar cells, etc.).
Following the NACE 2 Introductory Guidelines4, the auto production of energy from renewable sources should not be accounted as an ancillary activity (Section 2.2 §53d) but should be separated out into a separate kind of activity unit, which would mean it should be treated as a secondary activity (Section 2.2 §54). Since the auto production of energy from renewable sources is one of the most significant activities for resource management in some industrial sectors (mainly in the food industry and the paper industry), this should therefore be recorded as an secondary activity in the Standard Tables for the EGSS, however since in most cases separation into a separate KAU is not possible it is recommened that this be recorded as an ancillary activity in the Standard Tables for the EGSS.
For statistical purposes in the context of EGSS, ancillary activities are those as defined by Council Regulation (EEC) No. 696/93, Section IV B1 and B4 of 15.03.1993 on the statistical units for the observation and analysis of the production system in the Community and the Introductory Guidelines of NACE 2 plus auto production of energy from renewable sources (section 2.2).
2.5. Summary of remaining issues related to the Env ironmental Goods and Services Sector
A number of the implementation and overlapping of category problems that remained in the Eurostat/OECD 1999 manual have been solved, notably by the introduction of the CReMA classification on resource management activities (CRUMA adapted for the needs of the EGSS). However there are still some ambiguities that have not yet been fully solved although through the use of examples, the new EGSS handbook helps statisticians to identify portions of the EGSS that previously have been difficult to establish where the system boundaries should be drawn. As experience is gained in data collection and statistical production some of these topics may need additional harmonization in the future.
PART II. Contextual information for EGSS
3. Standard tables on EGSS statistics
Based on discussions in the task force meetings, new proposals for standard tables were drawn up and proposed during the task force meetings which took place in October 2008 and February 2009.
In its latest version, an electronic EXCEL workbook forms the EGSS standard tables. Through the standard tables, national statistical institutes are kindly requested to:
- Provide information on the methodology they have used to produce statistics on the EGSS;
- Fill in the data-sheets for two economic sectors (industries and government) and four main economic variables (turnover, value added, employment and exports).
The latest version of the standard tables consists of 11 data-sheets. One data-sheet is provided by variable and by group of producers (7 tables to fill out); one data sheet summarizes the different groups of producers for each variable (4 tables filled out automatically), that is:
4 http://epp.eurostat.ec.europa.eu/pls/portal/docs/PAGE/PGP_DS_NACE_REV_2/PGE_DS_NACE_REV_2/NACEREV.2INTRODUCTORYGUIDELINESEN.PDF

20/04/2009 12/18
- 4 data sheets for the industry group and 3 for the General Government of producers (exports of General Government is not included).
- 4 data sheets for the total of each variable.
The figures below present the structure of the current standard tables. On Circa it is possible to find the latest complete version of the standard tables.
Figure 2: Index of the standard tables
INDEX
Datasheet Description
Introduction IntroIntroduction about the Eurostat data collection on the environmental goods and services sector
for information
Explanatory notes Notes Notes on how to fill in the standard tables for information
Methodology MethodologyNational authorities are kindly asked to provide information on the methodology used for gathering the data reported in the standard tables
to be filled in
Examples
(Corporations)Corporations - examples
This data sheet provide some examples of activities, godds and services to be included in the EGSS and their classification by environmental domain
for information
DataVariable Title Description Type
Corporations - Turnover Data sheet for turnover of the industries to be filled in
Government - Turnover Data sheet for turnover of the government to be filled in
Corporations - Value Added Data sheet for value added of the industries to be filled in
Government - Value Added Data sheet for value added of the government to be filled in
Corporations - Employment Data sheet for employment of the industries to be filled in
Government - Employment Data sheet for employment of the government to be filled in
Exports Corporations - Exports Data sheet for exports of the industries to be filled in
TOTAL - Turnover Total turnover by sector for information
TOTAL - Value added Total value added by sector for information
TOTAL - Employment Total employment by sector for information
TOTAL - Exports Total exports by sector for information
Employment
TOTAL
Environmental Goods and Services Sector
Index
Turnover
Value Added
The data sheets contain the environmental domains in columns and NACE categories in rows.
General description of the introductory sheets
The explanatory Notes sheet contains an overview of the Standard Tables, reporting instructions and an explanation of the classifications used. For more detailed information this sheet makes reference to the Handbook.
The Methodology sheet asks for a description of the methodologies used by the countries to produce the EGSS statistics (e.g. survey, estimation from environmental expenditure, business register, model, etc). In this sheet, details are asked on how data have been obtained for each variable and group of producers (e.g. the turnover of corporations, the turnover of the General Government, etc). This sheet requires also filling in some meta information as, for example, the contact point for EGSS statistics in each country.
The Corporations’ examples sheet contains in the cells some examples of environmental goods, technologies and services which can be found in the EGSS. These examples are not exhaustive. They are thought just as a guide for including as much information as possible and to clarify classification problems. Furthermore, as in the data sheets, the rows which are likely to contain no data (i.e. kind of environmental goods, technology and services that are not likely to be found for a particular NACE sector) are shaded.

20/04/2009 13/18
This does not mean that shaded cells are not to be filled in. If countries collect data for some of the shaded cells, a footnote should be added to give more detail on the product and/or producer concerned. This will help in expanding the list of examples and in assuring consistency of data among countries.
Figure 3: Overview of Standard Tables
Figure 4: Overview of natural environmental protection CEPA classes (Standard Table columns)
CEPA 1
CEPA 1.1.2 and
1.2.2 CEPA 2 CEPA 3 CEPA 4 CEPA 5 CEPA 6 CEPA 7 CEPA 8CEPA 8.1.2 CEPA 9
Protection o f
ambient air and climate fo
otn
ote
s o f wh ich for the protection of climate and
oz one layer foo
tnot
es
Wastewater manag ement
foo
tno
tes
W aste management
foo
tno
tes
Protection and remediation of
soil , groundwater
and surface water
foo
tno
tes Noise and
vibration ab atement fo
otn
otes
Protection o f biod iversi ty
and
land scapes foo
tno
tes Protection
ag ainst radiation fo
otn
ote
s Research and
development (R&D) fo
otn
ote
s R&D for the pro tection of cl imate and
ozone layer foo
tno
tes
Other
foo
tno
tes
Total A
foo
tno
tes
A. Environmental Protection
Figure 5: Overview of natural resources management CReMA classes (Standard Table columns)

20/04/2009 14/18
CReMA 10 CReMA 11CReMA 11
ACReMA
11 B CReMA 12 CReMA 13 CReMA
13 ACReMA 13
BCReMA 13
C CReMA 14 CReMA 15CReMA 15.5.1
CReMA 16
Management of waters
foo
tno
tes Managemen t of
forest resou rces fo
otn
otes Management of
non-cultivated forest areas fo
otn
ote
s Minimisation o f
the intake o f fo rest
resources foo
tno
tes Management of
wild flora and fauna fo
otn
ote
s Management of
fossi l energy reso urces fo
otn
ote
s Production of
energy from renewab le
sou rces foot
not
es Heat/Energy
saving and management fo
otn
ote
s
Minimisation of the intake of
fossi l resources as raw material
foo
tno
tes
Management of minerals
foo
tno
tes Research and
development (R&D) fo
otn
ote
s
R& D for th e production of
energy fro m renewab le
sou rces
foo
tno
tes
Other
foo
tno
tes
Total B
foo
tnot
es
B. Resources Management
Figure 6: Overview of type of activity and of type of output breakdowns (ST rows) for Corporations and General Government
Corporations of which ancillary activities of which non-market activitiesenv. specific and connected servicesconnected goods adapted goods end-of-pipe technologiesintegrated technologies integrated technologies
env. specific and connected servicesconnected goods adapted goods end-of-pipe technologies
General Government of which ancillary activities
General description of the data sheets
Each data sheet identifies the variable to be reported, the unit used (i.e. thousands of euro/national currency, thousands of full time equivalent, etc.) and the type of producer concerned (General Government or Corporations). The respondents should also fill in the name of the country and the year of reference.
Data
Each data sheet includes elements in rows and in columns:
- the rows present the producers breakdown. For the Corporations the NACE ver. 2 two digits breakdown is used. Nevertheless it is possible to fill in the Standard Tables at an aggregate level of detail (e.g. aggregating two or more two digits NACE classes or using NACE sections). For the General Government, the breakdown is the level of Government given by the European System of Accounts 1995 (ESA 1995). In addition for both Corporations and General Government, the rows of the Standard Tables data sheets contain an extra selective breakdown in order to indicate the part of ancillary activities and to provide data by type of production outputs (i.e. environmental specific and connected services, connected goods, adapted goods, end of pipe technologies and integrated technologies). Only for Corporations, the Standard Tables data sheets contain an additional row for recording the part of non-market activities.
- the columns present the environmental domains, according to the CEPA and the CReMA classifications.
Therefore, the columns are exactly the same in the corporations and the General Government’s data sheets but the rows differ.
The Standard Tables spreadsheet file allows users to hide/show details for rows and columns in order to reduce the tables for printing. Filtering the rows/columns is only intended for an easier handling of the tables and do not impede that all the cells of data sheets could potentially be filled in.

20/04/2009 15/18
The total figures for the environmental protection group (i.e. the CEPA classes) and for the resource management group (i.e. the CReMA classes) are automatically calculated.
The total value of the variable by class of producer is not automatically calculated since the respondent has the choice of the level of detail to answer to the Standard Tables (e.g. from NACE 2 digits to NACE section).
Footnotes
Columns of footnotes are also integrated for each environmental domain (e.g. CEPA and CReMA classes) and for each column of total.
The footnotes should be referenced in the footnote column highlighted in yellow. Footnotes references should be alphabetical, separated by a right bracket. The footnote text should be entered in the yellow area below each data table. Each footnote text should be preceded by the corresponding footnote reference.
Countries can use more than one footnote reference next to a value. e.g.: a)b)e)h). When doing so, it is not necessary to leave a space between the references, since the right bracket is already serving as separator. Given the limited width of the footnote reference columns, it is possible that some of footnote references will not be visible. However, this will have no impact on the processing of data and metadata.
Figure 7: Footnotes area of the Standard Tables
Your Footnotes
2) Footnote texts should be preceded by the corresponding footnote reference, e.g.
e.g.: a)This is the first footnote text referring to footnote reference a) in the data area.
b)This is the second footnote text referring to footnote reference b) in the data area.
c) etc......
B. FOOTNOTE TEXTS
1) The yellow highlighted area to the right of this text, corresponds to the FOOTNOTE
AREA (E103:E138). In this area you can enter the footnote text(s) corresponding to
the footnote reference(s) which you have entered in the footnote columns (data area E4:V102).
bracket is already serving as separator.
3) Given the limited width of the footnote reference columns, it is possible that some of your
footnote references will not be visible. However, this will have no impact on the processing
of your data and metadata.
c)
Please do NOT use any other format for the footnote references!
2) You can enter more than one footnote reference next to a value. e.g.: a)b)e)h)
When doing so, it is not necessary to leave a space between the references, since the right
1) Footnote references should be entered in the footnote columns (highlighted in yellow), in the
data area (E4:V102). Footnote references should be "alphabetical", separated by a right bracket,
e.g.: a)
b)
Footnote area: (Footnote references + texts) --> EXPLANATIONS
A. FOOTNOTE REFERENCES:
3) When inputting the footnote texts it is not necessary to leave a space between the
footnote reference and the footnote text, since the right bracket is already serving as
separator.
4) Please use one (1) line only per footnote text, even if it is very long.
5) In case you delete a footnote reference entirely from the data area (i.e. it no longer figures
anywhere in the data area), please do not forget to also delete the corresponding
footnote texte in the footnote area
The yellow highlighted area at the bottom of each data sheet corresponds to the footnote area. In this area countries can enter the footnote texts corresponding to the footnote references. Footnote texts should be preceded by the corresponding footnote references. When introducing the texts, it is not necessary to leave a space between the footnote reference and the text, since the right bracket is

20/04/2009 16/18
already serving as separator. One text line per footnote reference should be used, even if it is very long.
Specific description of the data sheets concerning the Corporations
Data sheets concerning the corporations are consistent with the tables of the 2008 NAMEA5 Air emission accounts by industry. Details by NACE classes (2-digits level) are first asked. If it is not possible to fill-in the NACE 2-digits level cells (in case of, for example, confidentiality of some values), interim aggregates are an alternative to furnish these values. These interim aggregates regroup several NACE classes, such as, for example, the class C 23-25 including the activities of the manufacture of metals or the NACE section A regrouping the NACE 01 to 03, agriculture, fishing and forestry.
For each NACE class of producers, the following information is asked:
- the total value (in the row entitled by the name of the NACE class),
- the part of the total value that concerns ancillary activities,
- the part of the total value that concerns non-market activities,
- and the part of the total value that concerns environmental specific and connected services, connected goods, adapted goods, end-of-pipe technologies and integrated technologies.
Some rows of the data sheets are shaded. The shade means that the category of technology or products is not expected in the related NACE class of producers. However, if respondents have values to fill in these cells, a footnote should be used in order to detail the technologies or products concerned.
Specific description of the data sheets concerning the General Government
Data sheets concerning the General Government detail the values of variables by statistical units, i.e. the level of government (central, regional and local).
4. Presentation and interpretation of data
Given that this sector cuts across the standard industry and product classifications, EGSS data need to be treated with some caution. Chapter 6 of the handbook gives some hints to present the data.
The data collected on EGSS can be analysed at different levels. These include:
- Analysis by economic variable . Comparing data on the EGSS by economic variable reveals some interesting figures on the main characteristic of the sector in terms of employment, turnover, value added and exports. Furthermore these variables can be used to provide information on productivity and competitiveness, for instance.
- Analysis by economic sector . In comparing Corporations and the General Government, these analyses provide information on, e.g., the importance of public ownership
5 The NAMEA (National Accounting Matrix including Environmental Accounts) is a framework in which different types of statistical data are consistently organised, bringing together economic and environmental information that come from different parts of the statistical system.

20/04/2009 17/18
and the evolution of privatisation. Corporations and General Government can be analysed also at a more detailed level providing information on the magnitude of environmental activities of the different NACE sub-sectors (for the corporations) and administrative levels (for the General Government). For the corporations data can be also analysed to measure the importance of ancillary activities and the evolution of outsourcing as well as the relative magnitude of market and non-market activities.
- Analysis by environmental domain . Comparing data on the EGSS by environmental domains reveals which are the main domains of specialisation of environmental producers in a country. This analysis is important because a large majority of environmental companies focus on only one of the environmental domains and the competitive conditions in each of the domains can vary significantly. Combined with the environmental protection expenditure data, the analysis of the EGSS can also provide an indication of the environmental priorities of the countries.
- Analysis of time series . Time series of employment, turnover, value added and exports can give an indication of the EGSS evolution, its growth and its competitiveness.
- Analysis by type of environmental output . In comparing the figures for the different types of environmental goods, technologies and services, this analysis can highlight, for example, the importance of cleaner and resource efficient technologies compared to end of pipe technologies. Given the peculiarities of adapted goods, particular attention should be given to the producers of this class of environmental goods.
These analyses can be done using different levels of details, as it is shown in figure 8 below.
When presenting data on the EGSS, it is important to accompany them with other related statistics, as for example, statistics on environmental pressures. When comparing data from different countries it will be important to choose the right variable to build up meaningful indicators.
Figure 8: Different levels of details for presenting the data on the EGSS

20/04/2009 18/18
It is expected that this new handbook will allow for more consistent development of statistics for the environmental goods and services sector and the standard tables will provide a good starting point for the collection of country data. The standard tables and the handbook presented in this paper are the results of the work done in collaboration with the Task Force on the environmental goods and services sector. Eurostat would like to recognise and thank the Members of this Task Force:
Sacha Baud and Alexandra Wegscheider-Pichler (Statistics Austria)
Maja Cederlund, Hanna Brolinson, Mats Eberhardson and Nancy Steinbach (Statistics Sweden)
Michel David and Karim Tachfint (IFEN)
Maria Luisa Egido (Statistics Spain)
Federico Falcitelli (ISTAT)
Viktoria Hajdu (Statistics Hungary)
Rocky Harris and Dean Thomas (DEFRA and DTI UK)
Sarah Kleine (Statistics Germany)
Eila Salomaa and Annika Miettinen (Statistics Finland)
Maarten van Rossum, Sjoerd Schenau and Anna Kulig (Statistics Netherlands)
Tone Smith (Statistics Norway)
Jeffrey Fritzsche (Statistics Canada)
It also includes the result of the contribution of the Directorate-General Environment, Directorate-General Enterprise and the Environmental Account team of Eurostat.


