1 Environmental High Frequency Characterization of Fabrics based on a Novel Surrogate Modelling Antenna Technique Frederick Declercq, and Ivo Couckuyt, and Hendrik Rogier Senior Member IEEE, and Tom Dhaene senior Member IEEE Abstract— Wearable antennas are mostly constructed from fabric or foam, whereas e-textiles are often used as conductive parts. A design obstacle is the lack of knowledge about the electromagnetic properties of these materials. Moreover, most of these fabrics exhibit electromagnetic properties that depend on prevailing atmospheric conditions. In this work, we present a dedicated characterization method to determine the complex permittivity of fabrics or foams, as well as the effective conduc- tivity of e-textiles, and this as a function of relative humidity. The method extracts the constitutive parameters by comparing measured and simulated antenna figures of merit such as input impedance and antenna efficiency. This inverse problem is solved using a surrogate-based optimization technique as implemented in the SUrrogate MOdeling Toolbox, yielding a fast and accurate characterization. The method is evaluated by characterizing six materials which are exposed to relative humidity levels ranging from 10% to 90%. From the extracted complex permittivities of the six materials, two-phase dielectric mixing models based on the volumetric fractions of the absorbed moisture in the substrates are developed and evaluated in terms of accuracy. For the materials exhibiting a high sensitivity to moisture, the model is observed to be less accurate. However, the worst model accuracy is shown to be comparable with the estimated accuracy of the characterization procedure. For materials with low sensitivity to moisture, the model fits the measured values very well. Index Terms—permittivity, loss tangent, conductivity, e-textile, relative humidity, kriging, microstrip antennas, textile antennas I. I NTRODUCTION I N the last decade numerous textile planar antennas for wearable applications were designed and reported in liter- ature [1]–[7]. Off-the-shelf fabric or foam materials typically serve as the antenna substrate, whereas e-textiles are often used as conductive parts. Also printing technology and flexible polyimid/Cu sheets have been applied in defining conductive patterns onto a fabric dielectric [8], [9]. Adopting these flexible materials in wearable antenna design fulfills the requirement of conformability to the human body and facilitates the inte- gration of wearable textile systems into the garment. Manuscript received August 8, 2012; revised March 21, 2013; accepted July 1, 2013. Date of publication Date, year. Frederick Declercq and Hendrik Rogier are with IMEC, INTEC division. They are also affiliated with the Department of Information Technology, Ghent University, St. Pietersnieuwstraat 41, Ghent, Belgium. E-mail: fred- [email protected], Tel.: ++32/92649531, Fax: ++32/92649969. Ivo Couckuyt and Tom Dhaene are with the Department of Information Technology, Ghent University, iMINDS, Gaston Crommelaan 8, 9050 Ghent, Belgium The introduction of fabrics in wearable antenna design initiated the need for accurate electromagnetic property char- acterization of the non-conductive substrate material as well as the conductive fabrics. Several microwave methods have been adopted in the characterization of textile fabrics. These methods can be split into two groups, being the non-resonating and resonating methods. The former group, such as the broad- band transmission line method, utilizes scattering parameter measurements of two textile microstrip lines with different lengths in order to extract the material’s permittivity [10], [11]. This transmission line technique was improved by using the matrix-pencil method which minimizes the deviation of the extracted dielectric parameters [12]. The second group are the resonating methods. Compared to the non-resonating methods, the latter group is narrow band but provides a higher accuracy and sensitivity [13]. Moreover, the cavity perturbation tech- nique also identifies anisotropy that is typically present in the electromagnetic properties of woven textile materials [2], [11]. Finally, planar antenna resonator techniques are commonly used because of their simple sample preparation. Moreover, they characterize the fabrics as in the final application, taking into account the effect of glue and e-textile [12]. In general, permittivity is extracted by comparing the measured antenna resonance frequency with the simulated resonance frequency based on full-wave numerical techniques such as the Method of Moments [14] or with the resonance frequency calculated using empirical formulas [15]. For the characterization of conductive yarns, the waveguide cavity and transmission line methods were used in [16] and [17], respectively. Conductive fabric characterization by means of a microstrip-resonator method and a transmission line method were addressed in [17] and [18], respectively. Since wearable antennas operate in a continuously chang- ing environment, a thorough understanding of the antenna behavior as a function of environmental conditions is abso- lutely essential. These environmental conditions are realized in climate chambers in which relative humidity and temper- ature are accurately controlled. Only few efforts focused on changing antenna performance and electromagnetic properties of the materials as a function of environmental conditions. In [14], the relative permittivity of several antenna substrates, exhibiting different sensitivities to moisture, as a function of relative humidity was determined. Quantitative environmental characterization of the substrate’s complex permittivity using a transmission line and a cavity perturbation method is presented
Transcript
1
Environmental High Frequency Characterization ofFabrics based on a Novel Surrogate Modelling
Antenna TechniqueFrederick Declercq, and Ivo Couckuyt, and Hendrik Rogier Senior Member IEEE, and Tom Dhaene senior
Member IEEE
Abstract— Wearable antennas are mostly constructed fromfabric or foam, whereas e-textiles are often used as conductiveparts. A design obstacle is the lack of knowledge about theelectromagnetic properties of these materials. Moreover, mostof these fabrics exhibit electromagnetic properties that dependon prevailing atmospheric conditions. In this work, we presenta dedicated characterization method to determine the complexpermittivity of fabrics or foams, as well as the effective conduc-tivity of e-textiles, and this as a function of relative humidity.The method extracts the constitutive parameters by comparingmeasured and simulated antenna figures of merit such as inputimpedance and antenna efficiency. This inverse problem is solvedusing a surrogate-based optimization technique as implementedin the SUrrogate MOdeling Toolbox, yielding a fast and accuratecharacterization. The method is evaluated by characterizing sixmaterials which are exposed to relative humidity levels rangingfrom 10% to 90%. From the extracted complex permittivities ofthe six materials, two-phase dielectric mixing models based on thevolumetric fractions of the absorbed moisture in the substratesare developed and evaluated in terms of accuracy. For thematerials exhibiting a high sensitivity to moisture, the model isobserved to be less accurate. However, the worst model accuracyis shown to be comparable with the estimated accuracy of thecharacterization procedure. For materials with low sensitivity tomoisture, the model fits the measured values very well.
Index Terms— permittivity, loss tangent, conductivity, e-textile,relative humidity, kriging, microstrip antennas, textile antennas
I. INTRODUCTION
IN the last decade numerous textile planar antennas forwearable applications were designed and reported in liter-
ature [1]–[7]. Off-the-shelf fabric or foam materials typicallyserve as the antenna substrate, whereas e-textiles are oftenused as conductive parts. Also printing technology and flexiblepolyimid/Cu sheets have been applied in defining conductivepatterns onto a fabric dielectric [8], [9]. Adopting these flexiblematerials in wearable antenna design fulfills the requirementof conformability to the human body and facilitates the inte-gration of wearable textile systems into the garment.
Manuscript received August 8, 2012; revised March 21, 2013; acceptedJuly 1, 2013. Date of publication Date, year.
Frederick Declercq and Hendrik Rogier are with IMEC, INTEC division.They are also affiliated with the Department of Information Technology,Ghent University, St. Pietersnieuwstraat 41, Ghent, Belgium. E-mail: [email protected], Tel.: ++32/92649531, Fax: ++32/92649969.
Ivo Couckuyt and Tom Dhaene are with the Department of InformationTechnology, Ghent University, iMINDS, Gaston Crommelaan 8, 9050 Ghent,Belgium
The introduction of fabrics in wearable antenna designinitiated the need for accurate electromagnetic property char-acterization of the non-conductive substrate material as wellas the conductive fabrics. Several microwave methods havebeen adopted in the characterization of textile fabrics. Thesemethods can be split into two groups, being the non-resonatingand resonating methods. The former group, such as the broad-band transmission line method, utilizes scattering parametermeasurements of two textile microstrip lines with differentlengths in order to extract the material’s permittivity [10], [11].This transmission line technique was improved by using thematrix-pencil method which minimizes the deviation of theextracted dielectric parameters [12]. The second group are theresonating methods. Compared to the non-resonating methods,the latter group is narrow band but provides a higher accuracyand sensitivity [13]. Moreover, the cavity perturbation tech-nique also identifies anisotropy that is typically present in theelectromagnetic properties of woven textile materials [2], [11].Finally, planar antenna resonator techniques are commonlyused because of their simple sample preparation. Moreover,they characterize the fabrics as in the final application, takinginto account the effect of glue and e-textile [12]. In general,permittivity is extracted by comparing the measured antennaresonance frequency with the simulated resonance frequencybased on full-wave numerical techniques such as the Methodof Moments [14] or with the resonance frequency calculatedusing empirical formulas [15]. For the characterization ofconductive yarns, the waveguide cavity and transmission linemethods were used in [16] and [17], respectively. Conductivefabric characterization by means of a microstrip-resonatormethod and a transmission line method were addressed in [17]and [18], respectively.
Since wearable antennas operate in a continuously chang-ing environment, a thorough understanding of the antennabehavior as a function of environmental conditions is abso-lutely essential. These environmental conditions are realizedin climate chambers in which relative humidity and temper-ature are accurately controlled. Only few efforts focused onchanging antenna performance and electromagnetic propertiesof the materials as a function of environmental conditions.In [14], the relative permittivity of several antenna substrates,exhibiting different sensitivities to moisture, as a function ofrelative humidity was determined. Quantitative environmentalcharacterization of the substrate’s complex permittivity using atransmission line and a cavity perturbation method is presented
2
in [11], [19]. A good overview of the dielectric properties oftextile materials and fibres, and the various low frequencyand RF measurement techniques is given in [20]. In [21]qualitative experiments were performed on different textileantennas, characterizing their reflection coefficient behaviorand their in-system performance when exposed to water, iceand snow.
In this work, we propose a novel electromagnetic propertycharacterization method dedicated to characterization of an-tenna materials as a function of varying relative humidity.The method relies on a surrogate-based optimization (SBO)approach for minimizing a cost function that quantifies thedifference between measured and modeled antenna figuresof merit and hence reconstruct complex permittivity, beingpermittivity and loss tangent of the substrate, and conductivityof the e-textile. The SBO technique for dielectric character-ization of substrates by solely relying on antenna reflectioncoefficient was introduced in [22]. In this work, we improvethe accuracy of this technique by incorporating antenna ef-ficiency in the new characterization process. Furthermore, adedicated fast measurement procedure is introduced as antennameasurements are infeasible in a climatic chambers. Further-more, we used the measured substrate data to investigate theapplicability of a dielectric mixing model. In particular, theBirchak mixing model based on volumetric fractions is used.
Converting the inverse problem into a forward optimizationprocess is a popular approach in material characterization. In[23] the dispersive dielectric properties of PCB substrates weredetermined by using a genetic algorithm for minimizing thecost function. In [24], a longitudinally inhomogeneous dielec-tric profile inside a metallic waveguide was reconstructed byrelying on different Gauss-Newton techniques. A techniquefor characterizing dielectric properties of biological tissueswas presented using a rational function model (RFM) ofan immersed open-ended coaxial probe in [25]. A matlaboptimizer minimized the cost function between the measuredand RFM aperture admittance. In [26] subsurface electric prop-erties of soils were reconstructed using a model of a groundpenetrating radar that includes the multilayered soil surface.The inverse problem was solved by relying on an efficientglobal optimization scheme. Also neural networks [27], [28]and space mapping [29] techniques were used for solvinginverse electromagnetic problems for finding geometric andelectromagnetic properties.
Section II describes the two-step characterization procedure.In Section III, the constitutive parameters of a high frequencylaminate with known parameters are determined in orderto validate the method’s accuracy. The six different fabricmaterials characterized in this work and the measurementsetup for investigating conditioned antenna figures of merit isgiven in Section IV. Next, the results of the characterizationprocess are presented in Section V and the need for theimproved cost function is highlighted. Finally, in Section VI,we apply a dielectric mixing formula onto the results ofthe characterization process and evaluate the accuracy of thecharacterization method and the mixing model.
II. CHARACTERIZATION PROCESS
A. Electromagnetic Properties of Fabrics
The electromagnetic properties of interest are complexpermittivity ε = ε0εr(1 − j tan δ) of the wearable antennasubstrate, with ε0 = 8.85× 10⁻¹²Fm−1 being the free spacepermittivity, εr representing the relative permittivity and tan δdenoting the loss tangent of the substrate. In addition, whenapplying e-textiles in wearable antenna design, the conduc-tivity σ is of interest for the antenna design engineer. Notethat dielectric substrate losses will be included in the complexε, whereas σ accounts for the conductive losses in antennaand ground planes. Wearable antennas are constructed fromfabric or foam material which are heterogeneous mixtures ofthree different constituents, being textile fibres or bulk foammaterial, air and moisture. Furthermore, fibrous assembliessuch as woven fabrics also exhibit an anisotropic behavior[19] and the complex permittivity depends on temperature. Inthe heterogenous fibre assembly, the individual permittivitiesof air, fibre and moisture contribute to the overall ε of thesubstrates and can be estimated by relying on dielectric mixinglaws [30]. However, the structure of non-woven fabrics andfoams is highly irregular which makes the prediction ofdielectric properties as a function of geometrical parametersand the dielectric properties of the individual constituentshighly problematic. Despite the fact that woven fabrics consistof a quasi-periodic repetition of unit structures, geometricalmodeling is still inconvenient due to variation in yarn ge-ometry, variation among the individual yarns and variationsdue to the weaving process. In the considered frequencyrange of the characterization process, the size of the moistureand air inclusions is small with respect to the wavelengthallowing us to homogenize the substrate and apply dielectricmixing models that use fractional volumes, which can be easilymeasured, as a parameter relating the permittivities of theindividual constituents in the overall permittivity [30]. Thisapproach is also well known to describe the behavior of wetsoil [31].
In general complex ε depends on frequency and the sim-plest model for describing the dispersive behavior of a nonmagnetic, linear, isotropic and homogenous material is givenby the Debye law involving a single relaxation mechanism[23]. Due to the presence of water in the substrates, morethan one relaxation mechanism will exist and the overalldispersive behavior of the substrate has to be described by amodel that sums two Debye models with different relaxationmechanisms [26]. Note that for water, both dielectric lossesdue to polarization of the water molecules and conductivelosses due to ionic conductivity contribute to the overall tan δof the antenna substrate. For the frequency range considered inthis study, the losses due to relaxation of the water moleculesstart to prevail, resulting in an increase of the dielectric losses.This work presents a narrowband characterization techniqueallowing us to consider the complex ε as being constant.Furthermore, we assume isotropic behavior of the substratessince the main field component for antenna radiation in planarantenna design is the out-of-plane component [32].
3
B. Characterization Method
The reflection coefficient S11(f) and antenna radiation effi-ciency ecd(f) of a planar antenna, with f being the frequency,are determined by the complex ε of the substrate and σ of theconductive plane. The constitutive properties of all materialsused in a planar antenna can be determined by fitting simulatedonto measured antenna figures of merit. This inverse problemis solved by converting it into a forward optimization problem[22]. Practically, a full-wave electromagnetic simulation modelof the antenna is constructed and the constitutive parametersin the substrate model are optimized until a minimum is foundin the cost function that quantifies the difference between thesimulated and measured antenna performance characteristics.An SBO technique was chosen for the minimization of thecost functions as SBO outperforms other blackbox optimizerssuch as Simulated Annealing or Pattern Search in terms ofaccuracy and optimization speed [22]. The simulation modelof the antenna, the two different cost functions and the SBOalgorithm are discussed in this section. In order to find aunique solution, the characterization process is divided intotwo sub-characterization processes:• Step 1: We first characterize a planar antenna constructed
using homogeneous copper foil with a known σ for theconductive planes. The outcome of the characterizationprocess yields the substrate’s εr and tan δ.
• Step 2: An e-textile based antenna constructed using thesame dielectric material as in step 1 is characterizedin step 2. Reusing the extracted tan δ from step 1 andoptimizing for σ and εr to minimize the cost functionyields the remaining constitutive parameters of all mate-rials needed to accurately design the textile antenna.
Note that in step 2, εr is still unknown due to the fact thatresonance frequency decreases when applying e-textiles instead of copper foil, for the conductive parts in wearableantenna design [12]. One can take this effect into account byusing an equivalent substrate εr in the simulation model. Thisequivalent permittivity is slightly larger than the εr in the sim-ulation model of the copper based antenna design. Practically,the substrate parameters and conductivity are constrained toa prescribed optimization range. These bounds depend on thematerials’ susceptibility to moisture and on the initial estimatefor the material properties used in the textile antenna designs.Furthermore, the optimization range of the substrate’s εr ischosen such that we avoid higher-order mode resonances ofthe planar antenna, which could potentially result in multiplesolutions of the sub-characterization process.
1) Simulation Model of the Antenna: The antenna model re-lies on an integral equation solved by the Method of Momentsas implemented in Momentum from Agilent Technologies’Advanced Design System. The antenna topology used inthe characterization process is an inset-fed patch antenna asdepicted in Fig. 1. The following geometrical assumptionswere made in the simulation model of the antennas:• The ground plane in the simulation model is of infinite
size.• The SMA connector connected to the antenna feedline is
not accounted for in the simulation. We use a single port
1
L
t
xf
W
h
εr, tan δ
wf
siσ
groundplane, σ
July 8, 2013 DRAFT
Fig. 1. Geometry of the inset-fed patch antenna.
excitation in the simulation model in which a calibrationprocedure removes potential higher order mode excita-tions and port excitation parasitics in the S-parametercalculation of the antenna [33].
• The uncertainty in geometrical antenna parameters is notconsidered. Predominantly, uncertainties in the length Lof the patch and thickness h of the substrate yield thelargest uncertainty in the outcome of the characterizationprocess. Compressibility of the flexible substrates andincrease in substrate thickness due to water absorptionare the main contributors to the uncertainty in h. Thefinite fabrication accuracy of the patch determines theuncertainty in L.
To simplify the characterization process, we neglect changesin actual thickness due to moisture, but we incorporate thiseffect in the equivalent εr of the substrate, keeping substratethickness constant in the simulation model.
The substrate model in Momentum implies a homogeneousand isotropic substrate. Hence, ε of the substrate modelincorporates the individual contributions of the constituents(bulk material, air, water) and the frequency dependence ofthe substrate’s complex permittivity due to the air-dielectricinterface is accounted for by means of the full-wave DyadicGreen’s function [33]. The e-textile is modeled as a homoge-neous conductor with an effective thickness and an equivalentconductivity yielding the same losses as introduced by thee-textile. The effective thickness was chosen to be identicalto the physical e-textile thickness. The frequency dependentconductivity model was chosen to model conductor losses.
2) Cost Functions: Since fr and BW are captured inthe antenna’s reflection coefficient curve as a function offrequency, one can extract substrate εr and tan δ in step 1, orsubstrate εr and conductor σ in step 2 by fitting simulated ontomeasured reflection coefficients. The cost function describingthe discrepancy between simulated and measured data is thepopular mean squared error as applied in [22],
MSE1 =1
n
n∑
i=1
wi
(|S11,i|dB − |S11,i|dB
)2(1)
with n the number of frequency points, and |S11,i| and|S11,i| the reflection coefficients of the antenna at frequency iobtained by simulation and measurements, respectively. wi isthe weighting factor for the simulated and measured reflection
4
coefficient at frequency i. It is well known that the real partof complex permittivity has a more significant influence onresonance frequency compared to tan δ. Hence, (1) is quicklyminimized if an approximation of the true substrate’s εr isknown. Subsequently, further exploration of εr and tan δ (step1) or σ (step 2) near the approximate εr until both resonancecurves |S11| and |S11| coincide yields the correct (εr, tan δ)in step 1 or (εr,σ) in step 2 of the characterization process.As shown in Section III and IV, the sensitivity of the charac-terization process to variation in loss tangent of the substrateis relatively poor. This will result in an inaccurate extractionof substrate tan δ in step 1, which increases the uncertainty ofthe simulation model in step 2 of the characterization process.Therefore, an improvement to (1) in terms of sensitivity tovariations in tan δ is proposed by also incorporating antennaradiation efficiency in the cost function. The new cost functionis then given by
MSE2 = a11
n
n∑
i=1
wi
(|S11,i|dB − |S11,i|dB
)2
+a2∣∣ecd,fr,s − ecd,fr,m
∣∣, (2)
where ecd,fr,s and ecd,fr,m are the simulated and measuredantenna efficiencies at the simulated and measured resonancefrequencies fr,s and fr,m, respectively. The weighting factorsfor the two individual parts of the error function are repre-sented by a1 and a2. Note that |ecd,fr,s − ecd,fr,m | is notsquared since the order in magnitude of the efficiency error issimilar to the order of magnitude of the first error term whenchoosing a1 = 1 and a2 =100. The weighting factors wi in(1) or (2) equal 1 for all frequencies i.
3) Characterization Flowchart: A schematic overview ofthe complete characterization process is given in Fig. 2.First, an estimated value for the electromagnetic properties(εr, tan δ) is utilized in Momentum from Agilent Technologiesin order to design an inset-fed patch antenna as depicted inFig. 1. The use of a single-mode narrow bandwidth antenna in-creases the sensitivity of the resonance frequency with respectto small perturbations in εr yielding a more accurate charac-terization. From this design, a simulation model, in which theinput variables are the materials’ electromagnetic properties,is constructed in Momentum. The outputs of the simulationmodel are |S11| and ecd at fr. Two textile antennas for eachsubstrate are required: One prototype utilizing homogeneousCu foil and one using e-textile for the conductive parts in step1 and step 2, respectively. For the construction of (1) an |S11|measurement is required. Whereas for (2), both an |S11| andecd measurement are required. The measurement proceduresare described in Section IV. Next, the SBO technique thatminimizes the cost function is outlined briefly in Section II-C.
C. Surrogate Based Optimization
The optimization algorithm used here is the Efficient GlobalOptimization (EGO) formulation as proposed in [34]. Thissurrogate based optimization (SBO) technique relies on theconstruction of kriging surrogate models, which provide anapproximate mapping between the optimization variables andthe cost function based on well-chosen sample points. First, an
1
step 1 step 2Conductor Cu e-textile
Optimizationvariables
tan δ
εr, tan δ εr, σ
Method of Moments|S11|, ecd
MSE
Measurements|S11|ecd
SUrrogate MOdelling Toolbox
#samples
< 70?
Yes
Optimizing MSE
No
εr, tan δ
Minimum MSE
εr, σ
step 1 step 2
July 8, 2013 DRAFT
Fig. 2. Schematic representation of the characterization process.
initial kriging model is constructed from a set of sample pointsdetermined through a maximum Latin Hypercube Design andthe four corner points defined by the upper and lower boundsof the optimization range of the constitutive parameters. InSBO, this global surrogate model provides extra informationand helps to search for a global optimum, hence avoidingpotential local optima. Subsequently, an adaptive samplingstrategy is used for determining the next sample to evaluateand hence update the surrogate model.
Since the focus is on optimization a global accurate krigingmodel is not required and only a locally accurate krigingmodel around the optimum is of interest. Therefore EGO usesthe expected improvement (EI) criteria as adaptive samplingstrategy. These infill criteria yield a compromise between alocal search around the global optimum (minimum) and aglobal search where a high uncertainty of the kriging modelis encountered [22]. For this, two auxiliary functions are usedfor determining the next sample to evaluate. The first onedescribes the probability of improvement, i.e. the probabilityof finding a better minimum cost function value over thecurrent minimum function value, whereas the second onequantifies how large this improvement will be. These auxiliaryfunctions require a complete normal distribution in each point,i.e. expected value (=prediction) and variance (=predictionerror), of the surrogate model which is provided by the krigingsurrogate model through the kriging variance formulationdescribing the kriging model uncertainty in each point. Notethat in the evaluated sample points, the variance is zero.
The iterative procedure of optimizing EI, evaluating the nextsample, and hence updating the kriging model is repeated untila stopping criteria is fulfilled: Intuitively, one can stop the
5
optimization process when the maximal expected improvementvalue found, is less than a certain threshold, i.e., when theexpected gain of evaluating a new sample over the currentminimum cost function value is minimal, no more effortshould be made. This threshold can be set by the domainexpert as it relates to the minimum achievable cost functionvalue. Unfortunately, the expected improvement depends onthe statistical information provided by the kriging varianceformulation, and it is known that the prediction variance ofKriging is actually an underestimation leading to a too earlytermination of the optimization process [35]. Therefore, in thiswork it is chosen to make use of a sample budget as a stoppingcriterion. Only a limited number of samples is allocated tothe optimization process. In Section III it is experimentallyvalidated that the number of samples can be limited to 70.
In addition, kriging is by default an interpolation technique.However, since the measurements are prone to errors, the costfunctions will be noisy. Therefore, the kriging model wasadapted to operate as a regression technique [22]. After theoptimization ends, the solution of the characterization processis given by the electromagnetic properties that correspondto the minimum of (1) or (2). In step 1, εr and tan δ ofthe substrate are the outcome of the characterization process.Whereas in step 2, a corrected εr that includes the effect ofthe electro-textile and the conductivity σ of the e-textile arethe results of the characterization process.
III. CHARACTERIZATION OF THE RO4350B HIGHFREQUENCY LAMINATE
To validate the accuracy of the proposed optimization pro-cedure, the characterization process was applied to the highfrequency laminate RO4350B with the following properties:h = 1.524 mm, εr = 3.66, tan δ = 0.0031 [36]. The dimen-sions of the inset-fed patch antenna with a fr = 2.985 GHzare given in Table II. The antenna’s reflection coefficient wasmeasured in the frequency range from 2.5 – 3.5 GHz andthe measured efficiency was found to be ecd,fr,m = 70.78%.Version 6.2 of the SUrrogate Modeling (SUMO) Toolbox isused [37]. The optimization bounds are set to εr=[3.2 4.2] andtan δ=[0.0001 0.025]. The sample budget was limited to 200.
1) Evaluation of the Optimization Process: An evolutionplot of the minimum error function value versus the numberof samples for the optimization process relying on (1) and(2) is given in Fig. 3. Starting from the initial set of 24samples, the EI function starts exploring the design space. Byapplying MSE1 and MSE2, the global optimum is quicklylocated after approximately 57 and 45 samples, respectively.Still, the EI criteria explores other parts of the design space,enhancing the global accuracy of the kriging model (flat parts).For MSE1, the region near the global optimum is furtherexplored resulting in a final optimum at sample 85, whereasfor MSE2 no further improvement is found. The samplingcontinues until the sample budget of 200 samples is reached.The optimum substrate properties obtained from (1) and (2)are (εr = 3.7617, tan δ = 0.0071) and (εr = 3.7594,tan δ = 0.0048), respectively. Compared to the RO4350Bsubstrate properties specified by the manufacturer, a high
40 60 80 100 120 140 160 180 2000
1
2
3
4
5
6
Min
imum
err
or fu
nctio
n va
lue
Number of samples
MSE1
MSE2
(MSE1: 85, 0.4738)
(MSE2: 45, 0.7378)
(MSE1: 57, 0.5251)
Fig. 3. Comparison in progress of the minimum error function value vs.number of samples between error function MSE1 and MSE2 applied tothe RO4350B reference antenna.
IV. CHARACTERIZATION OF THE FABRIC AND FOAMMATERIALS
A. Substrate Materials
Six different materials, exhibiting different sensitivities tomoisture, were investigated. The different substrate materialscan be subdivided into two groups according to their moisture
6
3.23.4
3.63.8
44.2
00.005
0.010.015
0.020.025
0
10
20
30
40
εrtan δ
MS
E1
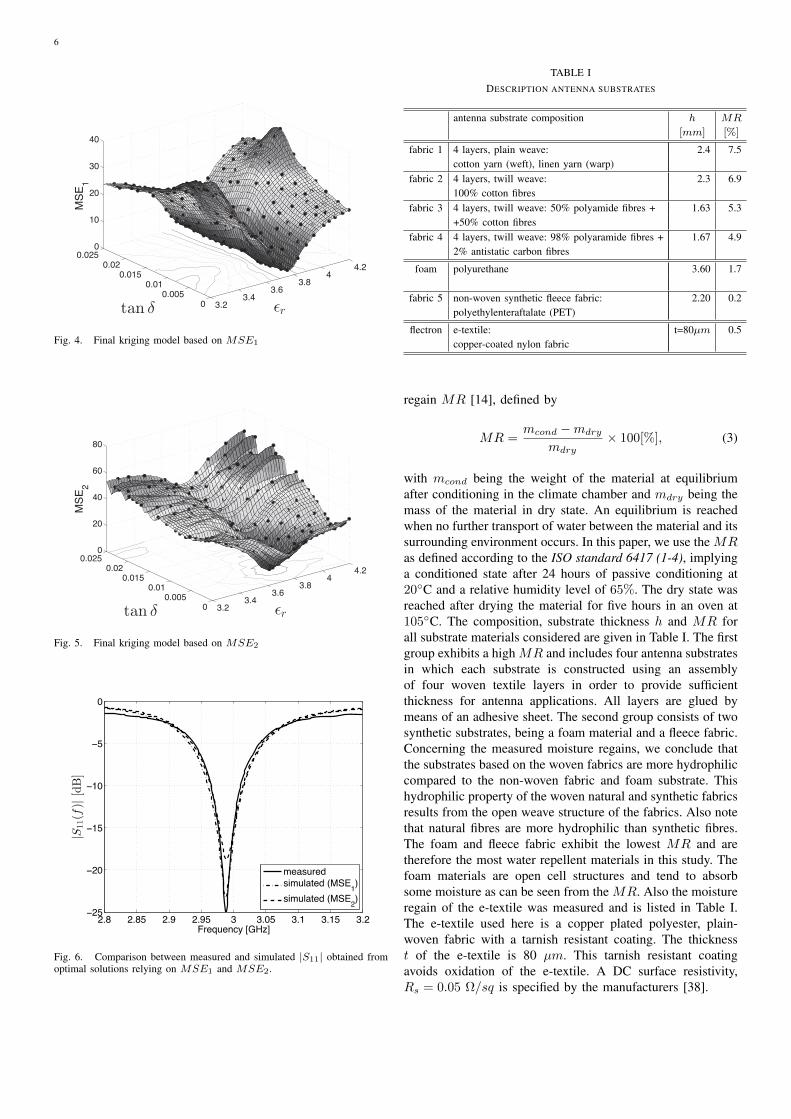
Fig. 4. Final kriging model based on MSE1
3.23.4
3.63.8
44.2
00.005
0.010.015
0.020.025
0
20
40
60
80
εrtan δ
MS
E2
Fig. 5. Final kriging model based on MSE2
2.8 2.85 2.9 2.95 3 3.05 3.1 3.15 3.2
−25
−20
−15
−10
−5
0
|S11(f)|[dB]
Frequency [GHz]
measured
simulated (MSE1
)
simulated (MSE2
)
Fig. 6. Comparison between measured and simulated |S11| obtained fromoptimal solutions relying on MSE1 and MSE2.
with mcond being the weight of the material at equilibriumafter conditioning in the climate chamber and mdry being themass of the material in dry state. An equilibrium is reachedwhen no further transport of water between the material and itssurrounding environment occurs. In this paper, we use the MRas defined according to the ISO standard 6417 (1-4), implyinga conditioned state after 24 hours of passive conditioning at20C and a relative humidity level of 65%. The dry state wasreached after drying the material for five hours in an oven at105C. The composition, substrate thickness h and MR forall substrate materials considered are given in Table I. The firstgroup exhibits a high MR and includes four antenna substratesin which each substrate is constructed using an assemblyof four woven textile layers in order to provide sufficientthickness for antenna applications. All layers are glued bymeans of an adhesive sheet. The second group consists of twosynthetic substrates, being a foam material and a fleece fabric.Concerning the measured moisture regains, we conclude thatthe substrates based on the woven fabrics are more hydrophiliccompared to the non-woven fabric and foam substrate. Thishydrophilic property of the woven natural and synthetic fabricsresults from the open weave structure of the fabrics. Also notethat natural fibres are more hydrophilic than synthetic fibres.The foam and fleece fabric exhibit the lowest MR and aretherefore the most water repellent materials in this study. Thefoam materials are open cell structures and tend to absorbsome moisture as can be seen from the MR. Also the moistureregain of the e-textile was measured and is listed in Table I.The e-textile used here is a copper plated polyester, plain-woven fabric with a tarnish resistant coating. The thicknesst of the e-textile is 80 µm. This tarnish resistant coatingavoids oxidation of the e-textile. A DC surface resistivity,Rs = 0.05 Ω/sq is specified by the manufacturers [38].
7
TABLE IIDIMENSIONS OF THE COPPER AND ELECTROTEXTILE BASED
For each textile substrate, two antenna prototypes, one e-textile based and one copper foil based antenna were con-structed. The antennas were designed to operate in the vicinityof 2.45 GHz. The conductive layers were glued onto thesubstrates using an adhesive sheet. The ground plane size ofthe antennas was chosen large enough so that the effect of afinite size ground plane did not affect the resonance frequency,i.e. keeping at least a λ/20 distance between the patch edgeand the substrate edge [39]. The resulting dimensions of theinset fed copper based and e-textile based antennas are givenin Table II.
C. Measurement Setup
1) Climate Chamber Setup: The twelve antenna prototypeswere placed in a climate chamber (WK 350 from WeissTechnik) and conditioned at a specific relative humidity level at23 C and this for 24 hours, assuming that an equilibrium statewas reached between the moisture absorbed by the materialand the moisture present in the climate chamber. The relativehumidity levels that were tested are 10, 20, 30, 40, 50, 60,70, 80 and 90%, resulting in a total of nine days required forexecuting the measurement campaign.
2) Reflection Coefficient Measurements: After 24 hours ofconditioning at one specified RH level each antenna wasremoved from the climate chamber to immediately perform afree-space reflection coefficient measurement in the frequencyrange from 2 GHz to 3 GHz. Here, the 8714 ET NetworkAnalyzer from Agilent Technologies was utilized and thenumber of frequency points in the measured range was setto 801, yielding a resonance frequency measurement accuracyof 1.25 MHz. The measurements were executed as quickly aspossible since removing the antenna from the climate chamberimposes a disequilibrium between the moisture absorbed in theantenna and the unknown moisture present in the prevailingatmosphere, resulting in a transfer of moisture between an-tenna and its surrounding atmosphere. However, the level of
1
hcap
x
y
z
rcap
patch antenna
copper cavity
SMA cable notch
July 8, 2013 DRAFT
Fig. 7. Schematic representation of the planar textile antenna encapsulatedby the copper cavity.
humidity inside the substrate is assumed to remain unchangedfor measurements that are performed sufficiently fast. Aftereach measurement, the antenna is placed back inside theclimate chamber. After the reflection coefficient measurementsof all twelve prototypes, the antennas were conditioned tothe next relative humidity level and this for 24 hours. Thisprocess was repeated until all reflection coefficients of thetwelve prototypes at nine different RH levels were measured.
3) Antenna Radiation Efficiency Measurements: For theefficiency measurements, the radiation pattern method is un-feasible since the measurement itself is too time consumingin order to ensure a constant level of humidity inside thesubstrate during the measurement. Therefore, we chose to usethe Generalized Wheeler cap method as described in [40].This method calculates the radiation efficiency of antennas bymeasuring the antenna input impedance for two different con-ditions. The first one is the free-space measurement whereasthe second one is performed by placing the antenna insidea closed metallic cavity. Hence, each free-space reflectioncoefficient measurement as described in Section IV-C wasaccompanied by a reflection coefficient measurement with theantenna positioned inside a copper cavity as shown in Fig. 7.The size of the cap was designed in order not to disturb thenear-field distribution of the antenna. A closed circular coppercavity was used with a radius rcap of 86 mm and a heighthcap of 50 mm. The excited eigenmodes of the cavity below3 GHz are the TMz
010, TMz110, TM
z210 and TEz111 modes,
which occur at 1.33 GHz, 2.13 GHz, 2.85 GHz and 3 GHz,respectively. A schematic overview of the antenna inside themetallic cavity is depicted in Fig. 7.
V. RESULTS AND VALIDATION OF THE TEXTILESUBSTRATES
The first step of the characterization process is applied tothe copper foil based antennas in order to extract εr andtan δ of the foam and fabric antenna substrates described inTable I. First, the results obtained through the use of errorfunction MSE1 are discussed. This to highlight the need forthe improved error function MSE2. Next, we describe theresults obtained using error function MSE2. In order notto overload this section, only the results of 4 materials arediscussed and presented.
8
A. Surrogate Modeling Optimization Setup
Concerning the characterization in step 1, for the copper-based antennas, constructed from fabric 5 and the foammaterial — which have an estimated permittivity close to oneand a small MR — the bounds are set to εr=[1 1.5] andtan δ=[0.0001 0.05]. For the substrate materials, exhibitinghigh MR with an estimated εr ≈ 1.8, the bounds are chosenεr=[1.5 2.6] and tan δ=[0.005 0.15]. For the characterizationprocess applied to the e-textile based antennas, i.e. step two,in which loss tangent extracted from step one is reused, thepermittivity optimization range was taken identical to step one.In this second step, the bounds of the effective conductivityare σ =[5.0× 10³S/m 5.0× 10⁶S/m].
B. Step 1 of the Characterization Process.
The extracted εr and tan δ at RH = 40% of the substratesfabric 1, fabric 4, fabric 5 and the foam substrate as wellas the optimum error function value MSE1,opt, are given inTable III. The absolute error between simulated and measuredresonance frequencies |∆fr| = |fr,s − fr,m| and the absoluteradiation efficiency errors |∆ecd,fr | = |ecd,fr,s − ecd,fr,m |are also listed in this Table. The results illustrated in Ta-ble III demonstrate a very good estimation of the extractedpermittivity for all materials since the resonance frequencyerror |∆fr| is very small, taking into account a measurementresolution of 1.25 MHz. Observing the optimal error functionvalues in Table III, the results for fabric 4 exhibit the highestaccuracy, whereas the results obtained for the foam substrateyields the largest error function value and thus the lowestaccuracy. However, a minimal error function value does notautomatically imply the highest accuracy of characterizationdue to uncertainties in the simulation model, as described inSection II-B, combined with measurement uncertainties. Thisis observed when comparing the results from fabric 1 andfabric 5. Fabric 5 exhibits a smaller MSE1,opt comparedto fabric 1 but has a larger |∆ecd,fr |. Assuming an exactknowledge of the antenna patch length L and a |∆fr| =1.3 MHz for fabric 1 and fabric 5 implies the same error inextracted εr for both substrates. From these two observations,we conclude that the estimated tan δ of fabric 5 exhibits thelargest error.
TABLE IIIOPTIMAL MATERIAL PARAMETERS EXTRACTED FROM MEASUREMENTS AT
RH = 40%
RH = 40% h εr tan δ MSE1,opt |∆fr| |∆ecd,fr |[mm] [MHz] [%]
Fig. 8 and Fig. 9 depict the extracted permittivities and losstangents for all substrates as a function of relative humidity,respectively. Fabric 1 and fabric 4 exhibit a clear increase inpermittivity and loss tangent for increasing relative humidity
levels due to their high MR. Furthermore, from the εr’s andtan δ’s as a function of RH it is clearly visible that fabric 1has higher MR compared to the fabric 4 substrate since theincrease in εr and tan δ is more pronounced for increasingRH levels. As reported in [14], for these fabrics, a quadraticbehavior of the permittivity as a function of RH is observed.For the foam and fabric 5 substrate it is not possible tocompare their MR by observing the behavior of εr and tan δas a function of RH and this due to geometrical uncertaintiescombined with measurement errors and the small MR value.In Fig. 9 we see that tan δ as a function of RH exhibits somediscrepancies as the results are not monotonically increasingfor increasing RH . In order to further verify the obtainedresults as a function of relative humidity, a comparison be-tween measured and simulated antenna efficiencies and all|∆fr|’s are depicted in Fig. 10 and Fig. 11, respectively. Thesimulated efficiencies and resonance frequencies are calculatedusing the electromagnetic properties depicted in Fig. 8 and Fig.9. From the resonance frequency errors we conclude that theextracted permittivities are very accurate since most resonancefrequency errors remain below 4 MHz. By comparing simu-lated and measured radiation efficiencies, we conclude that theextracted loss tangent results are accurate for fabric 1, fabric4 and the foam substrate, keeping in mind that the measuredantenna radiation efficiencies also exhibit discrepancies dueto the measurement accuracy. For the fabric 5 substrate, itis observed that all extracted tan δ’s are overestimated sinceecd,fr,s < ecd,fr,m and this for all RH levels. Note that ecddepends both on tan δ and εr, and since extracted εr’s showa good accuracy, the discrepancies between simulated andmeasured ecd allows verifying the accuracy of the estimatedtan δ’s.
From the results of the characterization process based on theerror function (1) applied to the copper foil based antennas,we conclude that a very good accuracy is obtained in extractedcomplex permittivities of the fabric 1 and fabric 4 substrate.For the two remaining substrates, the estimated loss tangentsare less accurate. As seen in the kriging surrogate model givenin Fig. 4, the error function’s dependency on loss tangentis poor. This, together with the simplifications made in thesimulation model, yields larger errors in the characterizationprocess. More in particular, for thicker substrates connectormounting is harder to realize, introducing additional losses thatare not accounted for in the simulation model. If these thickersubstrates exhibit low tan δ, the additional losses caused bythe low-quality connector mounting will dominate the lossesthat are captured in the measured reflection coefficient of theantenna.
1) Results Based on Error Function MSE2: For low-lossthick substrates, the use of error function MSE1 in step 1yields a large error in estimated tan δ. However, the extractedtan δ from step 1 is used in step 2 of the characterizationprocess. Therefore, we must know tan δ with a high degree ofaccuracy in order to obtain a good estimation of the e-textile’seffective conductivity. Therefore, MSE2 given by (2) wasutilized for extracting εr and tan δ in step 1. Since MSE2 in-cludes a comparison between measured and simulated antennaefficiency, the kriging model will exhibit a higher dependency
Fig. 10. Comparison between measured and simulated ecd at their respectivefr . Simulation results based on estimated dielectric properties, utilizing errorfunction MSE1.
Fig. 11. Resonance frequency errors, based on estimated dielectric propertiesutilizing error function MSE1.
1.41.6
1.82
2.22.4
00.025
0.050.075
0.10.125
0.150
20
40
60
80
100
εrtan δ
MS
E2
Fig. 12. Final kriging model based on error function MSE2 in step 1,copper based fabric 1 antenna, RH=40%
on loss tangent. As outlined in Section II, the weighting factorsa1 and a2 in (2) are chosen 1 and 100, respectively.
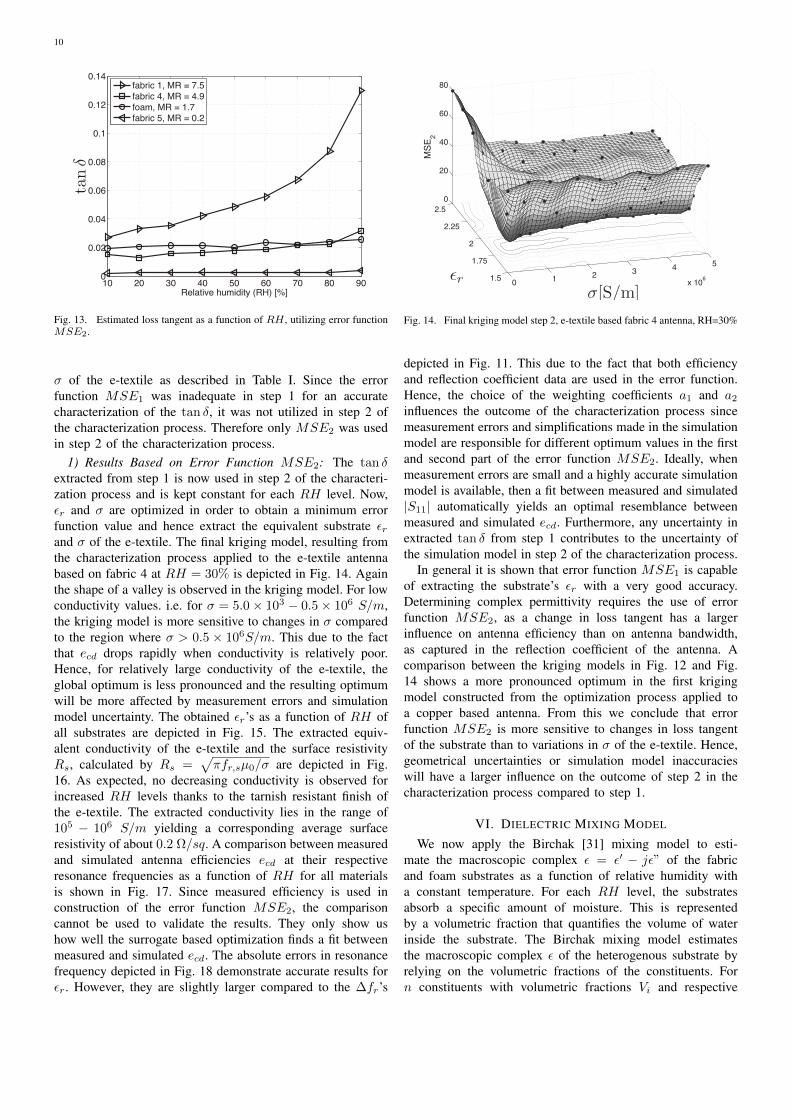
The final kriging model, resulting from the optimizationapplied to the copper-based antenna relying on fabric 1 atRH = 40% is depicted in Fig. 12. The valley shape isno longer present in the kriging model and the optimumsubstrate’s εr and tan δ is clearly visible. In order not tooverload the paper, only extracted tan δ’s as a function ofRH are given in Fig. 13. A clear relation between materialMR and the slope of the tan δ curve as a function of RH isobserved. Even a slightly larger increase in tan δ is observedfor the foam compared to the fabric 5 material, as expectedfrom their MR. Clearly, to characterize loss tangent, utilizing(2) in the characterization process yields more accurate resultscompared to (1).
C. Step 2 of the Characterization Process.
The second step of the characterization process is applied tothe e-textile based antennas in order to extract the equivalentεr of the foam and fabric antenna substrates as well as the
Fig. 13. Estimated loss tangent as a function of RH , utilizing error functionMSE2.
σ of the e-textile as described in Table I. Since the errorfunction MSE1 was inadequate in step 1 for an accuratecharacterization of the tan δ, it was not utilized in step 2 ofthe characterization process. Therefore only MSE2 was usedin step 2 of the characterization process.
1) Results Based on Error Function MSE2: The tan δextracted from step 1 is now used in step 2 of the characteri-zation process and is kept constant for each RH level. Now,εr and σ are optimized in order to obtain a minimum errorfunction value and hence extract the equivalent substrate εrand σ of the e-textile. The final kriging model, resulting fromthe characterization process applied to the e-textile antennabased on fabric 4 at RH = 30% is depicted in Fig. 14. Againthe shape of a valley is observed in the kriging model. For lowconductivity values. i.e. for σ = 5.0× 10³ − 0.5× 10⁶ S/m,the kriging model is more sensitive to changes in σ comparedto the region where σ > 0.5 × 10⁶S/m. This due to the factthat ecd drops rapidly when conductivity is relatively poor.Hence, for relatively large conductivity of the e-textile, theglobal optimum is less pronounced and the resulting optimumwill be more affected by measurement errors and simulationmodel uncertainty. The obtained εr’s as a function of RH ofall substrates are depicted in Fig. 15. The extracted equiv-alent conductivity of the e-textile and the surface resistivityRs, calculated by Rs =
√πfr,sµ0/σ are depicted in Fig.
16. As expected, no decreasing conductivity is observed forincreased RH levels thanks to the tarnish resistant finish ofthe e-textile. The extracted conductivity lies in the range of105 − 106 S/m yielding a corresponding average surfaceresistivity of about 0.2 Ω/sq. A comparison between measuredand simulated antenna efficiencies ecd at their respectiveresonance frequencies as a function of RH for all materialsis shown in Fig. 17. Since measured efficiency is used inconstruction of the error function MSE2, the comparisoncannot be used to validate the results. They only show ushow well the surrogate based optimization finds a fit betweenmeasured and simulated ecd. The absolute errors in resonancefrequency depicted in Fig. 18 demonstrate accurate results forεr. However, they are slightly larger compared to the ∆fr’s
0 1 2 3 4 5
x 1061.5
1.75
2
2.25
2.50
20
40
60
80
σ[S/m]εr
MS
E2
Fig. 14. Final kriging model step 2, e-textile based fabric 4 antenna, RH=30%
depicted in Fig. 11. This due to the fact that both efficiencyand reflection coefficient data are used in the error function.Hence, the choice of the weighting coefficients a1 and a2influences the outcome of the characterization process sincemeasurement errors and simplifications made in the simulationmodel are responsible for different optimum values in the firstand second part of the error function MSE2. Ideally, whenmeasurement errors are small and a highly accurate simulationmodel is available, then a fit between measured and simulated|S11| automatically yields an optimal resemblance betweenmeasured and simulated ecd. Furthermore, any uncertainty inextracted tan δ from step 1 contributes to the uncertainty ofthe simulation model in step 2 of the characterization process.
In general it is shown that error function MSE1 is capableof extracting the substrate’s εr with a very good accuracy.Determining complex permittivity requires the use of errorfunction MSE2, as a change in loss tangent has a largerinfluence on antenna efficiency than on antenna bandwidth,as captured in the reflection coefficient of the antenna. Acomparison between the kriging models in Fig. 12 and Fig.14 shows a more pronounced optimum in the first krigingmodel constructed from the optimization process applied toa copper based antenna. From this we conclude that errorfunction MSE2 is more sensitive to changes in loss tangentof the substrate than to variations in σ of the e-textile. Hence,geometrical uncertainties or simulation model inaccuracieswill have a larger influence on the outcome of step 2 in thecharacterization process compared to step 1.
VI. DIELECTRIC MIXING MODEL
We now apply the Birchak [31] mixing model to esti-mate the macroscopic complex ε = ε′ − jε” of the fabricand foam substrates as a function of relative humidity witha constant temperature. For each RH level, the substratesabsorb a specific amount of moisture. This is representedby a volumetric fraction that quantifies the volume of waterinside the substrate. The Birchak mixing model estimatesthe macroscopic complex ε of the heterogenous substrate byrelying on the volumetric fractions of the constituents. Forn constituents with volumetric fractions Vi and respective
Fig. 17. Comparison between measured and simulated ecd. Simulationresults based on estimated dielectric properties and conductivity, utilizing errorfunction MSE2.
Fig. 18. Resonance frequency errors, based on estimated dielectric propertiesand conductivity, utilizing error function MSE2.
complex εi, the macroscopic permittivity of foam/fabric isgiven by [31]
εα =
n∑
i
Viεαi , (4)
with α being a constant shape factor. For fabric and foammaterials, which are three-phase materials consisting of bulkmaterial, air and foam, we have that
εα = Vmεαm + Vwε
αw + V αa , (5)
where the subscripts m, w and a refer to the bulk fabric orfoam material, water and air, respectively. Since the volumetricfraction of air is not easily determined, we make an approxi-mation by assuming that the bulk fabric material and air formone homogenous substrate with a complex permittivity andvolumetric fraction denoted by εm,a and Vm,a, respectively.Hence, (5) simplifies to
εα = Vm,aεαm,a + Vwεw. (6)
In (6), one can easily measure Vw at one specific RH-level by comparing the dry mass of the substrate with theconditioned mass obtained by conditioning the substrates inthe climatic chamber according to the procedure presentedin Section IV. Hence, the volumetric fraction of the bulkmaterial/air substrate equals Vm,a = 1 − Vw. In additionwe neglect the small increase in volume of the substratedue to swelling of the fibres when absorbing moisture. Itis clear that both simplifications reduce the accuracy of themixing model at high RH-levels and for high MR materials.The complex εm,a of the dry substrates were determined bymeans of the characterization procedure applied to the copperbased antennas. The value of the complex permittivity εwof water was calculated according to the Debye dispersionmodel as presented in [41]. The value of the shape factorα was determined separately for ε′ and ε” by minimizingthe mean squared error between the measured and modeledε′ and ε”. The measured ε′ and ε” are obtained from thecharacterization process applied to the copper based antennas
12
0.001 0.002 0.003 0.004 0.005 0.0061.14
1.16
1.18
1.2
1.22
1.24
1.26
1.28ε′
Volumetric fraction, Vw [m−3/m−3 ]
measured
modeled
Foam
Fabric 5
Fig. 19. Comparison between the measured and estimated εr by relying onthe Birchak Mixing model of the substrates exhibiting low MR.
0.01 0.02 0.03 0.04 0.05 0.061.6
1.8
2
2.2
2.4
2.6
ε′
Volumetric fraction, Vw [m−3/m−3 ]
modeled
measuredFabric 1
Fabric 2
Fabric 4
Fabric 3
Fig. 20. Comparison between the measured and estimated εr by relying onthe Birchak Mixing model of the substrates exhibiting high MR.
using the cost function MSE1 and MSE2, respectively, asMSE1 provides more reliable results for the real part of thecomplex permittivity whereas MSE2 yields more reliable losstangents of the substrate materials. A comparison betweenthe measured and modeled ε′ for the substrates exhibitinghigh MR and low MR is given in Fig. 19 and Fig. 20,respectively. Measured and modeled ε” is given in Fig. 21and Fig. 22 for the substrate materials exhibiting high MR andlow MR, respectively. Generally, it is observed that the modeloverestimates complex permittivity of the substrates for lowvolumetric fractions of water Vw whereas an underestimationis seen at high Vw. Also, the model exhibits a linear behaviorof complex permittivity as a function of Vw which is notobserved in the measurements of the high MR fabrics 1, 2,3 and 4. However the slope of this linear behavior fits themeasured data relatively well.
The accuracy of the dielectric mixing model prediction forε′ and ε” is listed in Table IV and Table V, respectively. Theabsolute mean error between the modeled and measured realpart and imaginary part of the complex permittivity is denoted
0.001 0.002 0.003 0.004 0.005 0.0060
0.005
0.01
0.015
0.02
0.025
0.03
0.035
ε”
Volumetric fraction, Vw [m−3/m−3 ]
Foam
modeled
measured
Fabric 5
Fig. 21. Comparison between the measured and estimated ε” by relying onthe Birchak Mixing model of the substrates exhibiting low MR.
0.01 0.02 0.03 0.04 0.05 0.060
0.05
0.1
0.15
0.2
0.25
0.3
0.35
0.4
ε”
Volumetric fraction, Vw [m−3/m−3 ]
Fabric 4
Fabric 2Fabric 3
Fabric 1
modeled
measured
Fig. 22. Comparison between the measured and estimated ε” by relying onthe Birchak Mixing model of the substrates exhibiting high MR.
by ∆ε′ and ∆ε”, and the corresponding standard deviationis denoted by SD. In order to compare the accuracy of thepredicted ε′ with the accuracy of the characterization method,we extracted ε′ for all substrate materials at RH = 40%and this for a geometrical tolerance of +/ − 0.5mm in thelength of the patch L. Since the length of the patch has thelargest influence on the resonance frequency of the antenna,an estimation of the characterization procedure’s accuracy withrespect to the calculation of ε′ is provided by this approach.The absolute errors between extracted ε for L − 0.5mm andL + 0.5mm and the nominal extracted ε′ at RH = 40% aredenoted by ∆ε′L+0.5mm and ∆ε′L−0.5mm, respectively and arealso given in Table IV. Comparing ∆ε′ with the estimatedaccuracy of the characterization procedure shows us that theerror of the dielectric mixing model is comparable for thefabric substrates 1 and 2, which have the highest MR. Fordecreasing MR the mixing model becomes more and moreaccurate.
A similar approach was applied to evaluate the accuracyof the modeled ε”, given the accuracy of the characterization
13
TABLE IVACCURACY OF THE MODEL PREDICTIONS VERSUS TOLERANCE IN
EXTRACTED ε′ DUE TO UNCERTAINTY IN PATCH LENGTH OF +/- 0.5MM
method. We extracted ε” for all substrate materials at RH =40% and this under the assumption of an antenna efficiencymeasurement error of +/ − 5%. This approach allows us toestimate the characterization procedure’s accuracy with respectto ε”, since the substrate losses have a pronounced influence onantenna efficiency, as seen from the kriging models based onerror function MSE2. The absolute errors between extractedε” for ecd − 5% and ecd + 5% and the nominal extracted ε”at RH = 40% are denoted by ∆ε”ecd−5% and ∆ε”ecd+5%,respectively and are also listed in Table V. Similar to the realpart of ε, the error in modeled ε” is comparable with theestimated accuracy of the characterization procedure for thesubstrates exhibiting a high MR, whereas for the substrateswith low losses and low MR, the accuracy of the modeled ε′
increases.
VII. CONCLUSIONS
In this paper, a novel and dedicated characterization ap-proach for determining the constitutive properties of all ma-terials comprised in textile antenna design was proposed andthis for altering environmental conditions. The characteriza-tion technique has the advantage of being simple in samplepreparation compared to resonator cavity perturbation methodsor transmission line methods. Only two reflection coefficientmeasurements are required, yielding small measurement times.Moreover, the surrogate-based optimization approach is effi-cient in terms of number of sample evaluations and provides anaccurate solution to the inverse problem. Errors in extractedelectromagnetic properties result from simplifications in thesimulation model and measurement errors. In particular, dis-carding the SMA connector in the simulation model results
in an uncertainty in measured reflection coefficient. This hasan influence on how well measured bandwidth relates to thesubstrate losses. In particular, low loss substrates are more sen-sitive to this simplification of the simulation model, comparedto substrates exhibiting high dielectric losses. A combinationof two antenna figures of merit, being antenna efficiency andantenna reflection coefficient, makes the characterization pro-cess less sensitive to measurement errors that relate dielectriclosses with measured antenna performances. In addition, adielectric mixing model based upon the volumetric fractionof the absorbed moisture in the substrates was developed. It isshown that the accuracy of the modeled complex permittivityof the fabric substrates exhibiting a high moisture regain iscomparable with the estimated accuracy of the characterizationprocedure. For the substrates with a low MR, the accuracy ofthe dielectric mixing model increases.
REFERENCES
[1] P. Massey, “Mobile phone fabric antennas integrated within clothing,”in Antennas and Propagation, 2001. Eleventh International Conferenceon (IEE Conf. Publ. No. 480), vol. 1, 2001.
[2] P. Salonen and L. Hurme, “A novel fabric WLAN antenna for wear-able applications,” in Antennas and Propagation Society InternationalSymposium, 2003. IEEE, vol. 2, june 2003, pp. 700–703.
[3] A. Tronquo, H. Rogier, C. Hertleer, and L. V. Langenhove, “Robustplanar textile antenna for wireless body LANs operating in 2.45GHzISM band,” IEE Electronics Letters, vol. 42, no. 3, pp. 142–143,February. 2006.
[4] M. Klemm, I. Locher, and G. Troster, “A novel circularly polarizedtextile antenna for wearable applications,” in Microwave Conference,2004. 34th European, vol. 1, oct. 2004, pp. 137–140.
[5] T. Kennedy, P. Fink, A. Chu, N. Champagne, G. Lin, and M. Khayat,“Body-worn e-textile antennas: The good, the low-mass, and the confor-mal,” Antennas and Propagation, IEEE Transactions on, vol. 57, no. 4,pp. 910–918, april 2009.
[6] C. Hertleer, H. Rogier, L. Vallozzi, and L. Van Langenhove, “A textileantenna for off-body communication integrated into protective clothingfor fire-fighters,” IEEE Trans. Antennas Propag., Special Issue onAntennas and Propagation for Body-Centric Wireless Communications,vol. 57, no. 4, Part 1, pp. 919–925, Apr. 2009.
[7] L. Vallozzi, H. Rogier, and C. Hertleer, “Dual polarized textile patchantenna for integration into protective garments,” Antennas and WirelessPropagation Letters, IEEE, vol. 7, pp. 440–443, 2008.
[8] M. L. Scarpello, I. Kazani, C. Hertleer, H. Rogier, and D. Vande Ginste,“Stability and efficiency of screen printed wearable and washableantennas,” Antennas and Wireless Propagation Letters, IEEE, vol. PP,no. 99, p. 1, 2012.
[9] A. Dierck, F. Declercq, and H. Rogier, “Review of active textile antennaco-design and optimization strategies,” in 2011 IEEE internationalconference on RFID-technologies and applications, Proceedings. IEEE,2011, pp. 194–201.
[10] D. Cottet, J. Gryzb, T. Kirstein, and G. Troster, “Electrical characteriza-tion of textile transmission lines,” IEEE Trans. on Advanced Packaging,vol. 26, no. 2, pp. 182–190, May. 2003.
[11] J. Lilja and P. Salonen, “Textile material characterization for softwearantennas,” in Proceedings of the 28th IEEE conference on Militarycommunications, Piscataway, NJ, USA, 2009, pp. 628–634.
[12] F. Declercq, H. Rogier, and C. Hertleer, “Permittivity and loss tangentcharacterization for garment antennas based on a new matrix-pencil two-line method,” Antennas Propag., IEEE Trans., vol. 56, no. 8, pp. 2548–2554, Aug. 2008.
[13] L. F. Chen, C. K. Ong, C. P. Neo, V. V. Varadan, and V. K. Varadan,Microwave electronics: Measurements and Materials Characterization,1st ed. Chichester, West Sussex P019 8SQ U.K.: John Wiley & SonsLtd, 2004.
[14] C. Hertleer, A. Van Laere, H. Rogier, and L. Van Langenhove, “Influenceof relative humiditiy on textile antenna performance,” Tex Res J, vol. 2,pp. 177–183, 2010.
14
[15] S. Sankaralingam and B. Gupta, “Determination of dielectric constant offabric materials and their use as substrates for design and development ofantennas for wearable applications,” Instrumentation and Measurement,IEEE Transactions on, vol. 59, no. 12, pp. 3122–3130, Dec. 2010.
[16] R. Shaw, B. Long, D. Werner, and A. Gavrin, “The characterization ofconductive textile materials intended for radio frequency applications,”Antennas and Propagation Magazine, IEEE, vol. 49, no. 3, pp. 2–40,Jun. 2007.
[17] O. Yuehui and W. Chappell, “High frequency properties of electro-textiles for wearable antenna applications,” Antennas Propag., IEEETrans., vol. 56, no. 2, pp. 381–389, Feb. 2008.
[18] J. Lilja, P. Salonen, and P. de Maagt, “Characterization of conductivetextile materials for softwear antenna,” in Antennas and PropagationSociety International Symposium, 2009. IEEE, Jun. 2009, pp. 1–4.
[19] ——, “Environmental characterization of industrial fabric for softwearantenna,” in Antennas and Propagation Society International Sympo-sium, 2009. IEEE, Jun. 2009, pp. 1–4.
[20] K. Bal and V. K. Kothari, “Measurement of dielectric propeties of textilematerials and their applications,” Indian Journal of Fibre and TextileResearch, vol. 34, pp. 191–199, Jun 2009.
[21] T. Kaija, J. Lilja, and P. Salonen, “Exposing textile antennas for harshenvironment,” in Military Communications Conference, 2010 - MILCOM2010, 31 2010-nov. 3 2010, pp. 737–742.
[22] I. Couckuyt, F. Declercq, T. Dhaene, H. Rogier, and L. Knockaert,“Surrogate-based infill optimization applied to electromagnetic prob-lems,” Int. J. RF Microw. Comput.-Aided Eng., vol. 20, no. 5, pp. 492–501, Sept. 2010.
[23] J. Zhang, M. Koledintseva, J. Drewniak, D. Pommerenke, R. DuBroff,Z. Yang, W. Cheng, K. Rozanov, G. Antonini, and A. Orlandi, “Recon-struction of dispersive dielectric properties for PCB substrates using agenetic algorithm,” Electromagnetic Compatibility, IEEE Transactionson, vol. 50, no. 3, pp. 704–714, Aug. 2008.
[24] E. Kilic, U. Siart, and T. Eibert, “Regularized 1-D dielectric profileinversion in a uniform metallic waveguide by measurement and simula-tion,” Microwave Theory and Techniques, IEEE Transactions on, vol. 60,no. 5, pp. 1437–1443, May 2012.
[25] D. Popovic, L. McCartney, C. Beasley, M. Lazebnik, M. Okoniewski,S. Hagness, and J. Booske, “Precision open-ended coaxial probesfor in vivo and ex vivo dielectric spectroscopy of biological tissuesat microwave frequencies,” Microwave Theory and Techniques, IEEETransactions on, vol. 53, no. 5, pp. 1713–1722, May 2005.
[26] S. Lambot, E. Slob, I. Van Den Bosch, B. Stockbroeckx, and M. Van-clooster, “Modeling of ground-penetrating radar for accurate charac-terization of subsurface electric properties,” Geoscience and RemoteSensing, IEEE Transactions on, vol. 42, no. 11, pp. 2555–2568, Nov.2004.
[27] I. Rekanos, “Neural-network-based inverse-scattering technique for on-line microwave medical imaging,” Magnetics, IEEE Transactions on,vol. 38, no. 2, pp. 1061–1064, Mar 2002.
[28] E. Bermani, S. Caorsi, and M. Raffetto, “Microwave detection anddielectric characterization of cylindrical objects from amplitude-onlydata by means of neural networks,” Antennas and Propagation, IEEETransactions on, vol. 50, no. 9, pp. 1309–1314, Sep 2002.
[29] M. Simsek and N. Tezel, “The reconstruction of shape and impedanceexploiting space mapping with inverse difference method,” Antennas andPropagation, IEEE Transactions on, vol. 60, no. 4, pp. 1868–1877, April2012.
[30] K. Bal and V. K. Kothari, “Permittivity of woven fabrics: A comparisonof dielectric formulas for air-fiber mixture,” Dielectrics and ElectricalInsulation, IEEE Transactions on, vol. 17, no. 3, pp. 881–889, June2010.
[31] M. Dobson, F. Ulaby, M. Hallikainen, and M. El-Rayes, “Microwavedielectric behavior of wet soil-part ii: Dielectric mixing models,” Geo-science and Remote Sensing, IEEE Transactions on, vol. GE-23, no. 1,pp. 35–46, Jan. 1985.
[32] F. Bouttout, F. Benabdelaziz, A. Benghalia, D. Khedrouche, and T. For-taki, “Uniaxially anisotropic effects on resonance of rectangular mi-crostrip patch antenna,” IEE Electronics Letters, vol. 35, no. 4, pp. 255–256, February. 1999.
[33] “Theory of operation for momentum,” Agilent Technologies. [Online].Available: http://edocs.soco.agilent.com
[34] D. R. Jones, M. Schonlau, and W. J. Welch, “Efficient global optimiza-tion of expensive black-box functions,” Journal of Global Optimization,vol. 13, no. 4, pp. 455–492, 1998.
[35] J. P. C. Kleijnen, W. van Beers, and I. van Nieuwenhuyse, “Expectedimprovement in efficient global optimization through bootstrapped krig-
ing,” Journal of global optimization, vol. 54, no. 1, pp. 59–73, Sept.2012.
[36] Rogers Corporation, “RO4000 series high fre-quency circuit materials.” [Online]. Available:http://www.rogerscorp.com/documents/726/acm/RO4000-Laminates
[37] [Online]. Available: http://sumo.intec.ugent.be[38] [Online]. Available: http://www.lessemf.com/1212.pdf[39] P. Barthia, I. Bahl, R. Garg, and A. Ittipiboon, Microstrip Antenna
Design Handbook. Artech House Publishers., 1987.[40] R. Johnston and J. McRory, “An improved small antenna radiation-
efficiency measurement method,” Antennas Propag. Mag., IEEE, vol. 40,no. 5, pp. 40–48, oct 1998.
[41] R. Buchner, J. Barthel, and J. Stauber, “The dielectric relaxation of waterbetween 0C and 35C,” Chemical Physics Letters, vol. 306, no. 1–2,pp. 57 – 63, 1999.
Frederick Declercq received his M.Sc. degree inelectronic engineering from Howest, university col-lege West Flanders, Kortrijk, Belgium. He receivedthe Ph.D. degree in electrical engineering at thefaculty of engineering at Ghent University, Ghent,Belgium, in 2011. Since September 2005, he hasbeen with the electromagnetics group, departmentof Information Technology (INTEC) at Ghent Uni-versity. He is currently conducting his postdoctoralresearch at IMEC. His research interests are elec-tromagnetic characterization of textile materials and
flexible foam materials, the design of wearable active textile antennas andenergy scavenging techniques for wireless sensor nodes applied in body areanetworks.
Ivo Couckuyt received his M.Sc. degree in Com-puter Science from the University of Antwerp (UA)in 2007. He received his Ph.D. degree in Engineeringfrom Ghent University, Ghent, Belgium, in 2013.Starting from June 2013 he is active as a postdoctoralfellow in the INTEC Broadband CommunicationNetworks (IBCN) research group of the Depart-ment of Information Technology (INTEC), GhentUniversity, Belgium. His research activities includemachine learning, bioinformatics, optimal design,numerical analysis techniques, surrogate modeling,
surrogate-based optimization and inverse modeling of time-consuming prob-lems.
Hendrik Rogier was born in 1971. He received theElectrical Engineering and the Ph.D. degrees fromGhent University, Gent, Belgium, in 1994 and in1999, respectively. He is currently a Full Professorwith the Department of Information Technology.From October 2003 to April 2004, he was a Visit-ing Scientist at the Mobile Communications Groupof Vienna University of Technology. He authoredand coauthored about 80 papers in internationaljournals and about 100 contributions in conferenceproceedings. He is serving as a member of the
Editorial Boarding of IET Science, Measurement Technology and acts asthe URSI Commission B representative for Belgium. His current researchinterests are the analysis of electromagnetic waveguides, electromagneticsimulation techniques applied to electromagnetic compatibility (EMC) andsignal integrity (SI) problems, as well as to indoor propagation and antennadesign, and in smart antenna systems for wireless networks. Dr. Rogier wastwice awarded the URSI Young Scientist Award, at the 2001 URSI Symposiumon Electromagnetic Theory and at the 2002 URSI General Assembly. He isa Senior Member of the IEEE.
15
Tom Dhaene received the Ph.D. degree in elec-trotechnical engineering from Ghent University,Ghent, Belgium, in 1993. In 1993, he joined theEDA company Alphabit (now part of Agilent). Hewas one of the key developers of the planar EM sim-ulator ADS Momentum, ADS Model Composer, andADS Broadband SPICE. Since 2007, he has been aFull Professor with the Department of InformationTechnology (INTEC), Ghent University - iMINDS.He has authored or coauthored more than 250 peer-reviewed papers and abstracts in international con-
ference proceedings, journals, and books. He is the holder of 5 U.S. patents.