22
Environmental Levels of Radium in Water of Central New York Thomas F. Kraemer U.S. Geological Survey, Reston, VA December 4, 2010 Finger Lakes Research Conference

Environmental Levels of Radium in
Water of Central New York
Thomas F. KraemerU.S. Geological Survey, Reston, VA
December 4, 2010
Finger Lakes Research Conference

How Does Radium Get Into Groundwater?
• Decay of uranium and thorium, mostly in rocks and minerals, produces radium isotopes.
• Dissolution of host phase releases radium to solution.
• Alpha-particle recoil during decay of parent also releases radium directly to solution.
• High salinity keeps radium isotopes in solution.

Modified from Schmidt and Kirk, 2010
Uranium and Thorium Decay Chains
t1/2=1600 y
t1/2=5.8 y
Th/U Ratios:
Sandstone: ~4
Black Shale: ~0.2
Slide provided by Elizabeth Rowan, USGS

Compiled by W. Lasseter
Slide provided by Elizabeth Rowan, USGS

Why Should We Care About Radium?
• Isotopic variations of radium can be used as hydrologic tracers to identify sources and mixing of water bodies.
• Radium can be an environmental contaminant.

Approx. northern limit of Utica Shale
Approx. northern limit of Marcellus Shale
Detailed USGS surface water/ near-surface water
sampling areas
USGS Radium
Sampling Regions
in Central NY

Mean 226Ra Values, in dpm/L
Seneca
0.040
Keuka
0.020
Cayuga
0.046
Owasco
0.037
Skaneateles
0.036
Otisco
0.032Canandaigua
0.027Conesus
0.013
Hemlock
0.019
Canadice
0.006
Honeoye
0.012
Taughannock
Creek
Salmon
Creek
Fall
Creek
0.0310.067
0.034

Mean 228Ra/226Ra Activity Ratios
Seneca
0.69
Keuka
1.02
Cayuga
0.77
Owasco
080
Skaneateles
0.85
Otisco
0.89Canandaigua
0.80Conesus
0.97
Hemlock
0.98
Canadice
1.01
Honeoye
0.93
Taughannock
Creek
Salmon
Creek
Fall
Creek
0.900.83
0.83

Riv
er
8
6
5
4
3
2
1
G
F
D
E
C
A
H
B
7
I
J
Susquehanna/Unadilla River Basin Radium Values
Site # 226 Ra* 228/226
Rivers
1 0.04 1.0
2 0.03 0.8
3 0.07 0.8
4 0.05 0.8
5 0.08 0.9
6 0.11 0.8
7 0.09 0.8
8 0.03 0.8
Tributaries
A 0.02 1.0
B 0.02 1.1
C 0.02 1.1
D 0.02 1.0
E 0.04 1.0
F 0.03 0.9
G 0.02 0.7
H 0.14 0.6
I 0.11 0.6
J 0.15 0.7
(*in dpm/L)

23
4
1
Site # 226 Ra* 228/226
1 – Lake (mean, 15 sites) 0.040 0.78
2 -- Stream 0.035 0.78
3 -- Stream 0.081 0.67
4 -- Stream 0.043 0.76
Otsego Lake Radium Values
(*in dpm/L)

226Ra Activity
<10 dpm/L
10-100 dpm/L
100-250 dpm/L
> 250 dpm/L
Onondaga Lake Area Radium Values
Site Sample Type 226 Ra* 228/226
1 lake (mean, 18 sites) 0.17 1.58
2 bedrock well 1464 0.71
3a deep alluvium well 1.3 0.86
3b bedrock well 11.9 1.49
4a shallow alluvium well 10.5 3.31
4b deep alluvium well 34.4 2.25
5a deep alluvium well 17.3 3.02
5b bedrock well 81.8 2.09
6 bedrock well 249 1.19
7 creek 0.56 2.48
8 bedrock well 203 1.75
9 spring 8.0 4.39
10 deep alluvium well 13.3 2.90
11 city water 0.12 1.23
12 deep alluvium well 38.0 1.86
13 spring 5.2 8.28
14a shallow alluvium well 4.1 11.53
14b deep alluvium well 37.6 2.25
15a deep alluvium well 2.14 2.38
15b bedrock well 122 1.1
16 deep alluvium well 16.7 2.69
17 spring 0.51 1.27
3a
2
3b 4b4a
15b
5a 6 8
7
9
10
1112
15b
13
14b
17
16
14a
15a
(*in dpm/L)

0
20
40
60
80
100
1 2 3 4 5 6
Nu
mb
er
226Ra, dpm/L Activity Interval
Distribution of 226Ra Activities
0 0.5 1 10 100 1000 2000

0
10
20
30
40
50
60
70
1 2 3 4 5 6 7 8 9 10
Nu
mb
er
228Ra/226Ra Activity Ratio Interval
Distribution of Radium Isotope Ratios
0 0.5 1 1.5 2 2.5 3 3.5 4 10 15

NY
TN
KYWV
OH
PA
AL
S
D
S
M
O
O
P
Pm
D
M
P
O
Geology from King & Biekman (1974)
Slide provided by Elizabeth Rowan, USGS
Geologic Map of Central Eastern U.S.
Approximate Outline
of Appalachian
Basin

Stratigraphy
(SW New York)
Gas reservoir
Oil reservoir Huntersville Chert /
(after Van Tyne+Copely,
1983)
Slide provided by
Elizabeth Rowan, USGS

Existing Oil and Gas Production Wells
Marcellus data
PA DEP (Prof. C. Kirby, 2010)
NY DEC (2009)
Non-Marcellus data
NY DEC (1999)
PA DEP (1992)
Dresel + Rose (2010)
Public domain

y = 1.68x - 5.92
R2 = 0.59y = 1.65x - 5.32
R2 = 0.65
1.0
1.5
2.0
2.5
3.0
3.5
4.0
4.0 4.5 5.0 5.5
TDS
Cl
Linear(TDS)Linear(Cl)
Log R
a (
tota
l, p
Ci/L)
Source: PA DEP NORM Survey1992
Log TDS or Log Cl (mg/L)
(Cambrian – Mississippian reservoirs)10,000
1,000
100
10
Slide provided by Elizabeth Rowan, USGS
Ra vs. Cl and TDS, Oil and Gas Well Brines, PA

100,000
10,000
1,000
100
10
1
0
Ac
tivit
y (
pC
i/L
)
L. Silurian–
DevonianDresel+Rose (2010)
Cambrian–
DevonianNY DEC (1999)
Marcellus
ShalePA DEP (2009-10)
Cambrian-
MississippianPA DEP (1992)
Marcellus
ShaleNYSDEC (2009)
Radium Activity Ranges in Produced Water, NY and PA
Industrial Effluent Limit
Median
Marcellus Shale Data
Non-Marcellus Shale Data
Slide provided by Elizabeth Rowan, USGS

Ra228/Ra226 vs. Ra (total)
0 4,000 8,000 12,000 16,000
Ra
228/R
a226
0
1.0
4.0
0.5
2.0
3.0
1.5
2.5
3.5
4.5
Total Radium (pCi/L)
Camb.-Ord. Ss+Sh (NYSDEC, 1999; PA DEP, 1992)
Marcellus Shale (NY DEC, 2009)
Marcellus Shale (PA DEP, 2009-10; Prof.
C. Kirby & students)
L. Devonian Oriskany, Huntersville (NYSDEC, 1999; PA DEP, 1992)
L. Silurian, Medina Ss (NYSDEC, 1999)
U. Silurian Dol (NYSDEC,1999)
U. Dev. Ss (PA DEP, 1992)
Slide provided by Elizabeth Rowan, USGS
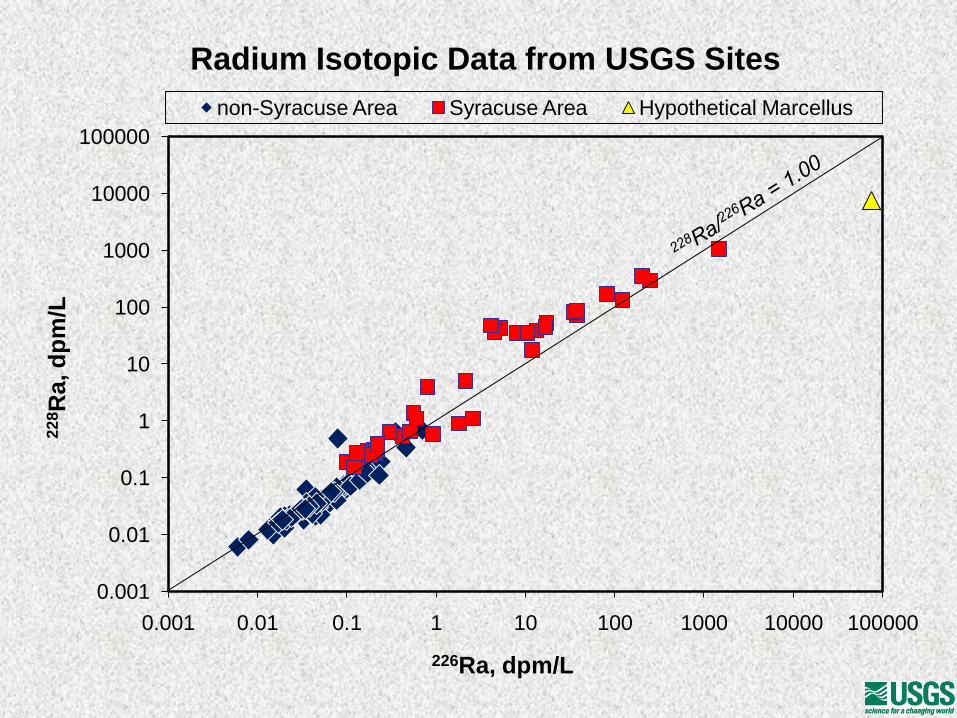
0.001
0.01
0.1
1
10
100
1000
10000
100000
0.001 0.01 0.1 1 10 100 1000 10000 100000
22
8R
a, d
pm
/L
226Ra, dpm/L
Radium Isotopic Data from USGS Sites
non-Syracuse Area Syracuse Area Hypothetical Marcellus

Conclusions• Radium levels are low in most surface waters and
near-surface waters of Central New York State.
• Syracuse/Onondaga area has high radium in bedrock wells that penetrate shale, but that water is very saline and non-potable.
• The vast majority of the 228Ra/226Ra Activity Ratios in the sampled waters is > 0.5.
• If water from Marcellus and other U-rich black shales is highly saline and radium rich, with a 228Ra/226Ra ratio < 0.5, then any contamination of a water body by this brine should be recognized by its isotopic signature.


![Resort Municipality Initiative - Radium Hot Springs 2014 Annual RMI... · Resort nicipal Initiative Report for Year 2014 - Village of Radium Hot Springs - [1] Radium Resort Municipality](https://static.documents.pub/doc/80x56/5b880db67f8b9a3d028c72be/resort-municipality-initiative-radium-hot-2014-annual-rmi-resort-nicipal.jpg)


