DTI – Update of WEEE Directive study – February 2002 Page 1 This report has been prepared by PricewaterhouseCoopers solely for its client, the DTI, without any third parties in mind. PricewaterhouseCoopers accepts no liability, responsibility or duty of care to any third parties that receive this report or use the data and information contained herein, and such third parties assume the entire risk and liability for any actions they may take or refrain from taking based on such data and information. Environmental Life Cycle Assessment and Financial Life Cycle Analysis of the WEEE Directive and its implications for the UK Update of the WEEE Directive study Final report - February 2002
Transcript
DTI – Update of WEEE Directive study – February 2002 Page 1This report has been prepared by PricewaterhouseCoopers solely for its client, the DTI, without any third parties in mind.PricewaterhouseCoopersaccepts no liability, responsibility or duty of care to any third parties that receive this report or use the data and
information contained herein, and such third parties assume the entire risk and liability for any actions they may take or refrain from takingbased on such data and information.
Environmental Life CycleAssessment and Financial LifeCycle Analysis of the WEEEDirective and its implicationsfor the UK
Update of the WEEE Directive study
Final report - February 2002
DTI – Update of WEEE Directive study – February 2002 Page 2This report has been prepared by PricewaterhouseCoopers solely for its client, the DTI, without any third parties in mind.PricewaterhouseCoopersaccepts no liability, responsibility or duty of care to any third parties that receive this report or use the data and
information contained herein, and such third parties assume the entire risk and liability for any actions they may take or refrain from takingbased on such data and information.
DTI – Update of WEEE Directive study – February 2002 Page 3This report has been prepared by PricewaterhouseCoopers solely for its client, the DTI, without any third parties in mind.PricewaterhouseCoopersaccepts no liability, responsibility or duty of care to any third parties that receive this report or use the data and
information contained herein, and such third parties assume the entire risk and liability for any actions they may take or refrain from takingbased on such data and information.
Acknowledgements
This work was carried out by the Global Sustainability Solutions team ofPricewaterhouseCoopers in close collaboration with the DTI from October 2001 to February2002.
We would like to take this opportunity to thank the DTI for their active involvement as wellas the following organisations who have helped us in providing data and reviewing some ofthe assumptions during this update study:
� Renew Trust
� Green-works
� CREATE
� Furniture Recycling
� Dixons
� Biffa
� Hampshire County Council
� Cambridgeshire County Council
� Entec UK Ltd
� Electrolux
DTI – Update of WEEE Directive study – February 2002 Page 4This report has been prepared by PricewaterhouseCoopers solely for its client, the DTI, without any third parties in mind.PricewaterhouseCoopersaccepts no liability, responsibility or duty of care to any third parties that receive this report or use the data and
information contained herein, and such third parties assume the entire risk and liability for any actions they may take or refrain from takingbased on such data and information.
DTI – Update of WEEE Directive study – February 2002 Page 5This report has been prepared by PricewaterhouseCoopers solely for its client, the DTI, without any third parties in mind.PricewaterhouseCoopersaccepts no liability, responsibility or duty of care to any third parties that receive this report or use the data and
information contained herein, and such third parties assume the entire risk and liability for any actions they may take or refrain from takingbased on such data and information.
Table of Contents
1 Introduction ..................................................................................................................71.1 Purpose of this report.............................................................................................. 71.2 Structure of the report............................................................................................. 7
2 Main assumptions ......................................................................................................... 82.1 Products under consideration .................................................................................. 82.2 System boundaries.................................................................................................. 92.3 Collection routes (part A of disposal system)........................................................ 11
2.3.1 Description of collection routes...................................................................... 112.3.2 Distance and costs of each collection route..................................................... 112.3.3 Collection routes for each product.................................................................. 14
2.4 End of life options and recovery targets (parts B to F of disposal system) ............. 152.4.1 Definition of targets ....................................................................................... 162.4.2 Disposal routes for each product .................................................................... 172.4.3 Meeting the reuse/recycling and recovery targets ........................................... 20
2.5 Processing costs (parts A to F of disposal system) ................................................ 212.5.1 Collection (part A) ......................................................................................... 212.5.2 Pre-treatment and Treatment (part B) ............................................................. 212.5.3 Reuse (part C)................................................................................................ 222.5.4 Recycling (part D).......................................................................................... 222.5.5 Treatment of hazardous components (part E).................................................. 232.5.6 Landfill/Incineration (part F).......................................................................... 23
2.6 Update of revenues and costs of secondary/primary products and materials (additivesystems and parts C, D and E of disposal system)........................................................... 23
2.6.1 Primary and secondary materials.................................................................... 232.6.2 New and reusable components ....................................................................... 252.6.3 New and refurbished products ........................................................................ 26
2.7 Update of environmental data (additive systems and parts B to E of disposal system)27
3 Analysis of results for each product............................................................................. 283.1 Analysis of environmental results ......................................................................... 283.2 Analysis of financial results.................................................................................. 30
3.2.1 Net value of overall system ............................................................................ 303.2.2 Net value of disposal system .......................................................................... 333.2.3 Net value of disposal system (minus refurbishment costs and revenues) ......... 343.2.4 Key points of the financial results .................................................................. 36
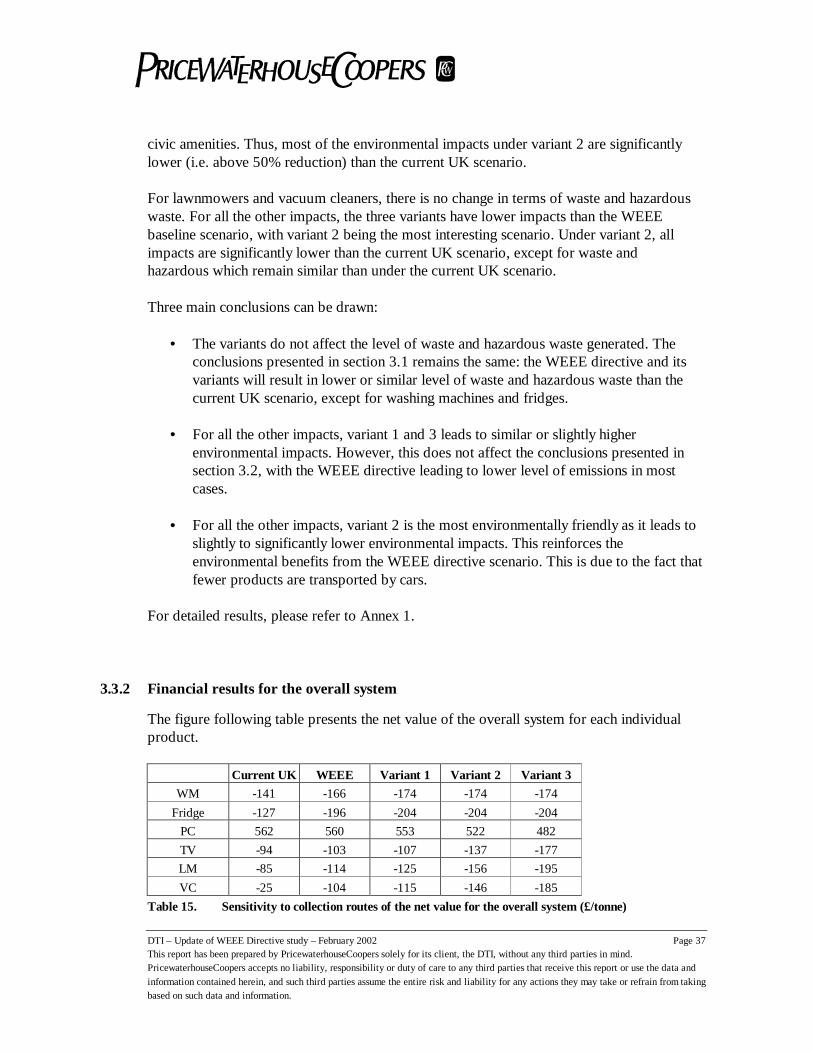
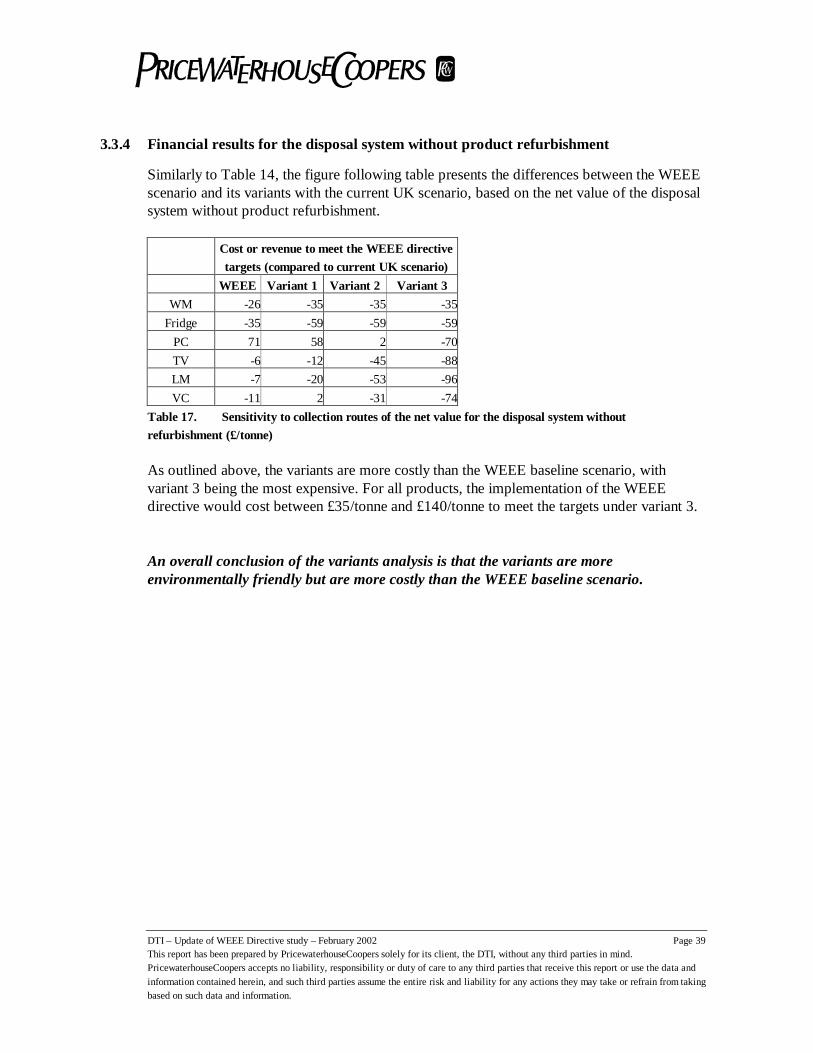
3.3 Analysis of variants .............................................................................................. 363.3.1 Environmental impacts................................................................................... 363.3.2 Financial results for the overall system........................................................... 373.3.3 Financial results for the disposal system......................................................... 383.3.4 Financial results for the disposal system without product refurbishment......... 39
DTI – Update of WEEE Directive study – February 2002 Page 6This report has been prepared by PricewaterhouseCoopers solely for its client, the DTI, without any third parties in mind.PricewaterhouseCoopersaccepts no liability, responsibility or duty of care to any third parties that receive this report or use the data and
information contained herein, and such third parties assume the entire risk and liability for any actions they may take or refrain from takingbased on such data and information.
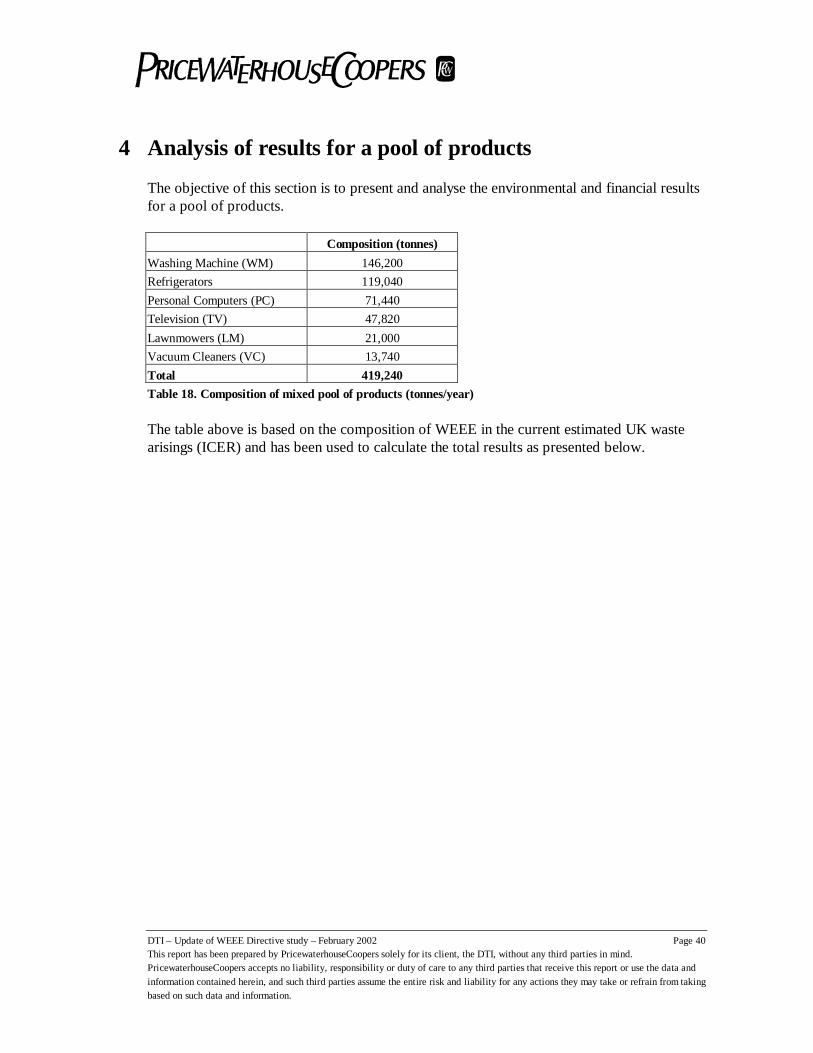
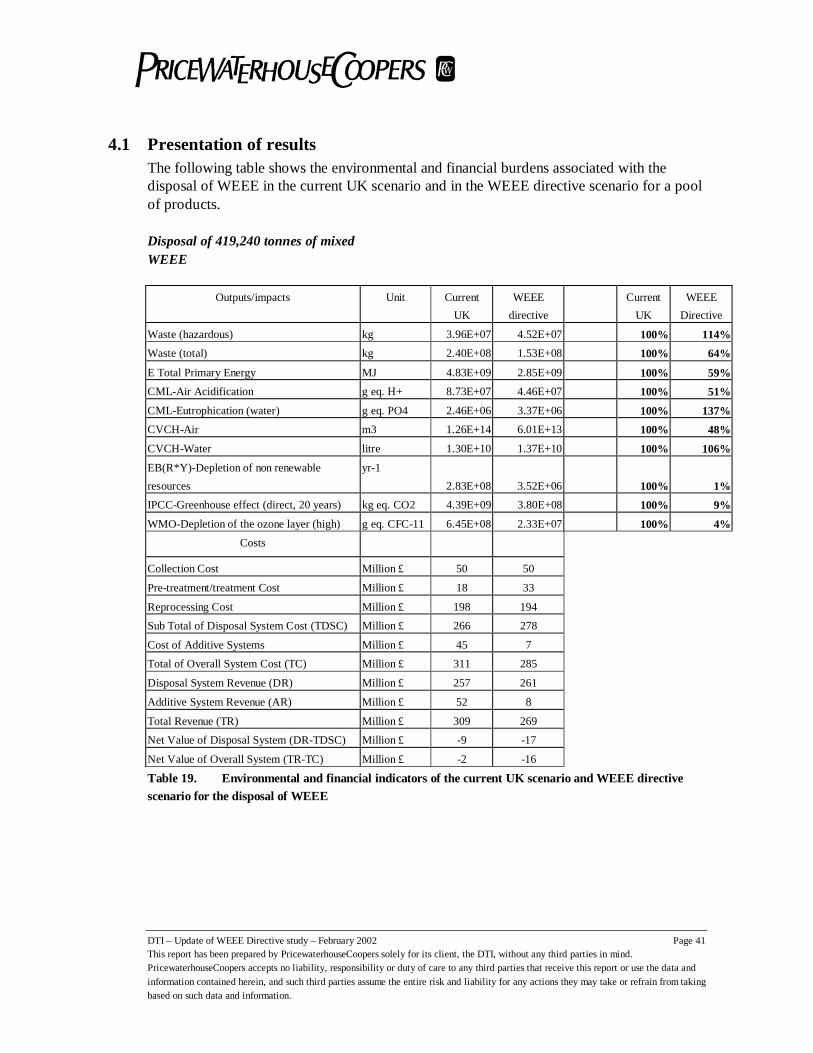
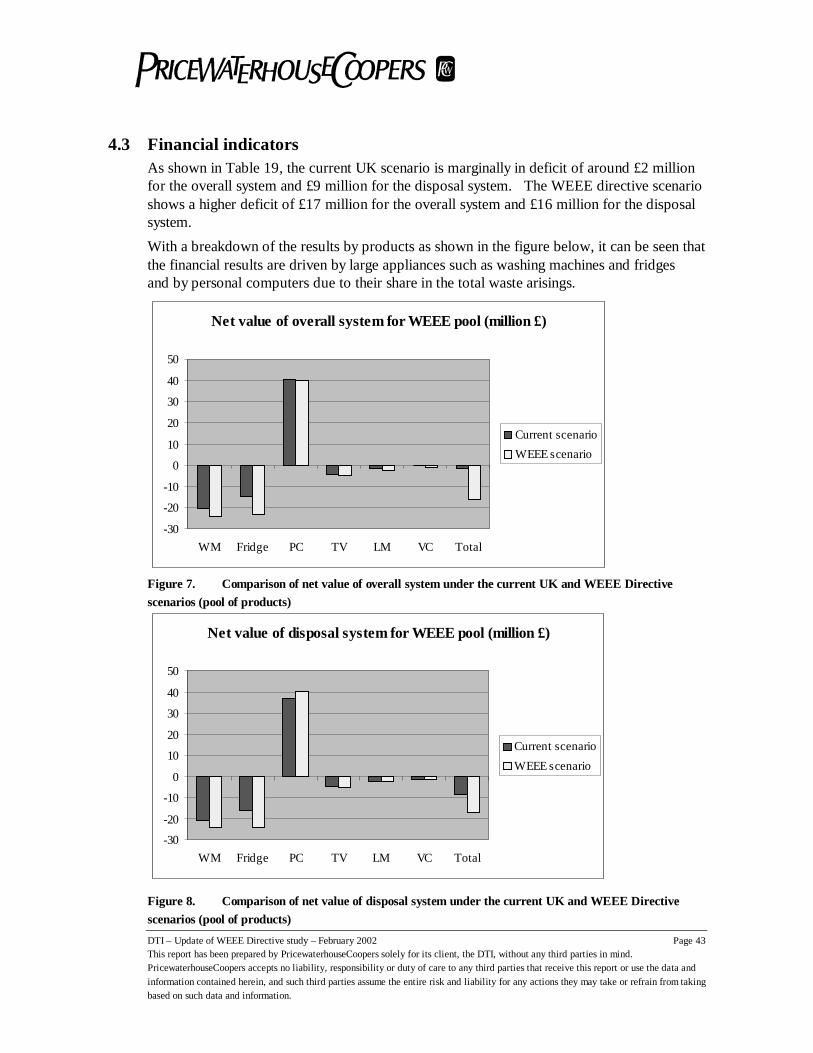
4 Analysis of results for a pool of products .................................................................... 404.1 Presentation of results........................................................................................... 414.2 Environmental indicators...................................................................................... 424.3 Financial indicators .............................................................................................. 43
DTI – Update of WEEE Directive study – February 2002 Page 7This report has been prepared by PricewaterhouseCoopers solely for its client, the DTI, without any third parties in mind.PricewaterhouseCoopersaccepts no liability, responsibility or duty of care to any third parties that receive this report or use the data and
information contained herein, and such third parties assume the entire risk and liability for any actions they may take or refrain from takingbased on such data and information.
1 Introduction
1.1 Purpose of this report
The DTI is required to produce a new partial Regulatory Impact Assessment on the basis ofthe latest version of WEEE1 Directive, the Common Position text, which was agreed by theEuropean Council on 7 June 2001.
The DTI has requested PricewaterhouseCoopers to update a previous study which wasconducted in 1999 and based on the 4th draft of the Directive. This study was entitled “LifeCycle Assessment and Life Cycle Financial Analysis of the proposal for a Directive onWEEE” (Ref Eco UK/C134)2.
The purpose of this report is to provide updated estimates of the expected environmental andfinancial costs and benefits to the UK of the collection, pre-treatment, recycling andrecovery of a range of electrical and electronic products based on the latest version of theWEEE Directive (referred to as the WEEE Directive scenario).
In order to compare these environmental and financial benefits and costs with the currentsituation, the DTI is also requesting a reassessment of the baseline scenario (referred to asthe Current UK scenario).
1.2 Structure of the reportThe report has been structured in the following sections:
� Major assumptions
� Presentation of results for each product under study (washing machines, personalcomputers, refrigerators, televisions, lawnmowers, vacuum cleaners)
� Presentation of results for an aggregated pool of WEEE products weighted by theirrespective share in current estimated UK waste arisings.
� Conclusions
1 Waste Electrical and Electronic Equipment2 This study was conducted in 1999 by Ecobalance UK and Dames & Moore. Since then, Ecobalance UK has
been acquired by PricewaterhouseCoopers (PwC) and staff from Dames & Moore have joined PwC.
DTI – Update of WEEE Directive study – February 2002 Page 8This report has been prepared by PricewaterhouseCoopers solely for its client, the DTI, without any third parties in mind.PricewaterhouseCoopersaccepts no liability, responsibility or duty of care to any third parties that receive this report or use the data and
information contained herein, and such third parties assume the entire risk and liability for any actions they may take or refrain from takingbased on such data and information.
2 Main assumptions
As a result of the scoping phase, we have established a list of key parameters (e.g. disposalroutes of WEEE products, price of secondary materials, cost of labour) and underlyingassumptions that needed to be updated as a result of changes in the UK market situation andin the text of the WEEE Directive. This list has been validated with the DTI.
This section presents the results of the data research phase that was conducted on the basisof the key parameters. It indicates the origin of data and underlying assumptions madewhere data has been obtainable.
The following section details any changes made to the initial study. For further details on theassumptions made, please refer to the initial study.
2.1 Products under considerationThe initial study considered eight electrical and electronic products comprising just over40% of the WEEE generated in the UK by weight (seeTable 1). It was agreed with the DTIto exclude telephones and kettles from this update owing to the small contribution theymade to the overall results of the original study.
Appliance Weight of Unitsdiscarded(000’s kg)
% of totalWEEE Arising
Washing machine 146,200 34%Refrigerator (including fridge-freezer) 119,040 28%PC (monitor, processor and keyboard, home andoffice)
71,440 17%
Television (large and small screen) 47,820 11%Lawnmower 21,000 5%Vacuum cleaner (inc. floor and hand heldappliance)
Table 1. Weight of WEEE product arisings included in the Study (Summary of Research Findings,
ICER, March 1998) and industrial sources for lawnmowers and kettles
It has been agreed with the DTI to use the same material composition for each product as inthe 1999 report3.
3 The only exception refers to fridges whose steel composition was slightly increased in line with other
literature data.
DTI – Update of WEEE Directive study – February 2002 Page 9This report has been prepared by PricewaterhouseCoopers solely for its client, the DTI, without any third parties in mind.PricewaterhouseCoopersaccepts no liability, responsibility or duty of care to any third parties that receive this report or use the data and
information contained herein, and such third parties assume the entire risk and liability for any actions they may take or refrain from takingbased on such data and information.
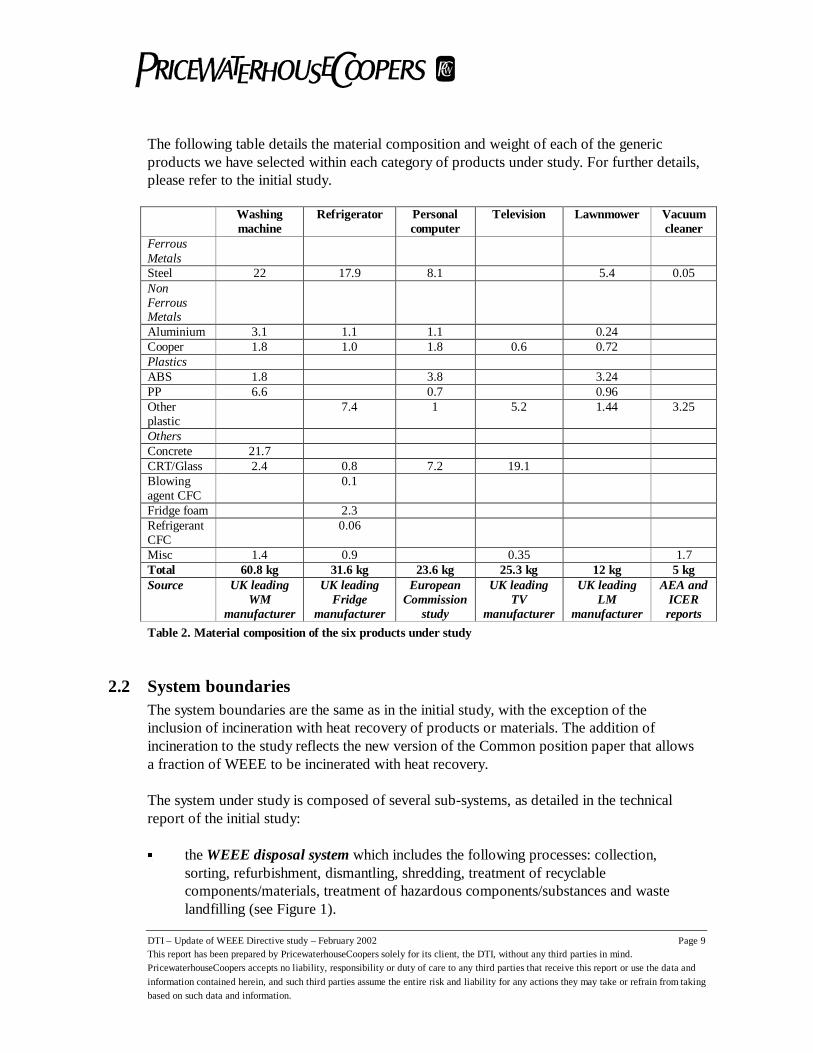
The following table details the material composition and weight of each of the genericproducts we have selected within each category of products under study. For further details,please refer to the initial study.
Misc 1.4 0.9 0.35 1.7Total 60.8 kg 31.6 kg 23.6 kg 25.3 kg 12 kg 5 kgSource UK leading
WMmanufacturer
UK leadingFridge
manufacturer
EuropeanCommission
study
UK leadingTV
manufacturer
UK leadingLM
manufacturer
AEA andICERreports
Table 2. Material composition of the six products under study
2.2 System boundariesThe system boundaries are the same as in the initial study, with the exception of theinclusion of incineration with heat recovery of products or materials. The addition ofincineration to the study reflects the new version of the Common position paper that allowsa fraction of WEEE to be incinerated with heat recovery.
The system under study is composed of several sub-systems, as detailed in the technicalreport of the initial study:
� theWEEE disposal systemwhich includes the following processes: collection,sorting, refurbishment, dismantling, shredding, treatment of recyclablecomponents/materials, treatment of hazardous components/substances and wastelandfilling (see Figure 1).
DTI – Update of WEEE Directive study – February 2002 Page 10This report has been prepared by PricewaterhouseCoopers solely for its client, the DTI, without any third parties in mind.PricewaterhouseCoopersaccepts no liability, responsibility or duty of care to any third parties that receive this report or use the data and
information contained herein, and such third parties assume the entire risk and liability for any actions they may take or refrain from takingbased on such data and information.
� additive systemscorresponding to the production of virgin products / components /materials, needed to “top up” the WEEE disposal system. We have adopted amethodology known as“additive systems” to ensurethat different scenarios,generating differentquantities of recoveredcomponents / materials canbe compared ‘on a levelplaying field’. Themethodology used isconsistent with ISOstandards (ISO 14040 series;1997-1999)4.
For this update, we have includedthe incineration option in severalplaces in the WEEE disposalsystem:
� Incineration of WEEEproducts after sorting,before or after dismantling
� Incineration of plastic,rubbers and other materialswhich are either extractedwith the non-ferrous fractionor in the fluff fraction afterthe shredder.
In addition, we have included in the additive system the production of electricity from thenational grid. This enables the top-up of WEEE disposal systems for scenarios that generateless electricity than those to which they are compared.
The following sections present the major assumptions made in terms of modelling accordingto each of the system boundaries identified in the disposal and additive systems.
4 For further information, please refer to
the initial study.
End of life Route for a generic WEEE product
D. RecyclingC. Reuse E. Treatment of hazardouscomponents/substances
B. Pre-treatment/treatment
Refurbish-ment
Disposal
Recycling offerrous fraction
Reuse
one tonne ofWEEE product
hazardous components/substances
A1. Collection withoutMSW
T
Legends:Transportation stepsCA: Civic AmenityLA: Local Aurthority
B1. Sorting
B3. Crushing
B2. Pre-treatment/dismantling
B4. Shredding
LARetailersCA
F. Landfilling / Incinerationof WEEE product
A2. Collection withMunicipal Solid Waste
Recycling of non -ferrous fraction
Treatment of fluff
Recycling
Recycling /Incineration of plastic
recyclablecomponents
reusablecomponents
WEEEproduct
T T
T
T
T
TT
TT
T
T
T
T
Figure 1: Description of the WEEE Disposal System
DTI – Update of WEEE Directive study – February 2002 Page 11This report has been prepared by PricewaterhouseCoopers solely for its client, the DTI, without any third parties in mind.PricewaterhouseCoopersaccepts no liability, responsibility or duty of care to any third parties that receive this report or use the data and
information contained herein, and such third parties assume the entire risk and liability for any actions they may take or refrain from takingbased on such data and information.
2.3 Collection routes (part A of disposal system)2.3.1 Description of collection routes
The DTI has requested that two additional collection options are included in this study,resulting in six different collection pathways:
� collection via civic amenity sites: an individual bring system is used to deliver theproduct(s) to a local civic amenity site.
� LA collection on demand (referred to as kerbside collection to civic amenity in theinitial study): used products are collected by local authorities on demand and broughtto civic amenity sites
� scheduled kerbside collection: this scheme is not operating today but is a proposedoption that could be used on the basis that other selected waste materials (e.g. glass,paper) are being collected.
� retailer collect on delivery of new appliance: this applies mainly to large householdappliances and is already operating today.
� in-store retailer take-back: an individual brings his used product to a retailer. This isnot a common approach to managing WEEE today but is one option put forward bythe Common Position text. This would imply the handling and storage of usedproducts on the retailer’s premises. One would expect small appliances to provide themain bulk of waste rather than large appliances.
� collection by charities or commercial organisations.
2.3.2 Distance and costs of each collection route
The following table summarises the cost and average distance considered for each collectionpathway. Little data exists on the costs of disposal of WEEE in the UK. Thus many of thefollowing figures are based on assumptions, agreed with the DTI, which are detailed in thefootnotes.
DTI – Update of WEEE Directive study – February 2002 Page 12This report has been prepared by PricewaterhouseCoopers solely for its client, the DTI, without any third parties in mind.PricewaterhouseCoopersaccepts no liability, responsibility or duty of care to any third parties that receive this report or use the data and
information contained herein, and such third parties assume the entire risk and liability for any actions they may take or refrain from takingbased on such data and information.
Table 3. Distance and costs of each collection route
Average round trip distance(km)
Transport and site management costs(£/tonne)5
1. Individual bring to civic
amenity (CA) site
20 km (by car) to CA site
135 km (by truck) from CA to
treatment facility
Transport (over 20 km): £0.91/per item6
i.e. £75/tonne7
Transport (over 135 km): £22/tonne8
CA site management, storage and
handling costs: £9/tonne9
Total: £106/tonne
2. Kerbside collection on
demand by local authority
20 km (by truck) to CA site
135 km (by truck) from CA to
treatment facility
Transport (over 20 km) and CA site
management, storage and handling costs:
£150/tonne10
Transport (over 135 km): £22/tonne (see
option 1)Total: £172/tonne
3. Scheduled kerbside
collection
20 km (by truck) +
135 km (by truck) to treatment
facility
Transport (over 20 km): £125/tonne11
Transport (over 135 km): £22/tonne (see
option 1)Total: £147/tonne
4. Retailer collect on
delivery
20 km (by truck) to retailer
135 km (by truck) from retailer to
treatment facility
Transport (over 20 km): £65/tonne
(Regulatory Impact Assessment based on
industry comments 200012 )
Transport (over 135 km): £22/tonne (see
option 1)
Storage and handling costs at retailer
site: £75/tonne13
Total: £162/tonne
5 Costs of infrastructure and equipment have not been included in any of the options.6 This figure is based upon a methodology outlined in a DTLR publication on Transport Economics (2001) and
the assumption that this trip is usually combined with another trip (e.g. going to the supermarket).7 This figure is based on an average weight of WEEE of 12 kg/item (Operator study ‘Back to the beginning’,
Sept 97).8 Data based upon haulage industry estimates (see initial study). Note that calculations based on the Transport
Economics Note suggest a figure of around £10/tonne.9 The management cost of a CA site has been estimated at respectively £5/tonne (Cambridgeshire County
Council) and £9/tonne for the current UK and WEEE Directive scenario. The additional £4/tonneaccounts for
the need for CAs to be upgraded if they are to take more WEEE.10This figure is based on the cost local authorities charge individuals for collecting WEEE (from 0 to £25 for 3
items) (Cambridgeshire County Council) and the average weight of electrical and electronic equipment.11 This figure has been estimated on the basis of the average weight of WEEE collected per household and the
efficiency of waste collection.12 See footnote of paragraph 5.8 from Regulatory Impact Assessment. £137/tonne-£72/tonne=£65/tonne
DTI – Update of WEEE Directive study – February 2002 Page 13This report has been prepared by PricewaterhouseCoopers solely for its client, the DTI, without any third parties in mind.PricewaterhouseCoopersaccepts no liability, responsibility or duty of care to any third parties that receive this report or use the data and
information contained herein, and such third parties assume the entire risk and liability for any actions they may take or refrain from takingbased on such data and information.
5. In-store retailer take-back 10 km (by car) to retailer
20 km (by truck): from retailer to
warehouse
135 km (by truck) from
warehouse to treatment facility
(see option 1)
Transport (over 10 km): £0.45/per item14
i.e. £40/tonne15
Transport (over 20 km) to warehouse:
£20/tonne16
Transport (over 135 km): £22/tonne (see
option 1)
Storage/handling costs at retailer site and
warehouse: £15017/tonne
Total: £232/tonne
6. Collection by
charities/commercial
organisations
70 km to treatment facility £75/tonne18
As a result, the collection costs range from £106/tonne to £232/tonne with the exception ofcharities/commercial organisations (£75/tonne). This is close to the range of costs indicatedin the explanatory memorandum of the proposal for the WEEE directive by the EuropeanCommission (13.06.2000): £130 to £260/tonne.
Total Transport and site
management costs (£/tonne)19
1. Individual bring to civic amenity (CA) site £106/tonne
2. Kerbside collection on demand by local authority £172/tonne
3. Scheduled kerbside collection £147/tonne
4. Retailer collect on delivery £162/tonne
5. In-store retailer take-back £232/tonne
6. Collection by charities/commercial organisations £75/tonne
Table 4. Summary table cost for collection
13 Assumption: 1/2 of storage and handling cost in option 5 as there is only one point of storage.14 This figure is based upon a methodology outlined in a DTLRpublication on Transport Economics (2001)
and the assumption that 50% of the trip has been allocated to the bring-back of the used products and 50% to
the purchase of a new product.15 This figure is based on an average weight of WEEE of 12 kg/item (Apparetour study ‘Back to the
beginning’, Sept 97).16 Based on glass collection cost (£20/tonne): we assumed that the burdens are equivalent.17 We have assumed that the storage and handling costs equals 3.5 times the transport costs (Apparetour study
‘Back to the beginning’, Sept 97). This figure may be under-estimated as the Apparetour study is based on
Netherlands rents, which are probably lower than in the UK.18 See initial report.19 Costs of infrastructure and equipment have not been included in any of the options.
DTI – Update of WEEE Directive study – February 2002 Page 14This report has been prepared by PricewaterhouseCoopers solely for its client, the DTI, without any third parties in mind.PricewaterhouseCoopersaccepts no liability, responsibility or duty of care to any third parties that receive this report or use the data and
information contained herein, and such third parties assume the entire risk and liability for any actions they may take or refrain from takingbased on such data and information.
2.3.3 Collection routes for each product
The following table summarises the collection routes for each product and scenario. Thedata relating to current UK collection routes are based on best available data. For the WEEEbase scenario, we have used the same routes as the current UK scenario. This is explainedby the fact that the UK already currently meets its 4kg/inhabitant/year collection targets asrequired by the WEEE directive.
In addition, a number of variants for the WEEE Directive scenario (defined by the DTI)have been considered, referred to as Variant 1, Variant 2 and Variant 3.
Scenarios Collection routes
CivicAmenities bycar (bring-in)
LA collectionon demand
Scheduledkerbside
Retailer return(collect ondelivery)
Retailer in-store takeback
Charities
Washing Machine
Current 10% 63% 0% 20% 0% 7%
WEEE 10% 63% 0% 20% 0% 7%
Variant 1 0% 74% 0% 20% 0% 6%
Variant 2 0% 74% 0% 20% 0% 6%
Variant 3 0% 74% 0% 20% 0% 6%
Fridge
Current 10% 63% 0% 20% 0% 7%
WEEE 10% 63% 0% 20% 0% 7%
Variant 1 0% 74% 0% 20% 0% 6%
Variant 2 0% 74% 0% 20% 0% 6%
Variant 3 0% 74% 0% 20% 0% 6%
PC
Current 50% 0% 0% 20% 0% 30%
WEEE 50% 0% 0% 20% 0% 30%
Variant 1 75% 0% 0% 19% 0% 6%
Variant 2 0% 0% 75% 19% 0% 6%
Variant 3 19% 0% 0% 19% 56% 6%
TV
Current 60% 0% 0% 20% 0% 20%
WEEE 60% 0% 0% 20% 0% 20%
Variant 1 75% 0% 0% 19% 0% 6%
Variant 2 0% 0% 75% 19% 0% 6%
Variant 3 19% 0% 0% 19% 56% 6%
Lawnmower
Current 95% 0% 0% 0% 0% 5%
WEEE 95% 0% 0% 0% 0% 5%
Variant 1 75% 0% 0% 19% 0% 6%
Variant 2 0% 0% 75% 19% 0% 6%
Variant 3 19% 0% 0% 19% 56% 6%
DTI – Update of WEEE Directive study – February 2002 Page 15This report has been prepared by PricewaterhouseCoopers solely for its client, the DTI, without any third parties in mind.PricewaterhouseCoopersaccepts no liability, responsibility or duty of care to any third parties that receive this report or use the data and
information contained herein, and such third parties assume the entire risk and liability for any actions they may take or refrain from takingbased on such data and information.
Scenarios Collection routes
CivicAmenities bycar (bring-in)
LA collectionon demand
Scheduledkerbside
Retailer return(collect ondelivery)
Retailer in-store takeback
Charities
Vacuum Cleaner
Current 94% 0% 0% 0% 0% 6%
WEEE 94% 0% 0% 0% 0% 6%
Variant 1 75% 0% 0% 19% 0% 6%
Variant 2 0% 0% 75% 19% 0% 6%
Variant 3 19% 0% 0% 19% 56% 6%
Table 5. Collection routes for each product
Explanation of changes to the current UK scenario/WEEE directive scenario:
Washing Machine/Fridge: 10% to civic amenity (bring system) for those who do not want topay local authorities (assumption), 7% to charities and 20% collect on delivery by retailersas in the initial study, thus 63% by kerbside collection on demand. In the variances for theWEEE Directive scenario, it has been assumed that 6% would be collected by charities(Source: ESCOPE report). Furthermore, it has been assumed that no products would bebrought by people by car to civic amenities, thus 74% by kerbside collection on demand.
PC: 20% collect on delivery by retailers instead of 40% (to make it consistent with the otherproducts). As a result, 50% to civic amenity (bring system). We have kept the figure forcharity collection as 30% in the absence of more recent data (personal communication fromPC manufacturer).
TV/Lawnmower/vacuum cleaner: same disposal routes as in the initial study.
2.4 End of life options and recovery targets (parts B to F of disposal system)This section presents the assumptions related to the fraction of WEEE products which arerefurbished (part C), pre-treated and recycled (part B, D and E) or landfilled/incinerated(part F) under the current UK and WEEE directive scenarios, and how they relate to therecovery targets.
DTI – Update of WEEE Directive study – February 2002 Page 16This report has been prepared by PricewaterhouseCoopers solely for its client, the DTI, without any third parties in mind.PricewaterhouseCoopersaccepts no liability, responsibility or duty of care to any third parties that receive this report or use the data and
information contained herein, and such third parties assume the entire risk and liability for any actions they may take or refrain from takingbased on such data and information.
2.4.1 Definition of targets
One important change between the content of the 4th draft and the current Common positionpaper refers to recovery targets20:
� Recovery targets for each category of product have changed since the 4th draft.
� Reuse of products, as a whole, will no longer count towards recovery targets.
� Recovery targets now allow for a fraction of WEEE products to be incinerated withheat recovery.
The following figure illustrates our interpretation of the way targets should be calculated.For instance, recovery targets are calculated on the basis of the weight of materials andcomponents which are recovered to be reused, recycled or incinerated with heat recovery.Refurbished products are excluded from the targets (both in the numerator anddenominator). In addition, it must be noted that products separately collected correspond toproducts which are not mixed with MSW or other waste. If used products are brought tocivic amenities but then are mixed with other waste (as a result of there being no WEEEdisposal containers) and eventually sent to a landfill and incinerator, these products are notconsidered as separately collected. As a result, WEEE separately collected are calculated onthe basis of the weight of WEEE which either enter the reuse/refurbishment or recyclingwaste stream.
20 The WEEE Directive sets recovery targets for each category of product. These targets are calculated on the
basis of materials, components and substances, which are recovered for re-use, recycling or incinerated with
heat recovery per appliances by weight.
DTI – Update of WEEE Directive study – February 2002 Page 17This report has been prepared by PricewaterhouseCoopers solely for its client, the DTI, without any third parties in mind.PricewaterhouseCoopersaccepts no liability, responsibility or duty of care to any third parties that receive this report or use the data and
information contained herein, and such third parties assume the entire risk and liability for any actions they may take or refrain from takingbased on such data and information.
WEEE (X1) enteringwaste stream
Materials to berecycled (X7)
Components to bereused (X6)
Remaining WEEE(X5)
WEEE refurbished(X4)
WEEE separatelycollected (X3)
WEEE treated withMSW (X2)
Remaining materialswhich are incinerated
with heat recovery(X8)
Remaining materialswhich are landfilled
(X9)
Definition of recovery and reuse/recycling targets
Figure 1. Definition of recovery and reuse/recycling targets
The European Commission has confirmed this interpretation set out in Figure 1, although itdoes point out that the text of the Directive is not yet finalised. According to Article 6(3), thedetailed rules for controlling compliance with the targets (that means, for calculating thetargets) will have to be set at a later stage. It is at this stage only that the details aboutnumerator and denominator will be settled.
2.4.2 Disposal routes for each product
The following table indicates which disposal routes have been defined for each productunder each scenario. For instance, for 100% of washing machines discarded under thecurrent UK scenario, we assume that 7% are sent to a refurbishing company, 88% are sent toa dismantler/shredder to be recycled, 5% are disposed at a landfill. The landfill andincineration routes refer to the disposal of products as a whole.
DTI – Update of WEEE Directive study – February 2002 Page 18This report has been prepared by PricewaterhouseCoopers solely for its client, the DTI, without any third parties in mind.PricewaterhouseCoopersaccepts no liability, responsibility or duty of care to any third parties that receive this report or use the data and
information contained herein, and such third parties assume the entire risk and liability for any actions they may take or refrain from takingbased on such data and information.
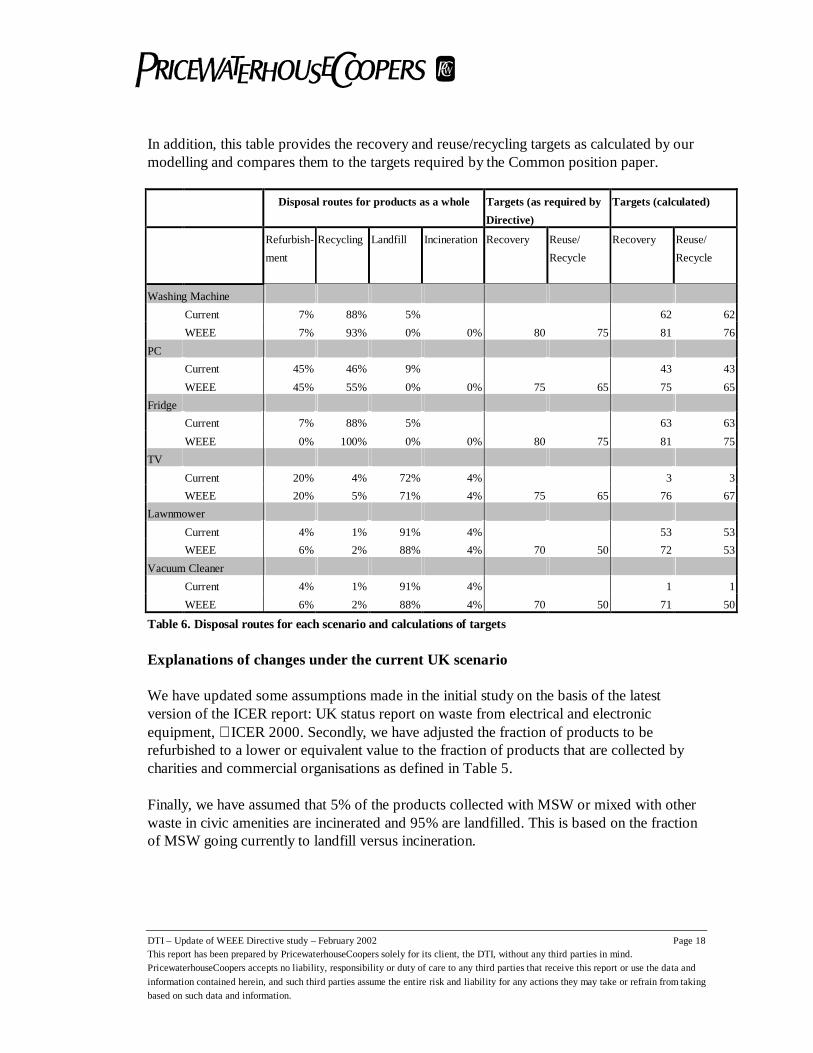
In addition, this table provides the recovery and reuse/recycling targets as calculated by ourmodelling and compares them to the targets required by the Common position paper.
Disposal routes for products as a whole Targets (as required by
Directive)
Targets (calculated)
Refurbish-
ment
Recycling Landfill Incineration Recovery Reuse/
Recycle
Recovery Reuse/
Recycle
Washing Machine
Current 7% 88% 5% 62 62
WEEE 7% 93% 0% 0% 80 75 81 76
PC
Current 45% 46% 9% 43 43
WEEE 45% 55% 0% 0% 75 65 75 65
Fridge
Current 7% 88% 5% 63 63
WEEE 0% 100% 0% 0% 80 75 81 75
TV
Current 20% 4% 72% 4% 3 3
WEEE 20% 5% 71% 4% 75 65 76 67
Lawnmower
Current 4% 1% 91% 4% 53 53
WEEE 6% 2% 88% 4% 70 50 72 53
Vacuum Cleaner
Current 4% 1% 91% 4% 1 1
WEEE 6% 2% 88% 4% 70 50 71 50
Table 6. Disposal routes for each scenario and calculations of targets
Explanations of changes under the current UK scenario
We have updated some assumptions made in the initial study on the basis of the latestversion of the ICER report: UK status report on waste from electrical and electronicequipment,ICER 2000. Secondly, we have adjusted the fraction of products to berefurbished to a lower or equivalent value to the fraction of products that are collected bycharities and commercial organisations as defined in Table 5.
Finally, we have assumed that 5% of the products collected with MSW or mixed with otherwaste in civic amenities are incinerated and 95% are landfilled. This is based on the fractionof MSW going currently to landfill versus incineration.
DTI – Update of WEEE Directive study – February 2002 Page 19This report has been prepared by PricewaterhouseCoopers solely for its client, the DTI, without any third parties in mind.PricewaterhouseCoopersaccepts no liability, responsibility or duty of care to any third parties that receive this report or use the data and
information contained herein, and such third parties assume the entire risk and liability for any actions they may take or refrain from takingbased on such data and information.
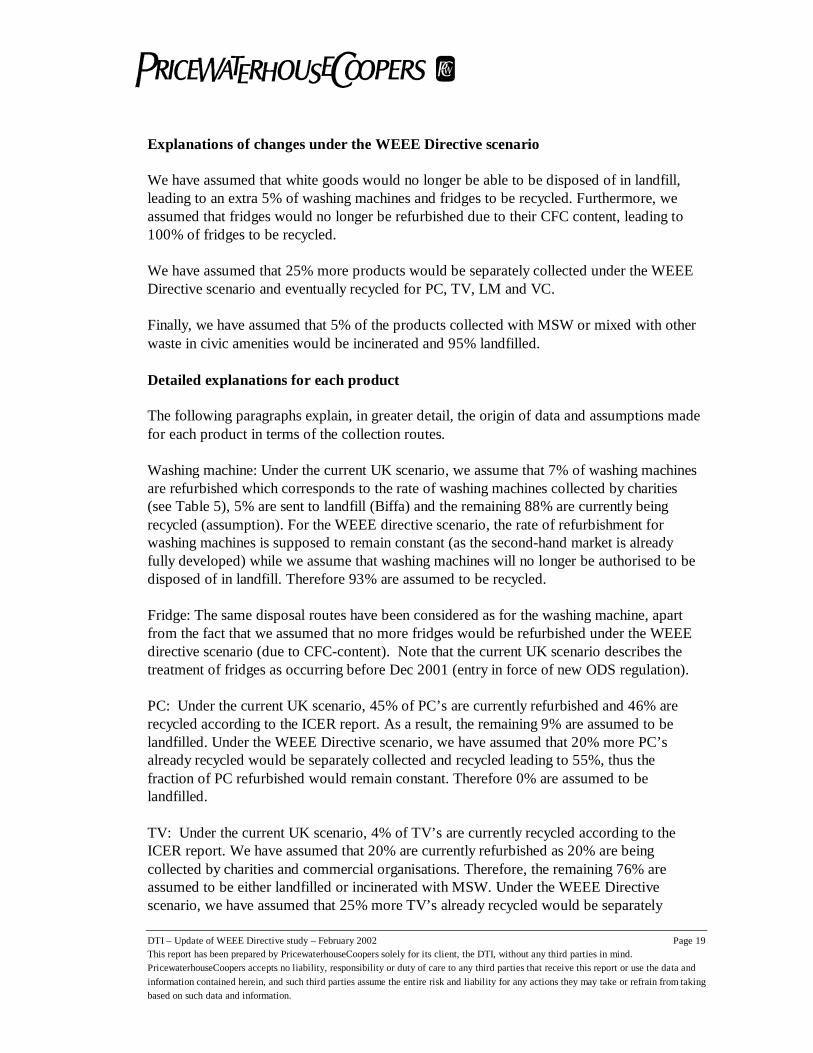
Explanations of changes under the WEEE Directive scenario
We have assumed that white goods would no longer be able to be disposed of in landfill,leading to an extra 5% of washing machines and fridges to be recycled. Furthermore, weassumed that fridges would no longer be refurbished due to their CFC content, leading to100% of fridges to be recycled.
We have assumed that 25% more products would be separately collected under the WEEEDirective scenario and eventually recycled for PC, TV, LM and VC.
Finally, we have assumed that 5% of the products collected with MSW or mixed with otherwaste in civic amenities would be incinerated and 95% landfilled.
Detailed explanations for each product
The following paragraphs explain, in greater detail, the origin of data and assumptions madefor each product in terms of the collection routes.
Washing machine: Under the current UK scenario, we assume that 7% of washing machinesare refurbished which corresponds to the rate of washing machines collected by charities(see Table 5), 5% are sent to landfill (Biffa) and the remaining 88% are currently beingrecycled (assumption). For the WEEE directive scenario, the rate of refurbishment forwashing machines is supposed to remain constant (as the second-hand market is alreadyfully developed) while we assume that washing machines will no longer be authorised to bedisposed of in landfill. Therefore 93% are assumed to be recycled.
Fridge: The same disposal routes have been considered as for the washing machine, apartfrom the fact that we assumed that no more fridges would be refurbished under the WEEEdirective scenario (due to CFC-content). Note that the current UK scenario describes thetreatment of fridges as occurring before Dec 2001 (entry in force of new ODS regulation).
PC: Under the current UK scenario, 45% of PC’s are currently refurbished and 46% arerecycled according to the ICER report. As a result, the remaining 9% are assumed to belandfilled. Under the WEEE Directive scenario, we have assumed that 20% more PC’salready recycled would be separately collected and recycled leading to 55%, thus thefraction of PC refurbished would remain constant. Therefore 0% are assumed to belandfilled.
TV: Under the current UK scenario, 4% of TV’s are currently recycled according to theICER report. We have assumed that 20% are currently refurbished as 20% are beingcollected by charities and commercial organisations. Therefore, the remaining 76% areassumed to be either landfilled or incinerated with MSW. Under the WEEE Directivescenario, we have assumed that 25% more TV’s already recycled would be separately
DTI – Update of WEEE Directive study – February 2002 Page 20This report has been prepared by PricewaterhouseCoopers solely for its client, the DTI, without any third parties in mind.PricewaterhouseCoopersaccepts no liability, responsibility or duty of care to any third parties that receive this report or use the data and
information contained herein, and such third parties assume the entire risk and liability for any actions they may take or refrain from takingbased on such data and information.
collected and recycled leading to 5%, thus the fraction of TV’s refurbished would remainconstant. Therefore 75% are assumed to be either landfilled or incinerated.
Lawnmower/vacuum cleaner: Under the current UK scenario, 1% of small appliances arecurrently recycled according to the ICER report. We have assumed that 4% are currentlyrefurbished (source: manufacturer). Therefore, the remaining 95% are assumed to be eitherlandfilled or incinerated with MSW. Under the WEEE directive scenario, we have assumedthat 20% more products already recycled would be separately collected and recycled leadingto 2%, thus the fraction of products refurbished would increase to 6%, which is the fractionof products being collected by charities and commercial organisations. Therefore, 92% areassumed to be either landfilled or incinerated.
2.4.3 Meeting the reuse/recycling and recovery targets
None of the products meet the targets defined by the Directive under the current UKscenario. Therefore, we have assumed that under the WEEE Directive scenario, plastic andother matters (CRT, cement) would be recycled or incinerated.
Procedure followed to meet the targets
The following procedure has been followed:
1) If the reuse/recycling target is not met by recycling the ferrous and non-ferrous fractionof products, we have increased the recycling rate of monitors (where applicable)
2) If the reuse/recycling target is still not met, we have increased the recycling rate of theplastic and concrete.
As a result of these changes, all products studied are meeting the reuse/recycling targets.
3) For meeting the recovery targets, we have increased the fraction of non-recycled plasticto be incinerated.
4) If the recovery target is still not met, we have increased the fluff fraction (from theshredder) to be incinerated (only combustible fractions are taken into account)
DTI – Update of WEEE Directive study – February 2002 Page 21This report has been prepared by PricewaterhouseCoopers solely for its client, the DTI, without any third parties in mind.PricewaterhouseCoopersaccepts no liability, responsibility or duty of care to any third parties that receive this report or use the data and
information contained herein, and such third parties assume the entire risk and liability for any actions they may take or refrain from takingbased on such data and information.
More detailed explanations for each product
The following paragraphs explain more specifically which assumptions and changes havebeen made for each product
Fridge: 50% of plastic is recycled and 25% is incinerated. Note that it has been assumed thatno capacitors are re-used but are all incinerated.
Washing Machine: 90% of concrete is recycled and 25% of plastic is incinerated. Note thatit has been assumed that no capacitors are re-used but are all incinerated.
PC: 65% of monitors are recycled and 80% of plastic is incinerated.
TV: 90% of monitors are recycled and 20% of plastic is incinerated. Note that it has beenassumed that no capacitors are re-used but are all incinerated.
Lawnmower: 40% of plastic is incinerated.
Vacuum cleaner: 75% of plastic is recycled and 20% of plastic is incinerated.
2.5 Processing costs (parts A to F of disposal system)This section summarises the assumptions related to processing costs of the disposal system.It must be noted that similar to the initial study, this study does not account for all potentialcost increases such as capital and infrastructure investment, R&D investment, humanreorganisation and training costs.
2.5.1 Collection (part A)
See section 2.3.
2.5.2 Pre-treatment and Treatment (part B)
The process costs were separated from the transport costs at each stage. Estimates have beenmade which include overhead, labour and operational costs.
For manual activities such as dismantling, the average time taken has been multiplied by£0.175 per minute to estimate the labour cost for the process (see Table 7 Assumptions fordismantling). This corresponds to £10.5/hour (assumption: £8.3/hour in initial studyincreased by 10.1% based upon 1998 following ONS data for wage costs if themanufacturing sector and a 10% allowance for national insurance contribution and 5% foroverheads.)
DTI – Update of WEEE Directive study – February 2002 Page 22This report has been prepared by PricewaterhouseCoopers solely for its client, the DTI, without any third parties in mind.PricewaterhouseCoopersaccepts no liability, responsibility or duty of care to any third parties that receive this report or use the data and
information contained herein, and such third parties assume the entire risk and liability for any actions they may take or refrain from takingbased on such data and information.
Product Dismantling time
under current UK
scenario (min)
Dismantling time under
WEEE directive scenario
(min)
Washing Machine 0 10
Fridge 4 10
PC 10 20
TV 0 20
Lawnmower 4 10
Vacuum Cleaner 4 10
Table 7 Assumptions for dismantling time
In the case of shredding and granulating, a cost has been assigned to the overall operation.Shredding (of white goods) is assumed to be a courser process than granulation (of all otherproducts). Based on a comparison of industry estimates and cross-checking cost figures withthe value charged to customers for the process, a figure of £1121/tonne was used for the costof shredding compared to £90/tonne for granulation. Crushing was estimated at £2/tonne.
2.5.3 Reuse (part C)
The refurbishing process costs have been calculated on the basis of revenues generated bythe selling of refurbished products or reusable parts. We have assumed a 15% margin.For further details, please refer to sections 2.6.2 and 2.6.3.
2.5.4 Recycling (part D)
The costs associated with the Heavy Media Separation Plant (HMSP) have been included inthis section (only applicable for white goods). This has been estimated at £45/tonne (basedon a 25% margin on the value charged by industry for the process). Scrap landfill costs havebeen estimated at £30/tonne, except for concrete (£10/tonne).
The processing costs associated with the treatment of materials such as reprocessing plasticand the re-smelting of metals (if processed in the UK) are included in this section:
• The reprocessing cost of ferrous scrap in the UK has been estimated at £220/tonne.• The reprocessing cost of sand in the UK has been estimated at £1.7/tonne.• The reprocessing costs of plastics have been estimated at £60/tonne for the
separation of mixed plastics plus £300/tonne for the cost of reprocessing.
21 This cost is WEEE specific according to the Material Recycling Week Magazine.
DTI – Update of WEEE Directive study – February 2002 Page 23This report has been prepared by PricewaterhouseCoopers solely for its client, the DTI, without any third parties in mind.PricewaterhouseCoopersaccepts no liability, responsibility or duty of care to any third parties that receive this report or use the data and
information contained herein, and such third parties assume the entire risk and liability for any actions they may take or refrain from takingbased on such data and information.
• The incineration cost of plastics has been estimated at £50/tonne, like MSW.Assuming that the average calorific value of MSW is 13MJ/kg and the efficiency ofthe incinerator is 32%, the amount of electricity produced is 1155 kWh/tonne MSW.Therefore, the cost of producing one kwh of electricity is assumed to be£0.043/tonne.
2.5.5 Treatment of hazardous components (part E)
The processing costs include the overheads and the cost of labour incurred by each of thestakeholders associated with the processing of hazardous components. Incineration costshave been taken as £140/tonne based on industry estimates. The processing costs for ABSwithin a monitor is included within this section (£400/tonne).
2.5.6 Landfill/Incineration (part F)
The figure used for landfill costs throughout the study was £30/tonne22, except £10/tonne forconcrete. The cost of incineration of products has been estimated at £50/tonne23.
2.6 Update of revenues and costs of secondary/primary products andmaterials (additive systems and parts C, D and E of disposal system)
The following tables summarise financial data in terms of the processing costs forprimaryproducts, components and materials and their associated revenues, as well as revenues forsecondaryproducts, components and materials. Their associated processing costs areavailable in the previous section.
As in the initial report, we have made the assumption that the production of primaryproducts/components/materials was generating a 15% margin.
Note that in the case of component parts, refurbished products and primary materials, thereare large discrepancies between values depending on the quality of the product or material.
2.6.1 Primary and secondary materials
The processing cost for secondary materials is not displayed in this table, as it is acompilation of the costs associated with the collection, sorting, shredding and processing ofmaterials (as detailed in section 2.5).
22 Source: Material Recycling Week23 Source: Cambridgeshire County Council
DTI – Update of WEEE Directive study – February 2002 Page 24This report has been prepared by PricewaterhouseCoopers solely for its client, the DTI, without any third parties in mind.PricewaterhouseCoopersaccepts no liability, responsibility or duty of care to any third parties that receive this report or use the data and
information contained herein, and such third parties assume the entire risk and liability for any actions they may take or refrain from takingbased on such data and information.
Primary materials Secondary materials
Raw materials (£ per tonne) Production cost
“used for Top Up”
in additive system
Revenue Production cost
(see section 2.5)
Revenue
Steel/Iron/Ferrous 220 261 55 (scrap) – 261 (II
steel)
Copper 941 1083 66524
Aluminium 807 929 43524
Lead 277 319 19524
Sand (70%) / Limestone (30%) 8.5 10 2
Glass pellets / low grade 85 100 15
Fine Gold 4,947,654 5,689,803 2,250,00025
Fine Silver 87,004 100,055 81,000
Palladium 10,081,874 11,594,156 6,160,000
ABS 846 995 350
PVC 286 336 350
PP 319 375 350
HIPS 428 504 350
Electricity (£/kwh) 0.085 0.126 0.1
Table 8. Summary of Costs and Revenues for Primary and Secondary Materials
The value of metals was taken using published sources based on knowledge from industryon the most likely metal grade (or grades) to be re-manufactured from a particular product.In the case of plastics, a calculation was made based on an assumption that it is noteconomically viable to separate and re-process mixed plastics; hence a value was assigned tothe product less than the combined cost of separation and reprocessing.
The main sources of information used were the London Metal Exchange spot prices and theMaterials Recycling Weekly magazine combined with recyclate values and yieldassumptions obtained from confidential sources.
Source:www.kitco.comGold price, averaged from 1999: £276.07 /troy ounce, i.e.£5,689,803/tonne
(£5,430,000/tonne)Silver price, averaged from 1999: £4.84 /troy ounce, i.e. £100,055/tonne
(£85,000/tonne)
24 Scrap prices fromwww.letsrecyclce.com25 Prices for high-value metal scrap from Material Recycling week - November 200126 Extrapolated from electricity bill
DTI – Update of WEEE Directive study – February 2002 Page 25This report has been prepared by PricewaterhouseCoopers solely for its client, the DTI, without any third parties in mind.PricewaterhouseCoopersaccepts no liability, responsibility or duty of care to any third parties that receive this report or use the data and
information contained herein, and such third parties assume the entire risk and liability for any actions they may take or refrain from takingbased on such data and information.
Palladium price, averaged from 1999: £562.55 / troy ounce, i.e.£11,594,156/tonne(£5,980,000/tonne)
www.lme.co.ukAluminium (3 months), £929/tonne average from 05/01/1998 to 20/09/2001
(£720/tonne)Copper (3 months), £1083/tonne average from 05/01/1998 to 20/09/2001
(£1369/tonne)Lead (3 months), £319/tonne average from 05/01/1998 to 20/09/2001
(£497/tonne)www.meps.co.ukSteel (Hot Rolled Coil), £261/tonne average since October 2000
(£254/tonne)
2.6.2 New and reusable components
The processing cost for reusable components is not displayed in this table, as it is acompilation of costs associated with the collection, sorting and dismantling of products (asdetailed in section 2.5).
New components Reusable components
Manufactured Products (£ per
unit unless stated)
Production cost Revenue Processing cost
(see section 2.5)
Revenue
Capacitors 27(£/kg) 31(£/kg) 20 (£/kg)
Chips 55 65 0.65
Drives 36 42 20
Cone Glass 183 215 0.5 (£/tonne)
Table 9. Summary of Costs and Revenues for primary and secondary components
NEW COMPONENTS:Revenue of new components: revenue in the initial study * decrease of retailer index fromDec 1998 to Oct 2001. -35% for capacitors, drives and chips based upon retailer index foraudio visual appliances. Source: ONS, Nov 2001
Production cost of new components: 1/1.15 of revenues as we have assumed a 15% margin(same assumption as in the initial study).
REFURBISHED COMPONENTS:Revenue of refurbished components: revenue in the initial study * decrease of retailer indexfrom Dec 1998 to Oct 2001. -35% for drives and chips based upon retailer index for audiovisual appliances. Source: ONS, Nov 2001. For capacitors, the decrease has been of 50% inorder to reduce the difference of margin between the refurbished and new capacitors.
DTI – Update of WEEE Directive study – February 2002 Page 26This report has been prepared by PricewaterhouseCoopers solely for its client, the DTI, without any third parties in mind.PricewaterhouseCoopersaccepts no liability, responsibility or duty of care to any third parties that receive this report or use the data and
information contained herein, and such third parties assume the entire risk and liability for any actions they may take or refrain from takingbased on such data and information.
2.6.3 New and refurbished products
New products Refurbished products
Product Production
cost
Revenue Cost for
company
Cost for
charity
Weighted
cost
Revenue for
company
Revenue
for charity
Weighted
revenue
PC 467 538 111 76 100 130 90 118
Washing M. 305 351 NA 76 76 NA 90 90
Fridge 135 156 NA 48 48 NA 57 57
TV 97 112 28 17 25 31 19 27
Vacuum cl. 138 159 NA 24 24 NA 27 27
Lawnmower 125 144 NA 33 33 NA 36 36
Table 10. Summary of Costs and Revenues for New and Refurbished Products (in £/unit)
For all products except TV’s and PC’s, we assumed that refurbishment is only carried out bycharities.
NEW PRODUCTS:Revenue of new products: revenue in the initial study * decrease of retailer index from Dec1998 to Oct 2001. -35% for PC and TV (audio visual appliances) and –8% for the rest(electrical appliance). Source: ONS, Nov 2001
Processing cost of new products: 1/1.15 of revenues as we have assumed a 15% margin(same assumption as in the initial study)
REFURBISHED PRODUCTS:Revenue for company and charity: we have used the same retailer index decrease as thosementioned above and consulted different sources (charities organisation, information foundon the internet) to validate these values.
Costs for company and charity: the costs indicated in this column include collection costs.There is a wide range of costs for refurbishing products. We have based our costs on thelikely margin that can be made on the refurbished products which we assumed to be 10% forvacuum cleaners, lawnmowers and television and 15% for PCs and white goods (source:charity). Gross margin can be substantially higher but we include here the guarantee andmarketing costs.
DTI – Update of WEEE Directive study – February 2002 Page 27This report has been prepared by PricewaterhouseCoopers solely for its client, the DTI, without any third parties in mind.PricewaterhouseCoopersaccepts no liability, responsibility or duty of care to any third parties that receive this report or use the data and
information contained herein, and such third parties assume the entire risk and liability for any actions they may take or refrain from takingbased on such data and information.
2.7 Update of environmental data (additive systems and parts B to E ofdisposal system)
� UK fuel mix (DTI Energy Statistics 2001, published July 2001): Coal 31%, Nuclear21%, Gas 39%, Oil 1.5%, Import (assumed nuclear as import from France) 4%, Other(waste, wind, landfill gas, sewage sludge) 2.5%, Hydro 1%
� Incineration with heat recovery of plastics and rubbers. Source: WISARD(PricewaterhouseCoopers’ Proprietary database)
� Plastic production (APME, 1999 data)
DTI – Update of WEEE Directive study – February 2002 Page 28This report has been prepared by PricewaterhouseCoopers solely for its client, the DTI, without any third parties in mind.PricewaterhouseCoopersaccepts no liability, responsibility or duty of care to any third parties that receive this report or use the data and
information contained herein, and such third parties assume the entire risk and liability for any actions they may take or refrain from takingbased on such data and information.
3 Analysis of results for each product
This section presents findings of the analysis, first of all in terms of environmental results,then of financial results. The detailed results are available in Annex 1.
3.1 Analysis of environmental resultsThe following table presents the environmental impacts for each product under the WEEEDirective scenario when compared to the current UK scenario.
Signif. Worseover 50%
increase
Worse 10%-50%
increase
No change+/- 10%
Improvement10%-50%
reduction
Signifimprovement over
50% reduction
Washing
Machine
Hazardous
waste, water
toxicity
All other
impacts
Eutrophication, total
waste, non-
renewable resource
depletion, air
toxicity, ozone
depletion
Refrigerator Hazardous
waste,
eutrophication,
water toxicity
All other
impacts
Resource depletion,
ozone depletion,
greenhouse effect
PC Greenhouse
effect
All other impacts
Television All other
impacts
Resource depletion
Lawnmower Total and
hazardous
waste
Energy, Air
acidification,
air toxicity
All other impacts
Vacuum
Cleaner
Hazardous
waste, total
waste
All other
impacts
Ozone depletion,
water toxicity
Table 11. Comparison of environmental cost and benefits under the current UK and the WEEE
directive scenarios
� As shown in the table above, and as in the initial study, the majority of the potentialenvironmental impacts resulting from the introduction of the WEEE Directive arelower than under the current UK scenario.
� A first exception is the indicator of hazardous waste, which appears to be significantlyworse for the WEEE Directive scenario for washing machines and refrigerators. This
DTI – Update of WEEE Directive study – February 2002 Page 29This report has been prepared by PricewaterhouseCoopers solely for its client, the DTI, without any third parties in mind.PricewaterhouseCoopersaccepts no liability, responsibility or duty of care to any third parties that receive this report or use the data and
information contained herein, and such third parties assume the entire risk and liability for any actions they may take or refrain from takingbased on such data and information.
is explained in the case of washing machines by the incineration of the plastic fractionof the WEEE, which produces, among other things, fly ashes that are considered ashazardous materials. Note that the amount of hazardous waste (fly ash essentially)from the washing machine is small (6 kg per tonne of washing machine). Forrefrigerators, the larger burden of hazardous waste under the WEEE directive scenariois due to the foam, which we have labelled as hazardous solid waste (76 kg of foamper tonne of fridge). Note that the treatment of the foam has not been included in theboundary of the system. If we assumed that it is incinerated, then most of the foamwould be transformed into CO2 and H20 molecules. Thus the volume of hazardoussolid waste would decrease considerably.
� Furthermore, in the current UK scenario, the products that are going to landfill are notlabelled as ‘hazardous waste’. Therefore when they are diverted from landfill, theindicator ‘hazardous waste’ is not affected by it. The indicator ‘Total Waste’ is theonly one affected by the diversion from landfill. However, the WEEE products yield‘hazardous waste’ when incinerated and this is reflected in the “hazardous waste”indicator under the WEEE scenario.
� As a conclusion of the above, the WEEE directive does not appear to lead to anysignificant releases of hazardous waste.
� Another exception is the water toxicity indicator.
� For washing machines, the indicator on water toxicity shows a larger burdenunder the WEEE directive scenario (63% larger). This indicator is mostly due tothe release of heavy metals (mostly lead, cadmium and mercury), metals(copper and iron) and suspended matters in water media. Furthermore, thelargest occurrence of this indicator appears in the disposal phases of the plasticfractions, mostly within the treatment of the non-ferrous fractions and of thefluff fractions. This is due to the incineration process of the plastic fractionsand more precisely in the disposal of the incinerator ashes: leachates from thelandfill sites where fly-ashes and bottom-ashes are disposed have a high contentof heavy metals in particular. However the level of accuracy and uncertaintyfor this index is considered as very high and therefore should be handledcarefully. Firstly, our model does not distinguish the heavy metals content of thefly-ashes specific to the washing machine from ashes from other products.Secondly the release of leachates occurs over many years and thus the toxicityof the leachates is diluted over time.
� For refrigerators, as for washing machines, the higher burdens for the watertoxicity indicator are mostly due to the incineration of plastic fluff. In this case,the amount of fly ashes generated is around 13 kg per tonne of fridges. And asbefore, the toxicity is diluted over time.
DTI – Update of WEEE Directive study – February 2002 Page 30This report has been prepared by PricewaterhouseCoopers solely for its client, the DTI, without any third parties in mind.PricewaterhouseCoopersaccepts no liability, responsibility or duty of care to any third parties that receive this report or use the data and
information contained herein, and such third parties assume the entire risk and liability for any actions they may take or refrain from takingbased on such data and information.
� The third exception is the eutrophication indicator for refrigerators, for which thehigher burden occurs at the production stage of new fridges. As it is still possible inour current UK scenario to refurbish a fridge27, the WEEE directive scenario has tooffset this with the production of new fridges. A potential water eutrophicationpotential occurs at that stage and more precisely during manufacture of printed circuitboards. However, it must be noted that the figures remain low (less than 30 gramsequivalent PO4
- per tonne of fridges) and should be treated with caution due to thedatabase uncertainties.
� For televisions, there is very little change in the disposal routes and techniquesbetween the two scenarios, thus the results are similar. The exception is for thedepletion of non-renewable resources for which the WEEE directive scenario shows alarge benefit. This is entirely due to the larger recycling ratio of glass panels that arerich in lead content, thus avoiding the mining of lead ore.
3.2 Analysis of financial results3.2.1 Net value of overall system
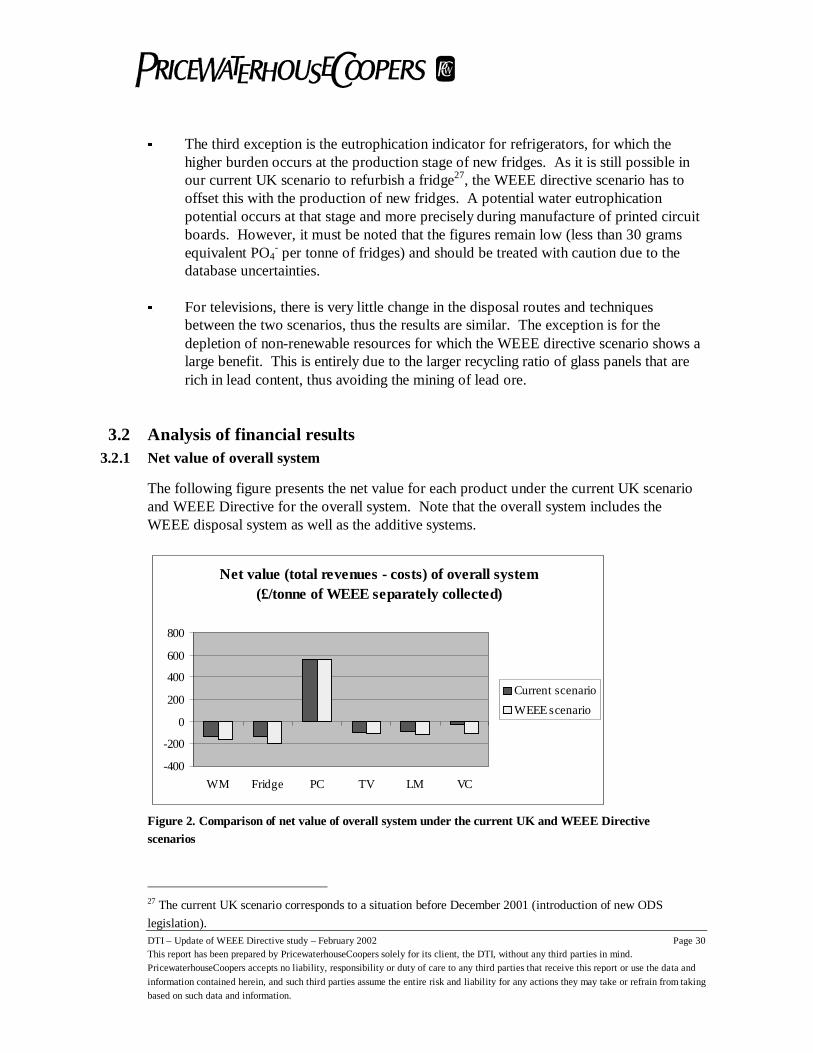
The following figure presents the net value for each product under the current UK scenarioand WEEE Directive for the overall system. Note that the overall system includes theWEEE disposal system as well as the additive systems.
Net value (total revenues - costs) of overall system(£/tonne of WEEE separately collected)
-400
-200
0
200
400
600
800
WM Fridge PC TV LM VC
Current scenario
WEEE scenario
Figure 2. Comparison of net value of overall system under the current UK and WEEE Directivescenarios
27 The current UK scenario corresponds to a situation before December 2001 (introduction of new ODS
legislation).
DTI – Update of WEEE Directive study – February 2002 Page 31This report has been prepared by PricewaterhouseCoopers solely for its client, the DTI, without any third parties in mind.PricewaterhouseCoopersaccepts no liability, responsibility or duty of care to any third parties that receive this report or use the data and
information contained herein, and such third parties assume the entire risk and liability for any actions they may take or refrain from takingbased on such data and information.
• Analysis of the current UK scenarios
As shown in Figure 2, the end-of-life system of all products studied is not cost-effectiveexcept for PCs. This shows that the disposal of WEEE is globally currently a financialburden for society. However, it does not mean that financial profits cannot be made alongthe value chain of the disposal system. Indeed several economic operators of the disposalvalue chain are profitable organisation (e.g. shredders, recyclers, refurbishers).
• WEEE directive scenarios vs. current UK scenarios
The table below summarises the net values for individual products.
Current UK
scenario
WEEE
scenario
WEEE vs
Current UK
Washing Machines (WM) -141 -166 18% worse
Refrigerators -127 -196 54% worse
Personal Computers (PC) 562 560 same
Televisions (TV) -100 -104 4% worse
Lawnmowers (LM) -85 -114 34% worse
Vacuum Cleaners (VC) -25 -104 316% worse
Table 12. Net revenues for individual products for the overall systems (£/tonne)
As shown in Table 12, the implementation of the WEEE directive has a negative financialimpact, as this scenario is more costly than the current situation for most products, exceptPCs for which the net value remains unchanged. PC is the only product for which bothscenarios are cost-effective. The two products for which the increase of costs is more than50% of the current UK scenarios costs are refrigerators and vacuum cleaners.
The main reasons explaining the higher cost of the WEEE directive are increaseddismantling times and increased treatment cost due to the processing of hazardouscomponents. These increases are not compensated by the increase in revenues generated bythe production of larger quantities of recycled materials.
• Cost and revenue breakdown
The following table presents the costs breakdown (into collection, pre-treatment,reprocessing cost of the WEEE disposal system and the cost of the additive systems) as wellas the revenues breakdown into revenues of the WEEE disposal system and the additivesystems.
DTI – Update of WEEE Directive study – February 2002 Page 32This report has been prepared by PricewaterhouseCoopers solely for its client, the DTI, without any third parties in mind.PricewaterhouseCoopersaccepts no liability, responsibility or duty of care to any third parties that receive this report or use the data and
information contained herein, and such third parties assume the entire risk and liability for any actions they may take or refrain from takingbased on such data and information.
Cost of Additive Systems Disposal System Revenue (DR)
��������
Additive System Revenue (AR)
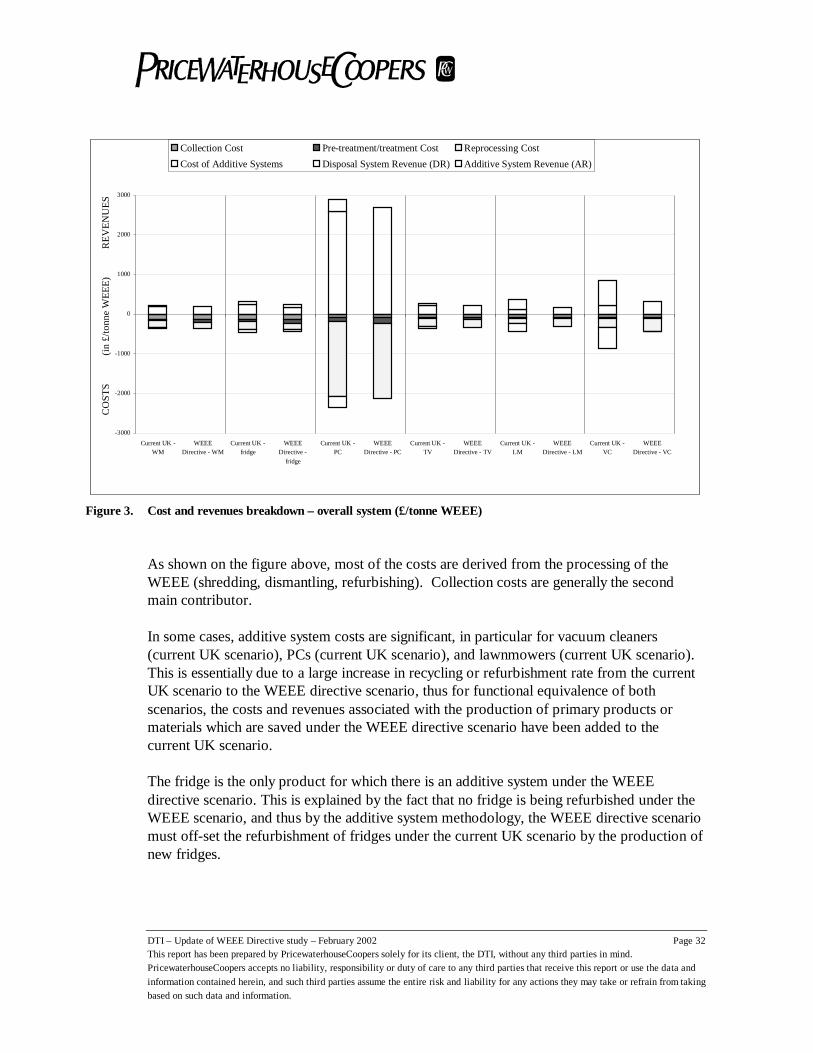
Figure 3. Cost and revenues breakdown – overall system (£/tonne WEEE)
As shown on the figure above, most of the costs are derived from the processing of theWEEE (shredding, dismantling, refurbishing). Collection costs are generally the secondmain contributor.
In some cases, additive system costs are significant, in particular for vacuum cleaners(current UK scenario), PCs (current UK scenario), and lawnmowers (current UK scenario).This is essentially due to a large increase in recycling or refurbishment rate from the currentUK scenario to the WEEE directive scenario, thus for functional equivalence of bothscenarios, the costs and revenues associated with the production of primary products ormaterials which are saved under the WEEE directive scenario have been added to thecurrent UK scenario.
The fridge is the only product for which there is an additive system under the WEEEdirective scenario. This is explained by the fact that no fridge is being refurbished under theWEEE scenario, and thus by the additive system methodology, the WEEE directive scenariomust off-set the refurbishment of fridges under the current UK scenario by the production ofnew fridges.
DTI – Update of WEEE Directive study – February 2002 Page 33This report has been prepared by PricewaterhouseCoopers solely for its client, the DTI, without any third parties in mind.PricewaterhouseCoopersaccepts no liability, responsibility or duty of care to any third parties that receive this report or use the data and
information contained herein, and such third parties assume the entire risk and liability for any actions they may take or refrain from takingbased on such data and information.
The major differences between the UK scenarios and WEEE scenarios are related tovariations in pre-treatment/treatment costs, reprocessing costs and the additive system costsand revenues.
3.2.2 Net value of disposal system
The disposal system of each product represents the costs and revenues of the overall systemminus the additive systems. The following figure presents the net value for each productunder the current UK scenario and WEEE Directive for the WEEE disposal system.
Net value of disposal system(£/tonne of WEEE separately collected)
-300
-200
-100
0
100
200
300
400
500
600
WM Fridge PC TV LM VC
Current scenario
WEEE scenario
Figure 4. Comparison of net value for disposal system under the current UK and WEEE Directive
scenarios
The table below summarises the net values for individual products.
Current UK
scenario
WEEE
scenario
WEEE vs
Current UK
Washing Machines (WM) -144 -166 15% worse
Refrigerators -139 -205 50% worse
Personal Computers (PC) 521 560 7% better
Televisions (TV) -99 -103 4% worse
Lawnmowers (LM) -116 -114 2% better
Vacuum Cleaners (VC) -107 -104 3% better
Table 13. Net value for individual products for the disposal systems (£/tonne)
DTI – Update of WEEE Directive study – February 2002 Page 34This report has been prepared by PricewaterhouseCoopers solely for its client, the DTI, without any third parties in mind.PricewaterhouseCoopersaccepts no liability, responsibility or duty of care to any third parties that receive this report or use the data and
information contained herein, and such third parties assume the entire risk and liability for any actions they may take or refrain from takingbased on such data and information.
The figure above shows a similar profile as for the net value of the overall system (Figure2), except for PCs, vacuum cleaners and lawnmowers for which the additive systems areimportant in the current UK scenario (as explained in the previous section).
In the figure above, the costs and revenues of the disposal of the studied products include therefurbishment of products. However, the refurbishment of products is not taken into accountin the definition of the recovery targets of the WEEE directive.
3.2.3 Net value of disposal system (minus refurbishment costs and revenues)
The figure and the table below represent the net value of a sub-system of the disposal systemas we have excluded the costs28 and revenues of the refurbishment of products.
Net value of disposal systems(minus refurbishment revenues/costs) (£/tonne of WEEE)
-300-200-100
0100200300400500
WM Fridge PC TV LM VC
Current scenario
WEEE scenario
Figure 5. Comparison of net value of disposal system (minus refurbishment revenues/costs)
Unit: £/tonne of product Current UK
scenario
WEEE directive
scenario
Cost29 or revenue
to meet the WEEEdirective targets
Washing Machines (WM) -168 -195 -26
Refrigerators -170 -205 -35
Personal Computers (PC) 335 406 71
Televisions (TV) -126 -133 -16
Lawnmowers (LM) -133 -140 -7
Vacuum Cleaners (VC) -162 -172 -11
Table 14. Comparison of net value of disposal system (minus refurbishment revenues/costs)
28 including collection costs.29 negative value
DTI – Update of WEEE Directive study – February 2002 Page 35This report has been prepared by PricewaterhouseCoopers solely for its client, the DTI, without any third parties in mind.PricewaterhouseCoopersaccepts no liability, responsibility or duty of care to any third parties that receive this report or use the data and
information contained herein, and such third parties assume the entire risk and liability for any actions they may take or refrain from takingbased on such data and information.
As shown above, the net value of the disposal systems without accounting for therefurbished fraction of each product is negative except for PCs. For all products except PCs,the implementation of the WEEE directive would cost between £7/tonne and £35/tonne tomeet the targets.
In the case of PCs, under the current UK scenario, 9% of PCs which are not refurbished, areassumed to go to landfill while under the WEEE scenario, we assume that no PCs go tolandfill. The revenues in the current UK scenario are lower than in the WEEE scenario sincethe £/tonne figure of £335 includes net revenues from both recycling and landfill processes.Considering the recycling of WEEE only, the revenue figure in the current UK scenario willbe £432 per tonne of PC recycled, which is £26 per tonne more than in the WEEE scenario(which is what could be expected as the WEEE scenario imposes additional treatment costsover the current UK situation).
-600
-400
-200
0
200
400
600
800
1000
Current UK -WM
WEEEDirective - WM
Current UK -fridge
WEEEDirective -
fridge
Current UK -PC
WEEEDirective - PC
Current UK -TV
WEEEDirective - TV
Current UK -LM
WEEEDirective - LM
Current UK -VC
WEEEDirective - VC
CO
ST
S(i
n£
/to
nn
e)R
EV
EN
UES
Disposal System Revenue (DR)
Reprocessing Cost
Pre-treatment/treatment Cost
Collection Cost
Figure 6. Costs and revenues breakdown without refurbishment (in £/tonne WEEE)
Looking at the breakdown of the costs, the collection costs appear as a major burden in mostcases. Note that reprocessing costs account for a lower proportion of the total costs in thisfigure than in Figure 3 as they do not include refurbishment costs. The pre-treatment/treatment costs increase significantly for washing machines, refrigerators, PCs andvacuum cleaners.
DTI – Update of WEEE Directive study – February 2002 Page 36This report has been prepared by PricewaterhouseCoopers solely for its client, the DTI, without any third parties in mind.PricewaterhouseCoopersaccepts no liability, responsibility or duty of care to any third parties that receive this report or use the data and
information contained herein, and such third parties assume the entire risk and liability for any actions they may take or refrain from takingbased on such data and information.
3.2.4 Key points of the financial results
� The current UK scenario for the treatment and disposal of WEEE is not cost effectivefor all products except for personal computers. Note that despite an overall deficit infinancial revenues, there are activities along the value chain that are profitable. Thisdeficit is primarily due to the cost of collection, which is typically not entirely borneby shredding, recycling and refurbishment firms.
� The WEEE directive scenario is more costly than the current UK scenario, except forPCs. This is due to an increase in pre-treatment and treatment costs which is higherthan the increase in revenues generated by larger volumes of recycled materials whichwould be put on the market.
� The breakdown of cost shows the importance of the additive system for PCs,lawnmowers and vacuum cleaners for which the displacement from landfilling torefurbishing in the WEEE directive scenario penalises the financial results of theWEEE directive scenario as refurbishing these products is less profitable thanproducing them from raw materials. Looking at the overall system, the main sourcesof cost and revenue are the recycling and refurbishment processes. Excludingrefurbishment in the reprocessing costs, the collection of WEEE becomes the mainsource of cost in most cases.
3.3 Analysis of variantsFor each product, sensitivity analyses have been carried out on the collection routes (seeTable 5). The financial results are presented in the following sections for the overall system,disposal system and disposal system without refurbishment. They are preceded by apresentation of the environmental results.
3.3.1 Environmental impacts
For washing machines and fridges, the environmental impacts of variant 1, 2 and 3 areidentical and are slightly lower or similar to the WEEE baseline scenario. As a result, theconclusions presented in section 3.1 remain the same i.e. the WEEE directive scenario willresult in lower environmental impacts than the current UK scenario, except for a fewimpacts (e.g. hazardous waste, water toxicity).
For PC and televisions, the environmental impacts of variant 1 and 3 are slightly higher orsimilar than those of the baseline. However, there is no change to the conclusions presentedin section 3.1. The WEEE directive is better than the current UK scenario from anenvironmental point of view. The environmental impacts under variant 2 are lower than theWEEE baseline scenario. This is driven by a reduction of products transported by car to
DTI – Update of WEEE Directive study – February 2002 Page 37This report has been prepared by PricewaterhouseCoopers solely for its client, the DTI, without any third parties in mind.PricewaterhouseCoopersaccepts no liability, responsibility or duty of care to any third parties that receive this report or use the data and
information contained herein, and such third parties assume the entire risk and liability for any actions they may take or refrain from takingbased on such data and information.
civic amenities. Thus, most of the environmental impacts under variant 2 are significantlylower (i.e. above 50% reduction) than the current UK scenario.
For lawnmowers and vacuum cleaners, there is no change in terms of waste and hazardouswaste. For all the other impacts, the three variants have lower impacts than the WEEEbaseline scenario, with variant 2 being the most interesting scenario. Under variant 2, allimpacts are significantly lower than the current UK scenario, except for waste andhazardous which remain similar than under the current UK scenario.
Three main conclusions can be drawn:
• The variants do not affect the level of waste and hazardous waste generated. Theconclusions presented in section 3.1 remains the same: the WEEE directive and itsvariants will result in lower or similar level of waste and hazardous waste than thecurrent UK scenario, except for washing machines and fridges.
• For all the other impacts, variant 1 and 3 leads to similar or slightly higherenvironmental impacts. However, this does not affect the conclusions presented insection 3.2, with the WEEE directive leading to lower level of emissions in mostcases.
• For all the other impacts, variant 2 is the most environmentally friendly as it leads toslightly to significantly lower environmental impacts. This reinforces theenvironmental benefits from the WEEE directive scenario. This is due to the fact thatfewer products are transported by cars.
For detailed results, please refer to Annex 1.
3.3.2 Financial results for the overall system
The figure following table presents the net value of the overall system for each individualproduct.
Current UK WEEE Variant 1 Variant 2 Variant 3
WM -141 -166 -174 -174 -174
Fridge -127 -196 -204 -204 -204
PC 562 560 553 522 482
TV -94 -103 -107 -137 -177
LM -85 -114 -125 -156 -195
VC -25 -104 -115 -146 -185
Table 15. Sensitivity to collection routes of the net value for the overall system (£/tonne)
DTI – Update of WEEE Directive study – February 2002 Page 38This report has been prepared by PricewaterhouseCoopers solely for its client, the DTI, without any third parties in mind.PricewaterhouseCoopersaccepts no liability, responsibility or duty of care to any third parties that receive this report or use the data and
information contained herein, and such third parties assume the entire risk and liability for any actions they may take or refrain from takingbased on such data and information.
For washing machines and fridges, the net value of the variants are the same as only onevariant has been undertaken. The variant is more costly than the WEEE directive scenario asa fraction of products brought to civic amenities by car are collected by more expensivemeans of collection, LA collection on demand in that particular case. Thus the gap betweenthe WEEE directive and the current UK scenario gets wider.
For all the other products, the WEEE directive gets increasingly costly with variant 1, 2 and3. Variant 3 is the most costly of the three variants as it assumes a high fraction of productscollected by retailer in-store, which is the most expensive collection route.
• As a result, for TV, lawnmower and vacuum cleaner, as the gap between the WEEEdirective under the variants and the current UK scenarios gets wider, the WEEEscenario remains even more costly than the current UK scenario.
• For PC, the WEEE directive scenario remains cost-effective but becomes lessprofitable than the current UK scenario.
3.3.3 Financial results for the disposal system
The figure following table presents the net value of the disposal system for each individualproduct.
Current UK WEEE Variant 1 Variant 2 Variant 3
WM -144 -166 -174 -174 -174
Fridge -139 -205 -212 -212 -212
PC 521 560 553 522 482
TV -106 -104 -107 -137 -177
LM -116 -114 -125 -156 -195
VC -107 -104 -115 -146 -185
Table 16. Sensitivity to collection routes of the net value for the disposal system (£/tonne)
The conclusions are the same as for the net values for the overall systems.
DTI – Update of WEEE Directive study – February 2002 Page 39This report has been prepared by PricewaterhouseCoopers solely for its client, the DTI, without any third parties in mind.PricewaterhouseCoopersaccepts no liability, responsibility or duty of care to any third parties that receive this report or use the data and
information contained herein, and such third parties assume the entire risk and liability for any actions they may take or refrain from takingbased on such data and information.
3.3.4 Financial results for the disposal system without product refurbishment
Similarly to Table 14, the figure following table presents the differences between the WEEEscenario and its variants with the current UK scenario, based on the net value of the disposalsystem without product refurbishment.
Cost or revenue to meet the WEEE directive
targets (compared to current UK scenario)
WEEE Variant 1 Variant 2 Variant 3
WM -26 -35 -35 -35
Fridge -35 -59 -59 -59
PC 71 58 2 -70
TV -6 -12 -45 -88
LM -7 -20 -53 -96
VC -11 2 -31 -74
Table 17. Sensitivity to collection routes of the net value for the disposal system without
refurbishment (£/tonne)
As outlined above, the variants are more costly than the WEEE baseline scenario, withvariant 3 being the most expensive. For all products, the implementation of the WEEEdirective would cost between £35/tonne and £140/tonne to meet the targets under variant 3.
An overall conclusion of the variants analysis is that the variants are moreenvironmentally friendly but are more costly than the WEEE baseline scenario.
DTI – Update of WEEE Directive study – February 2002 Page 40This report has been prepared by PricewaterhouseCoopers solely for its client, the DTI, without any third parties in mind.PricewaterhouseCoopersaccepts no liability, responsibility or duty of care to any third parties that receive this report or use the data and
information contained herein, and such third parties assume the entire risk and liability for any actions they may take or refrain from takingbased on such data and information.
4 Analysis of results for a pool of products
The objective of this section is to present and analyse the environmental and financial resultsfor a pool of products.
Composition (tonnes)
Washing Machine (WM) 146,200
Refrigerators 119,040
Personal Computers (PC) 71,440
Television (TV) 47,820
Lawnmowers (LM) 21,000
Vacuum Cleaners (VC) 13,740
Total 419,240
Table 18. Composition of mixed pool of products (tonnes/year)
The table above is based on the composition of WEEE in the current estimated UK wastearisings (ICER) and has been used to calculate the total results as presented below.
DTI – Update of WEEE Directive study – February 2002 Page 41This report has been prepared by PricewaterhouseCoopers solely for its client, the DTI, without any third parties in mind.PricewaterhouseCoopersaccepts no liability, responsibility or duty of care to any third parties that receive this report or use the data and
information contained herein, and such third parties assume the entire risk and liability for any actions they may take or refrain from takingbased on such data and information.
4.1 Presentation of resultsThe following table shows the environmental and financial burdens associated with thedisposal of WEEE in the current UK scenario and in the WEEE directive scenario for a poolof products.
Disposal of 419,240 tonnes of mixedWEEE
Outputs/impacts Unit Current
UK
WEEE
directive
Current
UK
WEEE
Directive
Waste (hazardous) kg 3.96E+07 4.52E+07 100% 114%
Waste (total) kg 2.40E+08 1.53E+08 100% 64%
E Total Primary Energy MJ 4.83E+09 2.85E+09 100% 59%
CML-Air Acidification g eq. H+ 8.73E+07 4.46E+07 100% 51%
CML-Eutrophication (water) g eq. PO4 2.46E+06 3.37E+06 100% 137%
CVCH-Air m3 1.26E+14 6.01E+13 100% 48%
CVCH-Water litre 1.30E+10 1.37E+10 100% 106%
EB(R*Y)-Depletion of non renewable
resources
yr-1
2.83E+08 3.52E+06 100% 1%
IPCC-Greenhouse effect (direct, 20 years) kg eq. CO2 4.39E+09 3.80E+08 100% 9%
WMO-Depletion of the ozone layer (high) g eq. CFC-11 6.45E+08 2.33E+07 100% 4%
Costs
Collection Cost Million £ 50 50
Pre-treatment/treatment Cost Million £ 18 33
Reprocessing Cost Million £ 198 194
Sub Total of Disposal System Cost (TDSC) Million £ 266 278
Cost of Additive Systems Million £ 45 7
Total of Overall System Cost (TC) Million £ 311 285
Disposal System Revenue (DR) Million £ 257 261
Additive System Revenue (AR) Million £ 52 8
Total Revenue (TR) Million £ 309 269
Net Value of Disposal System (DR-TDSC) Million £ -9 -17
Net Value of Overall System (TR-TC) Million £ -2 -16
Table 19. Environmental and financial indicators of the current UK scenario and WEEE directivescenario for the disposal of WEEE
DTI – Update of WEEE Directive study – February 2002 Page 42This report has been prepared by PricewaterhouseCoopers solely for its client, the DTI, without any third parties in mind.PricewaterhouseCoopersaccepts no liability, responsibility or duty of care to any third parties that receive this report or use the data and
information contained herein, and such third parties assume the entire risk and liability for any actions they may take or refrain from takingbased on such data and information.
4.2 Environmental indicatorsIt can be seen that most of the environmental indicators are favourable to theimplementation of the WEEE directive, except for hazardous waste, water toxicity andeutrophication. It is therefore consistent with the conclusions drawn for each productindividually with the following remarks:
� The difference between both scenarios in terms of hazardous waste is explained by thecharacterisation of fridges foams as hazardous waste under the WEEE directive scenarioand the increased release of fly ash occurring during the incineration of the plasticcontent of washing machines. However, as explained in section 3.1, the amount ofhazardous waste generated by the WEEE directive scenario does not appear to besignificant.
� Regarding water toxicity, most of the impacts come from fridges, washing machines andtelevisions that have individually a smaller burden on water toxicity in the current UKscenario. As these appliances account for 75% in mass of the total WEEE, their impacton water toxicity dominates the pool result. However the difference between bothscenario is less than 6% and therefore not considered as significant.
� For potential eutrophication, the results are completely dependant on fridges that havethe largest eutrophication potential of all WEEE and account for 28% of the WEEE inmass. However the figures remain low (less than 30 grams equivalent PO4
- per tonne offridges).
Putting environmental indicators into context
CurrentUKscenario
WEEEdirectivescenario
Savings ReferenceUK values
UKreductiontargets
Share of UKreductiontarget
Solid waste to landfill million kg 240 153 87 23,24030 3,48631 2.5%
When looking at some environmental results in the larger context of the UK, it appears thanthe amount of solid waste avoided by the introduction of the WEEE directive would onlyreduced the municipal solid waste going to landfill by 0.1%.
30 1998 amount of municipal waste put in landfill – DETR Waste Strategy 2000 – part 1 p10.31 Target is to reduce by 2005 the amount of municipal waste put to landfill by 85% of 1998 figure. DETR
Waste Strategy 2000 – part 1.
DTI – Update of WEEE Directive study – February 2002 Page 43This report has been prepared by PricewaterhouseCoopers solely for its client, the DTI, without any third parties in mind.PricewaterhouseCoopersaccepts no liability, responsibility or duty of care to any third parties that receive this report or use the data and
information contained herein, and such third parties assume the entire risk and liability for any actions they may take or refrain from takingbased on such data and information.
4.3 Financial indicatorsAs shown in Table 19, the current UK scenario is marginally in deficit of around £2 millionfor the overall system and £9 million for the disposal system. The WEEE directive scenarioshows a higher deficit of £17 million for the overall system and £16 million for the disposalsystem.
With a breakdown of the results by products as shown in the figure below, it can be seen thatthe financial results are driven by large appliances such as washing machines and fridgesand by personal computers due to their share in the total waste arisings.
Net value of overall system for WEEE pool (million £)
-30
-20
-10
0
10
20
30
40
50
WM Fridge PC TV LM VC Total
Current scenario
WEEE scenario
Figure 7. Comparison of net value of overall system under the current UK and WEEE Directive
scenarios (pool of products)
Net value of disposal system for WEEE pool (million £)
-30
-20
-10
0
10
20
30
40
50
WM Fridge PC TV LM VC Total
Current scenario
WEEE scenario
Figure 8. Comparison of net value of disposal system under the current UK and WEEE Directive
scenarios (pool of products)
DTI – Update of WEEE Directive study – February 2002 Page 44This report has been prepared by PricewaterhouseCoopers solely for its client, the DTI, without any third parties in mind.PricewaterhouseCoopersaccepts no liability, responsibility or duty of care to any third parties that receive this report or use the data and
information contained herein, and such third parties assume the entire risk and liability for any actions they may take or refrain from takingbased on such data and information.
Several conclusions can be drawn from the analysis of the above figures:
• The WEEE directive scenario is more costly than the current UK scenario;
• Collection costs are similar between both scenarios as the collection routes are thesame in both scenarios. The increase of management costs of civic amenity sitesexpected under the WEEE directive scenario does not appear to have a significantimpact on the overall results;
• Pre-treatment and treatment costs are higher under the WEEE directive scenario dueto increased dismantling times and increased treatment costs of hazardoussubstances;
• In most cases, reprocessing time is stable between both scenarios. The slightdecrease is due to the fact that fridges are no longer refurbished under the WEEEdirective but are recycled, leading to a lower reprocessing cost as well as a lowerrevenue. Secondly the cost due to the treatment of PC monitors is taken into accountunder the reprocessing cost heading in the current UK scenario and under the pre-treatment/treatment costs in the WEEE directive scenario.
• The cost and revenues of the additive systems is not zero under the WEEE directive.This is due to the fact that new fridges have to be produced under the WEEEdirective scenario to “top up” with refurbished fridges available under the currentUK scenario, but not under the WEEE directive scenario.
DTI – Update of WEEE Directive study – February 2002 Page 45This report has been prepared by PricewaterhouseCoopers solely for its client, the DTI, without any third parties in mind.PricewaterhouseCoopersaccepts no liability, responsibility or duty of care to any third parties that receive this report or use the data and
information contained herein, and such third parties assume the entire risk and liability for any actions they may take or refrain from takingbased on such data and information.
The following table compares the net value of thedisposal systemsunder both scenarios,with and without product refurbishment.
For mixed pool of WEEE
products
Current UK scenario WEEE directive scenario
Net value of disposal system with
product refurbishment
-£9 million (for 419,240 tonnes) -£17 million (for 419,240 tonnes)
Net value of disposal system
without product refurbishment
-£39 million (for 357,570 tonnes) -£45 million (for 365,630 tonnes)
Table 20. Net value of disposal systems with and without product refurbishment
When comparing the net value of the WEEE directive scenario (which excludes productrefurbishment) to the net value of the current UK scenario as it stands today (i.e. withproduct refurbishment), the difference is –£36 million for a pool of mixed WEEE products.This comparison highlights the impact of product refurbishment, which is excluded from thetargets set by the WEEE directive. It must be noted however that this comparison is notmade on the basis of the same volume of discarded products32.
32 This is due to the fact that the volume of refurbished products (whose financial impacts have been deducted
from the disposal system) is higher under the Current UK scenario than the WEEE directive scenario.
DTI – Update of WEEE Directive study – February 2002 Page 46This report has been prepared by PricewaterhouseCoopers solely for its client, the DTI, without any third parties in mind.PricewaterhouseCoopersaccepts no liability, responsibility or duty of care to any third parties that receive this report or use the data and
information contained herein, and such third parties assume the entire risk and liability for any actions they may take or refrain from takingbased on such data and information.
5 Conclusions
For all environmental indicators, the introduction of the WEEE directive has a positiveeffect for most products, mostly due to an increase in refurbishment and recycling ofmaterials.
Regarding the financial aspect of the WEEE directive, the analysis shows that the currentsituation is not cost-effective expect for personal computers. Note that despite an overallnegative figure, profitable activities take place within the disposal value chain (e.g.shredding, refurbishing, recycling). The introduction of the WEEE directive worsens thesituation, as the WEEE directive scenario appears to be more costly than the currentsituation.
For a pool of 420,000 tonnes of WEEE products, the financial results are almost entirelydriven by the disposal cost and revenues associated with white goods and personalcomputers. Disposal cost of the WEEE directive scenario are £12 million higher than thecurrent situation, leading to a total of £280 million, whereas revenues generated by thedisposal system are only £4 million higher for a total of £261 million. The increase ofdisposal costs is due to the increased dismantling times and increased treatment costs ofhazardous substances. Collection and reprocessing costs are globally stable between bothscenarios.
When comparing the disposal value of the WEEE directive scenario, which excludesproduct refurbishment, to the current situation with refurbishment, the additional cost of theDirective is estimated at £36 million.
A number of variants on collection routes have been conducted. The overall conclusion ofthe variants analysis is that they are more environmentally friendly but are more costly thanthe WEEE baseline scenario.
Finally, it must be noted that similar to the initial study, the cost of the WEEE directive isprobably under-estimated, as this study does not account for all potential cost increases suchas capital and infrastructure investment, R&D investment, reorganisation and training costs.
DTI – Update of WEEE Directive study – February 2002 Page 47This report has been prepared by PricewaterhouseCoopers solely for its client, the DTI, without any third parties in mind.PricewaterhouseCoopersaccepts no liability, responsibility or duty of care to any third parties that receive this report or use the data and
information contained herein, and such third parties assume the entire risk and liability for any actions they may take or refrain from takingbased on such data and information.
6 Annex 1: Detailed results
This section contains the environmental and financial costs and benefits for each product,for the current UK scenario, the WEEE Directive scenario and its variants.
For further details, please refer to the attached Excel spreadsheets.
DTI – Update of WEEE Directive study – February 2002 – version 3.5 Page 48
6.1 Washing machinesDisposal of 1 tonne of washing machines – summary results
Comparison vs current UK
Outputs/impacts Units Current UK WEEE Directive Variant 1 Variant 2 Variant 3 WEEE Variant 1 Variant 2 Variant 3
EB(R*Y)-Depletion of non renewable resources yr-1 3648 6 8 4 6 0% 0% 0% 0%
IPCC-Greenhouse effect (direct, 20 years) kg eq. CO2 776 495 564 374 495 64% 73% 48% 64%
WMO-Depletion of the ozone layer (high) g eq. CFC-11 0.043 0.006 0.006 0.006 0.006 14% 14% 14% 14%
Costs Units 0.000 0.000 Variant 1 Variant 2 Variant 3
Collection Cost £ 91 93 94 125 165
Pre-treatment/treatment Cost £ 80 147 152 152 152
Reprocessing Cost £ 1896 1897 1897 1897 1897
Sub Total of Disposal System Cost (TDSC) £ 2066 2136 2143 2174 2213
Cost of Additive Systems £ 276 0 0 0 0
Total of Overall System Cost (TC) £ 2341 2136 2143 2174 2213
Disposal System Revenue (DR) £ 2586 2696 2696 2696 2696
Additive System Revenue (AR) £ 317 0 0 0 0
Total Revenue (TR) £ 2904 2696 2696 2696 2696
Net Value of Disposal System (TR-TDSC) £ 521 560 553 522 482
Net Value of Overall System (TR-TC) £ 562 560 553 522 482
DTI – Update of WEEE Directive study – February 2002 – version 3.5 Page 53
PERSONAL COMPUTERSDisposal of 1 tonne of Personal Computers – summary results without product refurbishmentOutputs/impacts Units CurrentUK WEEEDirective CurrentUK WEEEDirective