“Uncontrolled Copy When Printed” Date printed: 9/03/2018 Caroona Feedlot- Environmental Monitoring Report Page 1 of 15 Date of last revision: 7 March 2018 ENVIRONMENTAL MONITORING REPORT JBS CAROONA FEEDLOT Environment Protection Licence Summary Licence (EPL) Number: 3375 Licensee’s Name: JBS Australia Pty Limited Premises Address: Caroona Feedlot 'Weston' Caroona NSW 2343 Reporting Year: JANUARY 2017 – JANUARY 2018 EPA Monitoring Requirements –JBS Caroona Point 1 & 3 Pollutant Units of Measure Frequency Sampling Method Aggregate Stability As appropriate 3 Years Special Method 1 Available Phosphorus mg/kg Yearly Special Method 1 Bulk density Kg/cubic metre 3 Years Special Method 1 Cation Exchange Capacity centimoles of positive charge/Kg of soil Yearly Special Method 1 Chloride mg/kg Yearly Special Method 1 Conductivity microsiemens/cm Yearly Special Method 1 Exchangeable Calcium centimoles of positive charge per Kg of soil Yearly Special Method 1 Exchangeable Magnesium centimoles of positive charge/Kg of soil Yearly Special Method 1 Exchangeable potassium centimoles of positive charge/Kg of soil Yearly Special Method 1 Exchangeable sodium centimoles of positive charge per Kg of soil Yearly Special Method 1 Exchangeable sodium percentage percent Yearly Special Method 1 Nitrate Mg/Kg Yearly Special Method 1 Nitrogen (Total) Mg/Kg Yearly Special Method 2
Transcript
“Uncontrolled Copy When Printed”
Date printed: 9/03/2018
Caroona Feedlot- Environmental Monitoring Report Page 1 of 15
Pollutant Units of Measure Frequency Sampling Method
Aggregate Stability As appropriate 3 Years Special Method 1
Available Phosphorus mg/kg Yearly Special Method 1
Bulk density Kg/cubic metre 3 Years Special Method 1
Cation Exchange Capacity
centimoles of positive charge/Kg of soil
Yearly Special Method 1
Chloride mg/kg Yearly Special Method 1
Conductivity microsiemens/cm Yearly Special Method 1
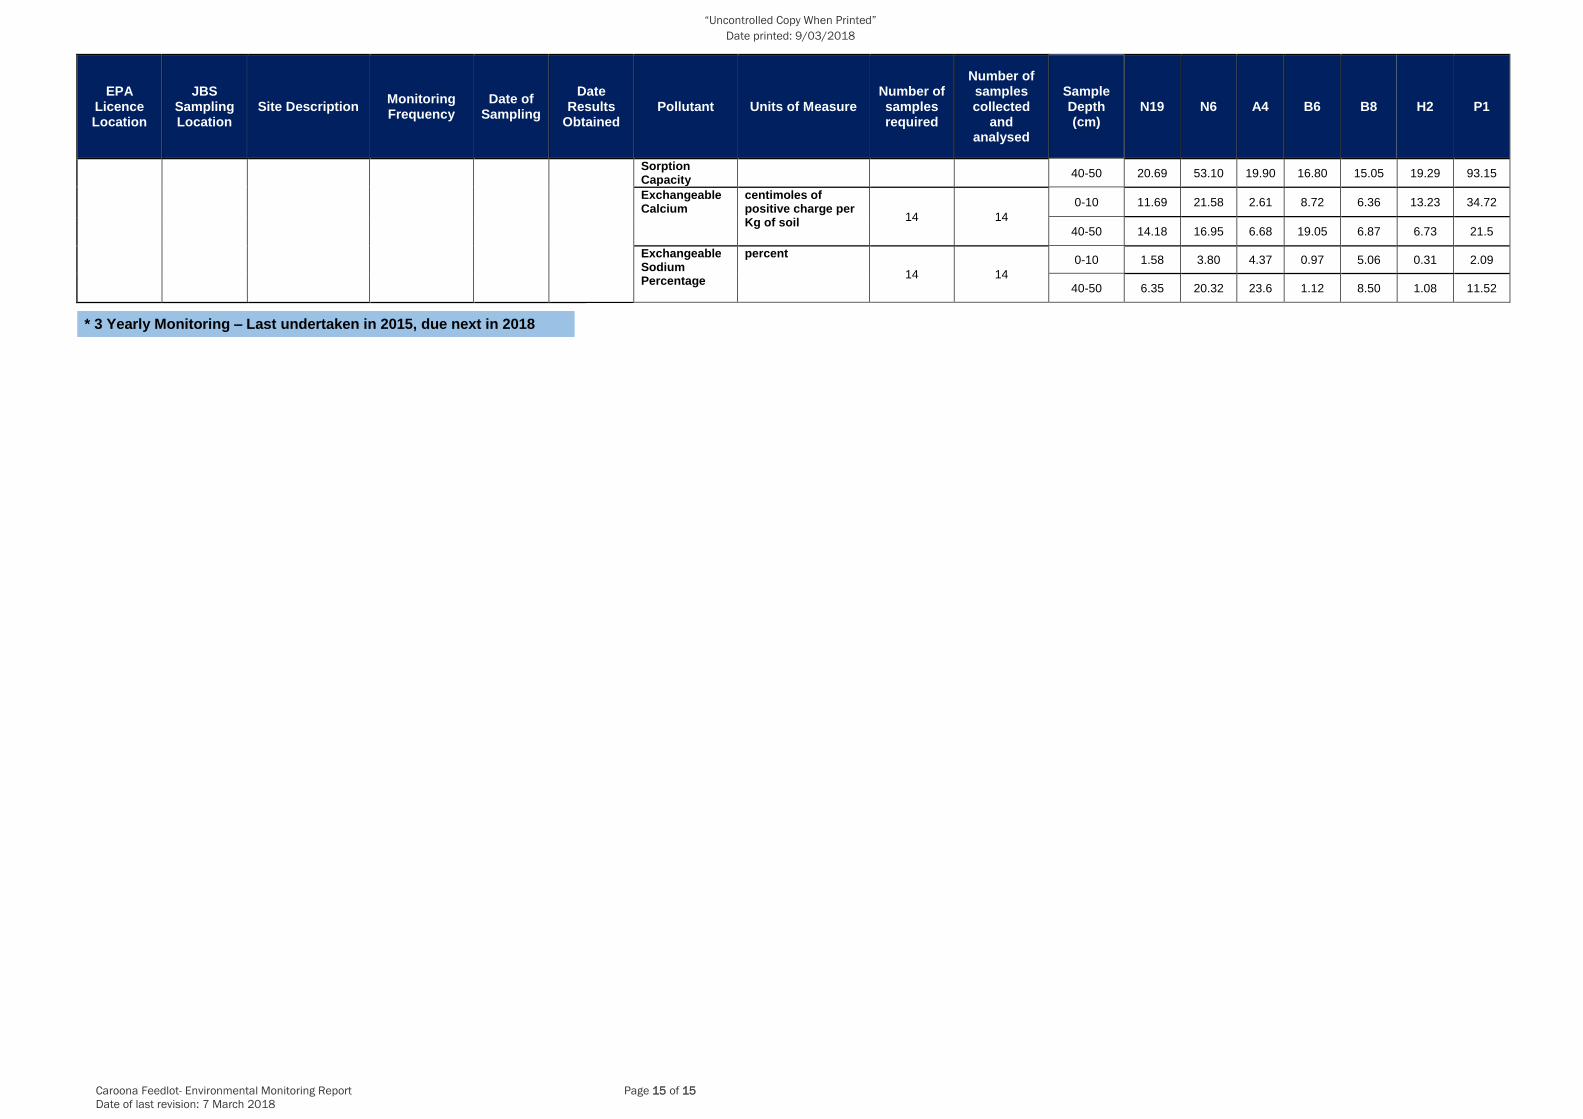
Exchangeable Calcium centimoles of positive charge per Kg of soil
Yearly Special Method 1
Exchangeable Magnesium
centimoles of positive charge/Kg of soil
Yearly Special Method 1
Exchangeable potassium
centimoles of positive charge/Kg of soil
Yearly Special Method 1
Exchangeable sodium centimoles of positive charge per Kg of soil
Yearly Special Method 1
Exchangeable sodium percentage
percent Yearly Special Method 1
Nitrate Mg/Kg Yearly Special Method 1
Nitrogen (Total) Mg/Kg Yearly Special Method 2
“Uncontrolled Copy When Printed”
Date printed: 9/03/2018
Caroona Feedlot- Environmental Monitoring Report Page 2 of 15
Date of last revision: 7 March 2018
Point 1 & 3
Organic Carbon Percent Yearly Special Method 2
pH pH Yearly Special Method 1
Phosphorus Sorption Capacity
phosphorus sorption capacity of soil
3 years Special Method 1
Sodium Adsorption ration
Sodium adsorption ratio
Yearly Special Method 1
Point 2,8,9,10,11, 12
Pollutant Units of Measure Frequency Sampling Method
Conductivity Microsiemens per centimetres
Every 6 months In situ
Nitrate Milligrams per litre Every 6 months Representative Sample
Nitrogen (ammonia) Milligrams per litre Every 6 months Representative Sample
Nitrogen (total) Milligrams per litre Every 6 months Representative Sample
pH pH Every 6 months Representative Sample
Phosphorus (total) Milligrams per litre Every 6 months Representative Sample
Reactive Phosphorus Milligrams per litre Every 6 months Representative Sample
Standing Water Level metres Every 6 months In situ
Point 3
Pollutant Units of Measure Frequency Sampling Method
Calcium Milligrams per litre Every 6 months Representative Sample
Chloride Milligrams per litre Every 6 months Representative Sample
Conductivity Microsiemens per centimetres
Special Frequency 1 In situ
Magnesium Milligrams per litre Every 6 months Representative Sample
Nitrate Milligrams per litre Special Frequency 1 Representative Sample
Nitrate milligrams per litre Special Frequency 1 Representative sample
Nitrogen (ammonia) milligrams per litre Special Frequency 1 Representative sample
Nitrogen (total) milligrams per litre Special Frequency 1 Representative sample
pH pH Special Frequency 1 Representative sample
Phosphorus (total) milligrams per litre Special Frequency 1 Representative sample
“Uncontrolled Copy When Printed”
Date printed: 9/03/2018
Caroona Feedlot- Environmental Monitoring Report Page 3 of 15
Date of last revision: 7 March 2018
Point 3
Potassium milligrams per litre Every 6 months Representative sample
Reactive Phosphorus milligrams per litre Special Frequency 1 Representative sample
Sodium milligrams per litre Every 6 months Representative sample
Sodium Adsorption Ratio
sodium adsorption ratio
Every 6 months Representative sample
Total Kjeldahl Nitrogen milligrams per litre Every 6 months Representative sample
Total suspended solids milligrams per litre Each overflow event Representative sample
For the purpose of the table(s) above Special Frequency 1 means the collection of samples shall occur: (a) at
every overflow event; and (b) every six (6) months
Point 4
Pollutant Units of Measure Frequency Sampling Method
Calcium milligrams per kilogram
Special Frequency 2 Representative sample
Chloride milligrams per kilogram
Special Frequency 2 Representative sample
Conductivity microsiemens per centimetre
Special Frequency 2 Representative sample
Magnesium milligrams per kilogram
Special Frequency 2 Representative sample
Moisture content percent Special Frequency 2 Representative sample
Nitrate milligrams per kilogram
Special Frequency 2 Representative sample
Nitrogen (total) milligrams per kilogram
Special Frequency 2 Representative sample
Organic carbon percent Special Frequency 2 Representative sample
pH pH Special Frequency 2 Representative sample
Phosphorus (total) milligrams per kilogram
Special Frequency 2 Representative sample
Potassium milligrams per kilogram
Special Frequency 2 Representative sample
Sodium milligrams per kilogram
Special Frequency 2 Representative sample
Sodium Adsorption Ratio
sodium adsorption ratio
Special Frequency 2 Representative sample
Sulfur milligrams per kilogram
Special Frequency 2 Representative sample
“Uncontrolled Copy When Printed”
Date printed: 9/03/2018
Caroona Feedlot- Environmental Monitoring Report Page 4 of 15
Date of last revision: 7 March 2018
For the purposes of the table(s) above Special Frequency 2 means the collection of samples shall occur prior to the application of solids to the manure utilisation area and upon removal from the premises.
Point 5
Pollutant Units of Measure Frequency Sampling Method
Aggregate stability As approp. Special Frequency 3 Special Method 1
Available phosphorus milligrams per kilogram
Special Frequency 3 Special Method 1
Bulk density kilograms per cubic metre
Special Frequency 3 Special Method 1
Cation Exchange Capacity
centimoles of positive charge per kilogram of soil
Special Frequency 3 Special Method 1
Chloride milligrams per kilogram
Special Frequency 3 Special Method 1
Conductivity microsiemens per centimetre
Special Frequency 3 Special Method 1
Exchangeable calcium centimoles of positive charge per kilogram of soil
Special Frequency 3 Special Method 1
Exchangeable magnesium
centimoles of positive charge per kilogram of soil
Special Frequency 3 Special Method 1
Exchangeable potassium
centimoles of positive charge per kilogram of soil
Special Frequency 3 Special Method 1
Exchangeable sodium centimoles of positive charge per kilogram of soil
Special Frequency 3 Special Method 1
Exchangeable sodium percentage
percent Special Frequency 3 Special Method 1
Nitrate milligrams per kilogram
Special Frequency 3 Special Method 1
Nitrogen (total) milligrams per kilogram
Special Frequency 3 Special Method 2
Organic carbon percent Special Frequency 3 Special Method 2
pH pH Special Frequency 3 Special Method 1
Phosphorus Sorption Capacity
phosphorus sorption capacity of soil
Special Frequency 3 Special Method 1
Sodium Adsorption Ratio
sodium adsorption ratio
Special Frequency 3 Special Method 1
For the purposes of the table(s) above Special Frequency 3 means the collection of samples shall occur prior to manure application and at least once every three (3) years.
“Uncontrolled Copy When Printed”
Date printed: 9/03/2018
Caroona Feedlot- Environmental Monitoring Report Page 5 of 15
Date of last revision: 7 March 2018
Point 6
Pollutant Units of Measure Frequency Sampling Method
Conductivity microsiemens per centimetre
Each overflow event In situ
Nitrate milligrams per litre Each overflow event Representative sample
Nitrogen (ammonia) milligrams per litre Each overflow event Representative sample
Nitrogen (total) milligrams per litre Each overflow event Representative sample
pH pH Each overflow event In situ
Phosphorus (total) milligrams per litre Each overflow event Representative sample
Reactive Phosphorus milligrams per litre Each overflow event Representative sample
Total suspended solids milligrams per litre Each overflow event Representative sample
Data Gaps During this reporting Period
Licence Location
JBS sampling Location
Frequency Period data is missing
Reason for missing data
No gaps to report
“Uncontrolled Copy When Printed”
Date printed: 9/03/2018
Caroona Feedlot- Environmental Monitoring Report Page 6 of 15