Page 1
Reporting Period
Fiscal 2020 (January 1 to December 31, 2020)
Guidelines Used for Reference
Ministry of the Environment, Environmental Report Guidelines (2012 Edition)
Ministry of the Environment, Environmental Accounting Guidelines (2005 Edition)
Global Reporting Initiative (GRI), Sustainability Reporting Guidelines
Organizational Units Covered
From 2012, the scope of coverage was extended to all consolidated subsidiaries.
Consolidated Subsidiaries Other Subsidiaries and Affiliates
Japan
KOKUYO Co., Ltd. KOKUYO K Heart Co., Ltd., Heartland Co.,
Ltd., IWAMI Paper Industry Co., Ltd.,
KOKUYO Hokkaido Sales Co., Ltd., KOKUYO
Tohoku Sales Co., Ltd., KOKUYO Kitakanto
Sales Co., Ltd., KOKUYO Tokai Sales Co.,
Ltd., KOKUYO Hokuriku-Niigata Sales Co.,
Ltd. , KOKUYO Sanyo-Shikoku Sales Co.,
Ltd.
Kaunet Co., Ltd., KOKUYO Marketing Co., Ltd.,
KOKUYO Supply Logistics Co., Ltd., KOKUYO Logitem
Co., Ltd., KOKUYO Product Shiga Co., Ltd., KOKUYO
MVP Co., Ltd., LmD International Co., Ltd., Actus Co.,
Ltd., KOKUYO Finance Co., Ltd, KOKUYO & Partners
Co., Ltd.
Overseas
KOKUYO Vietnam Co., Ltd., KOKUYO Malaysia Sdn.
Bhd., KOKUYO (Shanghai) Management Co., Ltd.,
KOKUYO Commerce (Shanghai) Co., Ltd., KOKUYO
Furniture (China) Co., Ltd., KOKUYO Design
Consultants (Shanghai) Co., Ltd., KOKUYO
International Asia Co., Ltd., KOKUYO International
(Malaysia) Sdn Hbd, KOKUYO Vietnam TRADING
Co.,Ltd., Kokuyo Camlin Limited
KOKUYO-IK(Thailand) Co., Ltd.
Scope of Report: KOKUYO Co., Ltd., 20 consolidated subsidiaries, and 10 affiliates
KOKUYO Engineering & Technology was integrated with KOKUYO Co., Ltd. in July 2019, but there has been no impact on the environmental
performance data disclosed
Environmental Performance Data
19 KOKUYO Group CSR Report 2021
CSR Data
Page 2
20 KOKUYO Group CSR Report 2021
2020 Results
Environmental
Policy
Goals and Results for 2020Evaluation
Goals Results
Prevention of global
warming
Reduction of CO2 emissions
Total year-on-year reduction in volume:
+1.4%
(Excluding impact of production: -0.9%)
-15.5%
(Excluding impact of production:
-2.3%)○
Reduction of unit energy consumption
Year-on-year reduction: -1.0%
Per unit of sales: -6.0%○
Resource
Conservation and
Recycling
Improve recycling rate in relation to total
waste volume
Business offices: 96.6% and over
Construction sites: 88.0% and over
Business offices: 96.6%○
Construction sites: 82.0%×
Procurement,
development, and
provision of eco-
friendly products
Maintain eco x zero Maintained
○
Information
disclosure and
communication
Publication of CSR report 2020 Publication of CSR report 2020
○
Environmental
management
ISO 14001: Regular inspection in 2015 Regular inspection results
Strong point: 1 cases
Good points: 2 cases
Matters pointed out for
improvement: 0 cases
Opportunities for improvement:
26 cases
○
*1 Targets are applicable to the following companies:
KOKUYO Co., Ltd.; Kaunet Co., Ltd.; KOKUYO Marketing Co., Ltd.; KOKUYO Engineering & Technology Co., Ltd.; KOKUYO Supply Logistics
Co., Ltd.; KOKUYO Logitem Co., Ltd.; KOKUYO Product Shiga Co., Ltd.; KOKUYO MVP Co., Ltd.; KOKUYO K Heart Co., Ltd.; KOKUYO
VIETNAM Co., Ltd.; KOKUYO (MALAYSIA) Sdn. Bhd.; and KOKUYO-IK (THAILAND) Co., Ltd.
Page 3
The KOKUYO Group designates unique environmental friendliness efficiency indicators as indices to comprehensively evaluate financial performance and
impact on the global environment.
These indicators show the extent to which products and services are being
offered to society with respect to specific environmental load and correspond
to the following four items.
1. CO2emissions
2. Final waste disposal
3. Usage of chemical substances subject to PRTR regulations
4. Water usage
Environmental Friendliness Efficiency Indicators
Using fiscal 2000 as the baseline for each indicator, the progress status for each fiscal year can be determined.
Environmental Friendliness Efficiency Indicators
* Chemical substances were calculated according to the amount of PRTR Law Class I Designated
Chemical Substances used and handled by the business establishments subject to notification under
the PRTR Law.
* The third party verification pointed out that a part of the data on waste materials of KOKUYO Vietnam
was omitted from the report calculations. From 2015, this data is included in the report.
21 KOKUYO Group CSR Report 2021
Page 4
CO2 Emission Transitions
* Electricity-based emission factors are calculated using the basic
emission factors of the relevant electrical power companies for
each given year
CO2 emission transitions
* Differences due to changes in emission factors are calculated
using the average emission factors of all power sources in 2000
(0.378kg-CO2/kwh).
JEPIX
JEPIX (Japan Environmental Policy Priorities Index) is a method of
quantifying the individual amount of different types of environmental loads,
such as greenhouse gas emissions and air pollutants, as single indicators
called Environmental Impact Points (EIP). The EIP is calculated by
multiplying the environmental load of each environmentally harmful chemical by the integrated coefficient, which is
calculated from the ratio between Japan's environmental policy target and the actual amount of emissions (environmental
friendliness factor), and then obtaining the sum total of them all.
JEPIX
Global Warming Preventive Measures
22 KOKUYO Group CSR Report 2021
Page 5
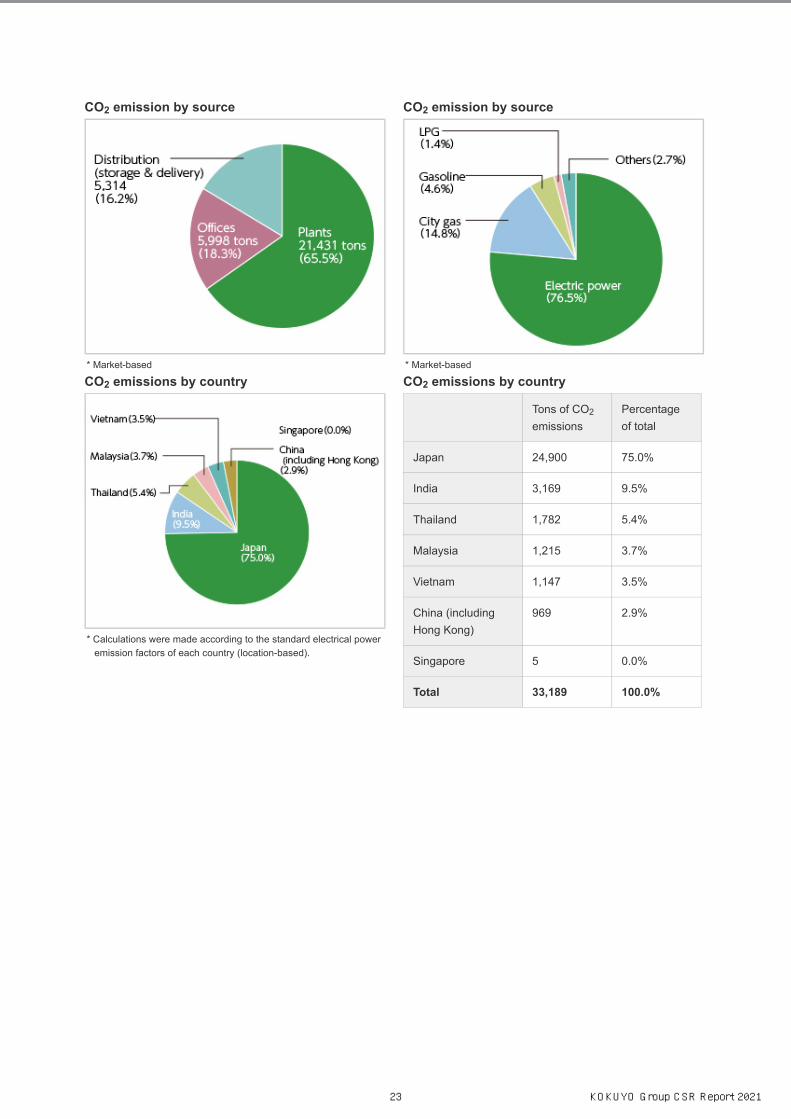
CO2 emission by source CO2 emission by source
* Market-based
CO2 emissions by country
* Calculations were made according to the standard electrical power
emission factors of each country (location-based).
* Market-based
CO2 emissions by country
Tons of CO2
emissions
Percentage
of total
Japan 24,900 75.0%
India 3,169 9.5%
Thailand 1,782 5.4%
Malaysia 1,215 3.7%
Vietnam 1,147 3.5%
China (including
Hong Kong)
969 2.9%
Singapore 5 0.0%
Total 33,189 100.0%
23 KOKUYO Group CSR Report 2021
Page 6
24 KOKUYO Group CSR Report 2021
Scope 3 categories and emissions
Category
Applicable/
Not
applicable
Reason for
Non-
applicability
Scope 3
Emissions
As
Percentage
of Total
As
Percentage
of Total
Emissions
Category 1 Purchased products / services Applicable - 423,833 83.0% 78.0%
Category 2 Capital goods Applicable - 13,760 2.7% 2.5%
Category 3
Fuel not included in Scope 1
or 2 and energy-related
activities
Applicable - 5,449 1.1% 1.0%
Category 4Shipping and delivery
(upstream)
Applicable - 20,490 4.0% 3.8%
Category 5Waste materials generated by
businesses
Applicable - 3,571 0.7% 0.7%
Category 6 Business trips Applicable - 895 0.2% 0.2%
Category 7 Commuting by workers Applicable - 2,363 0.5% 0.4%
Category 8Leased assets (upstream) Not applicable Included in
Scope 1 / 2
- 0.0% 0.0%
Category 9Shipping and delivery
(downstream)
Not applicable Included in
Category 4
- 0.0% 0.0%
Category 10
Processing of sold products Not applicable KOKUYO is a
manufacturer
of completed
products and
does not deal
with
intermediate
products
- 0.0% 0.0%
Category 11 Use of sold products Applicable - 504 0.1% 0.1%
Category 12 Discarding of sold products Applicable - 39,020 7.6% 7.2%
Category 13 Leased assets (downstream) Applicable - 838 0.2% 0.2%
Category 14 Franchises Not applicable No franchises - 0.0% 0.0%
Category 15Investments Not applicable No
investments
- 0.0% 0.0%
Total - - - 510,723 - -
Page 7
25 KOKUYO Group CSR Report 2021
Greenhouse gases emitted by the supply chain (by scope) (Tons of CO2)
Greenhouse gases emitted by the supply chain(for Scope 3)
Amount of CO2 absorbed by Yui no Mori
Amount of CO2 absorbed by Yui no Mori (cumulative total)
Page 8
Waste Materials: Recycling and Final Disposal
Amounts
Waste Materials by Activity
Waste material types (Recycling rate in
brackets)
Emissions by Country
Resource Saving and Recycling
26 KOKUYO Group CSR Report 2021
Page 9
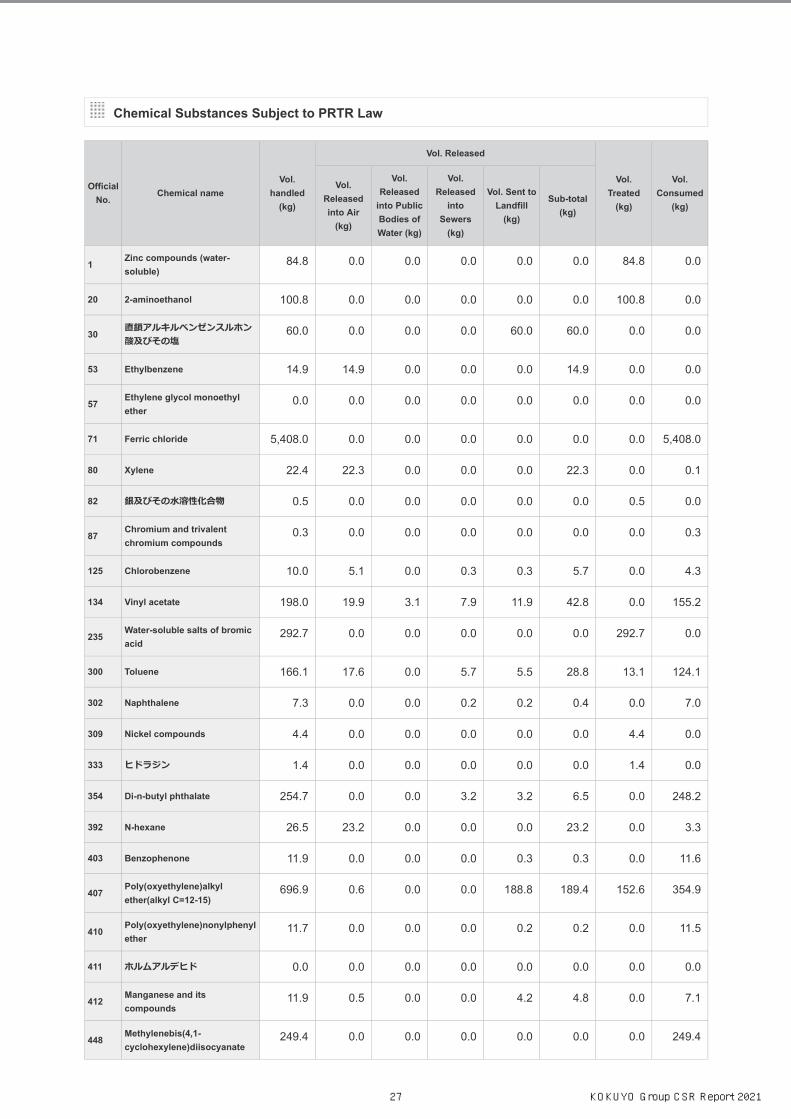
Chemical Substances Subject to PRTR Law
Official
No.Chemical name
Vol.
handled
(kg)
Vol. Released
Vol.
Treated
(kg)
Vol.
Consumed
(kg)
Vol.
Released
into Air
(kg)
Vol.
Released
into Public
Bodies of
Water (kg)
Vol.
Released
into
Sewers
(kg)
Vol. Sent to
Landfill
(kg)
Sub-total
(kg)
1Zinc compounds (water-
soluble)84.8 0.0 0.0 0.0 0.0 0.0 84.8 0.0
20 2-aminoethanol 100.8 0.0 0.0 0.0 0.0 0.0 100.8 0.0
30直鎖アルキルベンゼンスルホン酸及びその塩
60.0 0.0 0.0 0.0 60.0 60.0 0.0 0.0
53 Ethylbenzene 14.9 14.9 0.0 0.0 0.0 14.9 0.0 0.0
57Ethylene glycol monoethyl
ether0.0 0.0 0.0 0.0 0.0 0.0 0.0 0.0
71 Ferric chloride 5,408.0 0.0 0.0 0.0 0.0 0.0 0.0 5,408.0
80 Xylene 22.4 22.3 0.0 0.0 0.0 22.3 0.0 0.1
82 銀及びその⽔溶性化合物 0.5 0.0 0.0 0.0 0.0 0.0 0.5 0.0
87Chromium and trivalent
chromium compounds0.3 0.0 0.0 0.0 0.0 0.0 0.0 0.3
125 Chlorobenzene 10.0 5.1 0.0 0.3 0.3 5.7 0.0 4.3
134 Vinyl acetate 198.0 19.9 3.1 7.9 11.9 42.8 0.0 155.2
235Water-soluble salts of bromic
acid292.7 0.0 0.0 0.0 0.0 0.0 292.7 0.0
300 Toluene 166.1 17.6 0.0 5.7 5.5 28.8 13.1 124.1
302 Naphthalene 7.3 0.0 0.0 0.2 0.2 0.4 0.0 7.0
309 Nickel compounds 4.4 0.0 0.0 0.0 0.0 0.0 4.4 0.0
333 ヒドラジン 1.4 0.0 0.0 0.0 0.0 0.0 1.4 0.0
354 Di-n-butyl phthalate 254.7 0.0 0.0 3.2 3.2 6.5 0.0 248.2
392 N-hexane 26.5 23.2 0.0 0.0 0.0 23.2 0.0 3.3
403 Benzophenone 11.9 0.0 0.0 0.0 0.3 0.3 0.0 11.6
407Poly(oxyethylene)alkyl
ether(alkyl C=12-15)696.9 0.6 0.0 0.0 188.8 189.4 152.6 354.9
410Poly(oxyethylene)nonylphenyl
ether11.7 0.0 0.0 0.0 0.2 0.2 0.0 11.5
411 ホルムアルデヒド 0.0 0.0 0.0 0.0 0.0 0.0 0.0 0.0
412Manganese and its
compounds11.9 0.5 0.0 0.0 4.2 4.8 0.0 7.1
448Methylenebis(4,1-
cyclohexylene)diisocyanate249.4 0.0 0.0 0.0 0.0 0.0 0.0 249.4
27 KOKUYO Group CSR Report 2021
Page 10
Official
No.Chemical name
Vol.
handled
(kg)
Vol. Released
Vol.
Treated
(kg)
Vol.
Consumed
(kg)
Vol.
Released
into Air
(kg)
Vol.
Released
into Public
Bodies of
Water (kg)
Vol.
Released
into
Sewers
(kg)
Vol. Sent to
Landfill
(kg)
Sub-total
(kg)
453Molybdenum and its
compounds192.6 0.0 0.0 0.0 0.0 0.0 0.0 192.6
Total 7,827.2 104.2 3.1 17.3 274.7 399.3 650.3 6,777.6
* The volume of PRTR Law Class I Designated Chemical Substances that were used, handled, released, transferred, disposed, recycled, and
consumed by the business establishments (in Japan) subject to notification under the PRTR Law. For the calculation methods, see the
Ministry of the Environment/Ministry of Economy, Trade and Industry's PRTR Release Estimation Methods Manual, version 4.1 (March 2011).
* "Volume treated" refers to those PRTR designated substances that were treated on site by incineration, neutralization, breaking down, reactive
process, etc.
* "Volume consumed" refers to the volume of PRTR designated substances that were modified by way of reaction into other substances,
incorporated into products or moved off-site with products.
28 KOKUYO Group CSR Report 2021
Page 11
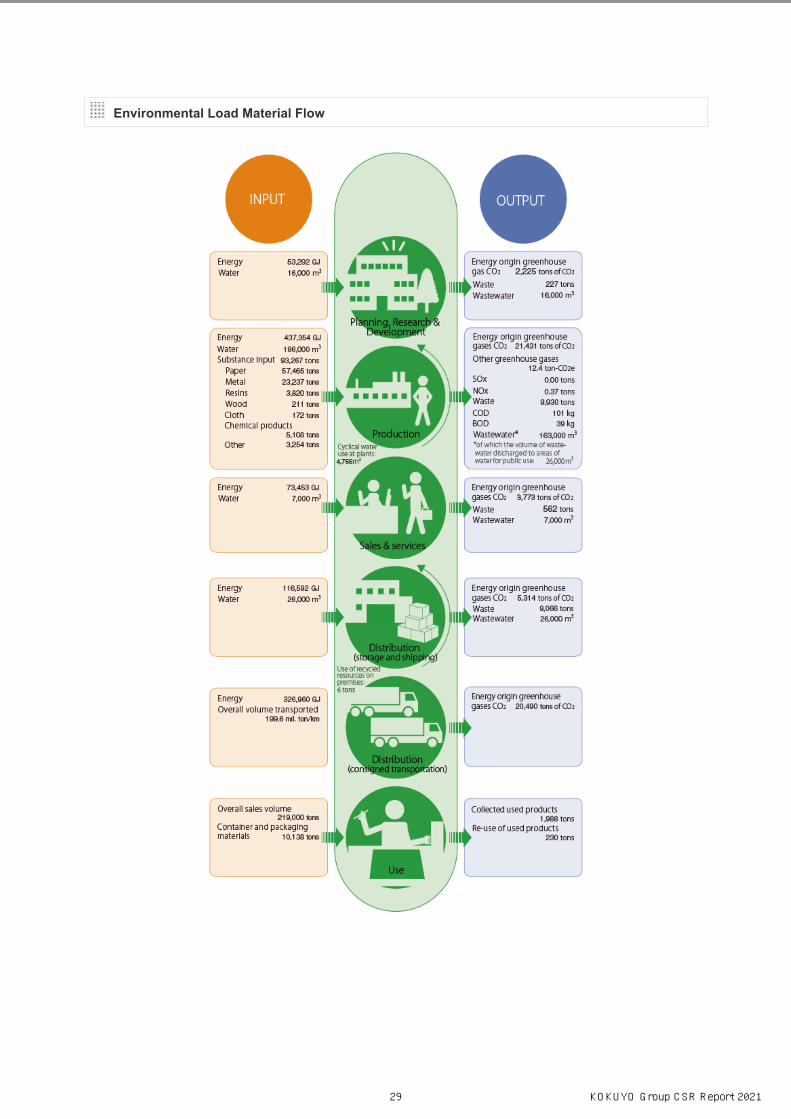
Environmental Load Material Flow
29 KOKUYO Group CSR Report 2021
Page 12
Input items
Indicator Unit Calculation method
Volume of energy
usedGJ
Power, gas (city gas, LPG, natural gas), oil (gasoline, light oil, kerosene, fuel oil A), heat
(hot water, cold water)
The power unit calorific values are the daytime and nighttime power values stated in the
Enforcement Regulations of the Act on the Rational Use of Energy (effective from April
1, 2008).
The unit calorific values of gas, oil, and heat are those values presented in the
Greenhouse Gas Emission Calculation and Reporting Manual, Ver. 4.4 (July 2019
(Ministry of the Environment, Ministry of Economy, Trade and Industry).
Water1,000
m3
Tap water, water for industrial use
Substance Input Tons The volume of raw materials used to manufacture KOKUYO products
Overall Sales
Volume
10,000
tons
Data from furniture and stationery products
Container and
Packaging
Materials
Tons
The volume of packaging materials used to package products
30 KOKUYO Group CSR Report 2021
Page 13
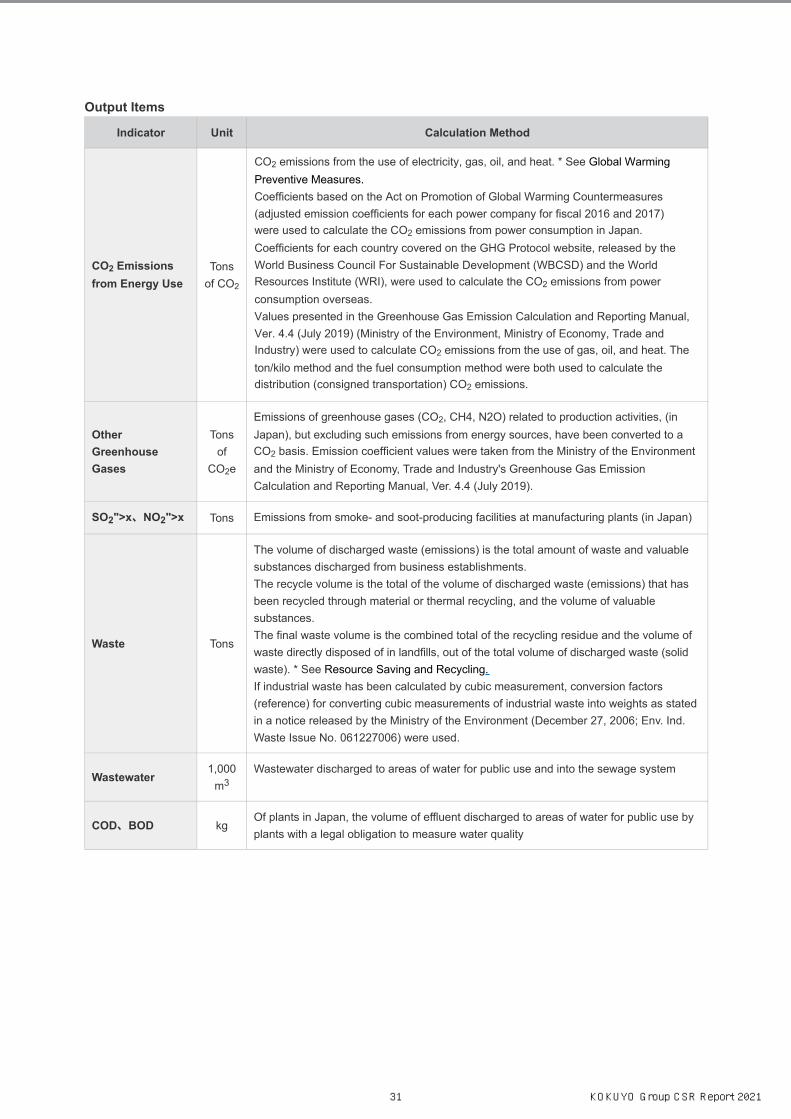
Output Items
Indicator Unit Calculation Method
CO2 Emissions from Energy Use
Tons
of CO2
CO2 emissions from the use of electricity, gas, oil, and heat. * See Global Warming Preventive Measures.Coefficients based on the Act on Promotion of Global Warming Countermeasures
(adjusted emission coefficients for each power company for fiscal 2016 and 2017)
were used to calculate the CO2 emissions from power consumption in Japan.
Coefficients for each country covered on the GHG Protocol website, released by the World Business Council For Sustainable Development (WBCSD) and the World Resources Institute (WRI), were used to calculate the CO2 emissions from power consumption overseas.
Values presented in the Greenhouse Gas Emission Calculation and Reporting Manual, Ver. 4.4 (July 2019) (Ministry of the Environment, Ministry of Economy, Trade and Industry) were used to calculate CO2 emissions from the use of gas, oil, and heat. The
ton/kilo method and the fuel consumption method were both used to calculate the distribution (consigned transportation) CO2 emissions.
Other
Greenhouse
Gases
Tons
of
CO2e
Emissions of greenhouse gases (CO2, CH4, N2O) related to production activities, (in Japan), but excluding such emissions from energy sources, have been converted to a CO2 basis. Emission coefficient values were taken from the Ministry of the Environment and the Ministry of Economy, Trade and Industry's Greenhouse Gas Emission Calculation and Reporting Manual, Ver. 4.4 (July 2019).
SO2">x、NO2">x Tons Emissions from smoke- and soot-producing facilities at manufacturing plants (in Japan)
Waste Tons
The volume of discharged waste (emissions) is the total amount of waste and valuable substances discharged from business establishments.
The recycle volume is the total of the volume of discharged waste (emissions) that has been recycled through material or thermal recycling, and the volume of valuable substances.
The final waste volume is the combined total of the recycling residue and the volume of waste directly disposed of in landfills, out of the total volume of discharged waste (solid waste). * See Resource Saving and Recycling.
If industrial waste has been calculated by cubic measurement, conversion factors
(reference) for converting cubic measurements of industrial waste into weights as stated in a notice released by the Ministry of the Environment (December 27, 2006; Env. Ind. Waste Issue No. 061227006) were used.
Wastewater1,000
m3Wastewater discharged to areas of water for public use and into the sewage system
COD、BOD kgOf plants in Japan, the volume of effluent discharged to areas of water for public use by
plants with a legal obligation to measure water quality
31 KOKUYO Group CSR Report 2021
Page 14
Other items
Indicator Unit Calculation Method
Overall
Transportation
Volume
Tons/km
The total of the following outsourced transportation volumes: total domestic
transportation in Japan including the transportation of furniture products, store fixtures,
stationery products, transportation of catalog sales by Kaunet, and transportation of
Actus products; and transportation of products between overseas sites and within
Malaysia.
Cyclical Water
Use at Plantsm3 The volume of water used in a cyclical way (i.e. recycled) on business premises
Cyclical Resource
Use on SitesTons
The volume of recycled resources, such as packaging materials, on the business
premises of KOKUYO Logitem Co., Ltd. and KOKUYO Supply Logistics Co., Ltd.
Collected Used
ProductsTons
The volume of used products collected from customers by KOKUYO Logitem Co., Ltd.
Re-use of Used
ProductsTons
The volume of re-used products from the used products collected from customers by
KOKUYO Logitem Co., Ltd.
32 KOKUYO Group CSR Report 2021
Page 15
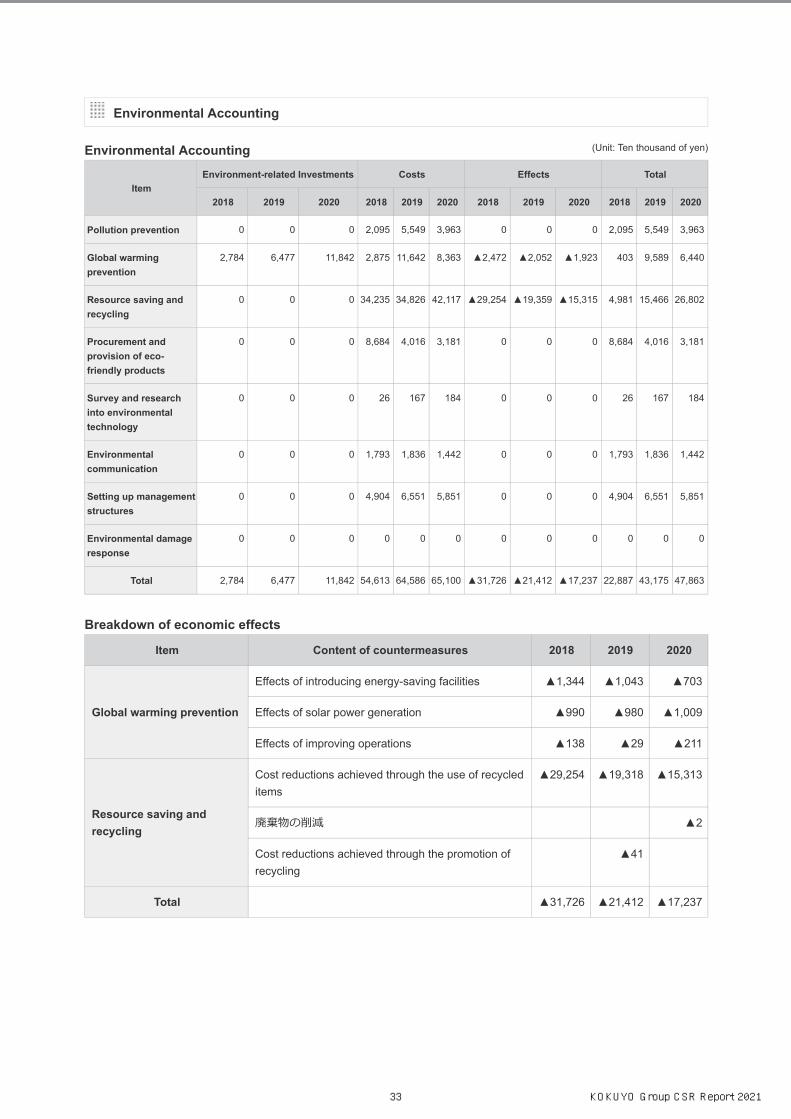
Environmental Accounting (Unit: Ten thousand of yen)
Breakdown of economic effects
Environmental Accounting
Item
Environment-related Investments Costs Effects Total
2018 2019 2020 2018 2019 2020 2018 2019 2020 2018 2019 2020
Pollution prevention 0 0 0 2,095 5,549 3,963 0 0 0 2,095 5,549 3,963
Global warming
prevention
2,784 6,477 11,842 2,875 11,642 8,363 ▲2,472 ▲2,052 ▲1,923 403 9,589 6,440
Resource saving and
recycling
0 0 0 34,235 34,826 42,117 ▲29,254 ▲19,359 ▲15,315 4,981 15,466 26,802
Procurement and
provision of eco-
friendly products
0 0 0 8,684 4,016 3,181 0 0 0 8,684 4,016 3,181
Survey and research
into environmental
technology
0 0 0 26 167 184 0 0 0 26 167 184
Environmental
communication
0 0 0 1,793 1,836 1,442 0 0 0 1,793 1,836 1,442
Setting up management
structures
0 0 0 4,904 6,551 5,851 0 0 0 4,904 6,551 5,851
Environmental damage
response
0 0 0 0 0 0 0 0 0 0 0 0
Total 2,784 6,477 11,842 54,613 64,586 65,100 ▲31,726 ▲21,412 ▲17,237 22,887 43,175 47,863
Item Content of countermeasures 2018 2019 2020
Global warming prevention
Effects of introducing energy-saving facilities ▲1,344 ▲1,043 ▲703
Effects of solar power generation ▲990 ▲980 ▲1,009
Effects of improving operations ▲138 ▲29 ▲211
Resource saving and
recycling
Cost reductions achieved through the use of recycled
items
▲29,254 ▲19,318 ▲15,313
廃棄物の削減 ▲2
Cost reductions achieved through the promotion of
recycling
▲41
Total ▲31,726 ▲21,412 ▲17,237
33 KOKUYO Group CSR Report 2021
Page 16
No. Company Name Site Name
1
KOKUYO
Head Office (including
XT and WS)
2Tokyo Shinagawa
Office
3Tokyo Shinagawa SST
Office
4Tokyo Kasumigaseki
Office
5 Nagoya Office
6 Osaka Umeda Office
7 Mie Factory
8 Shibayama Factory
9 KOKUYO K Heart Head Office
10KOKUYO MVP
Tottori Factory
11 Aoya Factory
12KOKUYO Product
ShigaHead Office
13
KOKUYO Logitem
Head Office
14Sendai Distribution
Center
15Gunma Distribution
Center
16
Central Japan Delivery
and Distribution
Center
17Central Japan Delivery
Center
18Shin Chiba Distribution
Center
19Shiga Distribution
Center
20 Mie Distribution Center
21 Ina Distribution Center
No. Company Name Site Name
37
Kaunet
Head Office
38Tokyo Shinagawa
Office
39Sapporo Distribution
Center
40East Japan
Distribution Center
41Central Japan
Distribution Center
42West Japan
Distribution Center
43Fukuoka Distribution
Center
44
KOKUYO Marketing
Head Office
45 Tachikawa Office
46 Chiba Office
47 Saitama Office
48 Yokohama Office
49 Nagano Office
50 Matsumoto Office
51 Nagoya Office
52 Shizuoka Office
53 Umeda Office
54 Kyoto Office
55 Kobe Office
56 Wakayama Office
57 Hiroshima Office
58 Yamaguchi Office
59 Matsue Office
60 Fukuoka Office
Sites with ISO 14001 Certification
34 KOKUYO Group CSR Report 2021
Page 17
22Chubu Delivery and
Distribution Center
23Toyama Distribution
Center
24Fujiwara Distribution
Center
25Komono Distribution
Center
26Kansai Delivery and
Distribution Center
27Okayama Distribution
Center
28Kyushu Distribution
Center
29
KOKUYO Supply
Logistics
Head Office
30Ibaraki Distribution
Center
31
Metropolitan Area
Integrated Distribution
Center
32Kyushu Integrated
Distribution Center
33Chubu Integrated
Distribution Center
34Shiga National
Distribution Center
35Kinki Integrated
Distribution Center
36Osaka Nanko
Distribution Center
No. Company Name Site Name
61 Nagasaki Office
62 Miyazaki Office
63 Kagoshima Office
64 Kumamoto Office
65 Oita Office
66 Okinawa Office
67 KOKUYO (Malaysia) Head Office
68KOKUYO-IK
ThailandHead Office
69
KOKUYO Camlin
PATALGANGA PLANT
70 TARAPUR PLANT
71 SAMBA PLANT
72
KOKUYO
Commerce
(Shanghai)
Head Office
73 Shanghai Factory
74 Beijing Office
75 Shenzhen Office
No. Company Name Site Name
35 KOKUYO Group CSR Report 2021
Page 18
Reports on Business Sites in Japan
KOKUYO discloses such information on seven manufacturing plants in Japan.
* In the tables featured in this report, the figure "0" indicates that numbers have been rounded off to zero. Also, "-" indicates that there are no
figures corresponding to the given item.
* CO2 emissions were calculated by applying the emission coefficient for each power company.
* Wastewater emissions are disclosed herein only for those business sites where measurements of such emissions are required by law;
however, since abnormal pH values were detected at the KOKUYO Product Shiga site in fiscal 2007, its emissions have been measured and
disclosed voluntarily.
Reports on Business Sites Overseas
Information on 7 plants located in Thailand, Malaysia, Vietnam, China, and India (3 plants) are hereby disclosed. CO2
emissions increased due to higher production at plants in Malaysia and India for fiscal 2016.
* Kokuyo Camlin (India) Taloja Factory and Jammu Factory have been closed.
* CO2 emissions were calculated by applying the emission coefficient for each country.
KOKUYO measures the impact on the natural environment of the activities of its principal business sites in Japan and
overseas and uses this information when considering appropriate policies, setting objectives, and carrying out other
activities.
36 KOKUYO Group CSR Report 2021
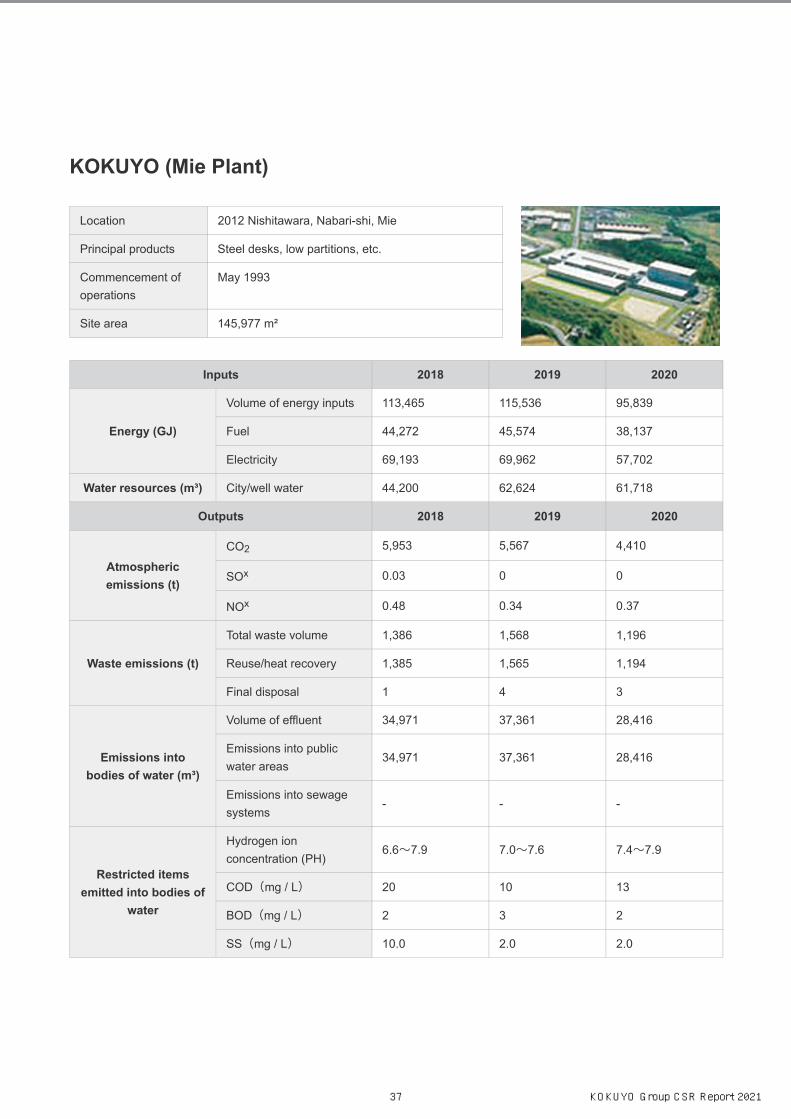
Page 19
Location 2012 Nishitawara, Nabari-shi, Mie
Principal products Steel desks, low partitions, etc.
Commencement of
operations
May 1993
Site area 145,977 m²
Inputs 2018 2019 2020
Energy (GJ)
Volume of energy inputs 113,465 115,536 95,839
Fuel 44,272 45,574 38,137
Electricity 69,193 69,962 57,702
Water resources (m³) City/well water 44,200 62,624 61,718
Outputs 2018 2019 2020
Atmospheric
emissions (t)
CO2 5,953 5,567 4,410
SOx 0.03 0 0
NOx 0.48 0.34 0.37
Waste emissions (t)
Total waste volume 1,386 1,568 1,196
Reuse/heat recovery 1,385 1,565 1,194
Final disposal 1 4 3
Emissions into
bodies of water (m³)
Volume of effluent 34,971 37,361 28,416
Emissions into public
water areas34,971 37,361 28,416
Emissions into sewage
systems- - -
Restricted items
emitted into bodies of
water
Hydrogen ion
concentration (PH)6.6〜7.9 7.0〜7.6 7.4〜7.9
COD(mg / L) 20 10 13
BOD(mg / L) 2 3 2
SS(mg / L) 10.0 2.0 2.0
37 KOKUYO Group CSR Report 2021
Page 20
Location 3155-4 Ohdai, Shibayama-machi, Sanbu-gun,
Chiba
Principal products Room dividers, low partitions, cabinets, etc.
Commencement of
operations
June 1994
Site area 73,734 m²
Inputs 2018 2019 2020
Energy (GJ)
Volume of energy inputs 120,215 119,547 106,889
Fuel 61,358 61,296 51,978
Electricity 58,857 58,251 54,911
Water resources (m³) City/well water 15,011 15,593 13,192
Outputs 2018 2019 2020
Atmospheric
emissions (t)
CO2 5,920 5,838 5,155
SOx - - -
NOx - - -
Waste emissions (t)
Total waste volume 2,694 2,455 2,315
Reuse/heat recovery 2,694 2,455 2,315
Final disposal 0 0 0
Emissions into
bodies of water (m³)
Volume of effluent 9,879 10,462 8,755
Emissions into public
water areas4,285 4,787 3,631
Emissions into sewage
systems5,594 5,675 5,124
Restricted items
emitted into bodies of
water
Hydrogen ion
concentration (PH)7.2/6.9 7.4/6.9 7.7
COD(mg / L) 2.2 4.6 1.2
BOD(mg / L) 2.0 0.8 0.0
SS(mg / L) 2.6 8.8 0.0
38 KOKUYO Group CSR Report 2021
Page 21
Location 312 Kamigano, Aisho-cho, Echi-gun, Shiga
Principal products Notebooks, plain paper copy paper, carbon
duplication books, loose-leaf supplies, etc.
Commencement of
operations
October 1980
Site area 114,294 m²
Inputs 2018 2019 2020
Energy (GJ)
Volume of energy inputs 60,413 57,477 50,171
Fuel 1,258 1,129 1,003
Electricity 59,154 56,348 49,167
Water resources (m³) City/well water 6,869 6,123 4,741
Outputs 2018 2019 2020
Atmospheric
emissions (t)
CO2 2,788 2,196 1,757
SOx - - -
NOx - - -
Waste emissions (t)
Total waste volume 2,549 2,436 2,215
Reuse/heat recovery 2,549 2,436 2,215
Final disposal 0 0 0
Emissions into
bodies of water (m³)
Volume of effluent 6,819 6,076 4,633
Emissions into public
water areas- - -
Emissions into sewage
systems6,819 6,076 4,633
Restricted items
emitted into bodies of
water
Hydrogen ion
concentration (PH)7.0〜8.2 7.1〜9.3 6.6〜9.1
COD(mg / L) 8.2 12.0 5.7
BOD(mg / L) 7.4 6.0 8.6
SS(mg / L) 3.4 5.8 2.9
39 KOKUYO Group CSR Report 2021
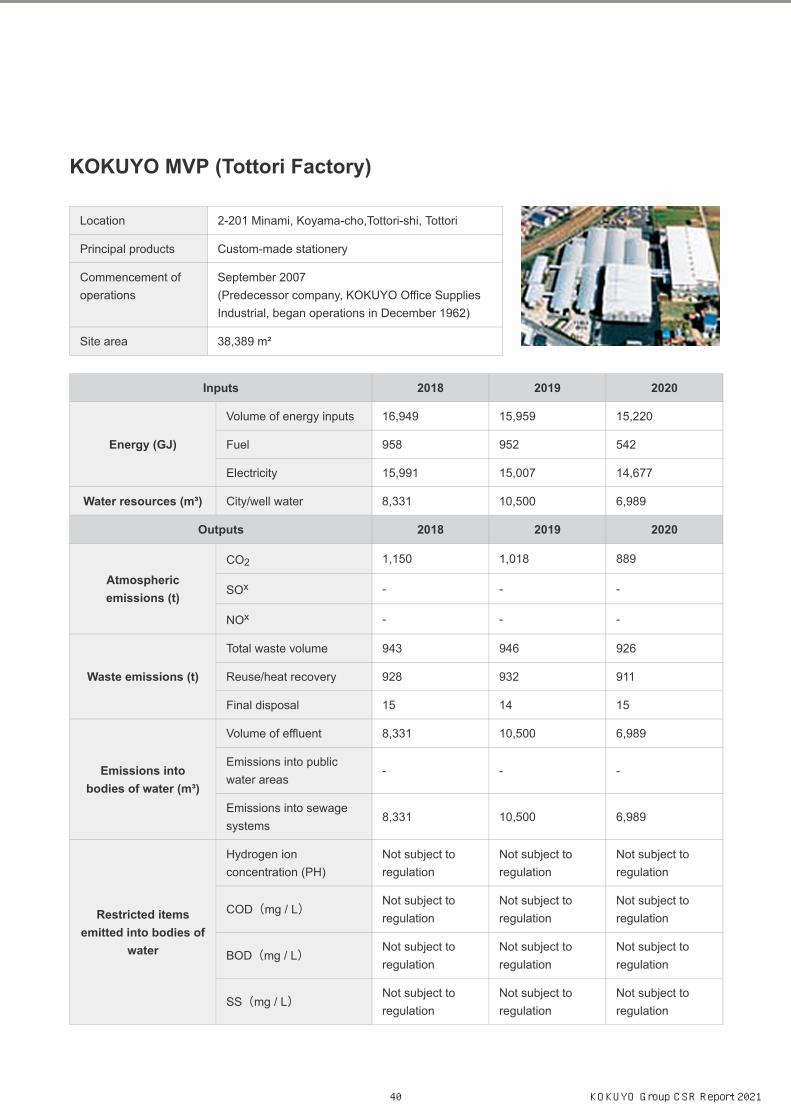
Page 22
Location 2-201 Minami, Koyama-cho,Tottori-shi, Tottori
Principal products Custom-made stationery
Commencement of
operations
September 2007
(Predecessor company, KOKUYO Office Supplies
Industrial, began operations in December 1962)
Site area 38,389 m²
Inputs 2018 2019 2020
Energy (GJ)
Volume of energy inputs 16,949 15,959 15,220
Fuel 958 952 542
Electricity 15,991 15,007 14,677
Water resources (m³) City/well water 8,331 10,500 6,989
Outputs 2018 2019 2020
Atmospheric
emissions (t)
CO2 1,150 1,018 889
SOx - - -
NOx - - -
Waste emissions (t)
Total waste volume 943 946 926
Reuse/heat recovery 928 932 911
Final disposal 15 14 15
Emissions into
bodies of water (m³)
Volume of effluent 8,331 10,500 6,989
Emissions into public
water areas- - -
Emissions into sewage
systems8,331 10,500 6,989
Restricted items
emitted into bodies of
water
Hydrogen ion
concentration (PH)
Not subject to
regulation
Not subject to
regulation
Not subject to
regulation
COD(mg / L) Not subject to
regulation
Not subject to
regulation
Not subject to
regulation
BOD(mg / L) Not subject to
regulation
Not subject to
regulation
Not subject to
regulation
SS(mg / L) Not subject to
regulation
Not subject to
regulation
Not subject to
regulation
40 KOKUYO Group CSR Report 2021
Page 23
Location 1114 Aoya, Aoya-cho, Tottori-shi, Tottori
Principal products Custom made stationery
Commencement of
operations
September 2007
(Predecessor company, KOKUYO Office Supplies
Industrial, Aoya Factory, began operations in April
2000)
Site area 34,607 m²
Inputs 2018 2019 2020
Energy (GJ)
Volume of energy inputs 14,324 12,898 12,395
Fuel 1,694 882 532
Electricity 12,630 12,016 11,863
Water resources (m³) City/well water 4,696 4,755 4,724
Outputs 2018 2019 2020
Atmospheric
emissions (t)
CO2 957 813 719
SOx - - -
NOx - - -
Waste emissions (t)
Total waste volume 428 399 380
Reuse/heat recovery 428 399 379
Final disposal 0 1 1
Emissions into
bodies of water (m³)
Volume of effluent 4,696 4,755 4,724
Emissions into public
water areas4,696 4,755 4,724
Emissions into sewage
systems- - -
Restricted items
emitted into bodies of
water
Hydrogen ion
concentration (PH)
Not subject to
regulation
Not subject to
regulation
Not subject to
regulation
COD(mg / L)Not subject to
regulation
Not subject to
regulation
Not subject to
regulation
BOD(mg / L) Not subject to
regulation
Not subject to
regulation
Not subject to
regulation
SS(mg / L) Not subject to
regulation
Not subject to
regulation
Not subject to
regulation
41 KOKUYO Group CSR Report 2021
Page 24
Location I-378 Ushiroda, Tsuwano-cho, Kanoashi-
gun,Shimane
Principal products Letter paper, receipt, vocabulary notebook, memo
pad, etc.
Commencement of
operations
October 1918
Site area 5,382m2
Inputs 2018 2019 2020
Energy (GJ)
Volume of energy
inputs3,096 3,359 2,733
Fuel 489 482 374
Electricity 2,607 2,877 2,359
Water resources (m³) City/well water 467 524 398
Outputs 2018 2019 2020
Atmospheric emissions (t)
CO2 200 202 159
SOx - - -
NOx - - -
Waste emissions (t)
Total waste volume 58 113 70
Reuse/heat recovery 58 112 70
Final disposal 0 0 0
Emissions into bodies of
water (m³)
Volume of effluent 467 524 398
Emissions into public
water areas- - -
Emissions into sewage
systems467 524 398
Restricted items emitted
into bodies of water
Hydrogen ion
concentration (PH)6.3〜7.5 6.4〜8.0 6.0〜8.4
COD(mg / L)Not subject to
regulation
Not subject to
regulation
Not subject to
regulation
BOD(mg / L) Not subject to
regulation
Not subject to
regulation
Not subject to
regulation
SS(mg / L) Not subject to
regulation
Not subject to
regulation
Not subject to
regulation
42 KOKUYO Group CSR Report 2021
Page 25
Location 586-3 Atotokusa, Yamaguchi-shi, Yamaguchi
Principal products Resume form, manuscript paper, slip pad, report
paper, etc
Commencement of
operations
October 1918
Inputs 2018 2019 2020
Energy (GJ)
Volume of energy
inputs7,580 7,707 7,597
Fuel 486 263 169
Electricity 7,093 7,444 7,428
Water resources (m³) City/well water 845 664 718
Outputs 2018 2019 2020
Atmospheric emissions (t)
CO2 361 158 290
SOx - - -
NOx - - -
Waste emissions (t)
Total waste volume 146 297 311
Reuse/heat recovery 146 297 311
Final disposal 0 0 0
Emissions into bodies of
water (m³)
Volume of effluent 845 664 718
Emissions into public
water areas845 664 718
Emissions into sewage
systems- - -
Restricted items emitted
into bodies of water
Hydrogen ion
concentration (PH)7.2〜7.6 6.9〜7.4 6.8〜7.6
COD(mg / L) Not subject to
regulation
Not subject to
regulation
Not subject to
regulation
BOD(mg / L) Not subject to
regulation
Not subject to
regulation
Not subject to
regulation
SS(mg / L)Not subject to
regulation
Not subject to
regulation
Not subject to
regulation
43 KOKUYO Group CSR Report 2021
Page 26
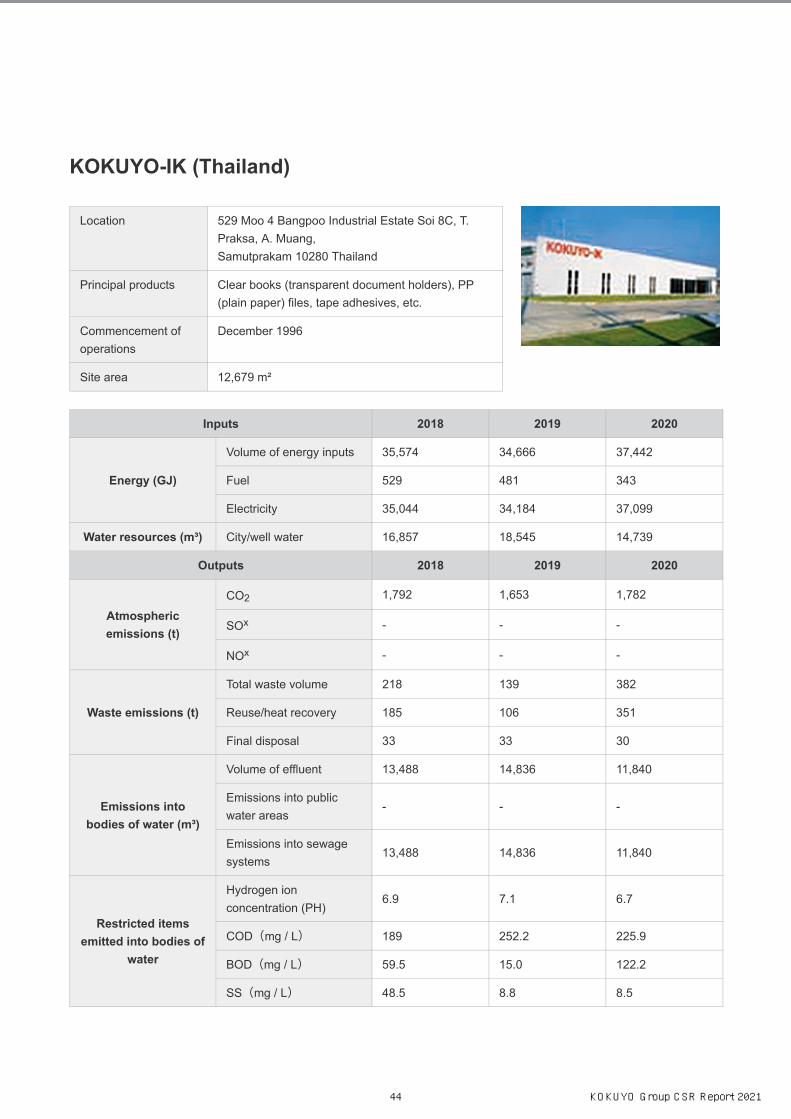
Location 529 Moo 4 Bangpoo Industrial Estate Soi 8C, T.
Praksa, A. Muang,
Samutprakam 10280 Thailand
Principal products Clear books (transparent document holders), PP
(plain paper) files, tape adhesives, etc.
Commencement of
operations
December 1996
Site area 12,679 m²
Inputs 2018 2019 2020
Energy (GJ)
Volume of energy inputs 35,574 34,666 37,442
Fuel 529 481 343
Electricity 35,044 34,184 37,099
Water resources (m³) City/well water 16,857 18,545 14,739
Outputs 2018 2019 2020
Atmospheric
emissions (t)
CO2 1,792 1,653 1,782
SOx - - -
NOx - - -
Waste emissions (t)
Total waste volume 218 139 382
Reuse/heat recovery 185 106 351
Final disposal 33 33 30
Emissions into
bodies of water (m³)
Volume of effluent 13,488 14,836 11,840
Emissions into public
water areas- - -
Emissions into sewage
systems13,488 14,836 11,840
Restricted items
emitted into bodies of
water
Hydrogen ion
concentration (PH)6.9 7.1 6.7
COD(mg / L) 189 252.2 225.9
BOD(mg / L) 59.5 15.0 122.2
SS(mg / L) 48.5 8.8 8.5
44 KOKUYO Group CSR Report 2021
Page 27
Location Lots 79 & 83, Persiaran Bunga Tanjung 1,
Senawang Industrial Park 70400 Seremban,
Negeri Sembilan Darul Khusus, Malaysia
Principal products Steel desks, low partitions, cabinets, etc.
Commencement of
operations
October 1999
Site area 58,000 m²
Inputs 2018 2019 2020
Energy (GJ)
Volume of energy inputs 25,531 24,194 18,671
Fuel 8,186 8,186 6,115
Electricity 17,345 16,008 12,555
Water resources (m³) City/well water 14,067 16,470 10,980
Outputs 2018 2019 2020
Atmospheric
emissions (t)
CO2 1,604 1,479 1,143
SOx - - -
NOx - - -
Waste emissions (t)
Total waste volume 342 288 186
Reuse/heat recovery 244 237 131
Final disposal 97 51 55
Emissions into
bodies of water (m³)
Volume of effluent 2,548 2,562 2,166
Emissions into public
water areas1,061 1,090 996
Emissions into sewage
systems1,487 1,472 1,170
Restricted items
emitted into bodies of
water
Hydrogen ion
concentration (PH)7.7 7.5 7.1
COD(mg / L) 24.3 22.7 27.9
BOD(mg / L) 7.6 7.3 7.9
SS(mg / L) 8.6 12.9 6.4
45 KOKUYO Group CSR Report 2021
Page 28
Location Land Plot B2-B7, Nomura-Haiphong IZ,
An Duong Dist.,Haiphong City,Vietnam
Principal products Notebooks, flat files, files for thick covers, tack
labels, etc.
Commencement of
operations
November 2006
Site area 51,544 m²
Inputs 2018 2019 2020
Energy (GJ)
Volume of energy inputs 31,292 32,320 26,486
Fuel 574 559 421
Electricity 30,718 31,761 26,065
Water resources (m³) City/well water 10,339 11,731 10,740
Outputs 2018 2019 2020
Atmospheric
emissions (t)
CO2 1,116 1,181 967
SOx - - -
NOx - - -
Waste emissions (t)
Total waste volume 1,034 990 761
Reuse/heat recovery 827 616 564
Final disposal 206 374 197
Emissions into
bodies of water (m³)
Volume of effluent 8,271 9,397 8,592
Emissions into public
water areas- - -
Emissions into sewage
systems8,271 9,397 8,592
Restricted items
emitted into bodies of
water
Hydrogen ion
concentration (PH)7.0 7.3 7.3
COD(mg / L) 135.73 131.3 316
BOD(mg / L) 68.2 52.475 157.0
SS(mg / L) 80.13 88.15 150.5
46 KOKUYO Group CSR Report 2021
Page 29
Location No.128 RenJie RD, FengXian District,
Shanghai,P.R,China 201402
Principal products Adhesive-bound notebooks, spiral notebooks, twin-ring notebooks, report pads, etc.
Commencement ofoperations
August 2012
Site area 27,457.7 m²
Inputs 2018 2019 2020
Energy (GJ)
Volume of energyinputs
10,677 11,009 10,925
Fuel 523 669 480
Electricity 10,153 10,340 10,445
Water resources(m³)
City/well water 2,742 1,975 1,455
Output 2018 2019 2020
Atmospheric
emissions (t)
CO2 783 691 685
SOx - - -
NOx - - -
Waste emissions (t)
Total waste volume 564 774 787
Reuse/heat recovery 519 737 760
Final disposal 45 37 28
Emissions into
bodies of water (m³)
Volume of effluent 1,893 1,778 1,313
Emissions into publicwater areas
- - -
Emissions into sewage
systems1,893 1,778 1,313
Restricted itemsemitted into bodies
of water
Hydrogen ionconcentration (PH)
Not subject tomeasurement
Not subject tomeasurement
Not subject tomeasurement
COD(mg / L) Not subject tomeasurement
Not subject tomeasurement
Not subject tomeasurement
BOD(mg / L) Not subject to
measurement
Not subject to
measurement
Not subject to
measurement
SS(mg / L) Not subject tomeasurement
Not subject tomeasurement
Not subject tomeasurement
47 KOKUYO Group CSR Report 2021
Page 30
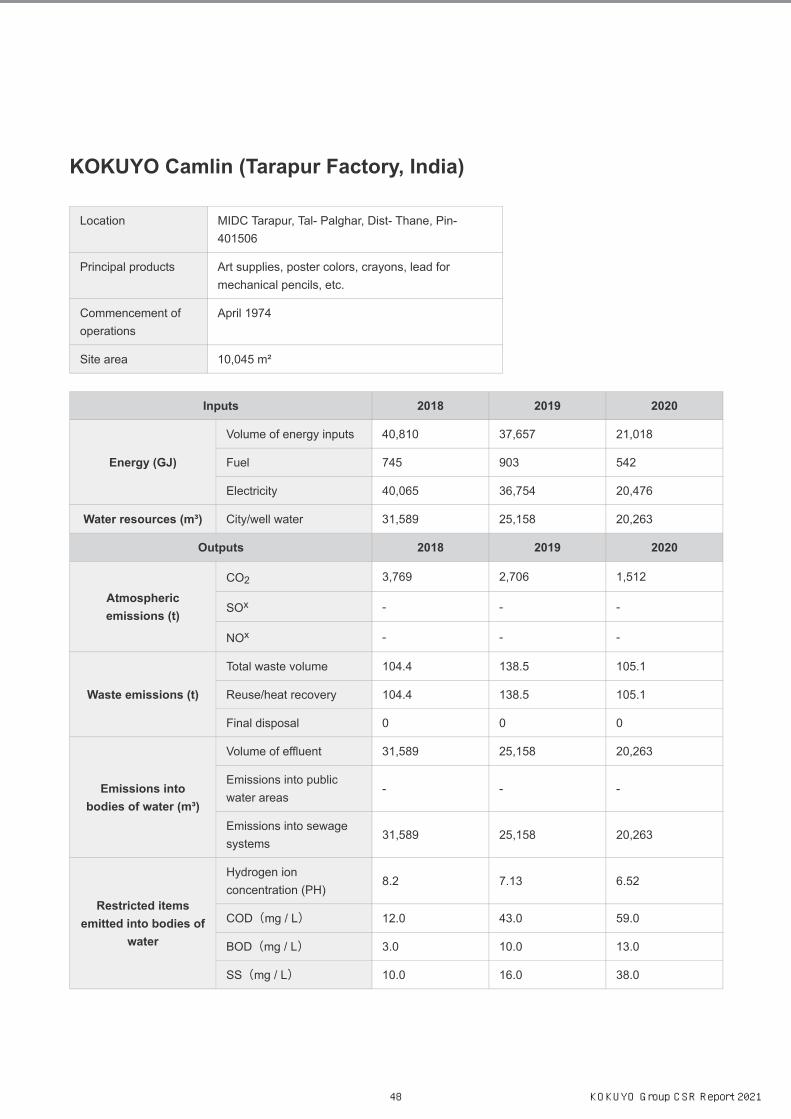
Location MIDC Tarapur, Tal- Palghar, Dist- Thane, Pin-
401506
Principal products Art supplies, poster colors, crayons, lead for
mechanical pencils, etc.
Commencement of
operations
April 1974
Site area 10,045 m²
Inputs 2018 2019 2020
Energy (GJ)
Volume of energy inputs 40,810 37,657 21,018
Fuel 745 903 542
Electricity 40,065 36,754 20,476
Water resources (m³) City/well water 31,589 25,158 20,263
Outputs 2018 2019 2020
Atmospheric
emissions (t)
CO2 3,769 2,706 1,512
SOx - - -
NOx - - -
Waste emissions (t)
Total waste volume 104.4 138.5 105.1
Reuse/heat recovery 104.4 138.5 105.1
Final disposal 0 0 0
Emissions into
bodies of water (m³)
Volume of effluent 31,589 25,158 20,263
Emissions into public
water areas- - -
Emissions into sewage
systems31,589 25,158 20,263
Restricted items
emitted into bodies of
water
Hydrogen ion
concentration (PH)8.2 7.13 6.52
COD(mg / L) 12.0 43.0 59.0
BOD(mg / L) 3.0 10.0 13.0
SS(mg / L) 10.0 16.0 38.0
48 KOKUYO Group CSR Report 2021
Page 31
Location MIDC,Village-Chavane,Taluka-Panvel,Dist-
Raigad-410 220,Maharashtra ,India
Principal products Writing instrument(Marker, pencil pen, correction
pen, Gel pen, sketch pen)Ink, crayon
Commencement of
operations
April 2017
Site area 10,040 m²
Inputs 2018 2019 2020
Energy (GJ)
Volume of energy inputs 26,630 30,787 15,350
Fuel 2,084 2,360 1,324
Electricity 24,546 28,427 14,026
Water resources (m³) City/well water 27,963 29,726 29,688
Outputs 2018 2019 2020
Atmospheric emissions (t)
CO2 2,422 2,209 1,101
SOx - - -
NOx - - -
Waste emissions (t)
Total waste volume 277.7 218.2 169
Reuse/heat recovery 277.7 218.2 169
Final disposal 0 0 0
Emissions into bodies of water (m³)
Volume of effluent 0 0 0
Emissions into public water areas - - -
Emissions into sewage systems - - -
Restricted items emitted into bodies of water
Hydrogen ion concentration (PH) 7.3 7.2 7.3
COD(mg / L) 8.0 81.6 8.0
BOD(mg / L) 3.0 20.0 2.0
SS(mg / L) 22.0 65.0 6.0
49 KOKUYO Group CSR Report 2021
Page 32
Location Lane No. 9, Sidco, Phase - 1 I.G.C., Samba- 184
121
Principal products Art supplies
Commencement of
operations
January 2008
Site area 10,040 m²
Inputs 2018 2019 2020
Energy (GJ)
Volume of energy inputs 10,489 9,512 5,219
Fuel 1,118 1,013 516
Electricity 9,371 8,499 4,703
Water resources (m³) City/well water 3,288 3,870 2,563
Outputs 2018 2019 2020
Atmospheric
emissions (t)
CO2 947 681 374
SOx - - -
NOx - - -
Waste emissions (t)
Total waste volume 111.1 86.9 59.9
Reuse/heat recovery 104.6 86.9 59.9
Final disposal 6.5 0 0
Emissions into
bodies of water (m³)
Volume of effluent 3,288 3,870 2,563
Emissions into public
water areas- - -
Emissions into sewage
systems3,288 3,870 2,563
Restricted items
emitted into bodies of
water
Hydrogen ion
concentration (PH)7.4 7.2 7.4
COD(mg / L) 144.0 69.0 88.0
BOD(mg / L) 18.0 16.0 17.0
SS(mg / L) 84.1 19.0 19.0
50 KOKUYO Group CSR Report 2021