22
ENVIRONMENTAL PRODUCT DECLARATION REINFORCING BAR AND MESH BUILDING POSSIBILITIES

ENVIRONMENTAL PRODUCT DECLARATION
REINFORCING BAR AND MESH
BUILDING POSSIBILITIES

22
GENERAL INFORMATIONAn Environmental Product Declaration, or EPD, is a standardised and verified way of quantifying the environmental impacts of a product based on a consistent set of rules known as a PCR (Product Category Rules).
Declaration owner: OneSteel NSW Pty Ltd (Subject to a Deed of Company Arrangement)Web: www.onesteel.com www.reinforcing.com.au
Email [email protected]
EPD produced by: thinkstep Pty LtdWeb: http://www.thinkstep.comEmail: [email protected]: 25 Jubilee Street, Perth, Western Australia 6151
EPD programme operator: The Australasian EPD® Programme LimitedWeb: http://www.epd-australasia.comEmail: [email protected]: c/o Enviro-Mark Solutions Ltd PO Box 69040, Lincoln 7640, New Zealand
CEN standard EN 15804 served as the core PCR:
PCR: PCR 2012:01 Construction products and Construction services, Version 2.0, 2015-03-03
PCR review was conducted by: The Technical Committee of the International EPD® System
Chair: Massimo Marino. Contact via [email protected]
Independent verification of thedeclaration and data, accordingto ISO 14025:
EPD process certification (Internal)
EPD verification (External)
Third party verifier: Rob Rouwette (start2see Pty Ltd)Email: [email protected]
Accredited or approved by: The Australasian EPD® Programme
Produced under the Australasian EPD Programme in accordance with ISO 14025 and EN 15804
EPD registration number | S-P-00857 Version 1Approval date | 2016-11-08Valid until | 2021-11-08Geographical scope | Australia

33
TABLE OF CONTENTS
General information | 2
Table of contents | 3
Welcome | 4
How to use this EPD | 5
Benefits of using OneSteel products | 7
Reinforcing bar and mesh products | 9
Technical information | 11
Reinforcing bar | 14
Reinforcing mesh | 17
Acronyms | 20
References | 21

44
WELCOMEOneSteel’s flexible, local integrated supply chain, superior product quality and technical expertise positions us as a partner to Australia’s construction industry.
Our core competencies in metallurgy, steel manufacture, supply chain, logistics, expert consultation and information management, support you in building Australia’s future.
OneSteel is dedicated to conducting our business to global environmental, social and commercial standards. Our commitment to the environment includes optimising the eco-efficiency of our products through the product life cycle. This means increasing resource and energy efficiencies in the production and distribution of our products, and during the use of steel products. We are committed to the promotion of the recovery, reuse and recycling of steel and other products.
OneSteel Reinforcing is OneSteel’s reinforcing distribution business.
OneSteel Reinforcing believes there are three things a steel reinforcing customer needs.
First, they need to believe in the technical advice from their supplier. Second, they need to believe in the product quality and specifications. And thirdly, customers need to be able to believe the delivery promises their supplier makes – not empty ones.
OneSteel Reinforcing is best positioned in the Australian market to deliver on all these by drawing on our 80 year history in the Australian construction industry.
Added to that, our products meet all appropriate Australian Standards and have stood the test of time in your homes and pools, through to our highways, bridges and high rise constructions.
We have also developed unique mesh and prefabrication systems that reduce the amount of steel, save time on installation and improve safety. A number of our unique products can also assist in the attainment of Green Star points in the materials category of the latest Green Star Design & As Built rating tool from the Green Building Council of Australia.
OneSteel Reinforcing’s Environmental Product Declaration (EPD) is independently verified and a premier contributor to our holistic commitment to the environmentally sustainable manufacture and application of our products.
Recognising our customers’ need and the increasing demand for standardisation and greater transparency around environmental performance, OneSteel Reinforcing is proud to publish the sustainability credentials of our bar and mesh products.
www.reinforcing.com.au

55
HOW TO USE THIS EPDOneSteel recognises the importance of transparency and the independent verification of our products’ credentials. This Environmental Product Declaration (EPD) covers the environmental impacts of reinforcing bar and mesh.
Reinforcing bar and mesh is manufactured to AS/NZS 4671 Steel reinforcing materials.
Our products manufactured to AS/NZS 4671 are third-party certified by the Australasian Certification Authority for Reinforcing and Structural Steels (ACRS) to independently confirm they consistently meet the requirements of the Standard.
These products are typically used in the construction industry.
GENERAL GUIDANCEEPDs are independently verified documents that include information about the environmental impact of products throughout their life cycle.
EPDs require the completion of Life Cycle Inventory (LCI), a Life Cycle Assessment (LCA) and verification to best practice international and Australian standards.
• Life Cycle Inventory (LCI) is the collection of data on the inputs, processes and outputs within a defined system boundary.
• Life Cycle Assessment (LCA) is the modelling of LCI in accordance with ISO 14040 and ISO 14044 standards.
• Third party verification of the output of the LCA in the format of an EPD.
EPDS ARE NOT ALWAYS COMPARABLE When comparing EPDs it is important to recognise:
• EPDs within the same product category from different programmes may not be comparable
• EPDs of construction products may not be comparable if they do not comply with EN 15804 or if they are produced using different product category rules
• EPDs of construction products from a group of manufacturers may not be comparable to an EPD of a similar construction product that has been generated by a single manufacturer.
Understanding the detail is important in comparisons. Expert analysis is required to ensure data is truly comparable, to avoid unintended distortions.

66
BENEFITS OF USING THIS EPD • Provides an independently verified representation of the environmental impact of OneSteel product going into your project.
• Complies with the requirements of a valid EPD that is recognised in the Green Star Design & As Built V1.1 and Innovation Challenge of Green Star legacy tools by the Green Building Council of Australia (GBCA).
• Complies with the requirements of IS® rating tool by the Infrastructure Sustainability Council of Australia (ISCA).
GREEN STAR® POINTSThis EPD complies with requirements under the Green Building Council of Australia’s rating tool, Green Star – Design & As Built v1.1.
Green Star points for EPDs can be claimed under the Sustainable Products credit when the following criteria are met:
EN 15804 and ISO 14025 compliant
Verified by an independent third party
Cradle-to-gate scope.
This EPD meets these requirements.
IS TOOL® This EPD complies with requirements under the Infrastructure Sustainability Council of Australia’s IS® rating scheme.
Points can be claimed under the IS® rating scheme v1.2 Environmentally labelled products and supply chains credit (Mat-2) when the following criteria are met.
Compliant with ISO 14025
Compliant with EN15804
Verified by a third party.
This EPD meets these requirements.
“Environmental Product Declarations are important as we strive to create sustainable places for people. By providing the market with EPDs, OneSteel is leading the way in the building materials sector and providing great value to sustainability professionals through accurate and reliable data.”
Romilly Madew, Chief Executive Officer, Green Building Council of Australia.
“OneSteel has demonstrated their commitment to a sustainable built environment with the development of EPDs for their construction products. EPD’s are recognised and rewarded in the IS® rating scheme as a means of transparently reporting the environmental impacts of construction materials. ISCA is committed to working with all parts of the supply chain to improve the sustainability outcomes of infrastructure in Australasia. We continue to drive the adoption of integrated outcomes based on social, economic and environmental practices – it’s about more than just carbon emissions.”
Antony Sprigg, CEO Infrastructure Sustainability Council of Australia

77
BENEFITS OF USING ONESTEEL PRODUCTS WHY STEEL?Steel is fundamental to the way we live, work and play.
As one of the most utilised materials in the world, steel supports the buildings we use, strengthens the roads and bridges that connect us and contributes to a more sustainable built environment.
From design and construction, through to use and then at end-of-life of buildings or infrastructure, steel offers construction proponents unique sustainability benefits.
Steel can be readily adapted and reused. It allows asset owners to modify existing structures to cater for future uses and tenants, as well as extending the structure’s lifespan beyond its initial intent.
Steel is a 100% recyclable material, with no loss in material strength or quality.
Modern design techniques and the use of higher strength grades can also reduce the mass of steel used in structures.
To understand the environmental performance of steel, the full life cycle of steel must be taken into consideration. The key steps in the life cycle of steel are shown in Figure 1.
WHY ONESTEEL?At OneSteel, we understand that sustainability is not just about environmental impact.
We strive to improve our social licence to operate across social, economic and environmental arenas while upholding our core values of customer and safety.
For more information refer to www.reinforcing.com.au

Figure 1 Life cycle of OneSteel products
D
REC
YCLI
NG
A1
RA
W MATERIALS
A2 TRANSPORT A3 MANUFACTURIN
G
C3 SCRAP PROCE
SSIN
G
B PRODUCT USE
C4 D
ISPO
SAL
STEELWORKS AT WHYALLAEAF AT LAVERTON & SYDNEY
IRON ORE, COAL, FLUXES AND SCRAP
A4-5 CONSTRUCTION, B1-7 USE, C1-2 DECONSTRUCTION
(OUTSIDE OF SCOPE OF EPD)
SEA, ROAD AND RAIL
88

99
REINFORCING BAR AND MESH PRODUCTS This EPD includes data on two products. These are:
1. Reinforcing bar
2. Reinforcing mesh
Each of the products included in this EPD are available in a wide range of sizes.
Under the UN CPC system of classification OneSteel Reinforcing’s bar and mesh products fall into three categories:
• 41241: Bars and rods, hot-rolled, in irregularly wound coils, of iron and non- alloy steel
• 41242: Other bars and rods of iron or non-alloy steel, not further worked than forged, hot-rolled, hot-drawn or extruded, but including those twisted after rolling
• 41264: Bars and rods, cold-formed or cold-finished, of alloy steel.
OneSteel’s reinforcing rod, bar and wire products are manufactured at its major steelmaking and processing sites in Whyalla in SA, Laverton in VIC and Rooty Hill in NSW. The steel products are specific products from one manufacturer (OneSteel), rather than an industry average.
OneSteel Reinforcing use these products to manufacture a range of reinforcing bar and reinforcing mesh products and distribute these through more than 35 branches around Australia. A detailed description of the products can be found on pages 14 and 17.
This EPD relates to products manufactured by OneSteel and therefore does not included imported products or components. Conceptually the production process is described in Figure 2.
STEELMAKING PROCESSESOneSteel produces steel using two different, but complementary, manufacturing processes. The first process is through an integrated steel mill, which includes key unit processes such as coke manufacture, Blast Furnace (BF) and Basic Oxygen Steelmaking (BOS). This process primarily uses raw materials such as coal and iron ore. The other manufacturing process is the Electric Arc Furnace (EAF) which primarily uses scrap steel and electricity.
These processes are complementary because EAF steelmaking cannot be produced without scrap steel feed that has previously been created through the integrated steel manufacturing process.
Due to this dependency, and because the Australian steel industry already recycles 89% (Hyder Consulting 2012) of available construction, demolition and industrial scrap steel, it is incorrect to consider that recycled content in steel indicates lesser environmental impact or that either of the two steelmaking process (BF/BOS or EAF) is superior to the other.
This interdependency is recognised by rating tools including Green Star® and IS®, in that steel from both processes can contribute equally to obtaining credits under schemes.
Manufacturers and designers alike play a key role in improving the sustainability credentials of steel and steel structures. Designers are encouraged to select the most suitable steel for an application to maximise the efficiency of the design and thus reduce the quantities consumed. As a manufacturer, OneSteel is continually working to provide products and services that are increasingly sustainable, including our higher strength steel solutions that have the capacity to reduce the amount of steel consumed on a project or our innovative steelmaking solutions such as Polymer Injection Technology.

1010
Iron ore from local mines (Arrium mining) Recycled Steel
BF/BOSSteel Production
at Whyalla integrated steelworks
Products: Reinforcing rod,
bar and wire direct from mill
EAF Steel Production
at Laverton & Rooty Hill
Other key inputs: electricity, gas,
polymer (waste tyres)
Products: Reinforcing bar and mesh processed and distributed by OSR
Product rolling and manufacture
at various mill sites
Other key inputs:coal, gas, water...
Figure 2 Reinforcing bar and mesh products manufactured by OneSteel Reinforcing.
The typical composition of OneSteel’s hot rolled sections are;
Iron >98%
Manganese <1.6%
Carbon <0.5%
Other <0.5%
A range of alloys are used to manufacture the products and grades represented in this EPD. The use of alloys has been aggregated and averaged in this EPD. The impact of utilising alloys to produce different grades or products has no material impact on the outcome of this EPD.
Products have been grouped such that the variations between the EPD outcomes for individual sections within the same product grouping are deemed as not significant to the EPD result. The upstream manufacturing processes are common across the various products represented within a product group.
The products included in this EPD do not contain any substances of high concern as defined by European REACH regulation.
1111
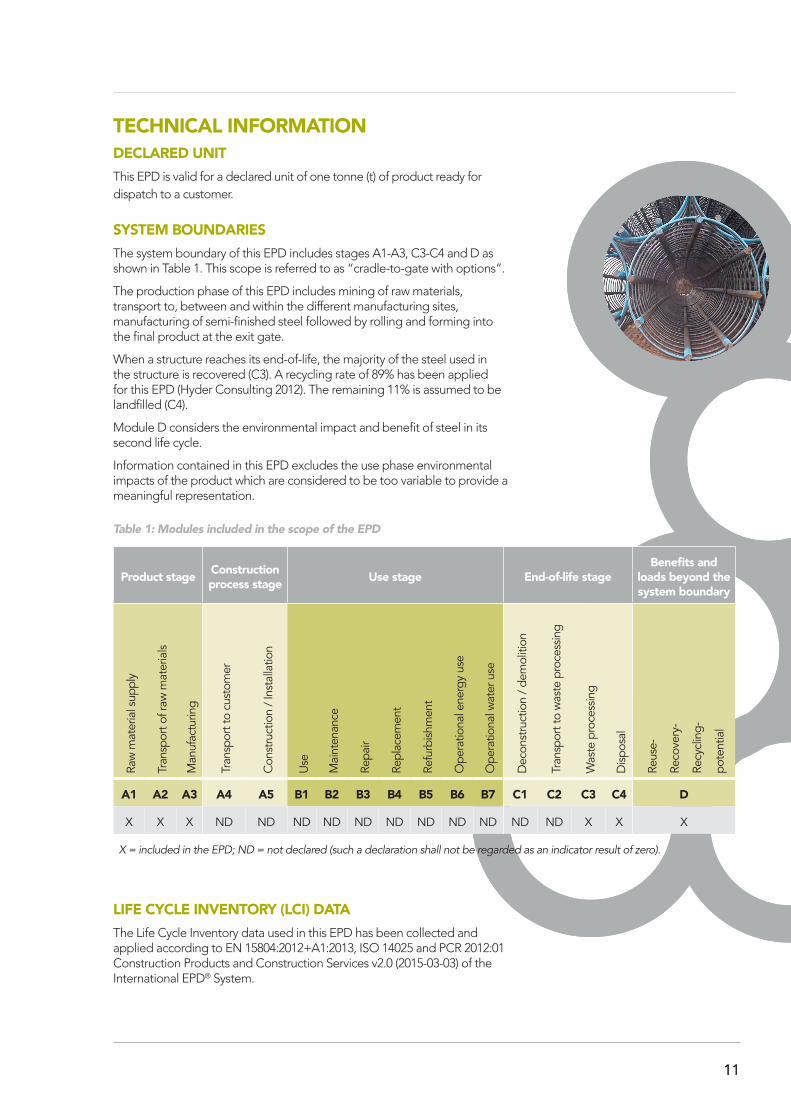
TECHNICAL INFORMATION DECLARED UNITThis EPD is valid for a declared unit of one tonne (t) of product ready for dispatch to a customer.
SYSTEM BOUNDARIESThe system boundary of this EPD includes stages A1-A3, C3-C4 and D as shown in Table 1. This scope is referred to as “cradle-to-gate with options”.
The production phase of this EPD includes mining of raw materials, transport to, between and within the different manufacturing sites, manufacturing of semi-finished steel followed by rolling and forming into the final product at the exit gate.
When a structure reaches its end-of-life, the majority of the steel used in the structure is recovered (C3). A recycling rate of 89% has been applied for this EPD (Hyder Consulting 2012). The remaining 11% is assumed to be landfilled (C4).
Module D considers the environmental impact and benefit of steel in its second life cycle.
Information contained in this EPD excludes the use phase environmental impacts of the product which are considered to be too variable to provide a meaningful representation.
Table 1: Modules included in the scope of the EPD
Product stage Construction process stage Use stage End-of-life stage
Benefits and loads beyond the system boundary
Raw
mat
eria
l sup
ply
Tran
spor
t of r
aw m
ater
ials
Man
ufac
turin
g
Tran
spor
t to
cust
omer
Con
stru
ctio
n / I
nsta
llatio
n
Use
Mai
nten
ance
Repa
ir
Repl
acem
ent
Refu
rbish
men
t
Ope
ratio
nal e
nerg
y us
e
Ope
ratio
nal w
ater
use
Dec
onst
ruct
ion
/ dem
oliti
on
Tran
spor
t to
was
te p
roce
ssin
g
Was
te p
roce
ssin
g
Disp
osal
Reus
e-
Reco
very
-
Recy
clin
g-
pote
ntia
l
A1 A2 A3 A4 A5 B1 B2 B3 B4 B5 B6 B7 C1 C2 C3 C4 D
X X X ND ND ND ND ND ND ND ND ND ND ND X X X
X = included in the EPD; ND = not declared (such a declaration shall not be regarded as an indicator result of zero).
LIFE CYCLE INVENTORY (LCI) DATAThe Life Cycle Inventory data used in this EPD has been collected and applied according to EN 15804:2012+A1:2013, ISO 14025 and PCR 2012:01 Construction Products and Construction Services v2.0 (2015-03-03) of the International EPD® System.

1212
KEY ASSUMPTIONS
DATA FOR CORE PROCESSES:Primary (specific) data were collected for all inputs and outputs from OneSteel sites in the production stage (A1-A3). Direct emissions measured based on the Australian National Pollutant Inventory (NPI) scheme were provided by OneSteel for all steel manufacturing sites. Specific information on waste water composition and discharges were provided by OneSteel for processes likely to contaminate the water and therefore require treatment. All data are based on an annual average for the time period July 2013 to June 2014.
DATA FOR UPSTREAM AND DOWNSTREAM PROCESSES:Secondary (generic) data were used for all raw materials, energy and transport processes, as allowed under the PCR (IEPDS 2015). All data are from the GaBi Life Cycle Inventory Database 2016 and are typically representative of the years 2012 to 2015, depending on the dataset (thinkstep 2016). Australian data were used where possible. Where regional data were unavailable, average data or data from other regions were used.
DATA FOR CREDIT AND BURDEN:Steel is an internationally traded product, therefore global average data provided by worldsteel has been used to calculate the credit or burden for the net recycling of scrap in Module D. This might differ slightly from OneSteel’s specific values for some impact categories.
ELECTRICITY MIXES:Electricity consumption was modelled using state specific grid mixes. The composition of the individual grid mixes was obtained from AusLCI and the background data for the electricity sources (such as coal, wind power, etc.) are based on background data from the GaBi Life Cycle Inventory Database 2016 (thinkstep 2016).
RECYCLING:When a structure reaches its end-of-life, the majority of the steel used in the structure is recovered. The recycling rate was based on two reports on the waste industry prepared for the Australian Government, which indicate an average recycling rate of 89% for metals in Australia. [Hyder Consulting, 2012].
ALLOCATION:Where required, co-product allocation using the most relevant physical quantity (mass, volume or energy) was applied for core processes. Where differences in the price of the co-products was large (>25% according to EN 15804, section 6.4.3.2), economic allocation was applied using annual average prices for the time period July 2013 to June 2014. Allocation rules for secondary data (upstream/downstream processes) are documented on the GaBi website (thinkstep 2016). Recycling allocation follows the polluter pays principle in line with EN 15804 and the PCR.
CUT OFF CRITERIA: Environmental impacts relating to personnel, infrastructure, and production equipment not directly consumed in the process are excluded from the system boundary as per the PCR (IEPDS 2015). The only inputs knowingly excluded from the inventory are packaging materials for minor inputs such as alloys, greases, etc., which are used in very small quantities.

1313
ENVIRONMENTAL IMPACT INDICATORS
EN 15804 and PCR 2012:01 v2.0 require the environmental indicators below, calculated based on CML characterisation factors (as updated in 2012).
Impact category Unit Description
Global warming (climate change) potential
kg CO2 equivalent Potential of greenhouse gases – such as carbon dioxide – to increase absorption of heat reaching Earth’s atmosphere, intensifying the natural greenhouse effect.
Stratospheric ozone depletion potential
kg CFC 11 equivalent
Potential of emissions that contribute to the reduction of the stratospheric ozone layer.
Acidification potential of land and water
kg SO2 equivalent Potential of emissions to cause acidifying effects in the environment, typically due to acid rain. Potential downstream effects include fish mortality, forest decline and the deterioration of building materials.
Eutrophication potential
kg PO43- equivalent Potential of emissions –such as nitrogen and phosphorus – to increase
nutrient levels in both aquatic and terrestrial ecosystems, which can cause undesirable shifts in species composition and elevated biomass production (e.g. algal blooms).
Photochemical ozone creation potential
kg C2H4 equivalent Potential of emissions to contribute to air pollution (ground-level smog - mainly ozone), which can be harmful to human and ecosystem health and can also damage crops.
Depletion of abiotic resources (elements)
kg Sb equivalent Decrease of the availability of non-renewable material resources.
Depletion of abiotic resources (fossil)
MJ net calorific value
Decrease of the availability of non-renewable fossil fuel resources.
The following impact categories have been added to comply with the “Additional Life Cycle Impact Reporting” requirement listed in the “Green Star - Design and As Built” (2014) rating tool from the Green Building Council of Australia.
Impact category Unit Description Methodology
Human toxicity CTUh Toxic effects of chemical emissions on human health.
USEtox (Rosenbaum et al. (2008))
Eco toxicity CTUe Toxic effects of chemical emissions on eco-systems.
USEtox (Rosenbaum et al. (2008))
Land transformation m2 land transformed Land transformed due to agriculture and mining.
Frischknecht & Jungbluth, 2007
Resource depletion - water
m3 H2O equivalent Consumption of fresh water related to local and global water scarcity.
Water Stress Indicator (Ridoutt & Pfister (2012))
Ionising radiation kg U-235 equivalent to air
Radioactive substances released to the environment that can be damaging to human health and ecosystems.
Human health impacts (Frischknecht et al. (2000))
Particulate matter kg PM2.5 equivalent Contribution to air pollution which can have respiratory effects.
Riskpoll (Rabi and Spadaro (2004))
1414
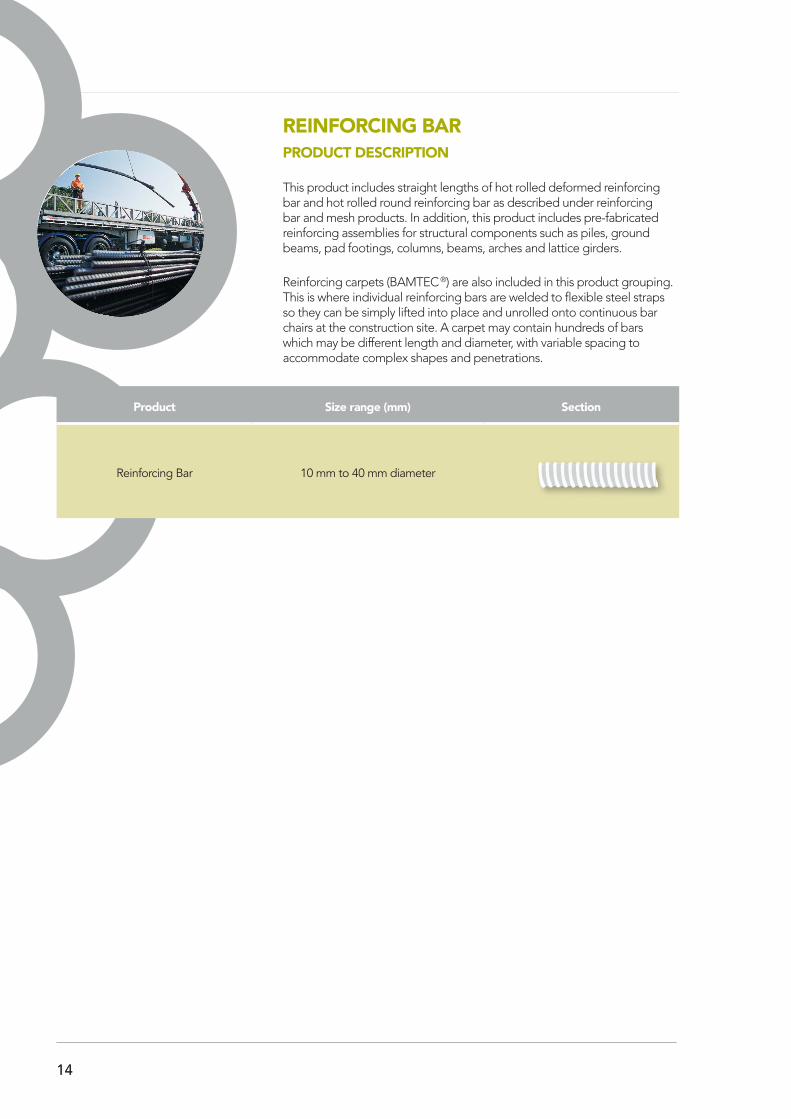
REINFORCING BARPRODUCT DESCRIPTION
This product includes straight lengths of hot rolled deformed reinforcing bar and hot rolled round reinforcing bar as described under reinforcing bar and mesh products. In addition, this product includes pre-fabricated reinforcing assemblies for structural components such as piles, ground beams, pad footings, columns, beams, arches and lattice girders.
Reinforcing carpets (BAMTEC ®) are also included in this product grouping. This is where individual reinforcing bars are welded to flexible steel straps so they can be simply lifted into place and unrolled onto continuous bar chairs at the construction site. A carpet may contain hundreds of bars which may be different length and diameter, with variable spacing to accommodate complex shapes and penetrations.
Product Size range (mm) Section
Reinforcing Bar 10 mm to 40 mm diameter

1515
RESULTS OF ASSESSMENT Environmental impact indicatorsThe following indicators describe potential environmental impacts for each product per declared unit.
Table 2: Potential environmental impacts, 1 tonne of reinforcing bar
Indicator Production A1 – A3
Waste processing C3
Disposal C4
Recycling potential D
GWP [kg CO2-eq.] 1.8E+03 2.5E+00 5.4E+00 -1.5E+01
ODP [kg CFC11-eq.] 7.5E-09 2.5E-11 2.0E-10 4.6E-07
AP [kg SO2-eq.] 6.3E+00 1.7E-02 1.5E-02 -3.5E-02
EP [kg PO43--eq.] 6.5E-01 4.0E-03 1.9E-03 -9.6E-04
POCP [kg C2H4-eq.] 8.4E-01 2.4E-03 1.7E-03 -7.7E-03
ADPE [kg Sb-eq.] 3.9E-04 4.3E-06 1.0E-06 -5.1E-06
ADPF [MJ] 2.2E+04 4.6E+01 7.7E+01 -1.5E+02
The results from the impact assessment are only relative statements which give no information about the endpoint of the impact categories, exceeding of threshold values, safety margins or risk.
RESOURCE INDICATORS
The following indicators describe the use of renewable and non-renewable material resources, renewable and non-renewable primary energy and water.
Table 3: Resource use, 1 tonne of reinforcing bar
Indicator Production A1 – A3
Waste processing C3
Disposal C4
Recycling potential D
PERE [MJ] 1.1E+03 3.5E+00 5.4E+00 7.9E+00
PERM [MJ] 0.0E+00 0.0E+00 0.0E+00 INA
PERT [MJ] 1.1E+03 3.5E+00 5.4E+00 7.9E+00
PENRE [MJ] 2.2E+04 4.7E+01 8.0E+01 -1.4E+02
PENRM [MJ] 0.0E+00 0.0E+00 0.0E+00 INA
PENRT [MJ] 2.2E+04 4.7E+01 8.0E+01 -1.4E+02
SM [kg] 9.8E+02 0.0E+00 0.0E+00 INA
RSF [MJ] 0.0E+00 0.0E+00 0.0E+00 INA
NRSF [MJ] 6.8E+01 0.0E+00 1.2E-01 INA
FWT [m3] 7.8E+00 1.3E-02 5.7E-04 4.6E-03

1616
WASTES AND OTHER OUTPUTSTable 4: Waste categories, 1 tonne of reinforcing bar
Indicator Production A1 – A3
Waste processing C3
Disposal C4
Recycling potential D
HWD [kg] 3.4E-04 3.3E-06 5.6E-07 1.5E-04
NHWD [kg] 4.2E+02 2.2E-02 1.1E+02 3.4E-05
RWD [kg] 4.5E-02 4.6E-04 1.2E-03 4.9E-03
CRU [kg] 0.0E+00 0.0E+00 0.0E+00 INA
MFR [kg] 1.0E+01 8.9E+02 0.0E+00 INA
MER [kg] 3.2E-01 0.0E+00 0.0E+00 INA
EEE [MJ] 0.0E+00 0.0E+00 0.0E+00 INA
EET [MJ] 0.0E+00 0.0E+00 0.0E+00 INA
GREEN STARTable 5: Additional impact categories, 1 tonne of reinforcing bar
Indicator Production A1 – A3
Waste processing C3
Disposal C4
Recycling potential D
HTPC [CTUh] 1.9E-06 1.5E-09 1.6E-08 2.5E-10
HTPNC [CTUh] 4.8E-04 3.1E-07 1.6E-06 5.9E-07
LT [m2] 1.3E+01 2.7E-01 1.7E-01 -4.1E-02
WSF [m3 H2O-eq.] 5.2E+00 8.8E-03 3.8E-04 3.0E-03
IR [kg U235-eq.] 1.5E+01 4.4E-02 1.6E-01 9.3E-02
PM [kg PM2.5-eq.] 1.4E+00 2.4E-03 1.7E-02 -1.5E-03

1717
REINFORCING MESH
PRODUCT DESCRIPTION Reinforcing mesh is produced in sheets by welding ribbed steel wires at right angles, creating gaps that are either square or rectangular. Meshes vary through both the diameter of the wire used and the spacing between longitudinal and cross wires. The size of mesh sheets can also be customised for particular applications (e.g. trenches) or to facilitate transport.
Product Size (mm) Section
Reinforcing Mesh SL53 to SL81, RL718 to RL1218

1818
RESULTS OF ASSESSMENT Environmental impact indicatorsThe following indicators describe potential environmental impacts for each product per declared unit.
Table 6: Potential environmental impacts, 1 tonne of reinforcing mesh
Indicator Production A1 – A3
Waste processing C3
Disposal C4
Recycling potential D
GWP [kg CO2-eq.] 2.6E+03 2.5E+00 5.4E+00 -6.0E+02
ODP [kg CFC11-eq.] 1.2E-08 2.5E-11 2.0E-10 1.9E-05
AP [kg SO2-eq.] 7.5E+00 1.7E-02 1.5E-02 -1.4E+00
EP [kg PO43--eq.] 8.7E-01 4.0E-03 1.9E-03 -4.0E-02
POCP [kg C2H4-eq.] 1.5E+00 2.4E-03 1.7E-03 -3.2E-01
ADPE [kg Sb-eq.] 9.0E-03 4.3E-06 1.0E-06 -2.1E-04
ADPF [MJ] 2.9E+04 4.6E+01 7.7E+01 -6.3E+03
The results from the impact assessment are only relative statements which give no information about the endpoint of the impact categories, exceeding of threshold values, safety margins or risk.
RESOURCE INDICATORSThe following indicators describe the use of renewable and non-renewable material resources, renewable and non-renewable primary energy and water.
Table 7: Resource use, 1 tonne of reinforcing mesh
Indicator Production A1 – A3
Waste processing C3
Disposal C4
Recycling potential D
PERE [MJ] 1.5E+03 3.5E+00 5.4E+00 3.3E+02
PERM [MJ] 0.0E+00 0.0E+00 0.0E+00 INA
PERT [MJ] 1.5E+03 3.5E+00 5.4E+00 3.3E+02
PENRE [MJ] 3.0E+04 4.7E+01 8.0E+01 -5.6E+03
PENRM [MJ] 0.0E+00 0.0E+00 0.0E+00 INA
PENRT [MJ] 3.0E+04 4.7E+01 8.0E+01 -5.6E+03
SM [kg] 5.8E+02 0.0E+00 0.0E+00 INA
RSF [MJ] 0.0E+00 0.0E+00 0.0E+00 INA
NRSF [MJ] 3.7E+01 0.0E+00 1.2E-01 INA
FW [m3] 1.1E+01 1.3E-02 5.7E-04 1.9E-01

1919
WASTES AND OTHER OUTPUTSTable 8: Waste categories, 1 tonne of reinforcing mesh
Indicator Production A1 – A3
Waste processing C3
Disposal C4
Recycling potential D
HWD [kg] 3.5E-04 3.3E-06 5.6E-07 6.1E-03
NHWD [kg] 5.5E+02 2.2E-02 1.1E+02 1.4E-03
RWD [kg] 5.6E-02 4.6E-04 1.2E-03 2.0E-01
CRU [kg] 0.0E+00 0.0E+00 0.0E+00 INA
MFR [kg] 7.2E+00 8.9E+02 0.0E+00 INA
MER [kg] 5.0E-01 0.0E+00 0.0E+00 INA
EEE [MJ] 0.0E+00 0.0E+00 0.0E+00 INA
EET [MJ] 0.0E+00 0.0E+00 0.0E+00 INA
GREEN STARTable 9: Additional impact categories, 1 tonne of reinforcing mesh
Indicator Production A1 – A3
Waste processing C3
Disposal C4
Recycling potential D
HTPC [CTUh] 2.3E-06 1.5E-09 1.6E-08 1.0E-08
HTPNC [CTUh] 2.7E-04 3.1E-07 1.6E-06 2.4E-05
LT [m2] 1.5E+01 2.7E-01 1.7E-01 -1.7E+00
WSF [m3 H2O-eq.] 7.0E+00 8.8E-03 3.8E-04 1.3E-01
IR [kg U235-eq.] 1.3E+01 4.4E-02 1.6E-01 3.8E+00
PM [kg PM2.5-eq.] 2.2E+00 2.4E-03 1.7E-02 -6.1E-02

20
ACRONYMSADPE Abiotic Depletion Potential For Non-Fossil ResourcesADPF Abiotic Depletion Potential For Fossil ResourcesAP Acidification PotentialAusLCI Australian Life Cycle Inventory DatabaseBF Blast FurnaceBOS Basic Oxygen SteelmakingCML Centre Of Environmental Science At LeidenCRU Components For Reuse EAF Electric Arc FurnaceEEE Exported Electrical Energy EET Exported Thermal Energy EP Eutrophication PotentialEPD Environmental Product DeclarationFW Net Use Of Fresh Water Gabi Ganzheitliche Bilanzierung (German For Holistic Balancing)GWP Global Warming PotentialHTPC Human Toxicity Potential, Cancer EffectsHTPNC Human Toxicity Potential, Non-Cancer Effects HWD Hazardous Waste Disposed INA Indicator Not Assessed. A result marked with ‘INA’ indicates this is unable to be assessed using the worldsteel data set for scrapIR Ionising Radiation ISO International Organization For Standardization LCA Life Cycle AssessmentLCI Life Cycle InventoryLT Land Transformation MER Materials For Energy Recovery MFR Materials For Recycling NHWD Non-Hazardous Waste Disposed NPI National Pollutant InventoryNRSF Use Of Non-Renewable Secondary Fuels ODP Ozone Depletion PotentialOSR OneSteel ReinforcingPERE Use Of Renewable Primary Energy Excluding Renewable Primary Energy Resources Used As Raw MaterialsPERM Use Of Renewable Primary Energy Resources Used As Raw Materials PENRE Use Of Non-Renewable Primary Energy Excluding Non-Renewable Primary Energy Resources Used As Raw Materials PENRM Use Of Non-Renewable Primary Energy Resources Used As Raw Materials PENRT Total Use Of Non-Renewable Primary Energy Resources PERT Total Use Of Renewable Primary Energy Resources PM Particulate Matter POCP Photochemical Ozone Creation PotentialRSF Use Of Renewable Secondary Fuels RWD Radioactive Waste Disposed SM Use Of Secondary Material UN CPC United Nations Central Product ClassificationWSF Water Scarcity Footprint

2121
REFERENCES• Standards Australia (2001). AS/NZS 4671, Steel reinforcing materials. SAI Global.
• AEPDP. (2015). General Programme Instructions of the Australasian EPD® Programme, Version 1.0, 2015-02-20. Retrieved from http://www.epd-australasia.com/sites/default/files/ documents/Australasian_GPI_1.0.pdf.
• ALCAS. (2012). Australian National Life Cycle Inventory Database (AusLCI) - Electricity mixes at generation - Datasets List, Australia: Australian Life Cycle Assessment Society. Retrieved from http://auslci.com.au/index.php/Datasets/Electricity
• CEN. (2012). BS EN 15804:2012+A1:2013; Sustainability of construction works - Environmental product declarations - Core rules for the product category of construction products. Brussels: European Committee for Standardization.
• Frischknecht, R., & Jungbluth, N. (2007). Ecoinvent: overview and methodology. Dübendorf: Swiss Centre for Life Cycle Inventories.
• Frischknecht, R., Braunschweig, A., Hofstetter, P., & Suter, P. (2000). Human health damages due to ionising radiation in life cycle impact assessment. Environmental Impact Assessment Review (20), 159-189.
• Greco, S.L., Wilson, A.M., Spengler J.D., and Levy J.I. (2007). Spatial patterns of mobile source particulate matter emissions-to-exposure relationships across the United States. Atmospheric Environment (41), page 1011-1025.
• Hyder Consulting. (2012). Waste and recycling in Australia 2011. Report prepared for the Department of Sustainability, Environment, Water, Population and Communities. Retrieved from http://www.environment.gov.au/system/files/resources/b4841c02-229b- 4ff4-8b3b-ef9dd7601d34/files/waste-recycling2011.pdf.
• IEPDS. (2015-03-03). PCR 2012:01, Construction products and Construction services, Version 2.0. The Internatinal EPD® System. Retrieved from http://www.environdec.com/en/PCR/Detail/?Pcr=8098.
• ISO 14025:2006; Environmental labels and declarations — Type III environmental declarations — Principles and procedures. Geneva: International Organization for Standardization.
• Rabl, A. and Spadaro, J.V. (2004). The RiskPoll software, version is 1.051 (dated August 2004). www.arirabl.com.
• Ridoutt, B. G., & Pfister, S. (2012). A new water footprint calculation method integrating consumptive and degradative water use into a single stand-alone weighted indicator; in Int J Life Cycle Assess (Received: 29 February 2012; Accepted: 8 June 2012 ed.). Springer-Verlag.
• Rosenbaum, R. K., Bachmann, T. M., Swirsky Gold, L., Huijbregts, M., Jolliet, O., Juraske, R., . . . Hauschild, M. Z. (2008). USEtox—the UNEP-SETAC toxicity model: recommended characterisation factors for human toxicity and freshwater ecotoxicity in life cycle impact assessment. Int J Life Cycle Assess, 13(7), 532–546.
• thinkstep (2016); GaBi Life Cycle Inventory Database 2016. Leinfelden-Echterdingen, Germany: thinkstep AG. Available: http://www.gabi-software.com/support/gabi/gabi-data base-2016-lci-documentation/.

This publication has been prepared by OneSteel NSW Pty Limited ABN 59 003 312 892 (Subject to a Deed of Company Arrangement). © Copyright 2003-2016 OneSteel NSW Pty Limited. BAMTEC® is a registered trademark of OneSteel Reinforcing Pty Limited.
For further information contact OneSteel Reinforcing www.reinforcing.com.au


