i Environmental Research in Macquarie Harbour FRDC 2016/067: Understanding oxygen dynamics and the importance for benthic recovery in Macquarie Harbour PROGRESS REPORT Approved by the Project Steering Committee and FRDC on 8/02/2018 Jeff Ross and Catriona Macleod February 2018
Transcript
i
Environmental Research in Macquarie Harbour
FRDC 2016/067: Understanding oxygen dynamics and the importance for benthic recovery in Macquarie Harbour
PROGRESS REPORT
Approved by the Project Steering Committee and FRDC on 8/02/2018
Jeff Ross and Catriona Macleod
February 2018
2
Institute for Marine and Antarctic Studies, University of Tasmania, Private Bag 49, Hobart TAS 7001
The authors do not warrant that the information in this document is free from errors or omissions. The authors do
not accept any form of liability, be it contractual, tortious, or otherwise, for the contents of this document or for
any consequences arising from its use or any reliance placed upon it. The information, opinions and advice
contained in this document may not relate, or be relevant, to a reader’s particular circumstance. Opinions
expressed by the authors are the individual opinions expressed by those persons and are not necessarily those of
the Institute for Marine and Antarctic Studies (IMAS) or the University of Tasmania (UTas).
The Institute for Marine and Antarctic Studies, University of Tasmania 2018.
Copyright protects this publication. Except for purposes permitted by the Copyright Act, reproduction by whatever means is prohibited without the prior written permission of the Institute for Marine and Antarctic Studies.
3
EXECUTIVE SUMMARY
This report provides an update on the status of dissolved oxygen (DO) and benthic conditions in Macquarie Harbour. It follows on from the results reported in the IMAS reports released in January, May and September 2017 which described a deterioration of benthic and water column conditions in Macquarie Harbour in spring 2016 and some early signs of faunal recovery observed in May 2017. This report presents the results and preliminary interpretation of DO monitoring data up until the beginning of January 2018 and a repeat survey of benthic communities in October 2017. This work is part of the research project (FRDC Project 2016-067: Understanding oxygen dynamics and the importance for benthic recovery in Macquarie Harbour to address these needs) funded by the Fisheries Research Development Corporation with the support of both industry and government (EPA and DPIPWE).
Oxygen recharge events from late 2016 through autumn and winter 2017 led to improved DO levels in bottom waters. However, from the beginning of spring 2o17 DO levels began declining, and by mid-October had returned to the very low levels experienced in spring 2016. DO levels were typically <10% saturation at depths below 20m at the Table Head Central, Strahan, Franklin and World Heritage Area monitoring strings; DO at the King River Basin string closest to the ocean entrance were also reaching levels <20% and often <10% saturation. From early November there was significant oceanic recharge of bottom waters, initially evident in waters >30m depth at the King River Basin and Strahan strings but by the end of November the influence of recharge was evident further south (Franklin) as it reached depths of 25m.
The bottom water recharge that commenced in early November again appeared strongly tied to salinity at the surface, and hence river flow. Through winter and into early spring river flow was high and surface salinities low and this coincided with the decline in DO levels at depth. From October river flow decreased, surface salinity increased and in early November DO levels at depth increased markedly. These are the same combination of conditions that have coincided with previous oxygen recharge events. An important feature from a farming and management perspective are the concomitant changes observed in DO levels towards the surface. In the weeks prior to the onset of the oxygen recharge (from late October through November), DO levels at shallower depths (5-15m) declined significantly, most notably at the 5 and 7.5m sensor depths, before increasing again in early December. This would appear to be strongly related to the reduction in river flow, as evidenced by increased surface salinities, and likely reflects the lower DO, more saline water that had previously been pushed deeper in the system now moving closer to the surface. During a recharge event this situation may be further exacerbated, as the denser more saline oceanic water entering the bottom waters will effectively enhance the displacement of this water upwards from below.
In the May 2017 survey we reported the early signs of recovery in benthic fauna across both lease and external sites, but cautioned that the spring survey would be critical in determining the significance of this apparent recovery, given that this is when DO concentrations have previously reached their lowest levels. Unfortunately, as suspected, when DO levels again returned to the very low levels seen in spring 2016 (albeit for a shorter period) both faunal abundance and the number of species decreased across the lease sites. The decline has seen abundances return to levels similar to those observed in the October 2016 and January 2017 surveys. However, although there was also a decline in the number of species this was not to as low a level as observed in the October 2016 and January 2017 surveys. In the May 2017 survey we also reported that faunal abundances and species numbers at the majority of the external sites (>1km from the leases) were within a range similar to that which had been recorded historically; this remained the case in the October 2017 survey. However, at the deeper sites to the south, in the WHA, faunal abundances were still found to be low relative to observations prior to the noted decline in spring 2016 – early 2017.
The May 2017 video surveys indicated a clear reduction in the presence of Beggiatoa at both lease and external sites compared to the October 2016 and January 2017 surveys. In the September 2017 video survey there was little change from that seen in May. This may appear surprising given the decline observed in the benthic fauna over the same period, but may actually reflect the fact that the
4
video surveys were conducted approximately a month prior (i.e. mid-September) to the benthic grab surveys (mid-October). Bottom water DO levels were considerably higher in mid –September than in mid-October, and as such it is not surprising that the presence and extent of Beggiatoa was reduced.
With DO levels returning to similarly low levels to that observed in spring 2017 it is not surprising that we have again seen a decline in benthic fauna over this time period. However, it is important to note that there wasn’t a concomitant decline in the faunal abundance and number of species at the majority of external sites. This last point, together with the fact that we observed an increase in fauna at all of the lease sites in May last year is somewhat encouraging as it suggests there is still clearly potential for recovery in the system. Whilst the latest survey indicates that the rate of recovery observed in the last survey has not been sustained, it does still suggest that there is capacity for recovery and highlights the importance of faunal recruitment from the more abundant and species rich faunal assemblages in the shallower regions of the harbour which remain relatively unaffected. Ultimately though, sustained faunal recovery in the deeper central region will likely depend on the return of more stable and higher DO levels in the mid-bottom waters of the harbour.
In light of deteriorating benthic conditions in Macquarie Harbour, and in particular the very low dissolved oxygen (DO) levels observed in the middle and bottom waters in spring 2016, the Institute for Marine and Antarctic Studies (IMAS) prepared a report for the Environment Protection Authority (EPA) and Department of Primary Industries, Parks, Water and Environment (DPIPWE) on the science and current status of the benthic and water column environments in Macquarie Harbour (Ross & Macleod 2017a). That report summarised the environmental research and observations from Macquarie Harbour and presented the latest observations of the benthic ecology and water column conditions in the context of the collective information.
A key observation from that report was the major decline in the total abundance and number of species collected from the benthic fauna in the spring (October 2016) survey compared to previous surveys. The increase in Beggiatoa bacteria mats on the sediments in and around marine farming leases in the spring 2016 ROV compliance surveys provided further evidence of deteriorating sediment conditions. This deterioration in sediment conditions was shown to coincide with very low DO levels in bottom and mid waters of the harbour. However, the decline in benthic fauna and DO (bottom and mid water) was not uniform through the harbour. The lowest levels of DO and the greatest changes in fauna occurred at sites in the mid- and southern end of the harbour, with the sites closer to the Harbour entrance and the ocean appearing to be less affected; this pattern was observed at both lease and external (harbour-wide) sites.
This review formed part of the information used by the EPA to support their decision to enforce fallowing of multiple cage sites across the harbour. A key challenge facing farmers and regulators is understanding and predicting the length of fallowing required for benthic recovery in this system specifically. This also has major implications for future stocking plans in the harbour. It is clear that DO levels have been, and will be, a major determinant of the benthic response over the coming months and years. As such, there is a clear need to better understand the drivers of oxygen dynamics, the influence of DO levels on benthic conditions and the effectiveness and duration of fallowing and remediation strategies. With a strong commitment from both industry and government, the Fisheries Research Development Corporation (FRDC) funded project FRDC 2016-067: Understanding oxygen dynamics and the importance for benthic recovery in Macquarie Harbour to address these needs. This information is essential for both operational management of farming activities and the sustainable management of the harbour over the longer term.
FRDC 2016-067 comprises three work packages that together will provide a much clearer understanding of both the effectiveness of fallowing and passive remediation for benthic recovery, and the drivers and importance of oxygen dynamics for recovery. Work package 1 (WP1) will assess benthic recovery over time, building on the 6 previous surveys, which documented benthic conditions up until the major decline in faunal abundance and diversity observed in October 2016, with repeat surveys of all lease and external sites every 4 months. Work package 2 (WP2) will see the further development of the real time DO observation network in the harbour. This includes deployment of i) three vertical strings of acoustic (real-time) DO sensors in the central region of the harbour, ii) a profiling mooring located at the deepest part of the main basin and iii) two additional logger strings (not real-time) to extend the observation network further south (inside the WHA) and north (close to the entrance to the ocean). The third work package (WP3) involves the further development of the CSIRO Near Real Time (NRT) Hydrodynamic and Oxygen Transport model to better describe the physical drivers of Macquarie Harbour circulation, stratification, mixing and DO drawdown and recharge.
This report provides an update on environmental conditions in the Harbour based on the most recent benthic surveys conducted in spring 2017 (WP1) and water column observations up until early 2018.
7
WATER COLUMN CONDITION
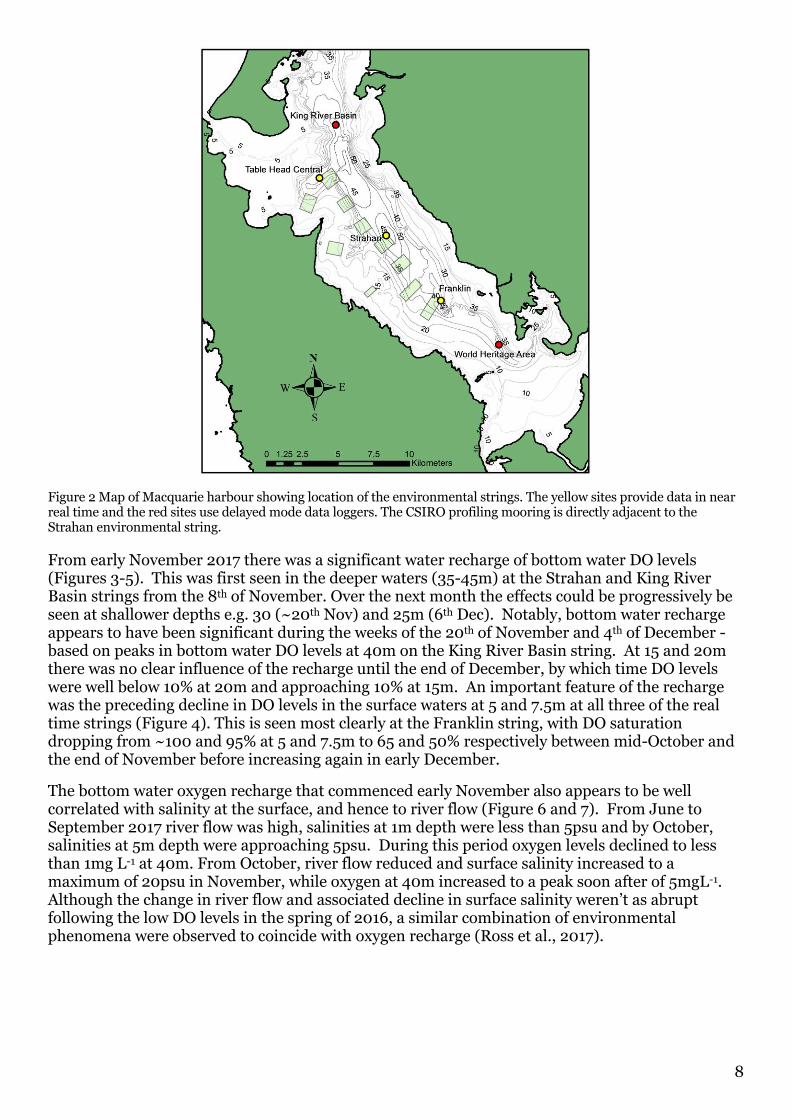
In Ross & MacLeod (2017a) we provided an overview of DO observations in the harbour since the early 1990s and outlined the steady decline observed in bottom and mid-waters since 2009 (Figure 1). In spring 2016 DO levels were extremely low throughout the harbour; in fact the lowest on record. Whilst a range of independent data sets confirmed this observation the Sense-T environmental strings provided the most detail on the evolution of these DO levels through the centre of the harbour. These strings provided real time data on DO and temperature changes throughout the water column at 3 farm sites along the centre of the harbour; Table Head Central closest to the influence of the ocean, Franklin near the boundary of the World Heritage Area (WHA), and Strahan, a site midway between the two (Figure 2). These three strings were refurbished and updated with the latest technology in early June 2017 and the observation network extended further south and north, with additional delayed mode data loggers deployed on a string inside the WHA to the south and on a string in the King River Basin in the north (see Figure 2). These additional strings provide important insight into the influence of boundary conditions (e.g. Gordon River and the ocean).
Figure 1 Long term trend in DO within a number of depth ranges at EPA site 12 (updated from MHDOWG 2014).
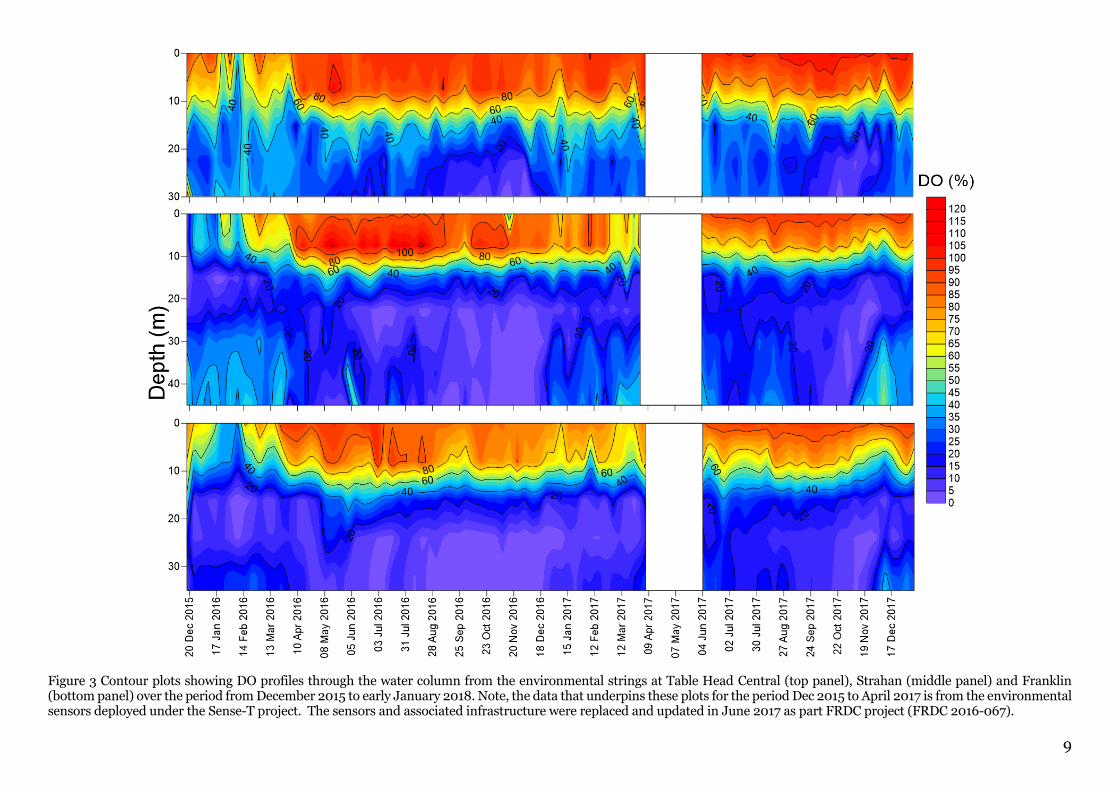
The contour plots produced from the three real time strings have been updated to include data up until early January 2018 (Figure 3). These figures demonstrate the decline in bottom water DO levels in spring 2017. By mid to late October DO levels in both mid and bottom waters had returned to the very low levels experienced in spring 2016, with DO at depths below 20m being less than 10% saturation at the Table Head Central, Strahan and Franklin sites (Figure 4). A similar pattern is apparent when the data from two delayed mode logger strings is included (Figure 5). The comparison of the 5 strings again shows the differences in the timing and development of low DO in relation to distance from the oceanic influence and concomitant changes in residence times. That said, DO levels at the King River Basin site, closest to the ocean influence also reached very low levels below 20m from early October.
Dis
solv
ed O
xygen (
% s
atu
ration)
0
20
40
60
80
100
120
1993
1994
1995
1996
1997
1998
1999
2000
2001
2002
2003
2004
2005
2006
2007
2008
2009
2010
2011
2012
2013
2014
2015
2016
2017
35-45 m25-35 m15-25 m5-15 m0-5 m
2018
8
Figure 2 Map of Macquarie harbour showing location of the environmental strings. The yellow sites provide data in near real time and the red sites use delayed mode data loggers. The CSIRO profiling mooring is directly adjacent to the Strahan environmental string.
From early November 2017 there was a significant water recharge of bottom water DO levels (Figures 3-5). This was first seen in the deeper waters (35-45m) at the Strahan and King River Basin strings from the 8th of November. Over the next month the effects could be progressively be seen at shallower depths e.g. 30 (~20th Nov) and 25m (6th Dec). Notably, bottom water recharge appears to have been significant during the weeks of the 20th of November and 4th of December - based on peaks in bottom water DO levels at 40m on the King River Basin string. At 15 and 20m there was no clear influence of the recharge until the end of December, by which time DO levels were well below 10% at 20m and approaching 10% at 15m. An important feature of the recharge was the preceding decline in DO levels in the surface waters at 5 and 7.5m at all three of the real time strings (Figure 4). This is seen most clearly at the Franklin string, with DO saturation dropping from ~100 and 95% at 5 and 7.5m to 65 and 50% respectively between mid-October and the end of November before increasing again in early December.
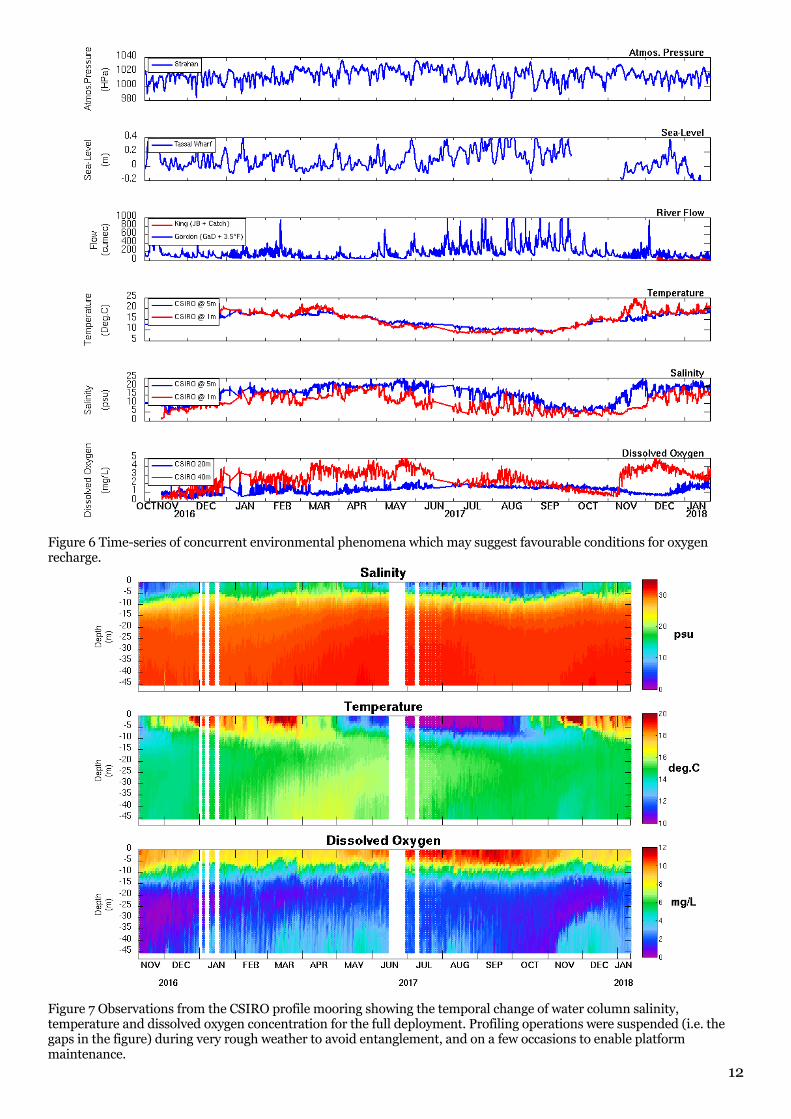
The bottom water oxygen recharge that commenced early November also appears to be well correlated with salinity at the surface, and hence to river flow (Figure 6 and 7). From June to September 2017 river flow was high, salinities at 1m depth were less than 5psu and by October, salinities at 5m depth were approaching 5psu. During this period oxygen levels declined to less than 1mg L-1 at 40m. From October, river flow reduced and surface salinity increased to a maximum of 20psu in November, while oxygen at 40m increased to a peak soon after of 5mgL-1. Although the change in river flow and associated decline in surface salinity weren’t as abrupt following the low DO levels in the spring of 2016, a similar combination of environmental phenomena were observed to coincide with oxygen recharge (Ross et al., 2017).
9
Figure 3 Contour plots showing DO profiles through the water column from the environmental strings at Table Head Central (top panel), Strahan (middle panel) and Franklin (bottom panel) over the period from December 2015 to early January 2018. Note, the data that underpins these plots for the period Dec 2015 to April 2017 is from the environmental sensors deployed under the Sense-T project. The sensors and associated infrastructure were replaced and updated in June 2017 as part FRDC project (FRDC 2016-067).
10
Figure 4 Daily mean DO (% saturation) levels at sensor depths from strings at Table Head Central, Franklin and the World Heritage Area over the period from the beginning of June 2017 to the 8th of January 2018.
11
Figure 5 Contour plots showing DO profiles through the water column from the environmental strings at King River Basin, Table Head Central, Strahan, Franklin and the World Heritage Area over the period from the beginning of June 2017 to the early January 2018. This represents the data from the upgrade to the three near real time strings and the two additional strings deployed as of part FRDC project (FRDC 2016-067). Note, the two additional strings don’t measure to the surface because they are in high traffic waters.
12
Figure 6 Time-series of concurrent environmental phenomena which may suggest favourable conditions for oxygen recharge.
Figure 7 Observations from the CSIRO profile mooring showing the temporal change of water column salinity, temperature and dissolved oxygen concentration for the full deployment. Profiling operations were suspended (i.e. the gaps in the figure) during very rough weather to avoid entanglement, and on a few occasions to enable platform maintenance.
13
BENTHIC CONDITION
In October 2017, IMAS conducted a benthic survey of 5 leases and 24 external sites as part of FRDC 2016-067 (Figure 8, Table 1). This represents the 9th benthic survey conducted under consecutive FRDC projects (FRDC 2014-038, FRDC 2015-024, FRDC 2016-067) since the beginning of 2015. The work was initiated (via. FRDC 2014-038) when video footage identified an increase in abundance of Dorvilleid polychaetes. In addition, it was noted that there were two Dorvilleid species in the video footage and given that these species were used as indicators of enrichment it was felt that it was important to understand the distinction between these two species and whether their environmental responses were comparable. FRDC 2014-038 identified four sites (leases) for assessment. FRDC 2015-024 was commissioned to review the effectiveness of current monitoring protocols in new farming areas (i.e. Macquarie Harbour and Storm Bay in Southern Tasmania), and undertook a broader suite of sampling at the same sites (leases) employed in project 2014-038. The major decline in the abundance and number of species of benthic fauna observed in October 2016 was the final survey of the Macquarie Harbour component of FRDC 2015-024 but it was felt that it was important to extend the research to assess benthic recovery and the effectiveness of fallowing, and as such FRDC 2016-067 was initiated. FRDC 2016-067 extended the benthic sampling to include an additional lease (lease 5) and more external sites1.
Table 1 Benthic survey details
Survey Survey period Reference in report Study
1 6/1/2015 - 30/01/2015 January 2015 FRDC 2014-038
2 25/5/2016 - 4/06/2016 May 2015 FRDC 2015-024
3 8/9/15 - 18/9/2015 September 2015 FRDC 2015-024
4 9/2/2016 - 18-2-2016 February 2016 FRDC 2015-024
5 31/5/2016 - 21/06/2016 June 2016 FRDC 2015-024
6 11/10/2016 - 3/11/2016 October 2016 FRDC 2015-024
7 17/1/2017 - 16/2/2017 January 2017 FRDC 2016-067
8 16/5/2017 - 7/6/2017 May 2017 FRDC 2016-067
9 10/10/2017-25/10/2017 October 2017 FRDC 2016-067
In the May 2017 survey we observed signs of benthic faunal recovery in both abundance and number of species collected relative to the previous two surveys (Figure 9). However, the magnitude of recovery varied between leases; the faunal abundance at study leases 2 and 4 were consistent with levels observed prior to the faunal decline observed in October 2016, whilst the abundances at leases 1 and 3 appeared to have recovered to some extent, but not yet to levels equivalent to those prior to the faunal decline (October 2016). At the external sites (> 1km from leases) we have previously noted that the greatest area of faunal decline in October 2016 was in the deeper central region of the harbour, with relatively little change occurring around in the shallower regions around the margins of the harbour. In the May 2017 survey we found that faunal abundance and species number had increased at many of the sites and/or was within the range recorded historically; albeit the increase was smaller at the deeper southern sites.
The results of the October (spring) 2017 survey show that there has been a subsequent decline in both the abundance and number of species of benthic fauna at lease sites following the recovery observed in May 2017. This coincides with the return of very low DO levels in bottom waters throughout the harbour in spring 2017. However, the magnitude of the faunal change once again 1 All external sites are at least 1km from active leases and allow comparison of benthic changes in the harbour as a whole alongside changes associated with farming, and provide a means to assess temporal changes in benthic ecology.
14
varied across the harbour. At lease 4, the northern most of the study leases, the total abundance and number of species at the 0m site remained unchanged from that observed in May 2017 (Figure 9). This was the site which had the smallest faunal decline in the previous spring (October 2016). Moving away from the cages (i.e. at sites 50-500m) total abundance and the number of species were both lower than observed in May 2017, but this decline was far less than observed at the more southern leases. Dissolved oxygen levels recorded on the bottom during the October 2017 survey were significantly lower than those observed in May 2017, but higher than at a similar time the previous year. In May 2017 there had been a significant increase in both the total abundance and number of species at lease 3, most notably at sites 50m or more from the cages, however, in the latest survey (October 2017), both total abundance and number of species have decreased (Figure 10). At the time of sampling (October 2017) dissolved oxygen levels were similar to the low levels observed in the previous spring (October 2016). At lease 2, a decrease was observed in the total abundance and number of species recovered from samples at all distances from the cage between May and October 2017,with the levels in October 2017 being comparable to those observed during the faunal decline of the previous spring (October 2016) (Figure 11). Again, this is consistent with the very low bottom water DO levels observed in both spring 2016 and 2017. Lease 1 – which is the most southern lease and a lease where there were signs of recovery in May – has also seen a decline in the total abundance, and to a lesser extent the number of species in the October 2017 survey (Figure 12). However, in this case the decline was not to the level observed in the previous spring (October 2016). This lease was completely fallowed just prior to the May 2017 survey, consequently it would seem likely that the return to very low DO levels in spring 2017 has played a significant role in the observed faunal decline at this lease. Although bottom DO levels at this lease at the time of sampling weren’t as low as in the October 2016 survey (Figure 12), the continuous data from the Franklin string shows that there would have been sustained periods of low DO at this lease (Figure 3 and 4). At lease 5, the distinct differences between the two transects for this lease was again evident (Figure 13) with a general trend of higher abundances and more species on the shallower SE transect as compared to the deeper NW transect. The deeper NW transect tending to reflect the more enriched conditions known to occur on that side of the lease. In the October 2017 survey the DO levels, total abundance and number of species were clearly lower at all distances on the NW transect than in the previous two surveys of this lease (May and January 2017).
Figure 8 Maps showing external (red), lease (blue) and environmental string (yellow) sites. There are 2 transects from each of the study leases with five sites (at 0, 50, 100, 250 and 50om) on each transect.
15
Figure 9 Lease 4 plots of total infaunal (>1mm) abundance (per grab = ~ 0.0675m2; top panel), number of species collected in grabs (n=3; middle panel) and the dissolved oxygen (mg/L) overlying the bottom (bottom panel) in relation to 1 (left panels): distance from the cage (0, 50, 100, 250 and 500m from cages) for each survey, and 2 (right panels) survey date with data pooled into 2 distance categories (i.e. those closest: 0, 50 and 100m sites pooled and more distant: 250 and 500m sites pooled). In the left hand panels the data represents the mean (±SE) from two transects that radiate out from cages on opposite sides of the lease, and in the right hand panels the data represents the mean (±SE) from the two transects for each distance category. In the left hand panels the last 3 surveys have been emphasised to show the change since the decline in fauna and low oxygen levels observed in the October 2016 survey.
0 50 100 250 5000
50
100100
200
300A
bund
ance p
er
gra
bMay 2015
Jan 2015Sep 2015
Feb 2016June 2016Oct 2016Jan 2017May 2017Oct 2017
Jan-
15
May
-15
Sep-1
5
Feb-1
6
Jun-
16
Oct-1
6
Jan-
17
May
-17
Oct-1
7
0
50
100
150250-500m
0-100m
0 50 100 250 5000
5
10
15
Num
be
r of
spe
cie
s p
er
gra
b
Jan-
15
May
-15
Sep
-15
Feb-1
6
Jun-
16
Oct-1
6
Jan-
17
May
-17
Oct-1
7
0
5
10
15
0 50 100 250 5000
1
2
3
4
5
Distance from lease (m)
Dis
solv
ed O
xygen (
mg/l)
Jan-
15
May
-15
Sep
-15
Feb-1
6
Jun-
16
Oct-1
6
Jan-
17
May
-17
Oct-1
7
0
1
2
3
4
Survey
16
Figure 10 Lease 3 plots of total infaunal (>1mm) abundance (per grab = ~ 0.0675m2; top panel), number of species collected in grabs (n=3; middle panel) and the dissolved oxygen (mg/L) overlying the bottom (bottom panel) in relation to 1 (left panels): distance from the cage (0, 50, 100, 250 and 500m from cages) for each survey, and 2 (right panels) survey date with data pooled into 2 distance categories (i.e. those closest: 0, 50 and 100m sites pooled and more distant: 250 and 500m sites pooled). In the left hand panels the data represents the mean (±SE) from two transects that radiate out from cages on opposite sides of the lease, and in the right hand panels the data represents the mean (±SE) from the two transects for each distance category. In the left hand panels the last 3 surveys have been emphasised to show the change since the decline in fauna and low oxygen levels observed in the October 2016 survey.
0 50 100 250 5000
50
100100
200
300A
bund
ance p
er
gra
bMay 2015
Jan 2015Sep 2015
Feb 2016June 2016Oct 2016Jan 2017May 2017Oct 2017
Jan-
15
May
-15
Sep
-15
Feb-1
6
Jun-
16
Oct-1
6
Jan-
17
May
-17
Oct-1
7
0
50
100
150
200250-500m
0-100m
0 50 100 250 5000
5
10
15
Num
be
r of
spe
cie
s p
er
gra
b
Jan-
15
May
-15
Sep
-15
Feb-1
6
Jun-
16
Oct-1
6
Jan-
17
May
-17
Oct-1
7
0
5
10
15
0 50 100 250 5000
1
2
3
4
Distance from lease (m)
Dis
solv
ed O
xygen (
mg/l)
Jan-
15
May
-15
Sep
-15
Feb-1
6
Jun-
16
Oct-1
6
Jan-
17
May
-17
Oct-1
7
0
1
2
3
Survey
17
Figure 11 Lease 2 plots of total infaunal (>1mm) abundance (per grab = ~ 0.0675m2; top panel), number of species collected in grabs (n=3; middle panel) and the dissolved oxygen (mg/L) overlying the bottom (bottom panel) in relation to 1 (left panels): distance from the cage (0, 50, 100, 250 and 500m from cages) for each survey, and 2 (right panels) survey date with data pooled into 2 distance categories (i.e. those closest: 0, 50 and 100m sites pooled and more distant: 250 and 500m sites pooled). In the left hand panels the data represents the mean (±SE) from two transects that radiate out from cages on opposite sides of the lease, and in the right hand panels the data represents the mean (±SE) from the two transects for each distance category. In the left hand panels the last 3 surveys have been emphasised to show the change since the decline in fauna and low oxygen levels observed in the October 2016 survey. Note, lease 2 was not surveyed in May 2015.
0 50 100 250 5000
50
100100
200
300
Abund
ance p
er
gra
b May 2015
Jan 2015Sep 2015
Feb 2016June 2016Oct 2016Jan 2017May 2017Oct 2017
Jan-
15
May
-15
Sep
-15
Feb-1
6
Jun-
16
Oct-1
6
Jan-
17
May
-17
Oct-1
7
0
50
100
150250-500m
0-100m
0 50 100 250 5000
5
10
15
Num
be
r of
spe
cie
s p
er
gra
b
Jan-
15
May
-15
Sep
-15
Feb-1
6
Jun-
16
Oct-1
6
Jan-
17
May
-17
Oct-1
7
0
2
4
6
8
10
0 50 100 250 5000
1
2
3
4
5
Distance from lease (m)
Dis
solv
ed O
xygen (
mg/l)
Jan-
15
May
-15
Sep-1
5
Feb-1
6
Jun-
16
Oct-1
6
Jan-
17
May
-17
Oct-1
7
0
1
2
3
4
5
Survey
18
Figure 12 Lease 1 plots of total infaunal (>1mm) abundance (per grab = ~ 0.0675m2; top panel), number of species collected in grabs (n=3; middle panel) and the dissolved oxygen (mg/L) overlying the bottom (bottom panel) in relation to 1 (left panels): distance from the cage (0, 50, 100, 250 and 500m from cages) for each survey, and 2 (right panels) survey date with data pooled into 2 distance categories (i.e. those closest: 0, 50 and 100m sites pooled and more distant: 250 and 500m sites pooled). In the left hand panels the data represents the mean (±SE) from two transects that radiate out from cages on opposite sides of the lease, and in the right hand panels the data represents the mean (±SE) from the two transects for each distance category. In the left hand panels the last 3 surveys have been emphasised to show the change since the decline in fauna and low oxygen levels observed in the October 2016 survey.
0 50 100 250 5000
50
100100
150
200A
bund
ance p
er
gra
b May 2015
Jan 2015Sep 2015
Feb 2016June 2016Oct 2016Jan 2017May 2017Oct 2017
Jan-
15
May
-15
Sep-1
5
Feb-1
6
Jun-
16
Oct-1
6
Jan-
17
May
-17
Oct-1
7
0
20
40
60
80
100250-500m
0-100m
0 50 100 250 5000
2
4
6
8
Num
be
r of
spe
cie
s p
er
gra
b
Jan-
15
May
-15
Sep
-15
Feb-1
6
Jun-
16
Oct-1
6
Jan-
17
May
-17
Oct-1
7
0
2
4
6
8
0 50 100 250 5000
1
2
3
4
Distance from lease (m)
Dis
solv
ed O
xygen (
mg/l)
Jan-
15
May
-15
Sep-1
5
Feb-1
6
Jun-
16
Oct-1
6
Jan-
17
May
-17
Oct-1
7
0
1
2
3
4
Survey
19
Figure 13 Plots of total infaunal (>1mm) abundance (per grab = ~ 0.0675m2), number of species collected in grabs (n=3; middle panel) and the dissolved oxygen (mg/L) overlying the bottom (at 0, 50, 100, 250 and 500m from cages at lease 5 during the January, May and October 2017 surveys. The data shows the mean (± SE) for the North-western (solid) and South-eastern (dashed) transects.
Harbour Wide Change
Since January 2015 we have included a number of additional external sites in order to better assess the potential for harbour wide changes. These sites are at least 1km from the nearest lease and cover similar depth ranges and habitats. These sites allow comparison of benthic changes in the harbour as a whole alongside changes associated with farming and provide a means to assess temporal changes in benthic ecology. The results suggest that the greatest changes in faunal abundance and number of species at the external sites occurred from the middle to southern end of the harbour (Figure 14). The inclusion of the additional 16 external sites since January 2017 (that overlap with the harbour wide surveys conducted at the start of 2015 and 2016) further revealed the greatest decline in October 2016 was in the deeper central region of the harbour.
In the May 2017 survey we reported an increase in the abundance and number of species at a number of the external sites since October 2016 with faunal abundance and species numbers at many of these external sites within the range that had been recorded historically. The October 2017 suggests that there has been no consistent change (improvement/ deterioration) from the patterns observed in May 2017 (Figure 15). However, it is important to note that at four of the southernmost external sites (39, 42, 43 and 44) in the WHA faunal abundances have remained low relative to that observed prior to the original decline from spring 2016 – early 2017. Although there had been a small increase in abundance at sites 39, 42 and 43 between January and May 2017, abundance had declined again in October 2017 at sites 39 and 42, and also 44. At the shallower and most southern of these sites (site 44, ~ 16m depth), faunal abundance has declined across both the May and October 2017 surveys.
0 50 100 250 5000
50
100
150
Distance (m)
Ab
un
da
nce
pe
r g
rab
0 50 100 250 5000
5
10
15
Distance (m)
Nu
mb
er
of
sp
ecie
s p
er
gra
b
0 50 100 250 5000
1
2
3
4
5
Distance (m)
Dis
so
lve
d o
xyg
en
(m
g/L
)
NW Jan 2017
SE Jan 2017
NW May 2017
SE May 2017
NW Oct 2017
SE Oct 2017
20
Figure 14 Plots of total infaunal (>1mm) abundance (per grab = ~0.0675m2) and number of species collected in grabs (n=3) at 7 external sites in Macquarie Harbour from surveys between January 2015 and October 2017. The data for each site represents the mean (±SE) from three replicate grabs. Note that site 26 was not surveyed in May 2015.
Figure 15 Plots of total infaunal (>1mm) abundance (per grab = ~0.0675m2; top 2 panels) and number of species collected in grabs (n=3; bottom panel) at 23 external sites in Macquarie Harbour from surveys in January 2015, February 2016, January 2017 and May 2017. In the middle panel the axis is split to better show differences between surveys at the sites with lower abundances. The data for each lease represents the mean (±SE) from three replicate grabs. Note that sites 2, 3, 10, 14 and 15 were not sampled in the January 2015 survey.
As part of the ongoing benthic faunal surveys video assessments of the study sites using an ROV have been conducted in parallel with the infaunal sampling2. Three minutes of footage was collected at each site and the footage assessed following the methods described by Crawford et al. (2001). In Macquarie Harbour the scoring categories have been expanded for Dorvilleids to provide greater detail on their distribution and relative abundance (Table 2); the scoring categories for Beggiatoa are shown in Table 3.
Table 2 Scoring categories of Dorvilleid abundance for video assessment
Table 3 Scoring categories of Beggiatoa cover for video assessment
Beggiatoa cover absent patchy thick patches thin mat thick mat streaming
The last report (Ross et al., 2017) highlighted a clear reduction in the presence of Beggiatoa at both lease and external sites (Table 4) in May 2017 relative to that observed in the October 2016 and January 2017 surveys. In the September 2107 survey3 there was little change from that seen in May 2017. Of the 51 lease dives in September 2017, Beggiatoa was observed on 29 % (15) of dives compared to 37% (19) of dives in May 2017. The majority of the occurrences in September, like May, were on leases 3 and 5; these were well within the lease boundaries on lease 3 and mainly on the NW transect at lease 5. It is known that currents at lease 5 tend to disperse more of the farm waste to the NW, and both the prevalence of Beggiatoa and the depauperate fauna along this transect are consistent with elevated levels of enrichment in this direction. At the external sites, Beggiatoa was only observed at two of the 28 sites in the September survey, a slight increase compared to only one such observation in the May 2017 survey. It is important to note that with the exception of lease 3, the ROV surveys were conducted approximately a month prior (i.e. mid-September) to the benthic grab surveys (mid-October) (lease 3 was conducted only 2 weeks earlier, at the start of October). Given that bottom water DO levels were considerably higher in mid –September than what they were a month later (Figures 3-7) we might expect the presence and extent of Beggiatoa to have increased by mid-late October when DO levels declined again to very low levels.
As we described in the last report, the ROV footage clearly shows an association between the presence of Dorvilleid polychaetes and farming (see Table 5). However, unlike Beggiatoa the distribution of Dorvilleids typically extends further from the cages, and Dorvilleids are more commonly observed at external sites. Of the 79 ROV dives in the recent survey in September, Dorvilleids were observed on 80% of lease and 32% of external dives compared with 82% of lease and 50% of external dives in May. As described in previous surveys, Dorvilleids were more
2 ROV assessments have generally been conducted within 2-3 weeks of the benthic grab sampling. The ROV assessments are conducted by the 3 growers, and in some cases by Aquenal Pty. Ltd. They are then independently assessed by DPIPWE and EPA. 3 The ROV surveys were conducted in September 2017, approximately a month earlier than the benthic grab survey.
22
commonly observed at the external sites in the southern region of the Harbour. Ross et al. (2016) noted that the broader distribution is largely associated with the Dorvilleid Schistomeringos loveni, which appears to be less tolerant of highly enriched sediments than the colony forming Dorvilleid Ophryotrocha shieldsi that is typically found closely associated with stocked cages. In the September 2017 survey Dorvilleid colonies were only observed on two (four in May) of the 79 dives and always within 50m of the cages. Thus, we would suggest that the distribution of Dorvilleids seen in Figure 17 is largely associated with Schistomeringos loveni, and arguably the patterns associated with the study leases reflect this species preference for more moderately enriched sediments. For example, at lease 1, that had been fallowed for approximately 5 months prior to the survey, Dorvilleids were more common closer to the cage sites whilst at lease 3, that was stocked at the time of sampling, the peak abundance of Dorvilleids is further from the cage sites. At lease 5, their peak abundance is further from the cage site on the NW transect compared to the SE transect, again reflecting the greater levels of enrichment to the NW at this lease.
Table 4 Percentage of lease and external sites for each category of Beggiatoa cover for each survey.
Table 5 Percentage of lease and external sites for each category of Dorvilleid abundance for each survey.
23
Figure 16 Beggiatoa score (severity) from ROV footage at study sites across the harbour on the left panel, and shown in more detail for each of the study leases in the panels on the right.
1
4
5
2
3
6
.0 2 4 6 81
Kilometers
1
2
3
6
4
65
5
Beggiatoa
Bscore
absent
patchy
thick patchy
thin mat
thick mat
Sep 2017
24
Figure 17 Dorvilleid score based on counts from ROV footage at study sites across the harbour on the left panel, and shown in more detail for each of the study leases in the panels on the right.
1
4
5
2
3
6
.0 2 4 6 81
Kilometers
1
2
3
6
4
65
5
Dorvilleids
Dscore
0
1-30
31-100
101-300
301-1000
>1000
Sep 2017
25
REFERENCES
Andrewartha, J. and Wild-Allen (2017) CSIRO Macquarie Harbour Hydrodynamic and Oxygen Tracer Modelling. Progress report to FRDC 2016/067 Project Steering Committee.
Cresswell G.R., Edwards R.J. and Barker B.A. (1989) Macquarie Harbour Tasmania, Seasonal Oceanographic Surveys in 1985, Papers and Proceedings of the Royal Society of Tasmania, Vol. 123.
Macquarie Harbour Dissolved Oxygen Working Group. Final Report October 2014.
Ross, D.J, McCarthy, A., Davey, A., Pender, A., Macleod, C.M (2016) Understanding the Ecology of Dorvilleid Polychaetes in Macquarie Harbour: Response of the benthos to organic enrichment from finish aquaculture. FRDC Final Report Project No. 2014-038
Ross, J. and MacLeod, C (2017a) Environmental Research in Macquarie Harbour – Interim Synopsis of Benthic and Water Column Conditions. Institute for Marine and Antarctic Studies (IMAS), University of Tasmania, Australia, Report to EPA and DPIPWE
Ross, J. and MacLeod, C (2017b) Environmental Research in Macquarie Harbour – FRDC 2016/067: Understanding oxygen dynamics and the importance for benthic recovery in Macquarie Harbour. Institute for Marine and Antarctic Studies (IMAS), University of Tasmania, Australia. Progress Report to the Project Steering Committee and FRDC.
Ross, J., Wild-Allen, K. and MacLeod, C (2017) Environmental Research in Macquarie Harbour – FRDC 2016/067: Understanding oxygen dynamics and the importance for benthic recovery in Macquarie Harbour. Institute for Marine and Antarctic Studies (IMAS), University of Tasmania, Australia. Progress Report to the Project Steering Committee and FRDC.