28
Environmental Resources and Economic Growth James Roumasset University of Hawaii Hua Wang World Bank Kimberly Burnett University of Hawaii
| Date post: | 22-Dec-2015 |
| Category: |
Documents |
| View: | 214 times |
| Download: | 0 times |
Environmental Resources and Economic Growth
James Roumasset University of Hawaii
Hua WangWorld Bank
Kimberly BurnettUniversity of Hawaii

Environmental Kuznets Curve
0
50
100
150
200
250
300
0 5000 10000 15000 20000 25000 30000
income per Capita
Kg SO2 for 55 developed and developing countries, 1987-88,
turning point $3137
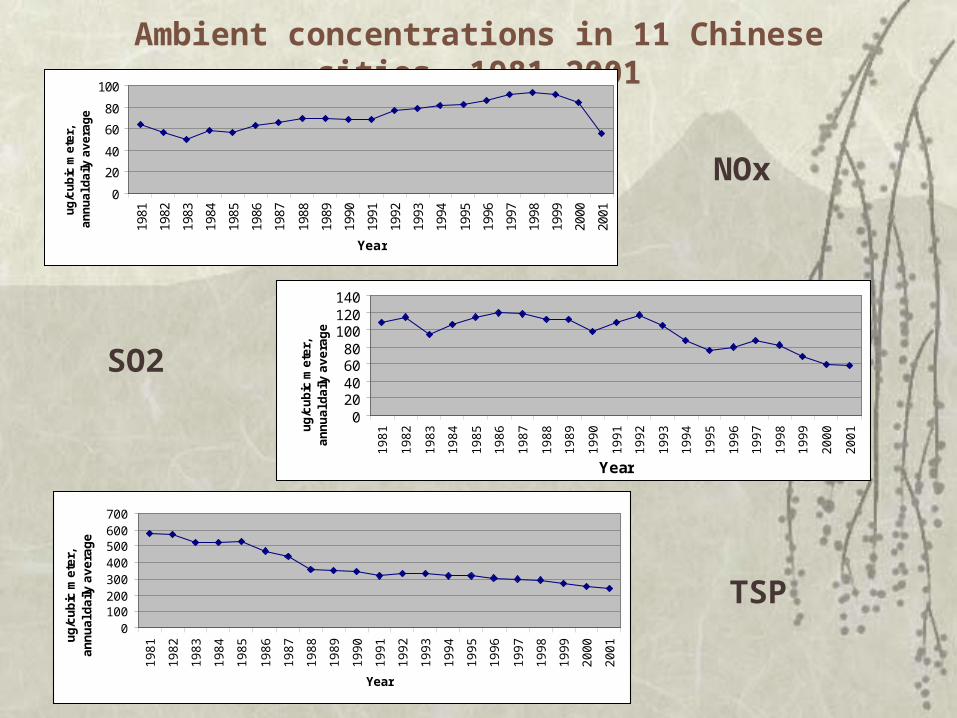
Ambient concentrations in 11 Chinese cities, 1981-2001
0
20
40
60
80
100
1981
1982
1983
1984
1985
1986
1987
1988
1989
1990
1991
1992
1993
1994
1995
1996
1997
1998
1999
2000
2001
Year
ug
/cu
bic
me
ter,
an
nu
al d
aily
av
era
ge
NOx
020406080
100120140
19
81
19
82
19
83
19
84
19
85
19
86
19
87
19
88
19
89
19
90
19
91
19
92
19
93
19
94
19
95
19
96
19
97
19
98
19
99
20
00
20
01
Year
ug
/cu
bic
me
ter,
a
nn
ua
l da
ily a
ve
rag
e
SO2
0100200300400500600700
19
81
19
82
19
83
19
84
19
85
19
86
19
87
19
88
19
89
19
90
19
91
19
92
19
93
19
94
19
95
19
96
19
97
19
98
19
99
20
00
20
01
Year
ug
/cu
bic
me
ter,
a
nn
ua
l da
ily a
ve
rag
e
TSP

Major City EKC’s
NO
X
gdppc6270 14059.8
71
151
Beijing, NOx
SO
2
gdppc9276.84 19733.7
42.3061
91
Shanghai, SO2
SO
2
gdppc4255.32 11097.2
48.2578
199
Tianjin, SO2
TS
P
gdppc3737.51 6096.75
311
641
Taiyuan, TSP
TS
P
gdppc5324.39 11341.5
288
540
Anshan, TSP
NO
X
gdppc7306.41 21216.7
67.4661
152
Guangzhou, NOx
NO
X
gdppc4533.19 10901.2
21.6735
81
Changchun, NOx
SO
2
gdppc5324.39 11341.5
73
125
Anshan, SO2
TS
P
gdppc3532.37 10095.6
180.222
372
Chengdu, TSP
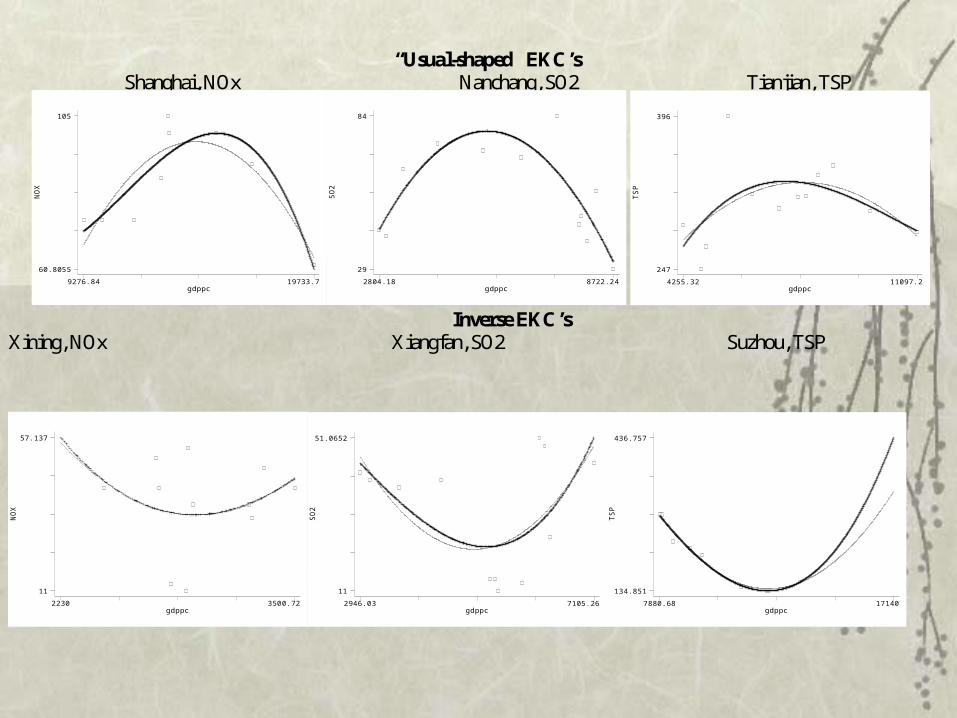
“Usual-shaped” EKC’s Shanghai, NOx Nanchang, SO2 Tianjian, TSP
NO
X
gdppc9276.84 19733.7
60.8055
105
SO
2
gdppc2804.18 8722.24
29
84
TS
P
gdppc4255.32 11097.2
247
396
Inverse EKC’s
Xining, NOx Xiangfan, SO2 Suzhou, TSP
NO
X
gdppc2230 3500.72
11
57.137
SO
2
gdppc2946.03 7105.26
11
51.0652
TS
Pgdppc
7880.68 17140
134.851
436.757

Why is there no clear pattern?
Regulation comes in waves Growth uneven Decentralization Relative prices, e.g., coal Short time horizon

Statistical reporting
Falling levels of NOx, SO2, TSP in 11 major cities
Contrasts starkly with bleak qualitative reports
What information is needed to complete story?

Towards improved statistical reporting
TSP measurement – PM 40 vs PM 10 NOx measurement – NO vs NO2 Decentralization of industry? All emissions are not equal – need source-
receptor modeling

Towards improved statistical reporting cont
Sampling protocols – location, seasonal, weather factors (Beijing – TSP falling, but May 2000, then Premier Zhu Rongji warned that the rapidly advancing desert would necessitate moving the capital from Beijing
Season matters – In Beijing, winter SO2 2.7 times worse for health than average SO2, and 14.2 times worse than summer SO2 (Brajer and Mead 2004)

But with more careful analysis…
Auffhammer et al. (2004) – CO2 in 30 provinces from 1985-2000
Correct approach is effect of income with controls on composition of industry, population, and proximity to the coast
China on the flat part of EKC Income not as important for CO2
concentrations as population growth
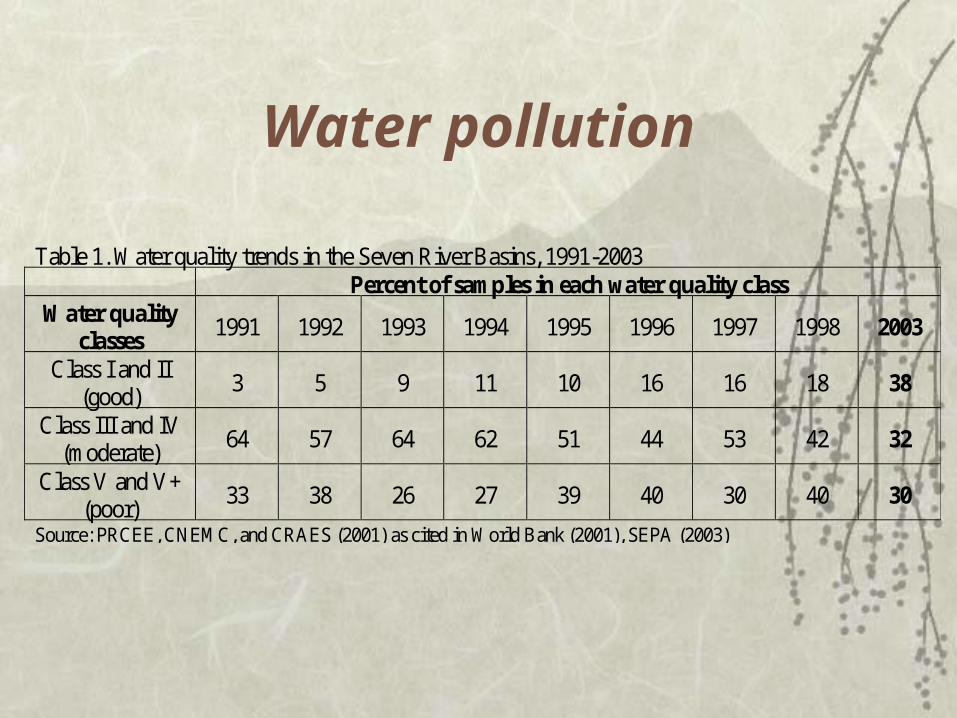
Water pollution
Table 1. Water quality trends in the Seven River Basins, 1991-2003 Percent of samples in each water quality class Water quality
classes 1991 1992 1993 1994 1995 1996 1997 1998 2003
Class I and II (good)
3 5 9 11 10 16 16 18 38
Class III and IV (moderate)
64 57 64 62 51 44 53 42 32
Class V and V+ (poor)
33 38 26 27 39 40 30 40 30
Source: PRCEE, CNEMC, and CRAES (2001) as cited in World Bank (2001), SEPA (2003)

Concentrations
Proportion in poor water classes decreasing, but concentrations increasing
Table 2. Annual average water trends in two lakes (mg/l) 1992 1994 1996 1998 Chao Lake Total Phosphorus 0.25 0.34 0.25 0.36 Total Nitrogen 3.83 4.19 3.46 2.88 Dianchi Lake Total Phosphorus 0.23 0.30 0.23 0.41 Total Nitrogen 2.14 3.00 2.53 4.76 Source: PRCEE, CNEMC, and CRAES (2001) as cited in World Bank (2001)

Natural Resources – Water
Water resources not increasing; supply (raw provision of water to consumers, including transportation loss, from the water resource) decreasing
246.826 million people without running water Problem especially severe in populous northern cities,
water scarce, pollution severe, low income households with no running water
Table 3. Total water resources in China, in billion cubic meters. 1997 1998 1999 2000 2001 2002
2785.5 3401.7 2819.6 2770.1 2686.8 2825.5 Source: SEPA (2004)
Table 4. Available water supply in China, in billion m3 1997 1998 1999 2000 2001 2002 2003 Surface 456.6 441.9 451.4 444.14 444.80 440.4 428.7 Ground 103.1 102.8 107.5 106.75 109.67 107.2 101.6 Total 562.3 547.0 561.3 553.1 556.7 549.7 532 Source: Ministry of Water Resources, China Statistical Yearbook
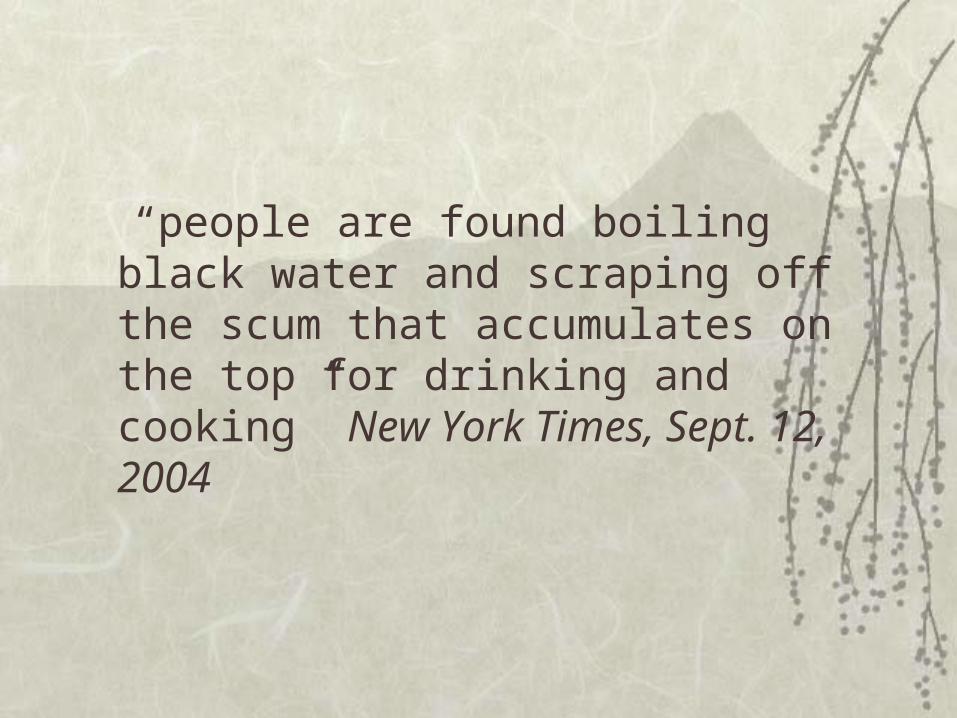
“people are found boiling black water and scraping off the scum that accumulates on the top for drinking and cooking” New York Times, Sept. 12, 2004

Soil Desertification: 900 square miles, 5 billion tons lost/yr.
(Brown, 1994) Since the 1990’s, desertification has been major land
resource concern But, productivity & quantity farmland increasing, 140
million hectares in 1993 (Lindert, 1996) Soil movement not soil loss Increased food imports reflect changing comparative
advantage. Off-site problems, health effects may be of greater concern
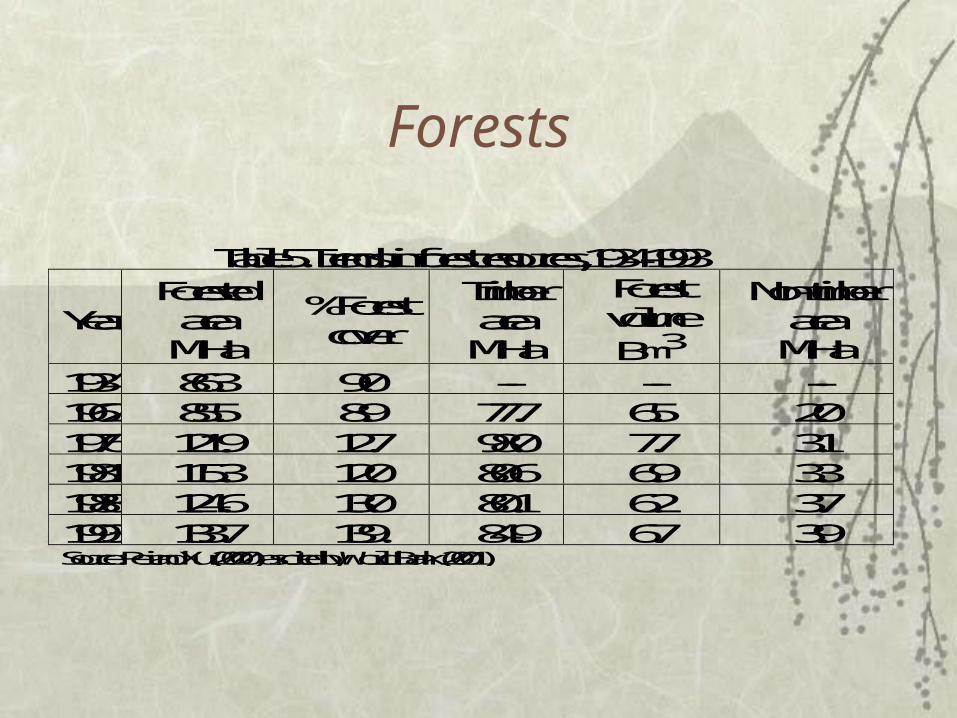
Forests
Table 5. Trends in forest resources, 1934-1993
Year Forested area M Ha
% Forest cover
Timber area M Ha
Forest volume B m3
Non-timber area M Ha
1934 86.3 9.0 -- -- -- 1962 85.5 8.9 77.7 6.5 2.0 1976 121.9 12.7 98.0 7.7 3.1 1981 115.3 12.0 80.6 6.9 3.3 1988 124.6 13.0 80.1 6.2 3.7 1993 133.7 139. 84.9 6.7 3.9 Source: Pei and Xu (2000) as cited by World Bank (2001)

Forests cont
Total area increasing, total volume rebounding (Rozelle et al. 2003) but quality, biodiversity decreasing
Afforestation campaigns – fast growing species, overly dense spacing; problems with species viability, commercial value, biodiversity.
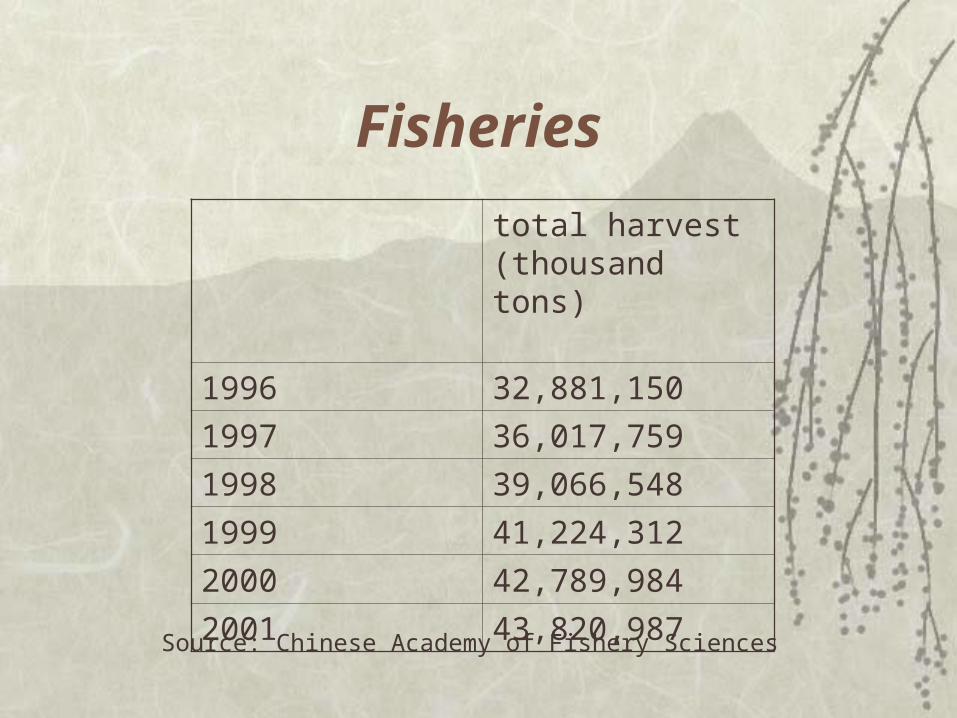
Fisheries
total harvest (thousand tons)
1996 32,881,150
1997 36,017,759
1998 39,066,548
1999 41,224,312
2000 42,789,984
2001 43,820,987
Source: Chinese Academy of Fishery Sciences
Fisheries
Largest producer in the world, largest number of fishing boats
Over-fishing, water pollution => decline in stocks
Regulations in place to limit number of boats but not quotas
Quotas considered (not ITQ’s)
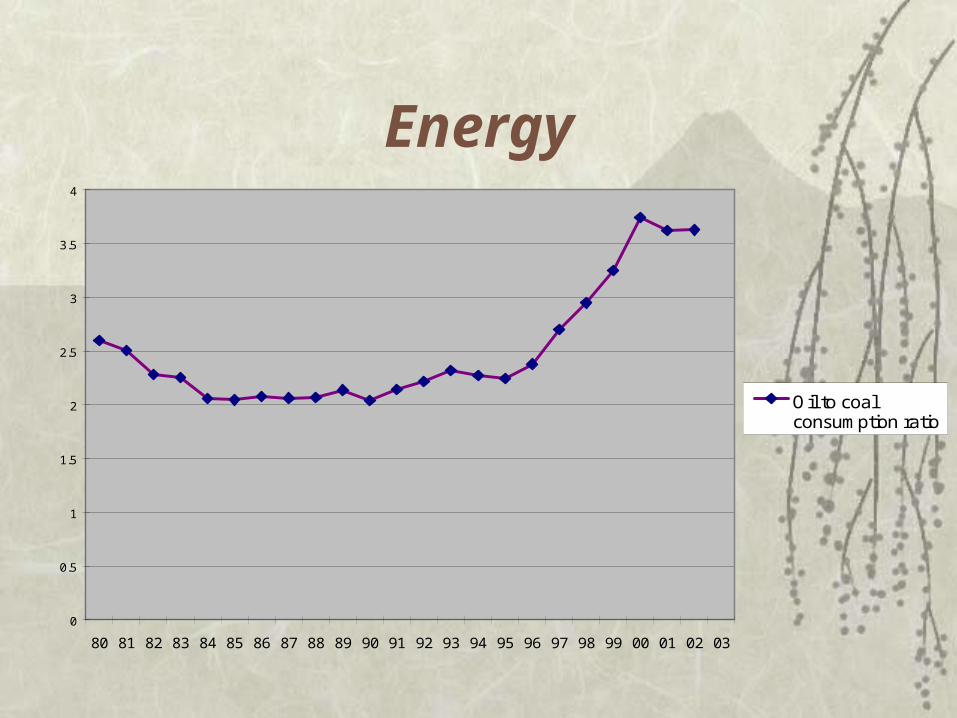
Energy
0
0.5
1
1.5
2
2.5
3
3.5
4
80 81 82 83 84 85 86 87 88 89 90 91 92 93 94 95 96 97 98 99 00 01 02 03
Oil to coalconsumption ratio

Coal
Table 6. China’s production and consumption of coal, in billions of tons, 1980-2003 1980 1985 1990 1995 2000 2001 2002 2003
Production 0.68 0.96 1.19 1.53 1.31 1.46 1.52 1.67 Consumption 0.67 0.92 1.12 1.49 1.28 1.36 1.42 1.61
Source: http://www.eia.doe.gov/

Energy cont.
Oil cleaner, less construction time Coal consumption still growing especially
after 2000 (relative energy cost, import prices)
2nd largest exporter of coal beginning 2001
Depreciation of Natural Capital
Air pollution: growth less than GDP Water pollution: not greater than GDP Renewables: decrease in stock reduction Non-renewables:extraction growing less
than GDP

GNNP
Constant or decreasing wedge
Opportunities for further convergence, i.e.higher growth
$ NNP GNNP Time

Policy Reform
Inconsistent regulations – across industries and firm sizes
Weak incentives – small fines, no incentives for inspectors
Lack of enforcement – comply only during inspections, not enough inspectors
Underpricing of natural resources

Improvements?
Water prices going up in some areas Experimentation with tradable sulfur
permits

Remaining Challenges
More attention to air than water pollution Need for water demand management Water, forestry resources remain
underpriced, overused Use of oil has increased, but not as fast as
energy consumption Major roadblock appears to be public
administration

Conclusions
Substantial progress in energy efficiency and emissions/BTU
Offset by rapid growth and low per capita income, i.e. EKC max remains in future
Growth statistics not compromised by failure to deduct environmental depreciation


