Environmental Status and Action Plan for control of pollution at Chandrapur Maharashtra Pollution Control Board 0 ENVIRONMENTAL STATUS AND ACTION PLAN FOR CONTROL OF POLLUTION AT CHANDRAPUR MAHARASHTRA POLLUTION CONTROL BOARD MUMBAI - 400 022 http://mpcb.mah.nic.in March 2006
Transcript
Environmental Status and Action Plan for control of pollution at Chandrapur
Maharashtra Pollution Control Board
0
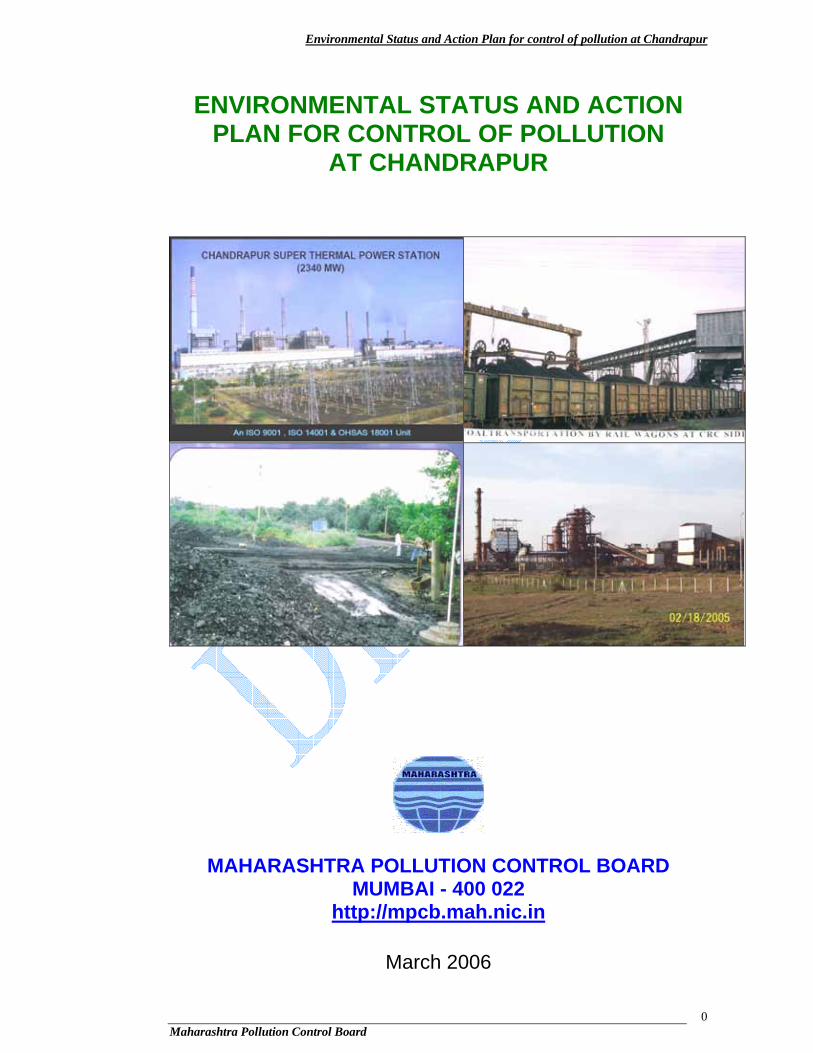
ENVIRONMENTAL STATUS AND ACTION PLAN FOR CONTROL OF POLLUTION
AT CHANDRAPUR
MAHARASHTRA POLLUTION CONTROL BOARD MUMBAI - 400 022
http://mpcb.mah.nic.in
March 2006
Environmental Status and Action Plan for control of pollution at Chandrapur
Maharashtra Pollution Control Board
1
CONTENTS
Sr.No Particulars Page No 1 BACKGROUND
2
2 PHYSIOGRAPHY
3
3 WATER RESOURCES
7
4 MINERAL RESOURCES
10
5 INDUSTRIAL DEVELOPMENT IN CHANDRAPUR
10
6 ACTIVITIES IMPACTING THE ENVIRONMENT
11
7 FORMULATION OF ACTION PLAN
14
8 FORMULATION OF ACTION PLAN
26
ANNEXURE-I: ACTION PLAN FOR CONTROL OF POLLUTION IN CHANDRAPUR DISTRICT
31
Environmental Status and Action Plan for control of pollution at Chandrapur
Maharashtra Pollution Control Board
2
Environmental status of Chandrapur District
1. BACKGROUND: Chandrapur district is famous for its sprawling coal mines and Tadoba
wildlife sanctuary, which is an important Tiger destination in the country. The
mineral based industrial development and rapid urbanization in this district has
albeit resulted in pollution and environmental degradation and its effects are
being felt on a wide scale. The Parliament and Maharashtra Legislative
assembly have deliberated on environmental degradation and social problems
associated with this industrial development and recommended the abatement
measures. Accordingly, MoEF and MPCB have issued directions to various
industries and implementing agencies respectively, directing them to take
effective steps to control environmental degradation and the pollution.
The air quality issues at Chandrapur have also been studied under US-
Asia Environmental Program by a team of experts from US-EPA in September,
2004. They carried out the institutional analysis and recommended a pilot project
to implement the Visible Emission Observations (VEOs) from the stationary
sources, as an alternate approach to manage the air quality at Chandrapur.
Considering the multitude of pollution problems at Chandrapur, Member
Secretary, MPCB took a review of the current status of the pollution from various
sources in December 2005. It was noticed during the review that the industrial
and other activities at Chandrapur have extensively contributed to pollution and
there is a considerable rise in the associated health problems in the local
population. It was perceived that pollution, mainly air pollution, at Chandrapur is
a serious threat to environment and public health needing urgent intervention by
all concerned. MPCB therefore decided to prepare `an integrated action plan to control pollution at Chandrapur’ covering various aspects of the
environmental degradation and the pollution. The proposed plan stipulates
implementation of the time bound actions through an effective and well
orchestrated interdepartmental coordination.
Environmental Status and Action Plan for control of pollution at Chandrapur
Maharashtra Pollution Control Board
3
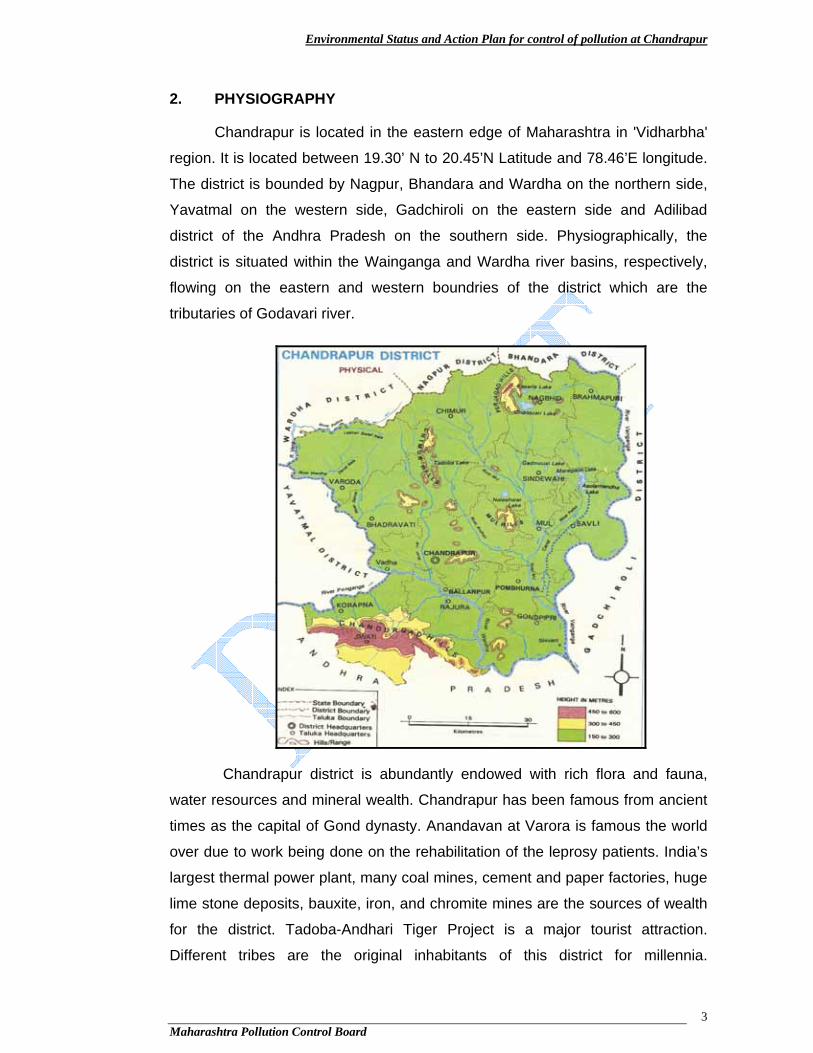
2. PHYSIOGRAPHY
Chandrapur is located in the eastern edge of Maharashtra in 'Vidharbha'
region. It is located between 19.30’ N to 20.45’N Latitude and 78.46’E longitude.
The district is bounded by Nagpur, Bhandara and Wardha on the northern side,
Yavatmal on the western side, Gadchiroli on the eastern side and Adilibad
district of the Andhra Pradesh on the southern side. Physiographically, the
district is situated within the Wainganga and Wardha river basins, respectively,
flowing on the eastern and western boundries of the district which are the
tributaries of Godavari river.
Chandrapur district is abundantly endowed with rich flora and fauna,
water resources and mineral wealth. Chandrapur has been famous from ancient
times as the capital of Gond dynasty. Anandavan at Varora is famous the world
over due to work being done on the rehabilitation of the leprosy patients. India’s
largest thermal power plant, many coal mines, cement and paper factories, huge
lime stone deposits, bauxite, iron, and chromite mines are the sources of wealth
for the district. Tadoba-Andhari Tiger Project is a major tourist attraction.
Different tribes are the original inhabitants of this district for millennia.
Environmental Status and Action Plan for control of pollution at Chandrapur
Maharashtra Pollution Control Board
4
Chandrapur district is spread over about 11,443 square km. There are eleven
talukas including 12 towns in this district, out of which six are municipal towns.
Population of the district as per 2001 census is about 22,15,000. Total number of
villages is 1790. Average size of an urban centre is 41,000 to 45,000 persons.
Wardha is the main river flowing through the district. Rivers Erai,
Andhari,Wainganga and the .Penganga are its tributaries. Chimur and Mul are
the main water sheds between Wardha and Wainganga rivers.
2.1 Climate :
The climate of the district can be classified as tropical hot climate with high
range of temperature through out of year. Primarily there are two prominent
seasons in the district - the very hot summer and moderate winter. The summer
months are very hot and prolonged while winter is short and mild. The monsoon
season starts immediately after summer till late September. The southwest
monsoon bring lot of rainfall during rainy season and there is no draught prone
area in the district.
The temperature starts decreasing from the month of October. December
is the coldest month. Mean maximum temperature during December is 28.2º and
mean minimum is 11.6º .The southern part is comparatively warmer then the
north which ranges between 29.6º to 14.6º. The lowest recorded temperature is
in the north is 3º and 8º in the south. The daily mean temperature starts rising
from the month of February and May is the peak summer month when mean
maximum temperature goes up to 43º and minimum temperature is 28º to
29º. In severe heat condition temperature rises up to 46º. However temperature
starts reducing after May due to onset of monsoon, which last from June to
September when it is hot and humid.
The average annual rainfall is about 1420 mm. The eastern part receives
more rainfall then west. Average no of rainy days is 60 to 65 through out the
district. The relative humidity is very high during monsoon season, which
exceeds 70%, but after monsoon season it falls down rapidly and in summer it is
only 20%.
The prominent wind direction is from south to north. In summer the wind
direction is from east to and south and monsoon from south to east. During
Environmental Status and Action Plan for control of pollution at Chandrapur
Maharashtra Pollution Control Board
5
winter, the wind direction changes from north to east. Frequently is characterized
by the blowing of wild and violent winds heralding the approach of hot season
which last till middle of June.
2.2 Land use pattern:
Chandrapur district can be divided into two regions on the basis of
physiographic features.
1. The plain and the fertile region lying in river basins of the Wardha, the
Penganga and the Wainganga rivers - The widely spread and flat terrain
exhibits mostly rolling topography with residual knolls of the hills in the
southern portion while in the northern portion that is in Brahmapuri tahsil,
fairly wide flood and alluvial plains covered with fertile loams are observed.
The flat terrain of Chandrapur district on the whole lies generally between
200-250 m (MSL). In the Penganga valley, flat terrain covers very little area in
the south western portion of the district. The area occupied by the Penganga
basin in the south-western parts of the district in Rajura and Chandur tahsils
exhibits mostly hilly topography. The hills are known as Gadchandur and
Manikgarh hills the altitude in general rises to 500m above MSL.
2. The upland hilly region - The upland hilly region lies between the Wardha
and the Wainganga rivers comprising parts of Warora, Chandrapur and major
part of Brahmapuri tahsils. It has sandy soil. The hills in Wardha, Gadchiroli
and Chandrapur districts are low altitude hills called ‘Chimur-Perjagarh-Mul
hills’. The altitude of these hills is on average 300 m. above MSL. The
present land-use pattern is shown below.
Inhabited area : 880 .00 Sq. Kms.
Agricultural area : 4870 .00 Sq. Kms.
Industrial area : 32.34 Sq. Kms.
Forest cover : 3810 .00 Sq. Kms
Waste Land : 550.00 Sq. Kms.
Drought Prone area : 2890 .00 Sq. Kms
Environmental Status and Action Plan for control of pollution at Chandrapur
Maharashtra Pollution Control Board
6
2.3 Soils:
Soil is the most important feature of physiography, the formation of which
largely depends upon the topography rock types and drainage. The cropping
pattern in the are is governed by the thickness of soil mantle, its texture and
constancy. The soils of Chandrapur district are of various types. Each type
covering a well-defined tract which displays cropping pattern of totally different
level. The soils occurring in the Wardha and the Wainganga valleys are
generally most fertile.
The soil of the district is well defined and conductive for growing crops of
various kinds. The most fertile soils are found in the Wardha and
Wainganga valleys. The numerous varieties of soils known by many local names
they are grouped under the following representative classes. The soil conditions
along Wardha-Painganga valleys are rich with black regur loams and clay loams
along the river bed. These soils locally known as kali soils, are very productive
and suitable for rabi crops due to high moisture retention capacity. However
water logging is very common during monsoon and is therefore not suitable for
khariff crops.
2.4 Vegetation:
The vegetation of the district is characterized as southern Tropical Dry
Deciduous Forest where teak is the dominant species. other associated species
are Aain, Bamboo, Bijja, Dhada, Haldu, Semal, Tendu etc. depending upon the
physiographic features. Jamun, Mango, Arjun are found in moist area. The
slopes of the hills have poor and low density vegetation. The plains of the tract
have luxuriant forest. The district had about 3651 sq. km. forest cover in 1998-
99, which accounted for 33.44% of the total geographical area of the district.
However according to forest Dept. the district has an area 5005 sq. km under
forest which works out to 46.80 % against state averages 17.45%. The latest
available figures (2001) indicate a forest cover of 4531 sq. kms which accounts
for 41.5 % of the total land in the district. The major forest area is surrounded by
the industrial activity which is also fast urbanizing.
Environmental Status and Action Plan for control of pollution at Chandrapur
Maharashtra Pollution Control Board
7
2.5 Socio-Economic, Occupational and Educational Profile:
Physical feature and land use pattern of the district indicate that
agriculture is the main activity.. The total agriculture area is 4870 Sq. kms. i.e.
46.05 % of the total area of the district. Paddy, Cotton, Jowar and Soybean are
the main crops in the district. 34.33 % of the total area I under forest cover. The
percentage of urban & rural population is 28.04 % & 71.96 % respectively.
Scheduled Castes and Scheduled Tribes population accounts for 16.78 % and
19.70 %, respectively. The total area under industrial use accounts for 32.34
sq.km.
There are 7 urban centres and 13 major rural centres. About 6.26 % of
the population lives in the slums and 13.36 % of the population is below poverty
line. Total work-force in 4 existing industrial estates is just 2071 but there are
major industries like coal mines. Thermal power station, Cement Factories,
Paper mill etc. which are situated outside the industrial area where work force is
about 30,000. There is an influx of workers from other states particularly in Coal
Mines. Seasonal migration is temporary phenomenon lasting for about two to
three months. The workers mostly migrate to Chandrapur district from Madhya
Pradesh, Andhra Pradesh, Orissa and Bihar.
There are two historical centers and 16 religious centers where there is
influx of tourists in a particular season.
The overall literacy percent age of the district is 59.41 %.
3. WATER RESOURCES
Wardha, Wainganga and Penganga are the important rivers in
Chandrapur district. The Wardha river flows into the district from the western
boundary and then flows along the boundaries of Varora, Chandrapur, Korapna,
Rajura, Ballarpur and Gondpipri Talukas. Penganga and Irai rivers meet the
Wardha river. The confluence of the Wardha and Penganga rivers is near
Wardha town. The Wainganga flows along the eastern boundary of the district.
This river flows from north to south. The confluence of the Wardha and the
Wainganga rivers is near Shivani. Andhari and Mul (Uma) are two other rivers in
the district.
Environmental Status and Action Plan for control of pollution at Chandrapur
Maharashtra Pollution Control Board
8
The larger lakes in the district are Asola mendha, Kasarla, Tadoba,
Naleshwar, Gadmousi. There are bunds at Uma, Andhari, Thargaon,
Dongargaon. There are only medium size dams at Asolamendha in Savli taluka,
Naleshwar in Sindewahi Taluka, Ghodazari in Nagbhid Taluka, Chargaon,
Chandainala and Labhan Sarad in Varora Taluka and Amalnalain and
Pakadegudum in Korapna Taluka. Canals and other facilities are also used for
water supply. Small bunds are built to store water on the farms. These are called
bodis. The various schemes implemented for the water supply for irrigation and
their total command area as below:
Type of irrigation Strength of irrigation Total command area in ha.
Wells 18039 8000
Tube Well 255 ----
Medium Dams 7 92000
Smaller dams 2497 54881
Larger dams Nil Nil
Total 154881
The drinking water supply projects in chandrapur district includes 203
pipeline schemes, 171 tube wells, 4078 wells and 4514 Bore well/ Hand pumps
in the entire district. Besides, the Municipal councils in Chandrapur district are
depending on the following drinking water sources:
Chandrapur Municipal council : Erai Dam
Rajura Municipal council : Intake well at Kopangaon Nalla.
Mul Municipal council : Wainganga river
Bramhapuri Municipal council : Borewell
Bhadrawati Municipal council : Wardha river
Warora Municipal council : Wardha river
Environmental Status and Action Plan for control of pollution at Chandrapur
Maharashtra Pollution Control Board
9
3.1 Ground Water Resources:
About 85% of the state is covered by Deccan basalts whereas the rest of
the state is covered by Quaternary alluvium. The total replenishable Ground
water Resource is of the order of 37.82 BCM/Yr Provision for Domestic,
Industrial & Other uses 12.40 BCM/Yr Available Ground Water Resources for
water levels declining trend (more than 20 cm per year) Pre-Monsoon (1995-
2004) Fluoride is a common contaminant in Chandrapur district while high nitrate
levels are also found in some of the areas in the district as per CGWB reports.
Endemic fluorosis, dental caries, mottling of teeth, pain in joints have
been observed in Chandrapur district by various investigating agencies. The
district is underlain by various geological formations of Archaean to recent age.
The Achaeans comprises hard and fissured gneisses, quartzite. The Vindhagan
metasediments are represented by flaggy and massive shale, limestone,
sandstones and ferruginous quartzite, covering on area of 1670 sq. Km. Ground
water in Achaean crystallites and vidhayan rocks occurs under table to semi-
confined conditions in weathered and fractured zones. Aquifers in archaeans are
characterized by degree of weathering, secondary porosity and effective inter-
granular space, whereas in Vindhyans, joint planes and fracture porosity
developed during cooling and compression of sediments and in limestone the
solution cavities play a major role in aquifer nature.
The water samples from open wells and the bore wells in the fluoride
contaminated areas viz. Rajura, Korpana, Sindewahi, Mul, Warora, Bhadravati
and Chimur talukas, show that fluoride concentration in the 27 villages is in the
range of 1.0-3.0 ppm and in villages viz. Bamni, Ladbori, Chargaon Badge and
Dhoptala it is 3.9 ppm, 7.3 ppm, 3.85 ppm and 4.6 ppm, respectively, which is
much beyond the drinking water standards. Water samples in shales, limestones
of Rajura, Korpana and Warora talukas are also show a high concentration of
fluoride both in phreatic as well as deeper aquifers as compared to aquifers of
granite gneisses of Sindewahi, Mul and Chimur Talukas.
The population growth and industrial development in Chandrapur
Ballarshah region have made an adverse effect on the quality of ground-water of
Environmental Status and Action Plan for control of pollution at Chandrapur
Maharashtra Pollution Control Board
10
Visapur Nala Basin. The ground-water of Visapur Nala Basin in general is not
very bad for irrigation but the dug well waters Nandgaon and some from Visapur
village are found unfit for drinking purpose owing to characteristically high
concentration of nitrate in them.
4. MINERAL RESOURCES
Natural deposits of the high -grade iron ore in Sindewahi taluka are
estimated to be 22, 000, 00 tonnes; limestone in Rajura & Korpana talukas
(54,70,00,000 tonnes). Coal in Chandrapur taluka alone is estimated to be
1,22,70,00,000 tonnes. Fish production in the district is about 3945 tonnes/year.
Chandrapur district is known for its forest cover. Forest area is 1,19,124.27 ha
and social forestry area is 543.68 ha.
Availability of coal has led to opening of increasing number coal mines
and the power plant. Limestone has prompted cement industries particularly in
Rajura Tahsil. Paper mills have been established because of availability of
wood/bamboo. They are located on banks of river or nallahs. Paddy is the main
crop of this district and has led to a number of rice processing mills.
Decadal growth rate of the district is about 25 per cent .Chandrapur taluka
has experienced 47 per cent growth rate and is closely followed by the Rajura
taluka. This growth is mainly due to the abundance of the minerals and
industries based on them. However, this has also led to emergence of the
environmental problems. Unless effective strategy is evolved to control the
environmental pollution in a time bound manner the situation may worsen in a
few years.
5. INDUSTRIAL DEVELOPMENT IN CHANDRAPUR
The industrial sector occupies a prominent position in the economy of
Maharashtra, which still retains the numero uno status in the country though
states like Gujarat, Karnataka and Andhra Pradesh are surging forward with
massive investments. Addl.Chandrapur Indl.Area is one of the best Industrial
Area in Nagpur region. This Industrial Area is the best Black Gold city of
Maharashtra in the region.
Environmental Status and Action Plan for control of pollution at Chandrapur
Maharashtra Pollution Control Board
11
MIDC has been set-up with the main objective to promote industrial
growth and attract foreign direct investment in Maharashtra. MIDC has made
efforts to promote the resource based industrial growth of this region and many
corporates have set up industries in this backward district. Addl. Chandrapur
Industrial Area spans a total area of 70.23 hectares. Besides, MIDC has
acquired 214.40 ha of lands and developed 46 plots at Padolee and 154.62 ha of
lands at Korpan, Bhoyegaon, Nandgaon, Ekodi and Kawthala villages to
promote the industrial growth in Chandrapur district. It is planned to utilize these
areas for setting up of cement manufacture, power plant and lime mining
activities. Tadali has been identified as a growth center for sponge iron
manufacturing industries considering the ample availability of the iron ore and
coal in this region. MPCB has decided a policy on the size of such plants and the
development of this industry shall be accordingly governed. This is necessary to
ensure techno economic feasibility of compliance of environmental standards.
There are other four main growth centers coming up however, they are in the
initial stages of development and may take some more time to become active
industrial areas. The industrial estate set up in 1961 houses 86 industrial units
which include chemical, auxiliary and engineering/ service industries.
Besides, the existing major industries in Chandrapur district include Coal
mines of WCL, Cement plants, paper industry, lime mining and kilns, steel and
Super Thermal Power Plant of MSEB.
6. ACTIVITIES IMPACTING THE ENVIRONMENT
Chandrapur is a mineral rich district with a dense forest spread over 41.5 % of total land. Based on available minerals and abundant water, industries have been set up within and in the surrounding of Chandrapur City. The details of industries are given in this report. Western Coal Ltd. operates 26 coal mines in Chandrapur city and the surrounding areas. The mined coal is supplied to Super Thermal Power station at Chandrapur having a generation capacity of 2340 MW capacity and also having coal linkage to Durgapur open cast coal mine. Coal is transported to STPS by rail and aerial ropeway. WCL also supplies coal to the other industries like paper mills, sponge iron plants, cement industries etc. All WCL mines generally produce coal of E/F grade. Due to heavy demand of coal, WCL has increased their stipping ratio and coal production. WCL has been given
Environmental Status and Action Plan for control of pollution at Chandrapur
Maharashtra Pollution Control Board
12
conditional environmental clearances by MoEF, Government of India. They have obtained consents to operate those mines for the enhanced coal production. Since the coal mined at WCL has high ash content, the industries are preferring washed coal and therefore 9 coal washeries are set up in this district to meet the cleaner coal demand. Currently only 8 coal washeries are in operation. Government of India has allotted two captive coal blocks to the industries for which public hearing were conducted by MPCB. In addition MPCB has also conducted public hearings for two new coal blocks and two cement plant and captive Lime stone mine.
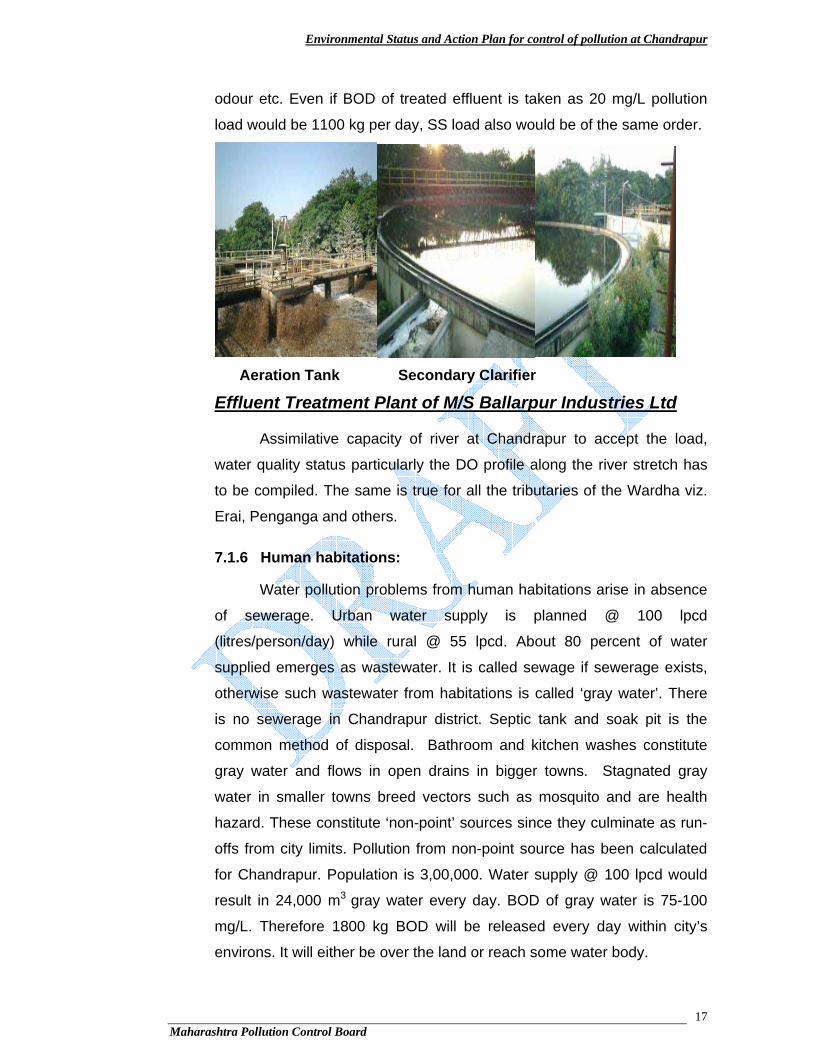
Ballarpur Paper mill is the major pulp & paper industry located at Ballarpur
city, which is about 20 km from Chandrapur City. The raw material of industry is bamboo and hard wood, which is available in the forest area. There are total 4 nos. Cement plants in Chandrapur District located about 70 to 80 kms from Chandrapur City. All Cement industries also carry out captive lime stone mining for raw material. Due to abundant availability of coal, 6 sponge iron plant have also come up in this district, which are within a distance of 10 to 20 kms from Chandrapur city. There are old pottery industries in the city and nearby areas but those are closed since there is no demand for their products. This ETP sludge generated by this industry contains fibers which can be used for paper board making. In Chandrapur district there 19 board mills which are using the ETP sludge of Ballarpur Paper Mills as raw material. There are about 25 plain rice mills and 06 are steam rice mills in the district. These plain rice mills, which are generally located in residential areas, generate rice husk which is responsible for air pollution and nuisance.
Urban environmental concerns in the district are air pollution due to coal
burning industries and auto-exhaust, Municipal solid waste, bio-medical waste, untreated domestic sewage and also the urban sanitation are other issues of concern. They contribute significantly to the pollution load.
Environmental Status and Action Plan for control of pollution at Chandrapur
Maharashtra Pollution Control Board
13
The category and number of industries located in Chandrapur district are
summarized in the table below (as on March 2006).
Sr. No.
Type of Industries No. of working industries
No. of closed industries
No. of proposed industries
Total
01 WCL Coal Mines 26 04 Private-05 WCL-02
37
02 Lime stone mine (SSI) (other than captive mine of cement industries)