Environmental Subsidies & Similar Transfers (ESST)- Preparation - Classification of COFOG data to CEPA, CReMA & NACE Report Final report Eurostat Grant 2017 Project and Grant report commissioned by the European Union Project of Directorate E, Eurostat, European Commission Marcel van Velzen Cor Graveland Statistics Netherlands
Transcript
Environmental Subsidies & Similar Transfers (ESST)- Preparation - Classification of COFOG data to CEPA, CReMA & NACE
Report
Final report Eurostat Grant 2017
Project and Grant report commissioned by the European Union
Project of Directorate E, Eurostat, European Commission
Marcel van Velzen
Cor Graveland
Statistics Netherlands
project number
remarks
303257
ENR-SLO-EOC
20 December 2017
The views expressed in this paper are those of the author(s) and do not necessarily reflect the
policies of Statistics Netherlands.
CBS Den Haag
Henri Faasdreef 312
2492 JP The Hague
P.O. Box 24500
2490 HA The Hague
+31 70 337 38 00
www.cbs.nl
Environmental Subsidies & Similar Transfers (ESST)- Preparation - Classification of COFOG data to CEPA, CReMA & NACE 3
Index
Acknowledgements 4
1. Introduction and objectives of the project 5
1.1 Objectives 6
1.2 Government finance statistics 7
1.3 Environmental statistics & Accounts 8
1.4 National and environmental Accounts 9
2. Data Sources and Applied Method for NACE Classification 11
2.1 Identification of the main subsidy scheme for direct Subsidies 11
2.2 Identification of main subsidy schemes for Tax Abatement 12
3. Other CEPA Subsidies by Central Government 14
3.1 Ministry of Infrastructure and the Environment (Ch. XII) 14
3.2 Ministry of Economic Affairs (Ch. XIII) 15
4. Results for the Questionnaire on Subsidies and Similar Transfers 18
4.1 Direct subsidies for CEPA 18
4.2 Direct subsidies for CReMA 19
4.3 Total Direct Subsidies for CEPA & CReMA 20
4.4 CEPA Tax Abatements 20
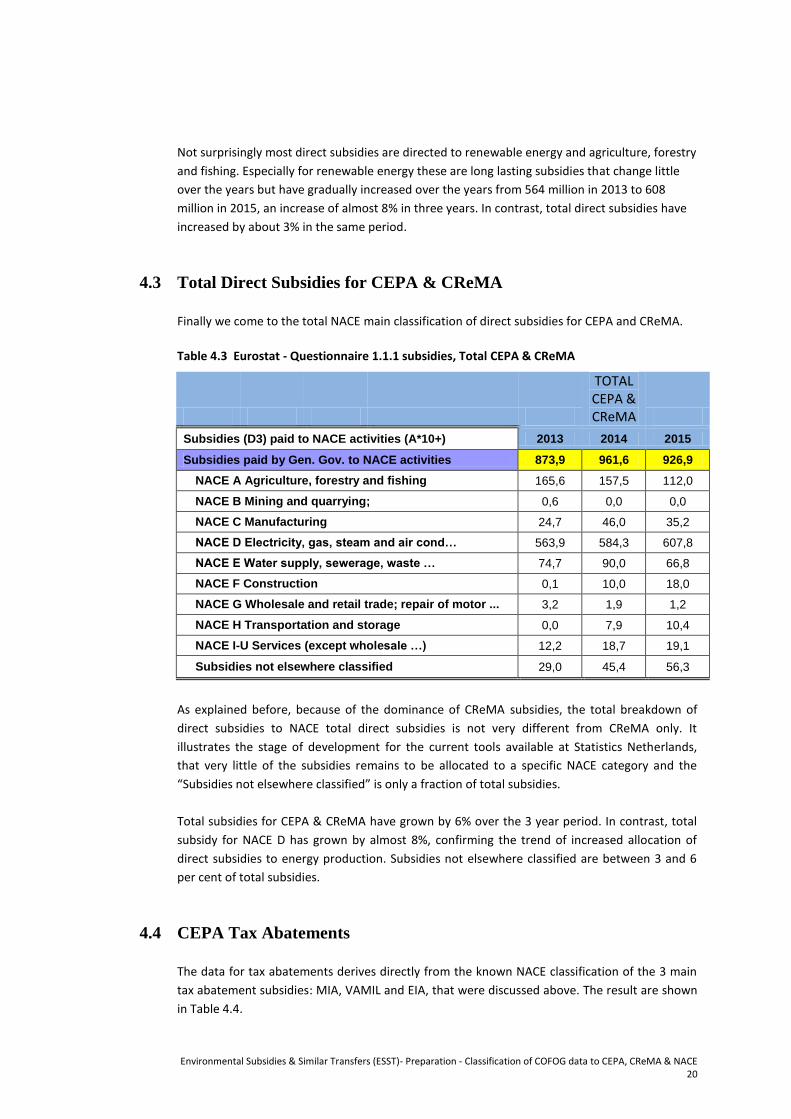
5. Conclusions 22
References 24
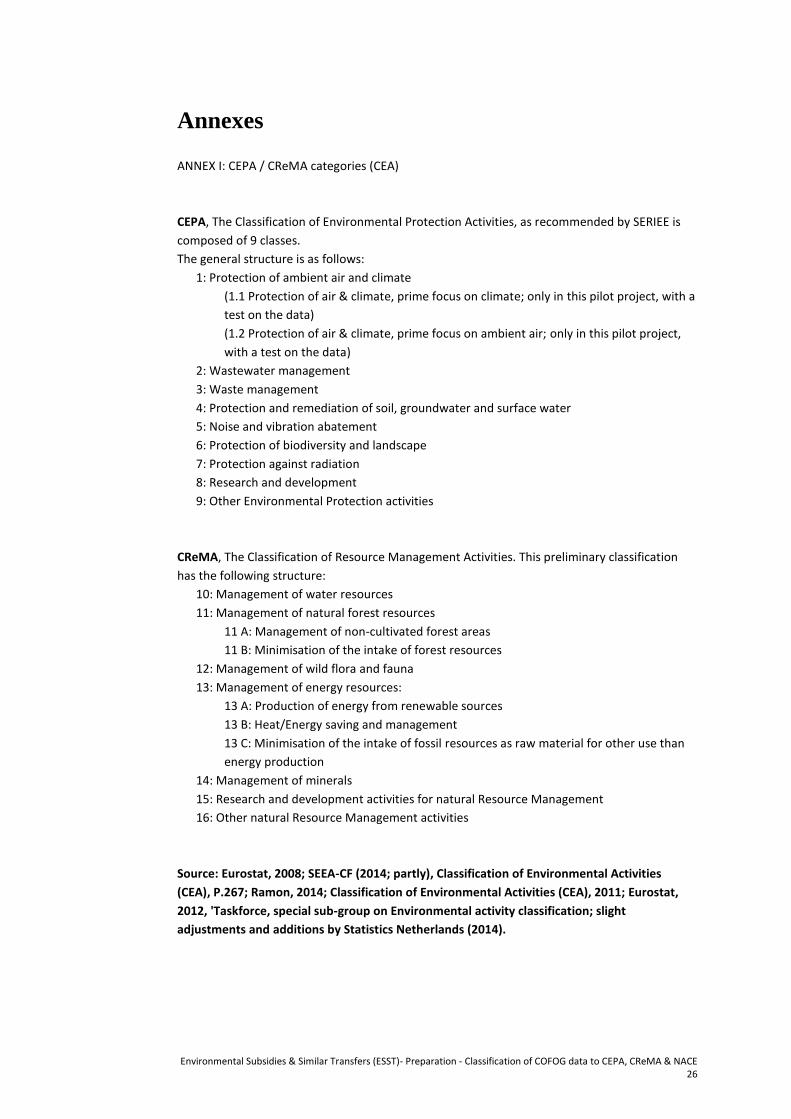
Annexes 26
Environmental Subsidies & Similar Transfers (ESST)- Preparation - Classification of COFOG data to CEPA, CReMA & NACE 4
Acknowledgements
First of all, we would like to thank Eurostat for providing the means to conduct this study.
Without the additional resources from the Eurostat Grant it would not have been possible to
develop the methodologies and to organise and compile data on environmental subsidies and
similar transfers and to organise the linkage with the data from Central Government in the
‘Rijksdatabase’ applying regular ESA (2010) classifications, and include the NACE classification.
We also would like to thank our colleagues at Statistics Netherlands, Judith van der Wenden for
analysing and compiling the Government Finance Statistical data, Khalid Eddraoussi for adding
environmental domains to subsidies, Sjoerd Schenau for the initial grant proposal.
Finally, we would like to thank our colleagues at Statistics Netherlands (CBS) who have reflected
on the project and report.
Environmental Subsidies & Similar Transfers (ESST)- Preparation - Classification of COFOG data to CEPA, CReMA & NACE 5
1. Introduction and objectives of the project
Environmental subsidies are important economic instruments for achieving national
environmental policy objectives and for compliance with international agreements. Subsidies,
including tax exemptions, receive a great deal of attention in the political arena. Environmental
subsidies are used to promote a wide variety of activities that aim to protect the environment,
use resources more efficiently and safeguard our natural capital by enhancing its management.
It is therefore important to gain a better understanding about their size, beneficiaries, and
development over time.
Eurostat has been working on the subject of subsidies and environmental transfers for a
number of years. The year 2015 saw the publication of the methodological guidelines on
Environmental Subsidies and Similar Transfers and the launch of a pilot data collection, in the
form of an Excel Questionnaire, following the work of the Task Force on environmental
transfers. The voluntary, annual data collection on Environmental subsidies and Similar
Transfers will continue in the coming years. Environmental subsidies is one of the areas that will
be the focus for future development for Eurostat.
Statistics Netherlands has worked in the past on environmental transfers and subsidies on an ad
hoc basis. For the compilation of the EPEA questionnaire total environmental transfers for CEPA
& CReMA categories have been compiled (Statistics Netherlands, 2015) for Central
Government. However, no systematic compilation of the new Eurostat questionnaire on
environmental transfers has yet been attempted.
The United Nations System of Environmental-Economic Accounting (SEEA CF 2012) defines an
environmental subsidy or similar transfer as being ‘a transfer that is intended to support
activities which protect the environment (CEPA) or reduce the use and extraction of natural
resources (CReMA).
The SEEA Central Framework (UN et al 2012) as well as the EU Legal Base on Environmental
Accounting requires classifying government expenditures according to Environmental Activities.
For that purpose the Classification of Environmental Activities (CEA) used in SEEA-CF (2014) can
be applied. This classification is based upon:
a) CEPA for the Classification of Environmental Protection Activities and Expenditure
(United Nations, 2000), for those activities whose primary purpose is the prevention,
reduction and elimination of pollution as well as any other degradation of the
environment, including measures taken in order to restore the environment after it has
been degraded due to the pressures from human activities
b) CReMA for Resource management (RM), this includes all actions and activities that are
aimed at preserving and maintaining the stock of natural resources and hence
safeguarding against depletion (SEEA-CF, 2012) 1.
1 This includes actions and activities aimed at reducing the withdrawals of natural resources (recovery, reuse, recycling,
substitution of natural resources) as well as restoring natural resource stocks. To be included under resource
management, actions and activities or parts thereof must satisfy the primary-purpose criterion, i.e., that resource
management is their primary objective. Those activities whose primary purpose is environmental protection are
therefore excluded.
Environmental Subsidies & Similar Transfers (ESST)- Preparation - Classification of COFOG data to CEPA, CReMA & NACE 6
Classification of transfers following the CEA, or either CEPA and eventually CreMA
classifications, enables compiling accounts for Environmental Subsidies and related transfers.
1.1 Objectives
The prime objective of a previous project and Eurostat Grant [EPEA: Classification of COFOG
based source data to CEPA & CReMA] was to add an additional CEPA & CreMA classification to
the transactions from Central Government. This goal was successfully achieved by involving
specialists of different statistical backgrounds: Environmental Statistics, Government Statistics,
and Environmental Accounts. Such an additional characteristic would facilitate compiling EPEA /
ReMEA and Environmental Transfers directly. This resulted in data fully consistent with the
National Accounts and allow for a breakdown by type of transaction and the receiving
institutional sector following SNA 2008 / ESA 2010 (Regulation (EU) No 549/2013, ‘ESA2010).
Additionally the project proofed to be able to assign all budget items in the existing database
for Central Government (‘Rijksdatabase’) to the CEPA & CReMA classification. While the focus
was on the reporting year 2013, the resulting methodology has further been implemented for
subsequent years and the process been put in production as corresponding data has been
compiled and analysed for the years 2014 and 2015. In the current project we lean heavily on
the previous pilot project, where we have classified expenditures from Central Government
according to the CEA classification using the Central Government database, the ‘Rijksdatabase’.
The overall aim of the new grant project is to add an industry breakdown following NACE, but
including households, for the Eurostat Environmental Subsidies and Similar Transfers (ESST)
data collection as required by the corresponding questionnaire. As part of the questionnaire
compilation process we checked with prefills on CEPA in the questionnaire received.
The Eurostat questionnaire will be populated with NACE data as far as possible for both CEPA
and CReMA categories. The objective is to compile data for the three most recent years for
which environmental domain data is available: 2013, 2014 and 2015. 2013 is and was chosen
because for that year a new setup and reporting was made available by the (central)
government, allowing to compile subsequent years in an straightforward manner. 2012 data is
less suited to this newly adopted format and requires more effort. The focus will be on transfers
provided by the Central Government. Indirect or Implicit subsidies (tax abatements) play an
import role in the Netherlands and we will inventory those and provide a NACE breakdown also
for this specific category.
As a separate action for the most important direct (explicit) subsidy schemes the research is
supposed to collect the relevant underlying data, preferably at the micro-level (individual
beneficiaries).
The point of departure will be the total environmental transfers as recorded in the
Environmental Protection Expenditure Accounts (EPEA) questionnaire, for large part derived
from the COFOG data. These totals will be linked to the most important subsidy schemes (SDE,
MIA/VAMIL, EIA). Next, for these schemes, it will be shown that data sources are available to
allocate the direct and indirect subsidy data to industries classified according to NACE. A few
remaining direct subsidies, belonging to the CEPA environmental domain, will be linked to a
NACE category by directly analysing the annual reports of the corresponding Ministry. Possibly,
Environmental Subsidies & Similar Transfers (ESST)- Preparation - Classification of COFOG data to CEPA, CReMA & NACE 7
it will be found that important schemes are missing from the EPE data, and these will then also
be corrected in the EPEA questionnaire.
In addition, the results of this project will be analysed and it will we will evaluate whether
annual production of such data is possible and the resources needed.
Description of contributing statistical departments at Statistics Netherlands
This Grant project, in the spirit of previous Eurostat related projects, intents to offer enhanced
synergy between several statistics departments. Accordingly, the project was jointly executed
by the regular EPEA compilers, the Environmental Statistics team (final EPEA, including total
subsidies), the Environmental Accounts team (compiling environmental subsidy data for the
voluntary Eurostat Questionnaire on subsidies and similar transfers) and our colleagues the
Government Finance Statistics department. They provide the structure and data of the
“Rijksdatabase” which function as the basis of our further classification to NACE categories.
1.2 Government finance statistics
1.2.1 Central Government Expenditure Statistics
In the Netherlands, S13 (sector government) constitutes a variety of subsectors such as Central
Government, Municipalities, Provinces, Water Boards, Universities, Non-profit institutions
serving households (NPISH), etc. Basic data for each of these sectors comes from separate data
sources such as ministries’ business accounting systems and is organized in different databases.
For instance data for Central Government (Rijk) is stored in the so-called ‘Rijksdatabase’ (RDB,
Central government database) which is based upon an analysis of budget lines per department,
whereas data from municipalities is stored in the so-called ‘KREDO’ database which is using a
classification of ‘IV3 functions’ used by municipalities.
Statistics Netherlands receives very detailed information from the ministries and funds. This is
the result of close and continuing corporation and established communication with the
separate ministries. This data often is a dump of the ministries’ accounting (bookkeeping)
system, by which already a number of specific categorisations and classifications are made,
although not consistent between the ministries and not necessarily National Accounts (NA)
compliant. This information is put in an Access database. In this database, the specific codes for
each particular ministry or fund are translated to both ESR transactions, following ESR2010
classification, and COFOG functions. Every ministry uses their own dedicated financial system,
so there is an Access work-database for each ministry or fund. The translated and aggregated
data from each ministries and funds is entered into a central Access database, the
Rijksdatabase. The information from the connected agencies, based on their annual reports, is
also entered in the (New) Rijksdatabase. After this, all the data per budgetline or
budgetchapter (Ministry) in the (New) Rijksdatabase is checked with the annual report of the
organisation, as the two have to match. There is one statistical analyst for each ministry or fund,
enhancing dedicated knowledge of the ministry for which the data is processed as the analyst is
familiar with the details. The database functions as the clear starting point for the proposed
analyses in this project as it contains the already ESA-2010 complying data.
Environmental Subsidies & Similar Transfers (ESST)- Preparation - Classification of COFOG data to CEPA, CReMA & NACE 8
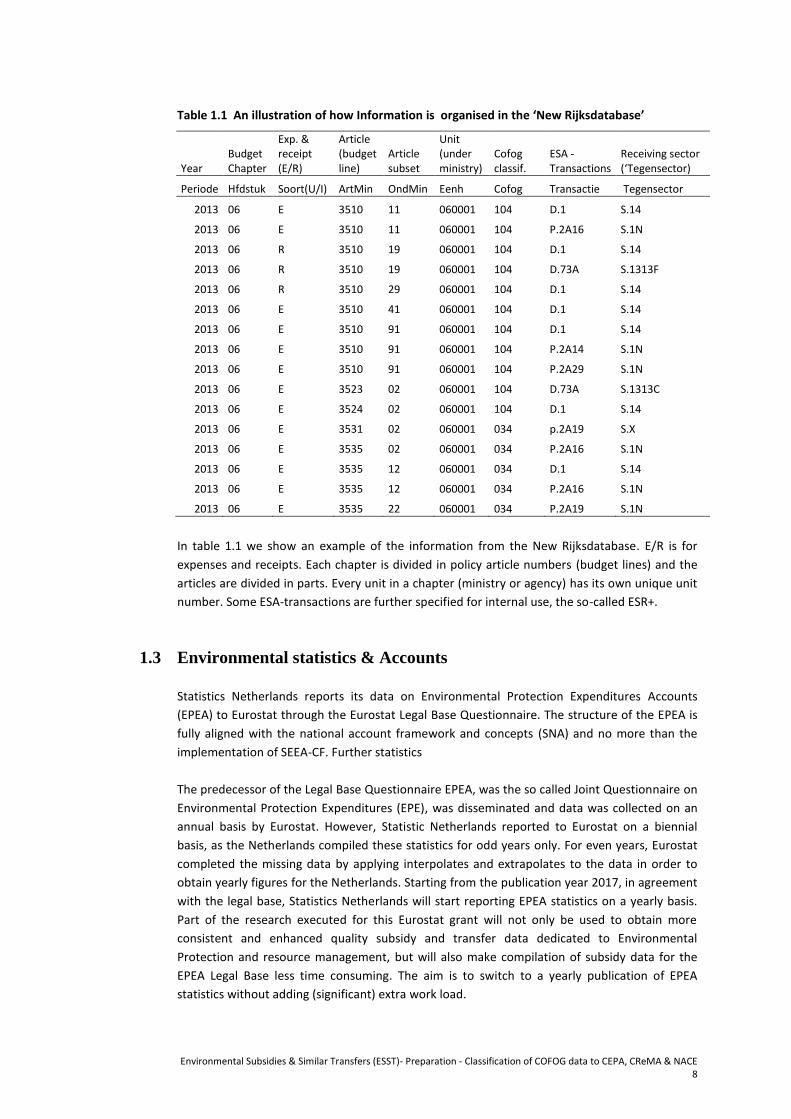
Table 1.1 An illustration of how Information is organised in the ‘New Rijksdatabase’
Year Budget Chapter
Exp. & receipt (E/R)
Article (budget line)
Article subset
Unit (under ministry)
Cofog classif.
ESA - Transactions
Receiving sector (‘Tegensector)
Periode Hfdstuk Soort(U/I) ArtMin OndMin Eenh Cofog Transactie Tegensector
2013 06 E 3510 11 060001 104 D.1 S.14
2013 06 E 3510 11 060001 104 P.2A16 S.1N
2013 06 R 3510 19 060001 104 D.1 S.14
2013 06 R 3510 19 060001 104 D.73A S.1313F
2013 06 R 3510 29 060001 104 D.1 S.14
2013 06 E 3510 41 060001 104 D.1 S.14
2013 06 E 3510 91 060001 104 D.1 S.14
2013 06 E 3510 91 060001 104 P.2A14 S.1N
2013 06 E 3510 91 060001 104 P.2A29 S.1N
2013 06 E 3523 02 060001 104 D.73A S.1313C
2013 06 E 3524 02 060001 104 D.1 S.14
2013 06 E 3531 02 060001 034 p.2A19 S.X
2013 06 E 3535 02 060001 034 P.2A16 S.1N
2013 06 E 3535 12 060001 034 D.1 S.14
2013 06 E 3535 12 060001 034 P.2A16 S.1N
2013 06 E 3535 22 060001 034 P.2A19 S.1N
In table 1.1 we show an example of the information from the New Rijksdatabase. E/R is for
expenses and receipts. Each chapter is divided in policy article numbers (budget lines) and the
articles are divided in parts. Every unit in a chapter (ministry or agency) has its own unique unit
number. Some ESA-transactions are further specified for internal use, the so-called ESR+.
1.3 Environmental statistics & Accounts
Statistics Netherlands reports its data on Environmental Protection Expenditures Accounts
(EPEA) to Eurostat through the Eurostat Legal Base Questionnaire. The structure of the EPEA is
fully aligned with the national account framework and concepts (SNA) and no more than the
implementation of SEEA-CF. Further statistics
The predecessor of the Legal Base Questionnaire EPEA, was the so called Joint Questionnaire on
Environmental Protection Expenditures (EPE), was disseminated and data was collected on an
annual basis by Eurostat. However, Statistic Netherlands reported to Eurostat on a biennial
basis, as the Netherlands compiled these statistics for odd years only. For even years, Eurostat
completed the missing data by applying interpolates and extrapolates to the data in order to
obtain yearly figures for the Netherlands. Starting from the publication year 2017, in agreement
with the legal base, Statistics Netherlands will start reporting EPEA statistics on a yearly basis.
Part of the research executed for this Eurostat grant will not only be used to obtain more
consistent and enhanced quality subsidy and transfer data dedicated to Environmental
Protection and resource management, but will also make compilation of subsidy data for the
EPEA Legal Base less time consuming. The aim is to switch to a yearly publication of EPEA
statistics without adding (significant) extra work load.
Environmental Subsidies & Similar Transfers (ESST)- Preparation - Classification of COFOG data to CEPA, CReMA & NACE 9
The Legal Base on EPEA, comprises the following sectors: public sector, business sector total,
agriculture, forestry and fishing, mining and quarrying, total manufacturing. The subject of this
Eurostat Grant is allocation of subsidies from Central Government to the private sector. Central
Government obviously belongs to the public sector. In the Netherland the public sector
comprises Central Government, Provinces, Municipalities and Water Boards. Government is
reported integrally in the Legal Base Questionnaire but both centralised and decentralised
governments are published by Statistics Netherlands separately.
Statistics Netherland has a lasting practice in compiling EPE(A) statistics in the Netherlands, this
as the monetary part of the Structural Business Survey (SBS) with in particular EPE for
businesses, mainly for ancillary activities, but also for the economy as a whole since 1979. In
context of compiling government expenditures on EPEA, data analysis was mainly based on the
official publicly available publications from the governmental bodies like the annual reports of
the individual ministries and some additional sources. As a result of substantially improved data
obtained by the department on Government Statistics within Statistic Netherlands and
alignment with their compilation activity and output (to facilitate consistency), a more solid and
detailed basis is formed to serve not only compilation of EPEA statistics in future, but also and in
particular the Environmental Subsidies and Similar Transfers (ESST) compilation and data
collection. This includes the corresponding more detailed descriptions of economic activities.
The part pertaining to subsidies and transfers in this improved data is used extensively in this
study.
The transformation tables, starting from the ESA coded transactions data including COFOG, that
distinguishes between environmental (EP and RM) from non-environmental activities
developed during the last year, will enable and facilitate the annual compilation of the CEPA
classification for the EPEA Questionnaire and the CEPA and CReMA Environmental Subsidies and
Similar Transfers (ESST) questionnaire data collections and form the basis of further
classification to NACE as attempted in this report. However, NACE classifications are outside the
scope of the Legal Base Questionnaire but are compiled for voluntary data-collection and
publication of the Questionnaire on Environmental Subsidies and Similar Transfers (ESST).
However, aggregates of both Questionnaires EPEA and ESST must be in full agreement and in
this sense the two Questionnaires are linked together and consistent on purpose to further
develop to the integrated framework.
1.4 National and environmental Accounts
Statistics Netherlands (CBS) compiles environmental accounts modules for many years, starting
from the nineteen nineties. It started from an illustrative NAMEA (National accounting matrix
including environmental accounts), that connects environmental data like emissions and its
protection efforts by instruments (taxes, subsidies, etc.) and data on Resources (Assets), use
and management to National Accounts (NA) data. The NSI gradually extended the system of
environmental accounts both physical and monetary accounts.
Environmental Accounts in the statistical office is organised as a ‘module’ or ‘Satellite Account’
to the NA with several other ‘modules’ like growth accounts, labour accounts, regional
accounts, all organised within the National Accounts department. This enables cooperation on,
mutual benefit and use of the detailed data in National Accounts (NA) following the SNA2008
and the ESA2010 concepts and formats.
Environmental Subsidies & Similar Transfers (ESST)- Preparation - Classification of COFOG data to CEPA, CReMA & NACE 10
Accounts were developed for air emissions (AEA), water emissions, waste, and energy (PEFA),
water (WA) and material flows (MFA), as for Environmental taxes by economic activity (ETEA),
the environmental goods and services sector (EGSS), subsidies (ESST), and CO2-emission
permits.
The Dutch environmental accounts are compiled following the general concepts, definitions and
classifications as described in SEEA-CF (2014) and the SNA 2008. More specific information on
applied methodologies can be found on Statistics Netherlands’ website (www.cbs.nl)3. Specific
methodological reports are available on some subjects. Data of the several Dutch
environmental accounts modules is stored in the electronic online statistical database Statline
(under topic: Macroeconomics – environmental accounts, or search for ‘environmental
accounts’).
The EU-legislations in the area of environmental accounts (and naturally also national
accounts), with Regulation (EU) 691/2011 and the amended Regulation (EU) 538/2014 on the
European environmental economic accounts form, together with statistical standard SEEA
Central Framework (SEEA-CF) and extensions, the basis for work on the various environmental
accounts modules at Statistics Netherlands. Three out of the six modules required under the
two regulations deal with monetary environmental accounts including Environmental Taxes,
EPEA and EGSS. The Environmental Taxes by economic activity (ETEA) data and EGSS data are
delivered for several years to Eurostat. EPEA data are developed and compiled via grants to
Eurostat and some test questionnaires has been completed on request of Eurostat.
In recent years, from the Environmental Accounts Group at Statistics Netherlands, effort has
been dedicated to compilation of EPEA formats and tables (See: Statistics Netherlands (CBS),
2012) as well as to Environmentally motivated subsidies and similar transfers via Eurostat grants
(See: Statistics Netherlands (CBS), 2011). The Environmental Accounts Group participated in
Eurostat Taskforces on environmental Accounts, as to the Taskforce on environmental
transfers, to the Taskforce on RUMEA & ReMEA and to the (former) Taskforces on
environmental subsidies and taxes. The group also participates in the working group meetings
on ‘Environmental Expenditure Statistics’. Results that relate to this conceptual work as for
Environmentally motivated subsidies and similar transfers are published in the annual
Environmental Accounts publications4. An attempt has been made to start allocating subsidies
to receiving industries and households (beneficiaries).
For compilation of the different environmental modules use is made of several basic (source)
statistics, as from Environmental statistics (see also §2.2), from energy statistics, but also from
government finance statistics (§2.1). Moreover, use is made among others from the Statistical
Business Register (SBR), and from Production Statistics (PS), foreign trade statistics, labour
statistics. In this project, data is used from government finance statistics that directly feed into
the sector accounts of the NA. Furthermore insights obtained during several of the EPEA and
subsidy compilation exercises are used.
3 More information can be found under Theme macroeconomics or in the Dutch part of the website, where more
information can be found on the Environmental Accounts (In Dutch: Milieurekeningen) or either in the annual
publication Environmental Accounts of the Netherlands (2013). 4 See for example: CBS – ‘Environmental accounts of the Netherlands 2012’, Ch. 6.2 Environmental subsidies and
Transfers’, or: CBS – ‘Environmental accounts of the Netherlands 2011’, Ch.‘7.2 Environmental subsidies and transfers’.
Environmental Subsidies & Similar Transfers (ESST)- Preparation - Classification of COFOG data to CEPA, CReMA & NACE 11
2. Data Sources and Applied Method for NACE
Classification
In the Netherlands, all subsidies for industries are approved, assigned and monitored by the Netherlands Enterprise Agency RVO (Rijksdienst voor Ondernemend Nederland). RVO is an executive branch of the ministry of Economic Affairs that came into existence in January 2014 as the result of a fusion of two older executive branches (Dienst Regelingen, Agentschap NL). The main aim for RVO is to stimulate entrepreneurs to invest and developing in renewable and innovative technologies, applications, processes and research. The RVO assigns subsidies to enterprises in a range of Industries, NPISH-es and to households on request for both the Dutch Ministries and the European Union. The aim is to improve opportunities for entrepreneurs and strengthen their position. The Agency works in the Netherlands and abroad with governments, knowledge centres, international organisations and countless other partners. Fortunately for this study, enterprises, entrepreneurs, NPISH and households that apply for subsidies or tax abatement arrangements with the government through the agency RVO, are already classified according to the NACE Rev.2, called SBI2008 (Standaard Bedrijfs Indeling) in the Netherlands. Actually and significantly, the part missing for final classification is the environmental domain, not the NACE classification. However, for two of the most important subsidy schemes / tax abatements arrangements, SDE (Subsidiy for Renewable Energy) and EIA (Energy Investment Deduction to income tax; to be discussed below), only two CReMa environmental domains apply: renewable energy and energy savings (CReMA 13). For the other major tax abatement schemes (MIA/VAMIL) all the CEPA environmental domains apply. Because a description of each relevant subsidy application for each subsidy scheme that will end up as a subsidy beneficiary, and relevant data including the assigned NACE categories are sent to Statistic Netherlands, environmental domains (CEPA & CReMA categories) can usually be readily assigned and added to the database. Sometimes, some additional research is required. This is performed on a yearly basis at Statistic Netherlands as these data are also needed for the compilation of the statistics in context SBS regulation of environmental expenditures for industry.
2.1 Identification of the main subsidy scheme for direct Subsidies The major direct subsidy scheme for the Industries in the Netherlands is called the SDE(+) (Stimulering Duurzame Energieproductie; Promotion of Sustainable Energy Production) which losely translates into: stimulation of renewable (durable) energy production. Sustainable (durable) energy is energy generated from inexhaustible (renewable) resources and for that reason also called renewable energy and we will use it under this term here. The SDE is a so called exploitation subsidy, which means producers receive compensation for additional costs involved the renewable energy they produce. Because the cost of production of renewable energy is often higher than getting energy such as electricity and heat from fossil fuels, the production of renewable energy is often less profitable. The SDE compensates producers (including households) for the difference in cost price between generated renewable energy and the market value of the generated energy. The subsidy is assigned for an extended period of time of eight years or more, depending on the technology involved. The amount of subsidy provided depends on the amount of energy produced and the technology applied determining the cost to produce (conversion from energy flows from nature) the energy. The main energy technology categories open for applications are:
renewable electricity production
Environmental Subsidies & Similar Transfers (ESST)- Preparation - Classification of COFOG data to CEPA, CReMA & NACE 12
renewable (green) gas production
renewable heat production (or a combination of the above like in combined heat and power production CHP). These applications for subsidy are open to industries, NPISH-es (NGOs) and partially for households. The subsidies are further subdivided into renewable energy technologies such as: biomass, geothermal, hydro, wind and solar energy. There is a separate budget and application procedure for wind energy at sea (off-shore).
2.2 Identification of main subsidy schemes for Tax Abatement
Starting point of environmental transactions are environmental (EP/RM) activities, that
are described in environmental (EP/RM) activity accounts (EPEA, ETEA, ESST and EGSS)
and statistics (EPE).
Indirect subsidies consist of a few large programs that are mostly covered within the regular EPEA program, in the test compilation of the Environmental Subsidies and Similar Transfer (ETEA) questionnaire under ‘tax abatements’ and in this study. Obtaining information is therefore relatively easy. For some subsidy programs a breakdown by NACE already exists. Here we briefly explain the workings of the main programs.
VAMIL (vrije of willekeurige afschrijving milieu-investeringen): Scheme with freedom of choice for the rate of depreciation of environmental investments, with liquidity and interest benefit advantage. The ‘Vamil scheme’ normally results in accelerated depreciation of environmentally-friendly equipment. The VAMIL is not supposed to provide net tax reduction over the entire life of an investment. This is particularly the case for companies that pay the flat corporate tax, since there will not be net deduction from taxable profit. VAMIL thus for many companies just provide (limited) cash flow and interest benefit, which is obviously economically advantageous but the adverse impact on government finance is less obvious. The ‘subsidy effect’ of VAMIL in terms of (calculated) income lost by government, may in some years even be negative. This can be the case if related investment in the whole economy shows a significant declining level.
MIA (milieu investeringsaftrek): MIA is a tax relief scheme for entrepreneurs willing to invest in environmentally-friendly equipment. This environmental investment deduction scheme has up to 40% deduction from taxable profit. MIA and Vamil are (off-budget) subsidies available to entrepreneurs willing to invest in environmentally-friendly equipment.
EIA: Energy Investment Deduction, with a tax deduction of up to 40% deduction from taxable profit. It is a tax relief scheme for entrepreneurs willing to invest in energy-efficient equipment or renewable energy technology. In contrast to VAMIL, EIA and MIA actually do provide net tax reduction over the lifetime of the related investment. Due to the different effects of MIA and EIA compared to VAMIL, it is preferable to treat them differently and separately. The finally calculated benefit of these implicit (off-budget) subsidies will be determined by the parameters chosen in the calculation, for example by the
Environmental Subsidies & Similar Transfers (ESST)- Preparation - Classification of COFOG data to CEPA, CReMA & NACE 13
marginal tax rates used. Therefore, ideally income tax data from the tax authorities should be obtained. However, as we were not able to obtain detailed data, we have simply used available EPE data.
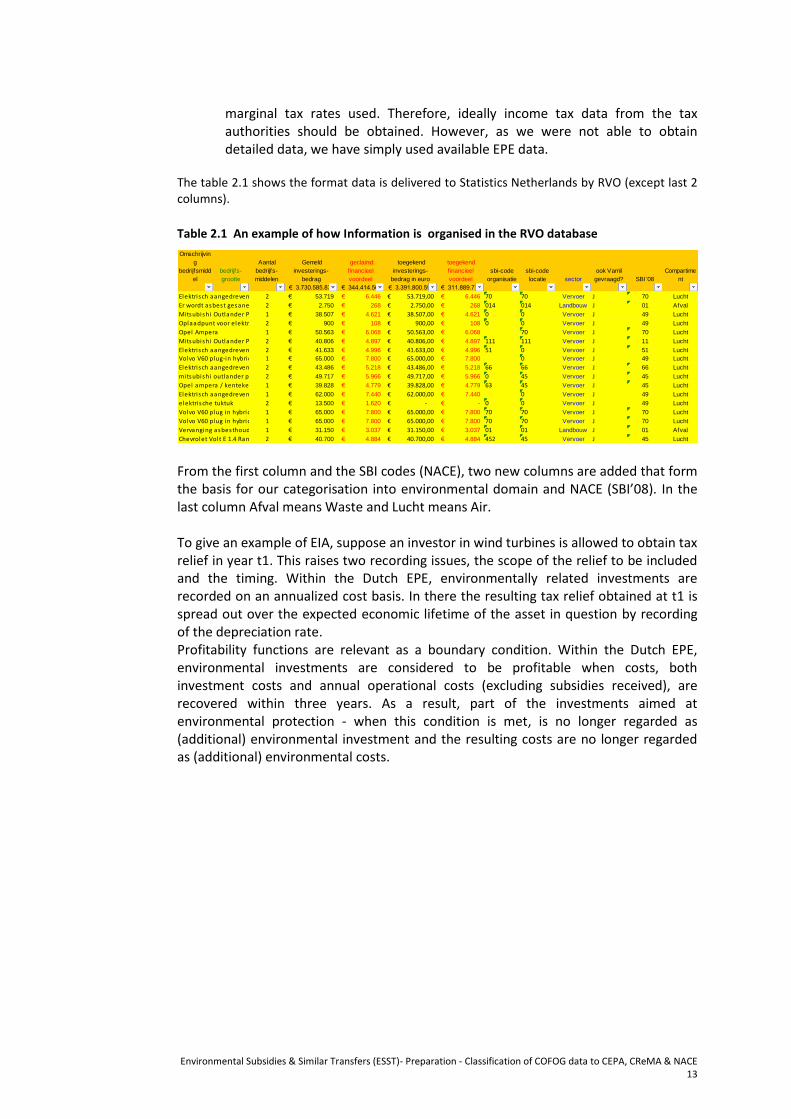
The table 2.1 shows the format data is delivered to Statistics Netherlands by RVO (except last 2 columns).
Table 2.1 An example of how Information is organised in the RVO database
From the first column and the SBI codes (NACE), two new columns are added that form the basis for our categorisation into environmental domain and NACE (SBI’08). In the last column Afval means Waste and Lucht means Air. To give an example of EIA, suppose an investor in wind turbines is allowed to obtain tax relief in year t1. This raises two recording issues, the scope of the relief to be included and the timing. Within the Dutch EPE, environmentally related investments are recorded on an annualized cost basis. In there the resulting tax relief obtained at t1 is spread out over the expected economic lifetime of the asset in question by recording of the depreciation rate. Profitability functions are relevant as a boundary condition. Within the Dutch EPE, environmental investments are considered to be profitable when costs, both investment costs and annual operational costs (excluding subsidies received), are recovered within three years. As a result, part of the investments aimed at environmental protection - when this condition is met, is no longer regarded as (additional) environmental investment and the resulting costs are no longer regarded as (additional) environmental costs.
Volvo V60 plug in hybrid 1 65.000€ 7.800€ 65.000,00€ 7.800€ 70 70 Vervoer J 70 Lucht
Volvo V60 plug in hybrid 1 65.000€ 7.800€ 65.000,00€ 7.800€ 70 70 Vervoer J 70 Lucht
Vervanging asbesthoudende daken, dakgoten of gevels (aanpass ing van bestaande voorziening)1 31.150€ 3.037€ 31.150,00€ 3.037€ 01 01 Landbouw J 01 Afval
Chevrolet Volt E 1.4 Range-extender LTZ2 40.700€ 4.884€ 40.700,00€ 4.884€ 452 45 Vervoer J 45 Lucht
Environmental Subsidies & Similar Transfers (ESST)- Preparation - Classification of COFOG data to CEPA, CReMA & NACE 14
3. Other CEPA Subsidies by Central Government
In this chapter the analysis of Central Government support to Environmental Protection (EP)
with the detailed information of the relevant ministries are described. Because not all direct
subsidies are covered by the main subsidies described in the previous chapters, extra research is
sometimes required to allocate the correct environmental domain and NACE category to a
direct subsidy scheme. Some examples will be given.
However, due to an on-going shift of subsidies for the CEPA domain to the CReMA domain, the
total budget for CEPA direct subsidies is only a fraction of CReMA allocations.
3.1 Ministry of Infrastructure and the Environment (Ch. XII)
3.1.1 The ministry
As the name Ministry of Infrastructure and the Environment indicates, environmental activities
and support comprise a large share of total activities and support. The Ministry of Infrastructure
and Environment was formed in a fusion between two independent ministries namely the
former Ministry of Transport, Public Works and Water Management and the former Ministry of
Housing, Spatial Planning and Environment in 2010 and so is still quite young. Recently the
Minsitries are again restructured a bit leaving the Ministry with a new name: ‘Ministry of
Infrastructure and Water Management’, where parts (such as climate change) are moved to
Ministry of Economic Affairs.
This Ministry of Infrastructure and the Environment was the first to be analysed and also in
great detail. For the majority of COFOG classifications pertaining to environmental activities,
domains could readily be determined and there were no major problems reported. Even so, still
25% of activities ended up into the domain “other environmental activities”, mostly because it
was not possible to find more specific information even in the more detailed sources that have
come available in recent years. The most important domains for this ministry are Air, Water and
Soil. Biodiversity and Landscape is the least important domain for this ministry. Contrary to
what might be expected, most activities related to Renewables Energy are not part of this
ministry but are classified under other ministries, mainly under the Ministry of Economic Affairs.
3.1.2 NACE classification examples
Some direct subsidies are, of course, not part of tax abatement and do not belong to the SDE as
well. Therefore these subsidies have to be analysed further by consulting the annual reports of
the Ministry. Table 3.1 gives an example for the year 2014 (the “middle” year for 2013, 2014,
and 2015).
Environmental Subsidies & Similar Transfers (ESST)- Preparation - Classification of COFOG data to CEPA, CReMA & NACE 15
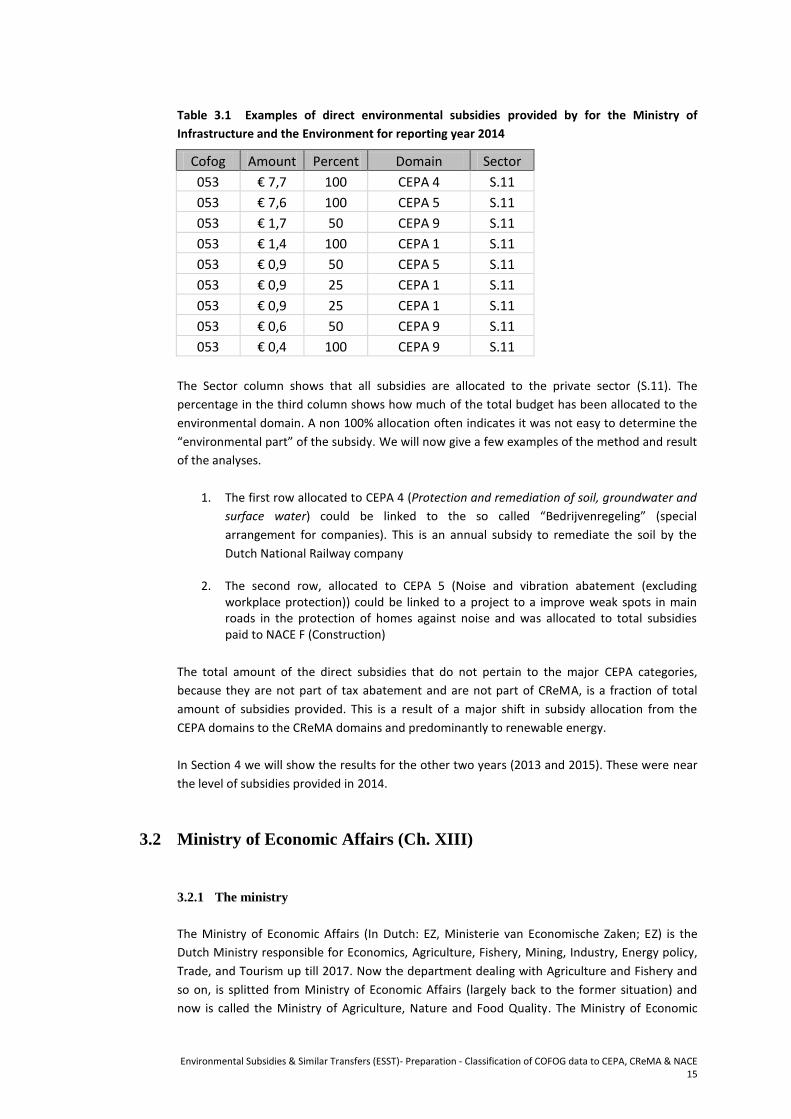
Table 3.1 Examples of direct environmental subsidies provided by for the Ministry of
Infrastructure and the Environment for reporting year 2014
Cofog Amount Percent Domain Sector
053 € 7,7 100 CEPA 4 S.11
053 € 7,6 100 CEPA 5 S.11
053 € 1,7 50 CEPA 9 S.11
053 € 1,4 100 CEPA 1 S.11
053 € 0,9 50 CEPA 5 S.11
053 € 0,9 25 CEPA 1 S.11
053 € 0,9 25 CEPA 1 S.11
053 € 0,6 50 CEPA 9 S.11
053 € 0,4 100 CEPA 9 S.11
The Sector column shows that all subsidies are allocated to the private sector (S.11). The
percentage in the third column shows how much of the total budget has been allocated to the
environmental domain. A non 100% allocation often indicates it was not easy to determine the
“environmental part” of the subsidy. We will now give a few examples of the method and result
of the analyses.
1. The first row allocated to CEPA 4 (Protection and remediation of soil, groundwater and
surface water) could be linked to the so called “Bedrijvenregeling” (special
arrangement for companies). This is an annual subsidy to remediate the soil by the
Dutch National Railway company
2. The second row, allocated to CEPA 5 (Noise and vibration abatement (excluding workplace protection)) could be linked to a project to a improve weak spots in main roads in the protection of homes against noise and was allocated to total subsidies paid to NACE F (Construction)
The total amount of the direct subsidies that do not pertain to the major CEPA categories,
because they are not part of tax abatement and are not part of CReMA, is a fraction of total
amount of subsidies provided. This is a result of a major shift in subsidy allocation from the
CEPA domains to the CReMA domains and predominantly to renewable energy.
In Section 4 we will show the results for the other two years (2013 and 2015). These were near
the level of subsidies provided in 2014.
3.2 Ministry of Economic Affairs (Ch. XIII)
3.2.1 The ministry
The Ministry of Economic Affairs (In Dutch: EZ, Ministerie van Economische Zaken; EZ) is the
Dutch Ministry responsible for Economics, Agriculture, Fishery, Mining, Industry, Energy policy,
Trade, and Tourism up till 2017. Now the department dealing with Agriculture and Fishery and
so on, is splitted from Ministry of Economic Affairs (largely back to the former situation) and
now is called the Ministry of Agriculture, Nature and Food Quality. The Ministry of Economic
Environmental Subsidies & Similar Transfers (ESST)- Preparation - Classification of COFOG data to CEPA, CReMA & NACE 16
Affairs originally started over a century ago as the Ministry of Agriculture, Industry and
Commerce and have had several organisational and name changes before it finally became the
Ministry of Economic Affairs. In 2010 the Ministry of Agriculture, Nature and Food Quality was
merged with the ministry of economic affairs at that stage into the Ministry of Economic Affairs,
Agriculture and Innovation, Since 2012, again it is called the Ministry of Economic Affairs.
Important issues the ministry of Economic Affairs is been dealing with are: Agriculture and
livestock, Energy policy, Entrepreneurship and innovation but also Nature and biodiversity and
other sustainability issues. The ministry of Economic Affairs is annotated as Chapter XIII.
The standardised compilation steps as described in the previous sections are largely similarly
applied. This procedure comprises starting from the ‘New Rijksdatabase’, pre-select on records
with ‘potential to EP/RM, use detailed information to further score on YES/NO on the EP/RM
and for further classification into CEPA/CReMA. The different sources, like the budget lines with
‘14 Efficient and Sustainable Energy, 16 Competitive, Sustainable, Safe agricultural, fisheries and
food chains, 17 Green Education High Quality and 18 Nature and Region, and connected texts,
as well as the OCM Ministries’ Overview on taks related to EP and RM. in different tasks,
provide ground for classification to EP/RM and further into CEPA/CReMA. For some further
classification, mainly towards detailed CEPA, CReMA also use is made of underlying micro
information obtained from the ministries’ accounting files. This provide additional information,
but not automatically add to improve the CEPA/CReMA classification further.
3.2.2 NACE classification examples
As for the Ministry of Infrastructure and the Environment, all subsidies are directed to the
private sector (S.11).
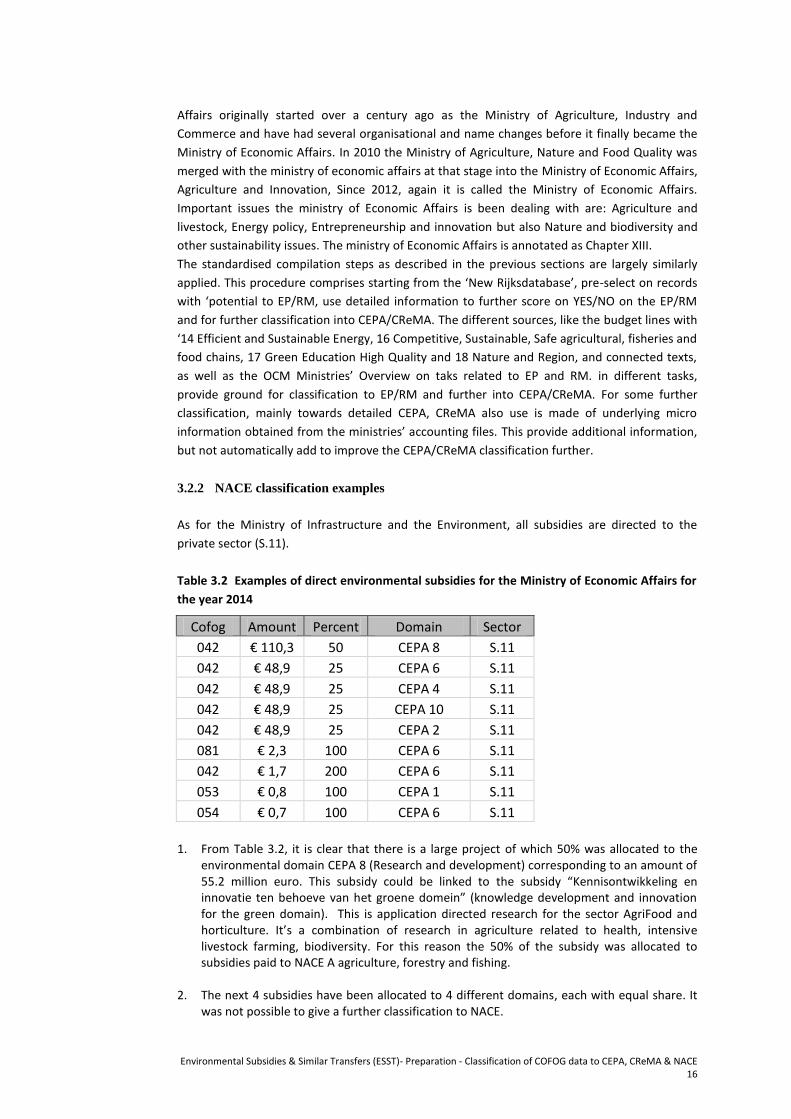
Table 3.2 Examples of direct environmental subsidies for the Ministry of Economic Affairs for
the year 2014
Cofog Amount Percent Domain Sector
042 € 110,3 50 CEPA 8 S.11
042 € 48,9 25 CEPA 6 S.11
042 € 48,9 25 CEPA 4 S.11
042 € 48,9 25 CEPA 10 S.11
042 € 48,9 25 CEPA 2 S.11
081 € 2,3 100 CEPA 6 S.11
042 € 1,7 200 CEPA 6 S.11
053 € 0,8 100 CEPA 1 S.11
054 € 0,7 100 CEPA 6 S.11
1. From Table 3.2, it is clear that there is a large project of which 50% was allocated to the
environmental domain CEPA 8 (Research and development) corresponding to an amount of 55.2 million euro. This subsidy could be linked to the subsidy “Kennisontwikkeling en innovatie ten behoeve van het groene domein” (knowledge development and innovation for the green domain). This is application directed research for the sector AgriFood and horticulture. It’s a combination of research in agriculture related to health, intensive livestock farming, biodiversity. For this reason the 50% of the subsidy was allocated to subsidies paid to NACE A agriculture, forestry and fishing.
2. The next 4 subsidies have been allocated to 4 different domains, each with equal share. It
was not possible to give a further classification to NACE.
Environmental Subsidies & Similar Transfers (ESST)- Preparation - Classification of COFOG data to CEPA, CReMA & NACE 17
3. As another example, the subsidy to CEPA 6 of 2.3 million euro could be linked to the
subsidy “Natuurlijk ondernemen en Natuurvisie” (natural entrepreneurship and nature
vision) was, after some extra research including use of the Internet, allocated to subsidies
paid to NACE I-U Services (except wholosale and retail trade, transportation and storage) . As before the total amount of direct subsidies to CEPA, so those subsidies that are not part of tax abatement or CReMA, are limited. There is, however, a significant subsidy to NACE A of 55.2 million euro and for this environmental domain a significant part could be allocated to a specific NACE category in Agriculture.
In the next Section we will show the results for the other two years (2013 and 2015) as they
enter into the Eurostat Questionnaire on Environmental Subsidies and Similar Transfers.
Environmental Subsidies & Similar Transfers (ESST)- Preparation - Classification of COFOG data to CEPA, CReMA & NACE 18
4. Results for the Questionnaire on Subsidies and
Similar Transfers
The analyses tools available at Statistics Netherlands, as described above, have been used to
classify subsidies and similar transfers to both environmental domain and NACE category for the
years 2013, 2014 and 2015. The method applied to allocate subsidies and transfers to
environmental domains have been discussed in a previous report (REF). The aim of this report
was to add NACE categories to the existing data respecting the totals for each domain and
therefore also the CEPA and CReMa aggregates and their final aggregate.
The reason why we have chosen for compilation of 2013 data as reporting year, is a
consequence of the recently updated ‘New Rijksdatabase’, frequently referred to in the
previous chapters. To use the ‘New Rijksdatabase’ for this project is done because it is fully
aligned with ESA2010 concepts and reporting of the data, where required revisions are done in
a consistent manner with NA, while the newest insights and data from the ministries are taken
on board. This facilitates another objective namely easy and straightforward implementation
for use in EPE(R) compilation as possibly demanded in near future by the EU-regulation. For
adding reporting years, it is foreseen that it is a matter of generally repeating the procedure
followed in this project, although with adjustments for data on reporting year 2017 onwards,
due to the 2017 restructure of the Dutch Ministries, including relocation of parts of
Environment and for example climate change issues (with mitigation & adaptation, possibly
with consequences for the time series data.
4.1 Direct subsidies for CEPA
It’s not possible to show the result of our analyses for all domains and NACE categories together
in one table. There is simply too much data for it to be readable if presented in whole.
Therefore, we will show columns for selected topics or selected aggregates.
We start with the direct subsidies allocated to NACE for the years 2013, 2014 and 2015 as
discussed in the previous section for the year 2014 only. This corresponds to the 1.1.1 subsidies
in the Eurostat Questionnaire.
Environmental Subsidies & Similar Transfers (ESST)- Preparation - Classification of COFOG data to CEPA, CReMA & NACE 19
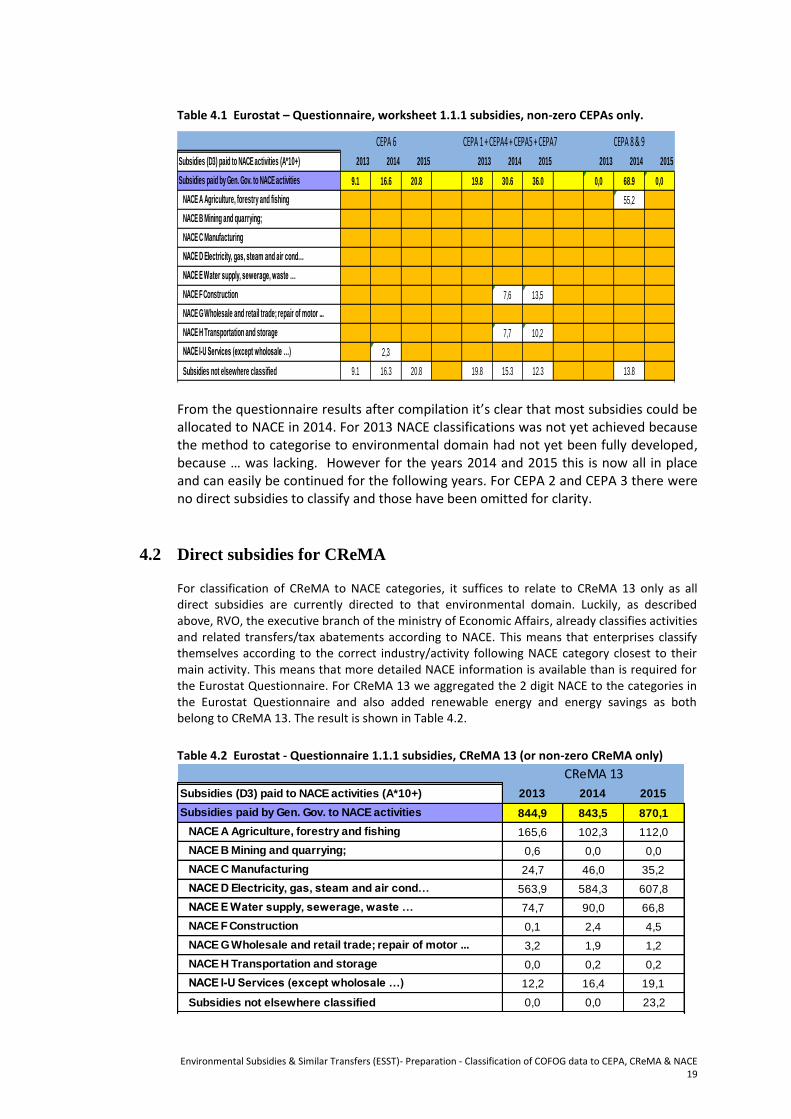
From the questionnaire results after compilation it’s clear that most subsidies could be allocated to NACE in 2014. For 2013 NACE classifications was not yet achieved because the method to categorise to environmental domain had not yet been fully developed, because … was lacking. However for the years 2014 and 2015 this is now all in place and can easily be continued for the following years. For CEPA 2 and CEPA 3 there were no direct subsidies to classify and those have been omitted for clarity.
4.2 Direct subsidies for CReMA For classification of CReMA to NACE categories, it suffices to relate to CReMA 13 only as all direct subsidies are currently directed to that environmental domain. Luckily, as described above, RVO, the executive branch of the ministry of Economic Affairs, already classifies activities and related transfers/tax abatements according to NACE. This means that enterprises classify themselves according to the correct industry/activity following NACE category closest to their main activity. This means that more detailed NACE information is available than is required for the Eurostat Questionnaire. For CReMA 13 we aggregated the 2 digit NACE to the categories in the Eurostat Questionnaire and also added renewable energy and energy savings as both belong to CReMA 13. The result is shown in Table 4.2.
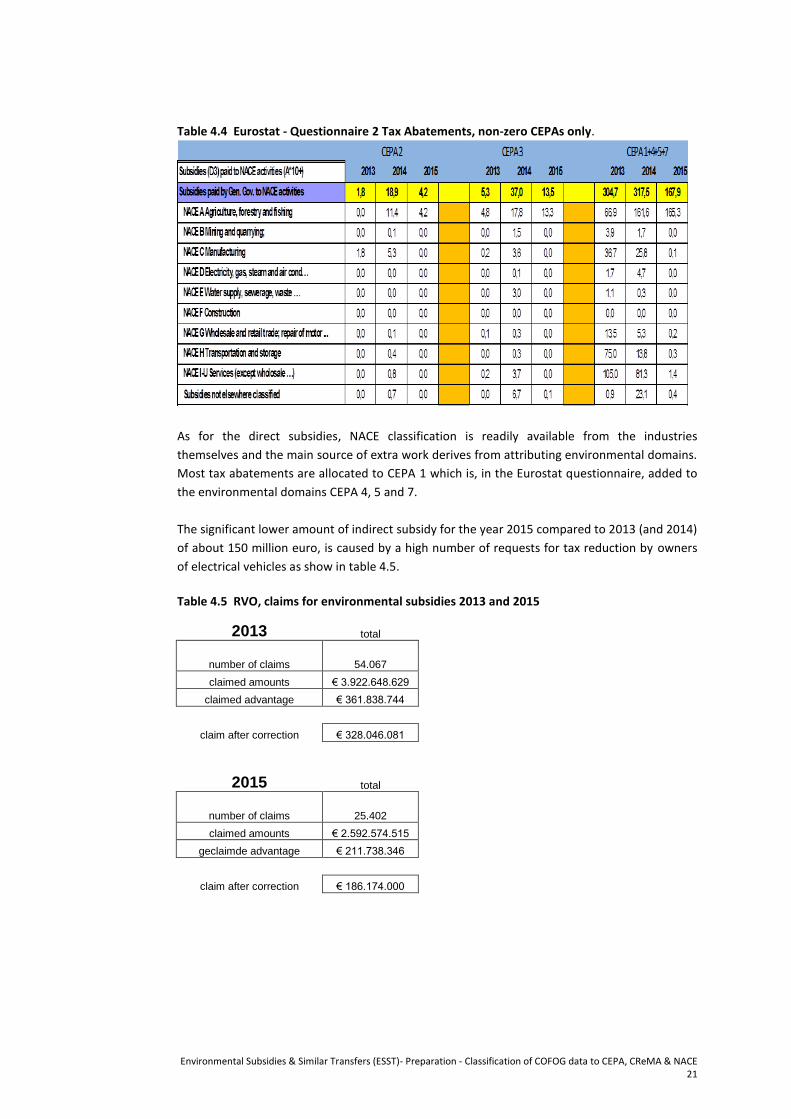
As for the direct subsidies, NACE classification is readily available from the industries
themselves and the main source of extra work derives from attributing environmental domains.
Most tax abatements are allocated to CEPA 1 which is, in the Eurostat questionnaire, added to
the environmental domains CEPA 4, 5 and 7.
The significant lower amount of indirect subsidy for the year 2015 compared to 2013 (and 2014)
of about 150 million euro, is caused by a high number of requests for tax reduction by owners
of electrical vehicles as show in table 4.5.
Table 4.5 RVO, claims for environmental subsidies 2013 and 2015
2013 total
number of claims 54.067
claimed amounts € 3.922.648.629
claimed advantage € 361.838.744
claim after correction € 328.046.081
2015 total
number of claims 25.402
claimed amounts € 2.592.574.515
geclaimde advantage € 211.738.346
claim after correction € 186.174.000
Environmental Subsidies & Similar Transfers (ESST)- Preparation - Classification of COFOG data to CEPA, CReMA & NACE 22
5. Conclusions
With the overall aim of the project to further prepare for compilation of the data and test on
populating the Eurostat questionnaire on environmental subsidies and similar transfers ESST),
we tried to deal with several compilation challenges within this study. Eurostat ESST
questionnaire in contrast to current EPEA – questionnaire will be populated with data for both
CEPA and CReMA categories as far this is doable.
For the aim to compile data for the three most recent years for which data is available, 2013 –
2015 we largely succeeded, with a prime focus on the transfers from Central Government.
For Central Government, the transaction data classified to environmental domains in
government statistics, after additional classification procedure developed and implemented
starting from COFOG-data by previous projects, provides a sound basis for the further
classification of the direct subsidies to NACE, needed to fill the CReMA part of table 1,1.1
(subsidies) in the Eurostat Questionnaire on Environmental Subsidies and Similar Transfers.
Minor extra research was needed to add the CEPA part of the direct subsidies to table 1.1.1.
A positive experience in the project was the fact that for the years covered by this Grant project (2013-2015), the government data has been consistently updated in revised form, and was available for the project at the highest standards following ESA2010 (and SNA2008) and of very high quality. The base data is stored in a renewed and improved database, the ‘New Rijksdatabase’, with all the ESA2010 coding up-to-date for a latest year, namely 2015. No direct subsidies were directed to households in the New Rijksdatabase and it is recommended to identify and include the allocation of direct subsidies to households to the database. For data on tax abatement, needed to fill table 2 (tax abatements) of the Eurostat Questionnaire on Environmental Subsidies and Similar Transfers, the RVO data provided to Statistic Netherland by the executive branch of the ministry of Economic Affairs was used. Since this data is already classified to NACE by the industry class (NACE) of the beneficiaries, the main task remaining for the full classification is linking the data to the appropriate environmental domain, CEPA or CReMA. The procedures established in the project allowed to determine the transactions relevant for direct and indirect environmental subsidies for the years 2013, 2014 and 2015. Thanks to this Grant project, a NACE breakdown was, for the first time, added to the Eurostat Questionnaire on Environmental subsidies and transfers for the 2017 pilot data collection. Close cooperation between the three groups within the NSI Statistics Netherlands, including i. Government statistics, ii. environmental statistics, and iii. Environmental accounts, was needed in order to share and combine the required data. What was classified as environment in COFOG, function 5, was of course easiest to translate to CEPA/CReMA categories. For some other COFOG functions we found distribution codes we could use to translate to the specific related CEPA an CReMA classification. The remaining COFOG functions were the biggest challenge in classification. For that purpose, other additional and detailed information was explored in order to obtain a best possible but not always straightforward CEPA/CReMA classification. The outcome of this project has substantially contributed to the establishment of a sequence of working procedures. These procedures are embedded in existing statistics production and methodology and enables Statistics Netherlands to compile the data as foreseen by Eurostat’s voluntary data collection from national statistical institutes on Environmental Subsidies and similar Transfers with a minimum extra workload.
Environmental Subsidies & Similar Transfers (ESST)- Preparation - Classification of COFOG data to CEPA, CReMA & NACE 23
The main conclusion that can be drawn from the NACE breakdown of the direct subsidies is an increasing tendency to allocate subsidies to energy production. These subsidies try to compensate the extra cost of energy production from renewable sources compared to energy production with conventional methods. The main conclusion that can be drawn from the NACE breakdown of tax abatement subsidies is that in the year 2013 there was a huge increase in the number of claims by owners of electrical vehicles.
Environmental Subsidies & Similar Transfers (ESST)- Preparation - Classification of COFOG data to CEPA, CReMA & NACE 24
References
EPEA: Classification of COFOG based source data to CEPA & CReMA. Final report pilot study
Euostat, Grant 2013
Classification of Environmental Activities (CEA) - Information paper, 2011. Expert Group meeting
on International economic and social classifications. New York, 18-20 May 2011.
EU Legal Base on Environmental Accounting.
Council Regulation (EC) No 2223/96 of 25 June 1996 on the European system of national and
regional accounts in the Community. The annex contains the whole ESA95.
Eurostat 2007. Environmental expenditure statistics – General government and specialised
producers data. collection handbook.
Eurostat 2011. Eurostat Manual on sources and methods for the compilation of COFOG
Statistics. Classification of the Functions of Government (COFOG), 2011 Edition. Luxembourg.
Eurostat 2012. Environmental subsidies in other COFOG codes (beside COFOG 05) –
methodological cases for the COFOG TF. Task Force on environmental transfers. Meeting of 15-
16 October 2012. Eurostat – Unit E2.
Eurostat 2013. Manual on Government Deficit and Debt - Implementation of ESA10. 2013
edition. Luxembourg.
Eurostat 2014a. Manual on Government Deficit and Debt - Implementation of ESA10. 2014
edition. Luxembourg.
Eurostat 2014b. Environmental transfers - draft guidelines on ’Environmental subsidies and
similar transfers’. Task Force meeting on environmental transfers, 25 and 26 November 2014.
Eurostat, Unit E-2: Environmental statistics and accounts.
Eurostat 2015. Environmental subsidies and similar transfers - Guidelines. Eurostat, Unit E-2:
Environmental statistics and accounts. 2015 Edition. Release date: 21/07/2015. Eurostat
Manuals and guidelines. ISBN 978-92-79-48269-4. ISSN 2315-0815.
RAMON, (Reference And Management Of Nomenclatures), 2014. Classification of
Environmental Protection Activities and Expenditure (2000). Website visit (15-12-2014):
http://ec.europa.eu/eurostat/ramon. European Commission, Eurostat.
Regulation (EU) No 549/2013 of the European Parliament and of the Council of 21 May 2013
on the European system of national and regional accounts in the European Union. Official
Journal of the European Union. Contains: ESA 2010 regulation and methodological manual.