Environmental Awareness Baseline Survey – Cleaning and Greening of Cambridge Environmental Awareness Environmental Awareness Baseline Survey Baseline Survey – Cleaning and Cleaning and Greening of Cambridge Greening of Cambridge
Transcript
Environmental Awareness Baseline Survey – Cleaning and
Greening of Cambridge
Environmental Awareness Environmental Awareness Baseline Survey Baseline Survey –– Cleaning and Cleaning and
Government of Jamaica’s National Environment and Planning Agency
and the
United States Agency for International Development
Implemented by:
ARD, Inc. P.O. Box 1397
Burlington, Vermont 05402
Environmental Awareness Baseline Survey – Cleaning and Greening of Cambridge 2
Environmental Awareness Baseline Survey – Cleaning and Greening of Cambridge 3
Table of Contents Introduction 5 General Description of the Survey 5 Objectives 5 Coverage 5 Methodology 5 Survey Results (Module 1) 7 Education 7 Media Access and Usage 8 Radio 9 Television 13 Newspapers 18 Community Group Membership 18 Exposure to Community Groups and Organization 19 Employment 19 Quiz Questions (Module 2) 21 Conclusion 37 Appendices Appendix A Module 2, Data Tables for the Graphs Presented in the Text 38 Appendix B The Survey Questionnaire 42 List of Tables Table 1 Summary of the Educational Attainment Levels among Respondents 7 Table 2 Percentage of the Population that Listen to the Radio, by Age Group of Listener and Station Name 13 Table 3 Summary of Community Groups Membership among Respondents’ Households 18 Table 4 Employment Status among Community Members 19 List of Figures Figure 1 Percentage of Community Members by Level of Education 8 Figure 2 Percentage of Community Members Listening to the Radio by Timeslot 10 Figure 3a Percentage of the Population Listening to the Radio by Radio Station and
Timeslot 11 Figure 3b Percentage of the Population Listening to the Radio by Time Slot and Radio
Station 12
Environmental Awareness Baseline Survey – Cleaning and Greening of Cambridge 4
Figure 4a Percentage of Community Members Watching Television by Television Station and Time Slot 15 Figure 4b Percentage of Community Members Watching Television by Time Slot and
Television Station 16 Figure 5 Percentage of Community Members who Read the Newspaper Regularly by
Name of Newspaper 17
Environmental Awareness Baseline Survey – Cleaning and Greening of Cambridge 5
Introduction This is the first of two reports to be done as part of an exercise to assess the effectiveness of the Ridge to Reef project, “The Cleaning and Greening of Cambridge” in addressing sanitation, land management and general environmental issues related to the management of the Cambridge watershed area of St. James. The Project Coordinator of the Cleaning and Greening of Cambridge Project requested that an environmental awareness survey be designed and conducted in the Cambridge area of the Great River Watershed of St. James. For the purpose of the survey, Cambridge was defined as the same as used by the Statistical Institute of Jamaica in the 2001 population census. The main communities located within the boundaries of this area are: Tank Road, Old Road, Bullman, Cambridge Proper, Lower Cambridge, Ducketts, Whitesand, Rosemount, Retrieve, Shortwood and a small part of Senior. The main purpose of the survey was to provide management information to aid the Project Coordinator to adequately plan and implement a programme of environmental sensitization and training among the general population of the Cambridge community, as part of the activities of the project, and to provide baseline information on the population’s present awareness of environmental issues to form the bases for evaluating the effectiveness of the Project at its completion.. General Description of the Survey Objectives Specifically, the main objective of the survey was to enable the Project Coordinator, to assess the project’s effectiveness in educating the population of Cambridge in general environmental, sanitation and land management issues. The secondary, though more immediate, objective was to provide information which will help to guide the direction and focus of the Project’s public education program. Coverage The survey activity was designed in two distinct phases. The first phase was used to collect information to help in guiding the direction of the project, but more importantly it sought to establish a baseline assessment of the awareness of topical and relevant environmental issues among the Cambridge population. The first phase of the survey commenced in July 2004 with and was completed in mid August. The second phase will be used as part of the Project impact evaluation exercise and will be to assess the effectiveness of the Project outreach programmes in raising the awareness of environmental and related issues, and planning regulations among the target population. This phase is to be executed at or near the end of the Project life in mid- 2005. Methodology A survey questionnaire (see Appendix B) was designed that has two main modules. The first module was used to provide some demographic and other behavioural data especially as it related too the exposure of community members to the various news media and community group membership and contact. The usefulness of these data will be to assist the Project
Environmental Awareness Baseline Survey – Cleaning and Greening of Cambridge 6
Coordinator in designing the public education and outreach programmes to be undertaken by the Project. The second module constituted the main section of the questionnaire and was used to measure the level of knowledge about environmentally related topics among the population through the administration of a series of quiz type questions. The complete questionnaire consisting of both modules was administered to a sample of the community membership in the first phase of the survey. For the second phase in 2005, only the second module will be administered. Although there was an estimate of the population size based on the results from the National Population Census and local discussions, there were no detailed listings of households or individuals. In order to avoid a costly and time consuming listing exercise, it was decided to use a quota sampling methodology, where each interviewer was assigned to a specific area of the community and given strict and precise guidelines as to the gender and age of persons to be interviewed to do a survey of the adult population of the community. The choice of the actual persons interviewed was left up to the interviewer with the additional instruction not to interview more than one person from any single household or anyone from their own household. Equal representation was given to gender as well as to each of six age group categories. These categories were: ? < 20 yrs, ? 20 – <30 yrs, ? 30 – <40 yrs, ? 40 – < 50 yrs, ? – < 60 yrs, and ? 60 + yrs A total of 90 questionnaires, representing approximately one percent of the total population and between four and five percent of total households, was administered by four trained interviewers. The interviewers were locally based persons who were recruited by the Project Coordinator. They were active community workers and very knowledgeable about the Cambridge and surrounding communities. They also had some amount of experience, having worked as interviewers for several of STATIN’s surveys and censuses in the same communities. In addition prior to going into the field a one-day training session was done with them by the survey consultant, in order to ensure common understanding of the survey concepts and definitions and to familiarize them with the survey questionnaire. Close supervision and quality control using an experienced survey field supervisor were used in order to ensure compliance and the integrity of the exercise. Training of the interviewers was done on July 23rd at the Project office in Cambridge. Data collection started immediately after the training exercise. The survey fieldwork exercise lasted for approximately one week.
Environmental Awareness Baseline Survey – Cleaning and Greening of Cambridge 7
Survey Results (Module 1) This section will present and examine the findings the first module of the survey questionnaire that looked at the demographic and behavioural characteristics of the community members. The survey found that the mean household size for the Cambridge area was 4.51 persons per household of which an average of 1.64 persons were under 18 years old. However, only 77.8 % of the households had persons under 18 living in them. Taking this into consideration, the recalculation resulted in an average of 2.1 persons under 18 years old per household for those households that had persons younger than 18 living in them. Education The education level among the population was relatively high, with some 31.1 % having completed secondary education, 14.4 % tertiary education and 8.9 % vocational. Despite this however, cognizance has to be taken of a relatively large proportion of the population that has had no education or only completed as far as primary education (see Figure 1). Table 1 Summary of the Educational Attainment Levels Among Respondents by
Gender
Percentage of Respondents Highest Level of Education Attained
Male Female Total
None 1.1 0.0 1.1
Primary: incomplete 1.1 1.1 2.2
Primary: completed 17.8 10.0 27.8
Secondary: incomplete 6.7 6.7 13.3
Secondary: completed 14.4 16.7 31.1
Vocational 2.2 6.7 8.9
Tertiary 5.6 8.9 14.4
Other 1.1 0.0 1.1
Table 1, summarizes the educational attainment levels among the respondents by gender. From the gender analysis of the educational attainment distribution presented in the table it was found that t there was a distinct gender difference in the educational levels, with women being more likely to have had a higher level of educational attainment than the men.
Environmental Awareness Baseline Survey – Cleaning and Greening of Cambridge 8
1.12.2
27.8
13.3
31.1
8.9
14.4
1.1
0.0
5.0
10.0
15.0
20.0
25.0
30.0
35.0
None Primary: incomplete
Primary:completed
Secondary:incomplete
Secondary:completed
Vocational Tertiary Other
Figure 1. Percentage of community members by level of education
Media Access and Usage The questionnaire sought to track the exposure of community members to the various types of news media, paying particular attention to the time of day that persons listened to or watched the electronic media in it various forms. This information will be important in the Project’s attempt to reach its target audience through the use of the most efficient and cost-effective manner, in its public education and sensitization efforts. Detailed information looking at the following time slots: ? Early morning (5.00 – 9.00 am) ? Mid morning (9.00 am – 12.00 noon) ? Early afternoon (12.00 noon – 5.00 pm) ? Late afternoon (5.00 – 7.00 pm) ? Evening (7.00 pm – 12.00 midnight) ? Pre dawn (12.00 midnight – 5.00 am) Was collected on radio and television usage. It should be noted that listening or viewing during a particular time-slot does not mean that a person listens or views for the entire time slot. It only means that that person normally tunes in to listen or watch at some point during the time slot. Hence it was quite possible for example for someone to indicate that they listened to two or more radio stations as well or viewed two different television station/channel in a particular timeslot. Information was also collected on newspaper readership among the community members.
Environmental Awareness Baseline Survey – Cleaning and Greening of Cambridge 9
Radio Figure 2 shows that at all time slots, with the exception of the pre-dawn slot (12.00 midnight – 5.00 am) at least 60 % of the community listened to the radio, with the highest percentage of the population listening in the evening slot, between 7.00 pm and midnight. Radio listener-ship during this period was at 92.2 %.
Environmental Awareness Baseline Survey – Cleaning and Greening of Cambridge
10
70.0
61.165.6
76.7
92.2
11.1
0.0
10.0
20.0
30.0
40.0
50.0
60.0
70.0
80.0
90.0
100.0
%
Early morning (5.00am – 9.00 am)
Mid morning (9.00am – 12.00 noon)
Early afternoon(12.00 noon – 5.00
pm)
Late afternoon (5.00pm – 7.00 pm)
Evening (7.00pm –12.00 midnight)
Pre dawn (12.00midnight – 5.00 am)
Figure 2. Percentage of community members listening to the radio by time slot
Environmental Awareness Baseline Survey – Cleaning and Greening of Cambridge
11
3.32.2
3.34.4
3.3
1.12.2
1.11.12.2
3.3
0.0
31.1
33.3
27.8
38.9
44.4
6.7
0.01.11.11.11.1
0.0
3.33.3
6.7
4.4
6.7
0.0 0.00.01.1
0.00.00.01.1
0.01.11.1
2.2
0.0
5.65.64.4
3.33.3
1.1
22.2
13.314.4
16.7
21.1
2.21.11.1
4.44.4
6.7
0.00.0
5.0
10.0
15.0
20.0
25.0
30.0
35.0
40.0
45.0
%
Fame Hot102 Irie FM Links FM Love FM Mello FM Music99 FM Power106 RJR Zip103
Figure 3a. Percentage of the population listening to the radio by radio station and time slot
Early morning (5.00 am – 9.00 am)Mid morning (9.00 am – 12.00 noon)Early afternoon (12.00 noon – 5.00 pm)Late afternoon (5.00 pm – 7.00 pm)Evening (7.00pm – 12.00 midnight)Pre dawn (12.00 midnight – 5.00 am)
Environmental Awareness Baseline Survey – Cleaning and Greening of Cambridge
12
3.32.2
31.1
0.0
3.3
0.01.1
5.6
22.2
1.12.2
1.1
33.3
1.1
3.3
0.00.0
5.6
13.3
1.1
3.3
1.1
27.8
1.1
6.7
1.11.1
4.4
14.4
4.4 4.4
2.2
38.9
1.1
4.4
0.01.1
3.3
16.7
4.43.33.3
44.4
1.1
6.7
0.0
2.23.3
21.1
6.7
1.10.0
6.7
0.00.00.00.01.1
2.2
0.00.0
5.0
10.0
15.0
20.0
25.0
30.0
35.0
40.0
45.0
%
Early morning (5.00 am– 9.00 am)
Mid morning (9.00 am– 12.00 noon)
Early afternoon (12.00noon – 5.00 pm)
Late afternoon (5.00pm – 7.00 pm)
Evening (7.00pm –12.00 midnight)
Pre dawn (12.00midnight – 5.00 am)
Figure 3b. Percentage of the population listening to the radio by time slot and radio station
Fame
Hot102
Irie FM
Links FM
Love FM
Mello FM
Music99 FM
Power106
RJR
Zip103
Environmental Awareness Baseline Survey – Cleaning and Greening of Cambridge
13
A more detailed look at the radio listener-ship represented in Figures 2a and 2b, shows that ten different radio stations were reported as being listened to most. Of the ten however, the most listener-ship was to Irie FM followed by RJR, with Irie FM outperforming RJR at all of the time slots. Listener-ship for Irie FM peaked during the evening timeslot (7.00 pm to 12.00 midnight) where more than 44 % of the population listened to this station. If one discounts the pre-dawn (12.00 midnight – 5.00 am) time slot when most people are asleep, at no other time during the day does less than 27 % of the population listen to Irie FM. RJR’s listener-ship on average was approximately a half that of Irie FM, but comes close to Irie FM in the early morning (5.00 am – 9.00 am) timeslot. This was when RJR enjoyed its peak listener-ship, capturing 22.2 % of the population, compared to Irie FM’s 31.1 % during the same time. Other radio stations with smaller but significant listener-ships were Love FM, Power106, Zip103, and FAME FM. Table 2 Percentage of the Population that Listen to the Radio, by age Group of
Note: Percentages will sum to more than 100 because of multiple responses Although the radio listener-ship was overwhelmingly dominated by Irie FM in all except the 60+ age group category, there was a tendency for younger listeners to listen to this station and some of the newer stations such as FAME and Love FM (Table 2). Although more persons older than forty listened to Irie FM than RJR, they were more likely than their younger counterparts to listen to RJR. Television Community members had one of four main options for watching television in the Cambridge community. One of either of the two national channels CVM or TVJ (it was reported that signals from the other national television station ‘Love TV’ cannot be picked up in the community) or Cable television. Cable television viewing was separated as watching either the Channel 25, local community station, or to other cable channels. Figures 4a and 4b shows that the peak time for television viewing was in the evening time slot (7.00 pm to 12 midnight). This period not only coincided with when most people tend to relax after working but also corresponded to the period when both national local channels had their major news programmes. In fact many respondents said that they tuned in to these television stations at this time specifically for the news.
Environmental Awareness Baseline Survey – Cleaning and Greening of Cambridge
14
Notwithstanding this, television was watched throughout the day with significant viewer-ship for CVM in the early morning (5.00 am – 9.00 am) and late afternoon (5.00 pm to 7.00 pm) timeslots. CVM commanded the highest viewer-ship, and significantly outperformed all the other stations with the exception of the Cable channels (excluding Channel 25) during the period 9.00 am to 5.00 pm. In fact the evening (7.00 pm to 12 midnight) timeslot viewer-ship at 65.6 % of the population was more than three times that of TVJ at 18.9 % and more than twice that of the Cable channels (excluding Channel 25) at 30.0 %.
Environmental Awareness Baseline Survey – Cleaning and Greening of Cambridge
15
2.24.4 5.6
13.3
18.9
0.0
20.0
12.2 11.1
20.0
65.6
3.3 2.24.4 4.4
7.8
11.1
1.1
6.7
15.6
12.2
22.2
30.0
2.2
0.0
10.0
20.0
30.0
40.0
50.0
60.0
70.0
TVJ CVM Cable – Channel 25 Cable – other
Figure 4a. Percentage of community members watching television by television station and time slot
Early morning (5.00 am – 9.00 am)Mid morning (9.00 am – 12.00 noon)Early afternoon (12.00 noon – 5.00 pm)Late afternoon (5.00 pm – 7.00 pm)Evening (7.00pm – 12.00 midnight)Pre dawn (12.00 midnight – 5.00 am)
Environmental Awareness Baseline Survey – Cleaning and Greening of Cambridge
16
2.2
20.0
2.2
6.74.4
12.2
4.4
15.6
5.6
11.1
4.4
12.2 13.3
20.0
7.8
22.2
18.9
65.6
11.1
30.0
0.0
3.31.1 2.2
0.0
10.0
20.0
30.0
40.0
50.0
60.0
70.0
Early morning (5.00 am – 9.00am)
Mid morning (9.00 am – 12.00noon)
Early afternoon (12.00 noon –5.00 pm)
Late afternoon (5.00 pm – 7.00pm)
Evening (7.00pm – 12.00midnight)
Pre dawn (12.00 midnight –5.00 am)
Figure 4b. Percentage of community members watching television by time slot and television station
TVJCVMCable – Channel 25Cable – other
Environmental Awareness Baseline Survey – Cleaning and Greening of Cambridge
17
13.3
7.8
1.1
16.7
10.0
13.3
62.2
7.8
0.0
10.0
20.0
30.0
40.0
50.0
60.0
70.0
%
Daily Star Gleaner Herald Observer Sunday Gleaner Week-end Star Western Mirror Wk-endObserver
Figure 5. Percentage of community members who read the newspaper regularly by name of newspaper
Environmental Awareness Baseline Survey – Cleaning and Greening of Cambridge
18
Though Channel 25 had the lowest viewer-ship among the four options, a significant proportion of the population watched it and during the peak television viewing time more than ten percent of the community tuned in to it. Newspapers Figure 5 shows the summary of the percentage of the community that regularly read the available newspapers. Generally, newspaper readership was fairly low with only a maximum readership of any of the national dailies of less than 20 %. However it can be seen from the figure that the most widely read newspaper among community members was the Western Mirror, which a surprisingly high 62.2 % of the population reported as reading regularly. Among the national daily newspapers, the highest readership at 16.7 % was reported for the Daily Observer. This was followed by the Daily Star at 13.3 %. Only 7.8 % readership was reported for the Gleaner. The Week-end Star at 13.3 % had the highest readership among the week-end newspaper. From the above results it is obvious that radio was by far the most universally accessed and used media and could prove to be one of the most effective ways to reach community members. Both Irie FM and RJR are good candidates for this focus, although because of the much higher listener-ship and its more regional touch Irie FM would be the best choice. However the transient nature of radio has to weighed against the little more permanent nature of the print media, and it would be advisable to make use of the high readership level of the Western Mirror. In addition to a high circulation in the community, the regional nature of the publication lends itself to addressing such local issues as the Project will be addressing. Community Group Membership Respondents were asked if they or any member of their household was a member of any community group. Sixty point seven percent of the respondents responded that neither they nor any other member of their household were members of any community groups. Table 3 below summarizes the community groups that were reported and the percentage of households reporting membership in each. Outside of the various church groups which dominated the list, the only other groups with any significant membership reported were the Police Youth Club, the Cambridge Benevolent Society and the Lower Cambridge Community Group. Table 3 Summary of Community Groups Membership among Respondents’
Households
Group Name Percentage of Household
4H Club 1.1%
Cambridge Benevolent Society 5.6%
Church Group 1.1%
Churchs' Womens Group 11.2%
Church Youth Group 3.4%
Football Club 2.2%
Lower Cambridge Community Group 5.6%
Environmental Awareness Baseline Survey – Cleaning and Greening of Cambridge
19
Group Name Percentage of Household
Mens' Fellowship 1.1%
PNP Executive 1.1%
Police Youth Club 5.6%
Provident Society 1.1%
Road Star club 1.1%
SDA church 1.1%
SDA Pathfinder Club 1.1%
Youth Club 1.1%
No group membership 60.7%
Note: Percentage will sum to more than 100 because of multiple group membership among
some households.
Exposure to Community Groups and Organization The community group with which most persons reported regular contact was the Police Youth Club. A significant percentage of just lees than a quarter of the respondents reported that they had regular interaction with this group. The next most common organization, community members had regular interaction with was the Public Health Department, which 10 % of the population reported having regular interaction with. This was followed by the Women’s Group with 8.9 % of the population. Employment The table below sets out the details of employment status of the population. Students were excluded from the unemployed and singled out for obvious reasons. It should be noted here that Table 4 Employment Status among Community Members by Gender
Percentage of Population Employment Status
Male Female Overall
In community 6.7 3.3 10.0 Full time paid employment
Outside of community 7.8 4.4 12.2
In community 2.2 1.1 3.3
Outside of community 3.3 1.1 4.4 Part time paid employment Both inside and outside of community 1.1 0.0 1.1
In community 8.9 5.6 14.4
Outside of community 0.0 0.0 0.0 Self Employed Both inside and outside of community 1.1 0.0 1.1
Housewives 0.0 14.4 14.4
Environmental Awareness Baseline Survey – Cleaning and Greening of Cambridge
20
Percentage of Population Employment Status
Male Female Overall
Students 4.4 10.0 14.4
Unemployed 14.4 7.8 22.2
Retired 1.1 1.1 2.2
The survey did not interview anyone under 18 years old, hence the ‘Students’ indicated here are all adult students older than 18. Housewives were indicated in the survey as being unemployed. However the thinking is that this should not be so. It is unfair to classify housewives as being unemployed when they may be much more gainfully employed than many others who are classified as employed in the workforce. Hence they have been recoded as a separate category. It is noteworthy that outside of the self-employed who were mainly farmers, vendors and artisans, the majority of the employed population worked outside of the community. Of the 31% of the population that were either in full or part-time paid employment, more than half of them worked outside of the community, mainly in or around Montego Bay. This paid workforce was dominated by men as males were more than twice as likely to be engaged in paid employment as females. Specific job details were not collected, so no comment can be made on the relative value/importance of these jobs or about income. Interesting too, was the fact that females were more than twice as likely to be students than males and that there were significantly more unemployed males than females (some consideration may be given here to the classification discussed above, of women who said that they were housewives, since chronic unemployment in some cases may have resulted in some sense of resignation and an individual mentally reclassifying herself as a housewife).
Environmental Awareness Baseline Survey – Cleaning and Greening of Cambridge
21
Quiz Questions (Module 2) Summaries of the results to the questions on the environment and environmental issues administered to the community members in the second module of the questionnaire will be presented in the following pages. The main usefulness of most of this information is as a comparative baseline for the evaluation process to be carried out at the end of the public education exercise. However these findings can also play a critical role in the focusing and planning of that exercise. Each question has been evaluated as to being answered correctly, incorrectly or as partially correct. Responses were classified as partially correct where it was clear from the answer given that the respondent had a good general knowledge of the correct answer but lacked or incorrectly understood specific details. Where special nuances or trends in the responses were found, these will be discussed on an individual basis for each of the questions. Accompanying this will be a graphical representation of the responses for each of the questions to facilitate an easy reference to the summarized information.
1. What is the name of the Act that regulates Public Cleanliness?
What is the name of the Act that regulates Public Cleanliness?
Don't know, 80.0%
Incorrect, 14.4%Partially Correct,
4.4%Correct, 1.1%
Correct Answer: National Solid Waste Management Act.
Most, 80 %, of the respondents did not know the answer to this question with a further 14.4 % attempting to answer but giving an incorrect answer. Among the more common incorrect responses were: ? The Public Health Act/Ministry of Health ? National and or Western Parks and Market ? The Parish Council ? The Anti-litter Act ? NEPA Responses assessed as partially correct were those that respondents could either (a) give the acronym NSWMA, without being able to name the Act or the Agency, or (b) gave the name of the Act but with one or more of the key words incorrectly. For example, the response “National Solid
Environmental Awareness Baseline Survey – Cleaning and Greening of Cambridge
22
Waste Management Authority’ was classified as partially incorrect. Approximately 4.4 % of the community members gave an answer that was considered to be partially correct. 2. Which agency is responsible for the collection of garbage in Jamaica?
Which agency is responsible for the collection of garbage in Jamaica?
Partially Correct, 3.3%
Incorrect, 25.6%
Don't know, 60.0%
Correct, 11.1%
Correct Answer: National Solid Waste Management Agency For this question more than a quarter of the respondents were totally incorrect in the answer they gave. Incorrect responses ranged from the Parish Council through NEPA. However the most common incorrect response was the former ‘Western Parks and Markets’. Some respondents also indicated other regional sister organizations, the “Central Parks and Markets’ and the ‘Metropolitan Parks and Markets’. The correct answer was given by 11.1 % of the respondents with a further 3.3 % clearly knowing the responsible agency but being unable to get the name right. However, the majority of persons indicated that they simply did not know what the name of the responsible agency was.
Environmental Awareness Baseline Survey – Cleaning and Greening of Cambridge
23
3. Please name two agencies responsible for the protection of forests and the watershed.
Please name two agencies responsible for the protection of forests and the watershed.
Don't know, 66.7%
Partially Correct, 10.0%
Incorrect, 18.9%Correct, 4.4%
Correct Answer: NEPA and Forestry Department. For an answer to be classified as partially correct in the case of this question it had to be one that either gave one of the two correct responses along with another incorrect response or gave only one response and it was one of the correct responses expected. For an incorrect classification, the respondent attempted to give one or two agency names and the one or both were incorrect. Just fewer than 15 % of the respondents correctly gave the names of one (10.0 % classified as partially correct) or both (4.4 %) agencies, with the Forestry Department being the most common response among those who could only give one agency name correctly. On the other hand however, 18.9 % gave one or two responses neither of which were correct and a further 60.0 % indicated that they did not know the names of any of the two agencies. Among the agencies incorrectly identified as being responsible for the protection of forests and the watersheds were: ? The Public Works Department ? RADA ? The National Water Commission ? The Ridge to Reef project ? The Ministry of Water
Environmental Awareness Baseline Survey – Cleaning and Greening of Cambridge
24
4. How many watershed units are there in Jamaica?
How many watershed units are there in Jamaica?
Don't know, 72.2%
Incorrect, 26.7%
Correct, 1.1%
Correct Answer: 26 This question proved particularly difficult for most persons. Of the persons interviewed, only one individual who, from the accuracy and clarity of the responses given throughout the questionnaire, apparently was very well informed about environmental issues was able to give the correct response to this question. More than a quarter of the respondents thought they knew the answer or probably just hazarded a guess but ended up with an incorrect response, while 72.2 % indicated that they did not know the correct answer to the question. 5. Can you name two of these watersheds.
Can you name two of these watersheds
Partially Correct, 25.6%
Don't know, 37.8%
Correct, 34.4%
Incorrect, 2.2%
Environmental Awareness Baseline Survey – Cleaning and Greening of Cambridge
25
Correct Answer: Any two of the 26 watershed units. Respondents did much better on this question than the previous one. The high proportion of partially correct responses was an indication that many community members though probably not knowing the name of any other watershed unit, were aware of the one in which they lived in. Thus the Great River was the most common response given. In addition to the 25.6%, classified as partially correct, who in the main could identity the Great River watershed only, another 34.4 % were able to name two watershed units correctly. Despite this however, a significant proportion of persons did not know enough to attempt to give an answer to the question, and 2.2 % gave an incorrect answer. 6. Do you know what the following acronyms are short for? NWC
Do you know what the acronym NWC is short for?
Incorrect, 2.2%
Correct, 78.9%
Don't know, 18.9%
Correct Answer: National Water Commission
Environmental Awareness Baseline Survey – Cleaning and Greening of Cambridge
26
NEPA
Do you know what the acronym NEPA is short for?
Partially Correct, 4.4%
Don't know, 75.6%
Correct, 17.8%Incorrect, 2.2%
Correct Answer: National Environmental Planning Agency NSWMA
Do you know what the acronym NWSMA is short for?
Partially Correct, 2.2%
Don't know, 73.3%
Correct, 15.6%Incorrect, 8.9%
Correct Answer: National Solid Waste Management Authority For the three acronyms presented in this question, NWC was the most commonly recognizable one to most community members. The ubiquity of this agency in most communities across the country and the fact that it has been around for such a long time without a change in name ensured an almost automatic correct explanation of the acronym. Nearly 80 % of the respondents gave the correct response to this question with a further 19 % indicating that they did not know the answer. Only a minority of just over two percent gave an incorrect response.
Environmental Awareness Baseline Survey – Cleaning and Greening of Cambridge
27
Unlike the NWC, NEPA and NSWMA were not as recognizable. This is understandable as they are both newer agencies and do not normally impinge on peoples’ day-to-day lives, with monthly bills, water lock-off etc. as the NWC. Most respondents did not know what the acronyms stood for (75.6 % of respondents saying that they did not know in the case of NEPA and 73.3 % in the case of the NSWMA). Only 17.8 % and 15.5 % gave the correct answer for NEPA and NSWMA respectively. However for both they were additional percentages, 4.4 % and 2.2 % for NEPA and NSWMA respectively, who had an idea of the correct response but got a part of the name wrong. These were classified as being partially correct. In addition 8.9 % and 2.2 % attempted an answer to explaining the NSWMA and NEPA, respectively and gave an incorrect response. 7. Do you know the amount of the fine for each of the following?
Action Correct Incorrect Don't Know
Dropping or otherwise depositing and leaving any litter in any public place. 18.9% 31.1% 50.0%
Willfully breaking any bottle or glass or any article made of glass in or on any public place without lawful authority or reasonable excuse.
14.4% 21.1% 64.4%
Throwing, dropping or otherwise depositing or leaving any litter in any premises owned or occupied by another person without consent of that person.
16.7% 18.9% 64.4%
Erecting, displaying(whether by writing or marking or otherwise), depositing or affixing anything in a public place or on any other building, wall, fence, or structure abutting or adjoining a public place, in such circumstances as to cause, contribute to or tend to the defacement of that place, building, wall, fence or structure as the case may be.
8.9% 21.1% 70.0%
Employing or recruiting person(s) who erect, play (whether by writing or marking or otherwise) depositing or affixing anything in a public place or on any building, wall, fence, or structure abutting or adjoining a public place in such circumstances as to cause, contribute or tend to the defacement of that place, building, wall, fence, or structure as the case may be
7.8% 24.4% 67.8%
Correct Answers: $ 2,000; $5,000; $5,000; $3,000; $10,000, respectively The table above gives the summaries of the responses to this multi-part question on the quanta of fines for various offences under the National Solid Waste Management Act, in the order as listed. For all of the offences at least 50 % of the respondents indicated that they did not know the correct response with the highest proportion being for the fourth offence - Erecting, displaying(whether by writing or marking or otherwise), depositing or affixing anything in a public place or on any other building, wall, fence, or structure abutting or adjoining a public place, in such circumstances as to cause, contribute to or tend to the defacement of that place, building, wall, fence or structure as the case may be- for which as much as 70 % did not know or tried to attempt an answer. Significant proportions of the community members attempted an answer but gave incorrect responses. The feeling here however was that among these persons there were many who were willing to hazard a guess, not necessarily from having any prior knowledge but because of the relative ease of being able to guess a response to a numerical question.
Environmental Awareness Baseline Survey – Cleaning and Greening of Cambridge
28
The fine which the highest proportion of people got correct was that for - Dropping or otherwise depositing and leaving any litter in any public place. Here 18.9 % of the respondents knew the correct fine. On the other hand, only 7.8 % knew the correct fine for - Employing or recruiting person(s) who erect, play (whether by writing or marking or otherwise) depositing or affixing anything in a public place or on any building, wall, fence, or structure abutting or adjoining a public place in such circumstances as to cause, contribute or tend to the defacement of that place, building, wall, fence, or structure as the case may be. 8. What does the word biodegradable means?
What does the word biodegradable means?
Incorrect3.3%
Correct7.8%
Don't know74.5%
Partially Correct14.4%
Correct Answer: Capability of substance/material to be broken down by bacteria. The term biodegradable was not generally known among the community members. Seventy-five percent of the respondents stated that they did not know what the term meant. A further 3.3 % attempted an answer to the question but gave an incorrect answer. Almost eight percent gave a correct response to the question and a further 14.4 %, responses that were considered to be partially correct. Many of those who got the answer partially correct knew that biodegradable had something to do with breakdown of materials but could not clearly explain the concept enough to be judged as having an adequate grasp of it.
Environmental Awareness Baseline Survey – Cleaning and Greening of Cambridge
29
9. Name three health effects associated with waste pollution?
Name three health effects associated with waste pollution?
Partially Correct34.4%
Don't know25.6%
Correct36.7%
Incorrect3.3%
Correct Answer: Diarrhoea, Fungal Infections, Typhoid fever among others Despite the fact that more than a quarter of the population stated that they did not know the names of any health effects of waste pollution, over 70 % were familiar with many of the health consequences of waste pollution, though many (the 34.4 % classified as partially correct) could only name one or two instead of the three required. Thirty-six point seven percent of the population were able to give the three health effects asked for in the question. The 3.3 % who gave incorrect responses seem to have been through a misunderstanding of the question or probably a genuine lack of knowledge of the manes of any particular health effect, as the answers given were in very general terms of ‘disease’ and ‘sickness’. 10. What, do you consider to be the two main sources of air pollution and poor air quality?
What, do you consider to be the two main sources of air pollution and poor air quality?
Partially Correct35.6%
Don't know22.2%
Correct33.3%
Incorrect8.9%
Environmental Awareness Baseline Survey – Cleaning and Greening of Cambridge
30
Correct Answer: Motor vehicle exhaust and Smoke from factories. Burning garbage was also accepted. A third of the population correctly answered this question. While just over another third gave at least one of the two main sources. Of particular note is that one of the most common source given was the burning of garbage. This could be based on people’s first hand experiences where they have seen the serious effects of this activity on air quality. 11. Name some of the consequences to the environment from air pollution? (up to four)
Name some of the consequences to the environment from air pollution?
Incorrect12.2%
Correct21.1%
Don't know52.3%
Partially Correct14.4%
Correct Answer: Ozone layer depletion; Global warming; Rise in sea levels;
Flooding; Weather extremes; Acid rain, among others. Although more than a half of the population indicated that they did not know any of the consequences to the environment caused by air pollution. Among the proportion of the population that gave correct (21.1 %) or partially correct (14.4 %) answer to this question, there appears to be a fairly good understanding of the consequences. The responses classified as partially correct were those that gave only one of the expected correct answers. Twelve point two percent of the respondents gave an incorrect response to the question. The most common incorrect responses to this question were for the respondents to give consequences related to human health instead of consequences to the environmental. This may have come about because of some individuals’ misinterpretation of the question and/or their thinking that environmental consequences also included health consequences.
Environmental Awareness Baseline Survey – Cleaning and Greening of Cambridge
31
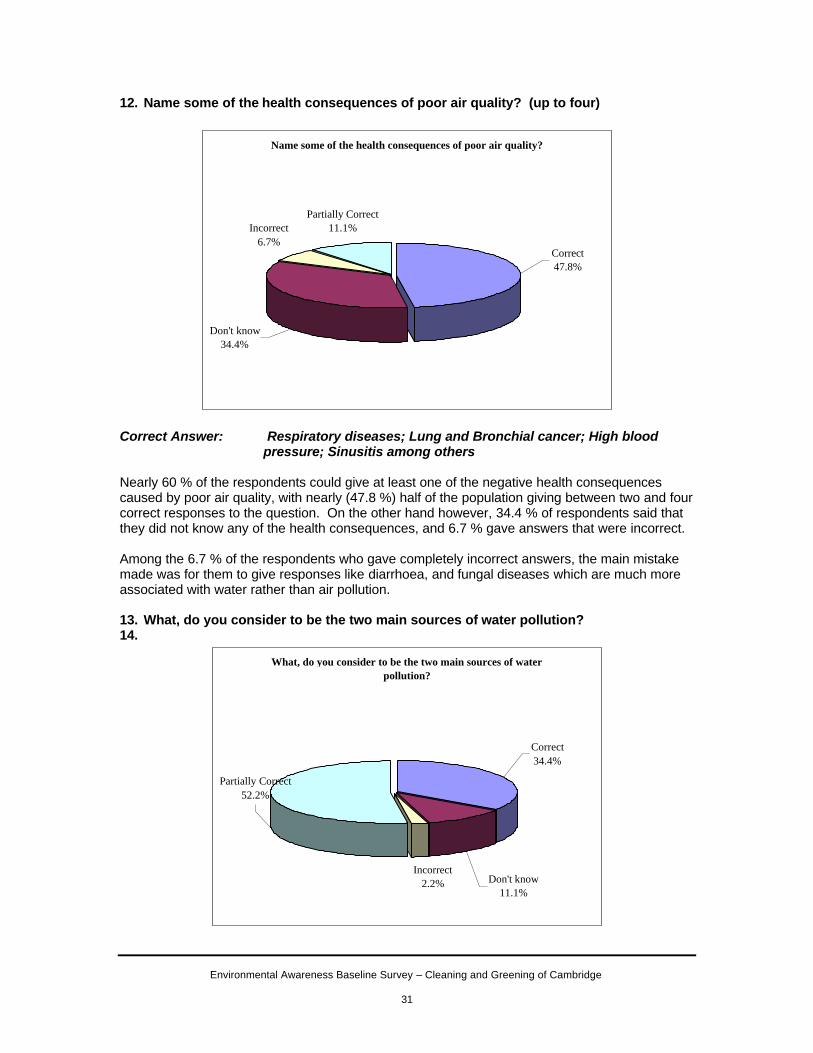
12. Name some of the health consequences of poor air quality? (up to four)
Name some of the health consequences of poor air quality?
Incorrect6.7%
Correct47.8%
Don't know34.4%
Partially Correct11.1%
Correct Answer: Respiratory diseases; Lung and Bronchial cancer; High blood pressure; Sinusitis among others Nearly 60 % of the respondents could give at least one of the negative health consequences caused by poor air quality, with nearly (47.8 %) half of the population giving between two and four correct responses to the question. On the other hand however, 34.4 % of respondents said that they did not know any of the health consequences, and 6.7 % gave answers that were incorrect. Among the 6.7 % of the respondents who gave completely incorrect answers, the main mistake made was for them to give responses like diarrhoea, and fungal diseases which are much more associated with water rather than air pollution. 13. What, do you consider to be the two main sources of water pollution? 14.
What, do you consider to be the two main sources of water pollution?
Incorrect2.2%
Correct34.4%
Don't know11.1%
Partially Correct52.2%
Environmental Awareness Baseline Survey – Cleaning and Greening of Cambridge
32
Correct Answer: Improper waste disposal and pesticide runoff More than 85 % of persons knew at least one of the main sources of water pollution with the most common response being the improper disposal of garbage and human waste in rivers and gullies. Most persons gave these (in one form or the other) as one of their answer to the question. Less knowledge was exhibited for pollution caused by pesticide and fertilizer runoff into rivers and streams. Of note is the significantly high proportion of persons who felt that water pollution was being caused by people defecating in or throwing faeces in rivers and gullies. It leads one to consider how much of a problem this practice may be in some areas of the community. The answers of those persons who gave only one correct response were classified as partially correct. Only in those cases where two correct responses were given were the answers deemed correct. 15. Name some of the health consequences of water pollution? (up to four)
Name some of the health consequences of water pollution?
Don't know20.0%
Correct74.4%
Partially Correct5.6%
Correct Answer: Diarrhea; Fungal diseases; Blood diseases Outside of those persons (20 % of the respondents) who said outright that they did not know any of the health consequences of water pollution, every one of the other 80 % of the population knew of at least one correct health consequence with 74 % of persons giving the two required correct responses. Additionally for those who were classified as partially correct, this was mainly because of respondents giving only one response when two were required, rather than giving two responses, one of which was incorrect. Generally, persons seem to be well informed about many of the water transmitted fungal, gastric and blood diseases associated with water pollution.
Environmental Awareness Baseline Survey – Cleaning and Greening of Cambridge
33
16. What do you consider to be the best way to dispose of plastic?
What do you consider to be the best way to dispose of plastic?
Partially Correct2.2%
Don't know5.6%
Correct50.0%
Incorrect42.2%
Correct Answer: Reuse/Recycle Although half of the respondents knew the correct way to dispose of plastics, it was alarming that in addition to the 5.6 % that did not know, 42.2 % gave completely incorrect answers. It was clear from these responses that a significant amount of people in the community felt that the proper way of disposing of plastics was by burning or burying, not realizing that these methods were particularly deleterious to the environment. Among the 2.2 % who were classified as partially correct was the feeling that some plastics should be recycled and others burned or buried. 17. What hillside farming practices do you think are bad for the environment and
contribute to the degradation of the watersheds?
What hillside farming practices do you think are bad for the environment and contribute to the degradation of the watersheds?
Partially Correct44.4%
Don't know18.9%
Correct32.2%
Incorrect4.4%
Environmental Awareness Baseline Survey – Cleaning and Greening of Cambridge
34
Correct Answer: Slash & burn; wide scale cutting down of trees; among others. The highest proportion of the population (44. 4 %, classified as partially correct) knew only one of the correct responses for this question, with the most frequent responses being the burning of the hillsides and the cutting down of trees. A further 32.2 % were able to give multiple correct responses. Also, a fairly significant proportion of 18.9 % responded that they did not know any arming practice that contributed to the degradation of the watersheds. In most cases however these seem to be as a part of a general response where the respondent just said that they did not know anything about farming. 18. What good hillside farming practices are effective in lessening soil erosion?
What good hillside farming practices are effective in lessening soil erosion?
Partially Correct41.1%
Don't know18.9%
Correct37.8%
Incorrect2.2%
Correct Answer: Land stabilization and soil conservation measures including
terracing, trenches; strip cropping; planting tree crops among others.
The majority of respondents correctly felt that the planting of more trees would result in lessened soil erosion on the hillsides. This was the most popular response among the 37.8 % of the population that got the question completely correct by naming more than one good practice and the 41.1 % who named one of them. Another popular response was the use of trenches.
Environmental Awareness Baseline Survey – Cleaning and Greening of Cambridge
35
19. How should household or other garbage be disposed of?
How should household or other garbage be disposed of?
Partially Correct4.4%
Don't know4.4%
Correct72.3%
Incorrect18.9%
Correct Answer: Placing in bin or skip for collection by the relevant authority. The proper method for the disposal of household garbage was fairly well known by approximately 75 % of the community. However 18.9 % gave responses that were classified as incorrect. It was indicated by the interviewers that in some sections of the community that there were no access to any organized garbage collection and disposal system, hence many persons in these areas were still using external garbage heaps or burying garbage. Thus to many of the 18.9 % of the population who gave an incorrect response to this question, their responses of ‘garbage heap’, ‘burying’ or ‘burning’, is quite normal to them as they do not have any other alternatives and have been using these practices for a long time. For the 4.4 % who gave responses that were classified as partially correct, they indicated the proper placement of some garbage in a bin for proper collection, but they also additionally indicated burning and burying of garbage as being acceptable ways of garbage disposal. Hence their answers were classified as partially correct.
Environmental Awareness Baseline Survey – Cleaning and Greening of Cambridge
36
20. What do you consider to be the main function of trees in our environment?
What do you consider to be the main function of trees in our environment?
Provide food and raw materials for buildings/furniture; Assist in promoting rainfall; Provide recreational areas, among others.
Although 6.7 % of the population stated that they did not know the main functions of trees, and 1.1 % gave responses that were considered incorrect, there was very good knowledge among the population about the main functions of trees, with a fair mix of the correct responses listed above coming from the respondents There were however, a few practical though environmentally negative responses to what are the main functions of trees, which if not very well managed can result in serious environmental consequences. . These were, the trees’ main function being for providing firewood and for the burning of charcoal.
Environmental Awareness Baseline Survey – Cleaning and Greening of Cambridge
37
Conclusion Overall, although there is some amount of knowledge in the community about environmental issues, it is clear that there is a lot of room for increasing community members’ awareness about these issues. There are wide knowledge gaps pointed to by the large percentage of ‘Don’t know’ and incorrect responses to many of the questions. This indicates the need for increased public awareness and focussed messages on the environment and its conservation and management especially in a sensitive watershed area such as that in which Cambridge is located. There also appear to be a strong sense of wanting to know, among the community members. This suggests that a well-planned public education and outreach will find a willing audience among many in the community, with a subsequent increased awareness of the relevant issues.
Environmental Awareness Baseline Survey – Cleaning and Greening of Cambridge
38
APPENDIX A
Module 2 - Data Tables for the Graphs Presented in the Text
Percentage of Respondents
Question 1
Correct 1.11%
Don't know 80.00%
Incorrect 14.44%
Partially Correct 4.44%
Question 2
Correct 11.11%
Don't know 60.00%
Incorrect 25.56%
Partially Correct 3.33%
Question 3
Correct 4.44%
Don't know 66.67%
Incorrect 18.89%
Partially Correct 10.00%
Question 4
Correct 1.11%
Don't know 72.22%
Incorrect 26.67%
Question 5
Correct 34.44%
Don't know 37.78%
Incorrect 2.22%
Question 6a
Correct 78.89%
Don't know 18.89%
Incorrect 2.22%
Partially Correct 25.56%
Question 6b
Correct 17.78%
Don't know 75.56%
Incorrect 2.22%
Environmental Awareness Baseline Survey – Cleaning and Greening of Cambridge
39
Percentage of Respondents
Partially Correct 4.44%
Question 6c
Correct 15.56%
Don't know 73.33%
Incorrect 8.89%
Partially Correct 2.22%
Percentage of Respondents
Question 7 (i) (ii) (iii) (iv) (v)
Correct 18.89% 14.44% 16.67% 8.89% 7.78%
Don't know 50.00% 64.44% 64.44% 70.00% 67.78%
Incorrect 31.11% 21.11% 18.89% 21.11% 24.44%
Percentage of Respondents
Question 8
Correct 7.8%
Don't know 74.4%
Incorrect 3.3%
Partially Correct 14.4%
Question 9
Correct 36.7%
Don't know 25.6%
Incorrect 3.3%
Partially Correct 34.4%
Question 10
Correct 33.3%
Don't know 22.2%
Incorrect 8.9%
Partially Correct 35.6%
Question 11
Correct 21.1%
Don't know 52.2%
Incorrect 12.2%
Partially Correct 14.4%
Question 12
Correct 47.8%
Don't know 34.4%
Environmental Awareness Baseline Survey – Cleaning and Greening of Cambridge
40
Percentage of Respondents
Incorrect 6.7%
Partially Correct 11.1%
Question 13
Correct 34.4%%
Don't know 11.1%%
Incorrect 2.2%%
Partially Correct 52.2%%
Question 14
Correct 74.4%
Don't know 20
Partially Correct 5.6%
Question 15
Correct 50
Don't know 5.6%
Incorrect 42.2%
Partially Correct 2.2%
Question 16
Correct 32.2%
Don't know 18.9%
Incorrect 4.4%
Partially Correct 44.4%
Question 17
Correct 37.8%
Don't know 18.9%
Incorrect 2.2%
Partially Correct 41.1%
Question 18
Correct 72.2%
Don't know 4.4%
Incorrect 18.9%
Partially Correct 4.4%
Question 19
Correct 74.4%
Don't know 5.6%
Incorrect 2.2%
Partially Correct 17.8%
Environmental Awareness Baseline Survey – Cleaning and Greening of Cambridge
41
APPENDIX B
The Survey Questionnaire Module 1 1. Name of Respondent ___________________________________________________ 2. Address of Respondent ___________________________________________________ 3. Respondent Information
# of persons living in household Age
(years) Marital status Sex Percentage of respondents Under 18
Environmental Awareness Baseline Survey – Cleaning and Greening of Cambridge
42
5. Which radio stations do you listen to most? (Not more than three). If none tick here ?
At what time? (tick any that applies) Station Name
Early morning (5.00 – 9.00)
Mid morning (9.00 – 12.00)
Early afternoon (12.00 – 5.00)
Late afternoon (5.00 – 7.00)
Evening (7.00 – 12.00)
Pre dawn (12.00 – 5.00)
6. What television station do you watch most often? (all that applies). If none tick here ?
At what time? (tick any that applies) Station Name
Early morning (5.00 – 9.00)
Mid morning (9.00 – 12.00)
Early afternoon (12.00 – 5.00)
Late afternoon (5.00 – 7.00)
Evening (7.00 – 12.00)
Pre dawn (12.00 – 5.00)
TVJ
CVM
Cable – Channel 25
Cable – other
Other
7. Do you read the newspaper on a regular basis? Yes ? No ?
If Yes, which one(s). (tick where applicable)
Daily Gleaner
Sunday Gleaner
Daily Star
Week-end Star
Daily Observer
Week-end Observer
Herald
Western Mirror
Other (specify) ____________________________________
8. Are you or any member of your household a member of any community groups?
Yes ? No ? If Yes, please give details.
Environmental Awareness Baseline Survey – Cleaning and Greening of Cambridge
43
Group Name/Type Frequency of Meetings Position in Group Remarks
9. Do you have any regular interactions with any of the following agencies? (tick for yes) 10.
RADA St. James Parish Council Police Youth Club
Basic School PTA Jamaica Constabulary Force Women’s’ Group
NEPA Special Constabulary Force Public Health Dept.
SDC Western Parks & Markets NSWMA
Environmental Awareness Baseline Survey – Cleaning and Greening of Cambridge
44
Module 2 Name of Respondent __________________________________________________________ Please answer the following questions to the best of your ability. Note however that this is not a test and it is not expected that you will know most of the answers. If you do not know, do not hesitate to say so. 1. What is the name of the Act that regulates Public Cleanliness?
________________________________________________________ Don’t know ? 2. Which agency is responsible for the collection of garbage in Jamaica?
________________________________________________________ Don’t know ? 3. Please name two agencies responsible for the protection of forests and the watershed.
_______________________________________________________ Don’t know any ?
4. How many watershed units are there in Jamaica? _________ Don’t know ? 5. Can you name two of these watersheds? ________________________________________
__________________________________________________________________________ 6. Do you know what the following acronyms are short for?
7. Do you know the amount of the fine for each of the following?
Action Fine $ Don’t know
Dropping or otherwise depositing and leaving any litter in any public place.
Willfully breaking any bottle or glass or any article made of glass in or on any public place without lawful authority or reasonable excuse.
Throwing, dropping or otherwise depositing or leaving any litter in any premises owned or occupied by another person without consent of that person.
Erecting, displaying(whether by writing or marking or otherwise), depositing or affixing anything in a public place or on any other building, wall, fence, or structure abutting or adjoining a public place, in such circumstances as to cause, contribute to or tend to the defacement of that place, building, wall, fence or structure as the case may be.
Acronym Meaning Don’t Know
NWC
NEPA
NSWMA
Environmental Awareness Baseline Survey – Cleaning and Greening of Cambridge
45
Action Fine $ Don’t know
Employing or recruiting person(s) who erect, play (whether by writing or marking or otherwise) depositing or affixing anything in a public place or on any building, wall, fence, or structure abutting or adjoining a public place in such circumstances as to cause, contribute or tend to the defacement of that place, building, wall, fence, or structure as the case may be
8. What does the word biodegradable means? _______________________________________
16. What hillside farming practices do you think are bad for the environment and contribute to the
degradation of the watersheds? ________________________________________________ __________________________________________________________________________
17. What good hillside farming practices are effective in lessening soil erosion?
19. What do you consider to be the main function of trees in our environment? 1_________________________________________________________________________ 2_________________________________________________________________________ 3_________________________________________________________________________ 4_________________________________________________________________________
Environmental Awareness Baseline Survey – Cleaning and Greening of Cambridge
47
Additional comments _____________________________________________________________________________ _____________________________________________________________________________ _____________________________________________________________________________ _____________________________________________________________________________ _____________________________________________________________________________ _____________________________________________________________________________ _____________________________________________________________________________ _____________________________________________________________________________ Name of Interviewer ___________________________ Checked by _______________________