29


Environmental Technology Verification Solids Separation Test Plan
TEST PLAN FOR THE VERIFICATION OF THE BROME AGRI MAXIMIZER SEPARATOR
FOR SEPARATION OF MANURE SOLIDS FROM FLUSHED SWINE WASTE
Prepared for: NSF International P. O. Box 130140
Ann Arbor, MI 48113-0140734-769-8010 800-673-6275
with support from the U.S. Environmental Protection Agency
Environmental Technology Verification Program
Prepared by: North Carolina State University
Department of Biological and Agricultural Engineering Animal and Poultry Waste Management Center
Raleigh, NC 27695
Brome Agri Sales Ltd 01/15/03 i

Brome Agri Sales Ltd 01/15/03 ii
Environmental Technology Verification Solids Separation Test Plan
Test Plan for the USEPA/NSF Environmental Technology Verification Program
ETV Water Quality Protection Center
John Brown John J. Classen Brome Agri Sales Ltd. North Carolina State University Phone: 450-266-5323 Biological & Agricultural Engineering Fax: 450-266-5708 Phone: 919-515-6800
Fax: 919-515-7760
Thomas G. Stevens Raymond M. Frederick NSF International U.S. Environmental Protection Agency Phone: 734-769-5347 Phone: 732-321-6627 Fax: 734-769-5195 Fax: 732-321-6640

Brome Agri Sales Ltd 01/15/03 iii
Environmental Technology Verification Solids Separation Test Plan
Verification Test Plan
Brome Agri Maximizer Separator for Separation of Manure Solids from Flushed Swine Waste
TABLE OF CONTENTS
1 PROJECT DESCRIPTION AND OBJECTIVES.................................................................... 1 1.1 Executive Summary........................................................................................................... 11.2 General Description of the Equipment .............................................................................. 2 1.3 Testing Location................................................................................................................ 3 1.4 Statement of Verification Objectives ................................................................................ 3
2 PROJECT ORGANIZATION.................................................................................................. 5 2.1 Roles and Responsibilities................................................................................................. 6
2.1.1 Verification Organization (NSF) ................................................................................ 6 2.1.2 U.S. Environmental Protection Agency (USEPA) ..................................................... 6 2.1.3 Technology Panel........................................................................................................ 62.1.4 Testing Organization (NCSU) .................................................................................... 7 2.1.5 Vendor – Brome Agri Sales Ltd. ................................................................................ 7
3 EQUIPMENT CAPABILITIES AND DESCRIPTION .......................................................... 8 3.1 Description of Equipment.................................................................................................. 83.2 Engineering and Scientific Concepts on which the Equipment is Based .......................... 8 3.3 Operation of the Maximizer Separator .............................................................................. 8 3.4 Nature, Production Rates, and Handling of Waste Material ............................................. 8 3.5 Limitations of the Equipment ............................................................................................ 8
4 EXPERIMENTAL DESIGN.................................................................................................... 9 4.1 Quantitative and Qualitative Evaluation Criteria .............................................................. 9 4.2 Verification Testing Phases ............................................................................................... 9
4.2.1 Start-Up Period ........................................................................................................... 94.2.2 Operational Phase of Verification Testing................................................................ 10
4.3 Sampling Methods........................................................................................................... 11 4.4 Supplemental Analyses.................................................................................................... 124.5 Analytical Procedures...................................................................................................... 12 4.6 Mass Balance Calculations.............................................................................................. 13
5 QUALITY ASSURANCE PROJECT PLAN........................................................................ 15 5.1 Reporting Requirements .................................................................................................. 15 5.2 Methodology for Use of Blanks ...................................................................................... 16 5.3 Measurement of Accuracy in a Matrix Spike Sample..................................................... 17 5.4 Measurement of Precision ............................................................................................... 17 5.5 External Quality Control Checks..................................................................................... 17 5.6 Data Correctness.............................................................................................................. 17
5.6.1 Representativeness.................................................................................................... 17 5.6.2 Completeness ............................................................................................................ 17 5.6.3 Accuracy ................................................................................................................... 18 5.6.4 Precision.................................................................................................................... 18
5.7 Calculation of Data Quality Indicators............................................................................ 18
Brome Agri Sales Ltd 01/15/03 iv
Environmental Technology Verification Solids Separation Test Plan
5.7.1 Precision.................................................................................................................... 18 5.7.2 Relative Percent Deviation ....................................................................................... 18 5.7.3 Accuracy ................................................................................................................... 18 5.7.4 Completeness ............................................................................................................ 19
5.8 Data Reporting................................................................................................................. 19 5.8.1 Project Reports.......................................................................................................... 19 5.8.2 Audit Reports ............................................................................................................ 19
5.9 Corrective Action Plan .................................................................................................... 20 6 DATA REPORTING, REDUCTION, AND VALIDATION................................................ 21 7 SAFETY CONSIDERATIONS ............................................................................................. 22 8 REFERENCES....................................................................................................................... 23
Environmental Technology Verification Solids Separation Test Plan
1 PROJECT DESCRIPTION AND OBJECTIVES 1.1 Executive Summary This document is a test plan for the evaluation of the Brome Agri Sales, Ltd Maximizer Separator. The model to be tested is the MAX 1016, 16’ separator, sitting in a MAX-1400 stainless steel tank assembly, with a MAX-1500 stainless steel winching assembly, hereinafter referred to as the Maximizer. Verification activities for the Maximizer shall be conducted over a four-week period under the guidance of the U.S. Environmental Protection Agency’s Environmental Technology Verification (ETV) Program. In particular, the evaluation will be overseen by the ETV Water Quality Protection Center, which is cooperatively managed by the U.S. Environmental Protection Agency (USEPA) and NSF International (NSF), formerly the National Sanitation Foundation. North Carolina State University (NCSU) shall act as the Testing Organization and provide technical assistance during the testing process.
USEPA instituted the ETV Program to verify the performance characteristics of commercial-ready environmental technologies through the evaluation of objective and quality-assured data. Managed by USEPA’s Office of Research and Development, ETV was created to substantially accelerate the entrance of innovative environmental technologies into the domestic and international marketplaces. ETV provides purchasers and permitters of technologies with an independent and credible assessment of the technology they are purchasing or permitting, thereby reducing financial risk associated with the selection of technologies for specific applications and facilitating technology authorization. Technology manufacturers benefit from increased acceptance of their products arising from a USEPA-reviewed, independent report supporting their claims. Participation on the part of technology manufacturers is strictly voluntary.
The ETV Water Quality Protection Center is guided by the expertise of stakeholder groups. Stakeholder groups consist of representatives of key customer groups for the particular technology sector, including buyers and users of technology, developers and vendors, state and federal regulatory personnel, and consulting engineers. All technology verification activities are based on testing and quality assurance protocols that have been developed with input from the major stakeholder/customer groups.
NSF International is an independent, not-for-profit, non-governmental organization, dedicated to being the leading global provider of public health and safety-based risk management solutions while serving the interests of all stakeholders. NSF develops standards, provides educational services, and offers superior third-party conformity assessment services, especially in the areas of public health and the environment. In addition to well-established certification programs, NSF specifically responds to and manages research projects, one-time evaluations and special studies.
NSF is the verification partner organization for two ETV Centers: the Drinking Water Systems Center and the Water Quality Protection Center. The goal of the ETV Water Quality Protection Center is to verify the performance of commercial-ready technologies used to protect ground and surface waters from contamination. This test plan is designed to meet the goals of the Water Quality Protection Center concerning the verification of separation technologies for flushed Brome Agri Sales Ltd 01/15/03 Page 1 of 24

Environmental Technology Verification Solids Separation Test Plan
swine waste. Testing conducted under the ETV program using this test plan does not constitute NSF or USEPA certification or approval of the product tested. Rather, it recognizes that the performance of the equipment has been determined using an objective, quality-assured process. ETV reports are signed by USEPA and NSF representatives prior to being prepared for final distribution.
This test plan is designed to determine the effectiveness of the Maximizer Separator in separating solids from liquid swine waste with between approximately 0.5% and 1.0% total solids. Separation processes partition a waste stream into two streams, a liquid phase and a solid phase. As no process is totally efficient, the liquid phase contains some solid material and the solid phase contains some water. The chemical constituents in the waste will also partition between the two phases based on the physical and chemical conditions imposed by the solids separation system. Because subsequent treatment operations to process both the liquid and solid waste streams must be based on their respective characteristics, the performance of this equipment shall be determined in terms of waste constituent partitioning.
The overriding principle of this test is an accounting of the mass of each waste stream and its constituents. The critical requirement is measurement of both volume and concentration for each component of interest. Therefore, tests will be run using a fixed volume of wastewater from a mixing tank. In this way, the partitioning of the constituents between the liquid and solid phases can be determined.
After setup by the vendor, with assistance from NCSU staff, the equipment will be run for a short time to ensure proper operation (see section 4.2.1, Start-Up Period). Verification testing will take place three times per week over a four-week period according to the evaluation procedures described throughout this document.
1.2 General Description of the Equipment The Maximizer Separator is an inclined screen solids separator. The lower end of the inclined screen rests in a stainless steel tank assembly. Wastewater containing manure solids is pumped into the primary tank, which is part of the stainless steel tank assembly, at a rate of between 1,800 and 2,500 gallons per hour. The waste is then transported up an inclined screen using a wiping/carrying system consisting of a series of thirty-two rubber paddles attached to chains driven by an electric motor. The inclined screen is made up of two eight foot long sections, a lower section and an upper section, each with a different sized perforated metal screen. As the waste is transported up the inclined screen, water is drained through the perforations into a drip pan that drains into a secondary tank. Once the waste reaches the top of the screen, it is processed through a squeezing mechanism consisting of a worm screw followed by a perforated cylinder for final drying of the removed solids.
Brome Agri Sales Ltd 01/15/03 Page 2 of 24

Environmental Technology Verification Solids Separation Test Plan
The following is a summary of the characteristics of the Maximizer Separator:
Type Inclined screen, bottom feed Screen Length 16 ft Initial Screen Opening 0.031 in Secondary Screen Opening 0.062 in Maximum capacity 2,500 gallons per hour
The critical design parameters for scale-up and scale-down of the technology are the length and number of screens and the opening size of the screens. Detailed daily operation is described in section 4.2.
1.3 Testing Location Verification testing shall be conducted at the North Carolina State University Lake Wheeler Road Field Laboratory Swine Educational Unit. This farm is designed and operated as a research and teaching facility. The farm capacity is 250 sows for farrow to wean and can finish approximately half of the pigs weaned each year. Flush waste routinely flows to an anaerobic lagoon for treatment and flush water is recycled from the lagoon. Wastewater can be diverted to a 2,500 gal glass-lined tank of 12 ft diameter and 10 ft depth. This tank is equipped with a 5 hp mixer with a 2 ft diameter impeller. This system is designed to keep solids suspended with minimum turbulence so aeration and physical changes to the manure are minimized. The system is also designed to provide sufficient wastewater for testing with characteristic concentrations that are typical of those encountered in the industry. To eliminate problems and errors associated with flow measurement and sampling, the entire quantity of waste generated over a two-day period will be collected in the glass-lined tank. This entire volume of wastewater will be sent to the test unit. In the same manner, the entire quantity of liquid that is discharged from the test unit will be collected in the effluent tank and the entire quantity of separated solids will be collected on the adjacent concrete pad.
1.4 Statement of Verification Objectives
The Maximizer Separator provides solid-liquid separation for swine manure. Qualitative operation and maintenance requirements of the Maximizer Separator will be recorded. Operation and maintenance parameters to be measured include, but are not limited to, ease of cleaning, frequency of operational problems during testing, and extent of required operator oversight. Details of the type of operating and maintenance data/observations that will be collected are listed in Section 4.1. Because the test period lasts only four weeks, the verification process does not indicate what long term operational problems are likely to occur for the technology. Power consumption shall also be verified as an important component of equipment performance.
Although the primary purpose of this equipment is to remove and recover solid material, the use of this equipment will have an impact on the entire waste management system. It is therefore necessary to quantify the effect this equipment has on the partitioning of other waste constituents of interest such as nitrogen, phosphorus, potassium, copper, zinc, and others. Technical professionals will need this information to determine the value of the separated material as well
Brome Agri Sales Ltd 01/15/03 Page 3 of 24

Environmental Technology Verification Solids Separation Test Plan
as to design subsequent waste treatment and land application operations.
Specific objectives of the verification test are to:
1. Determine the separation efficiency of the Maximizer Separator with regard to the mass of solids;
2. Characterize the separated solids and resulting liquid stream with respect to nutrients, metals, and pathogen indicators;
3. Gather qualitative operation and maintenance requirements of the system.
Brome Agri Sales Ltd 01/15/03 Page 4 of 24

2
Environmental Technology Verification Solids Separation Test Plan
PROJECT ORGANIZATION This section defines the participants in this technology verification and their roles and responsibilities. The key organizations in the technology verification include the Verification Organization (NSF), the Testing Organization (NCSU), the Vendor (Brome Agri Sales Ltd.), and USEPA.
The technology verification shall be conducted by the Biological & Agricultural Engineering Department at NCSU. The Environmental Analysis Laboratory in NCSU’s Biological & Agricultural Engineering Department shall conduct all component analyses.
The main NSF and USEPA contacts are:
Tom Stevens, Pilot Manager Maren H. J. Roush, Project Coordinator NSF International NSF International P.O. Box 130140 P.O. Box 130140 Ann Arbor, MI 48113-0140 Ann Arbor, MI 48113-0140 v. 734-769-5347 f. 734-769-5195 v. 734-827-6821 f. 734-769-5195
Ray Frederick, Project Officer United States Environmental Protection Agency 2890 Woodbridge Ave. (MS-104) Edison, NJ 08837-3679 v. 732-321-6627 f. 732-321-6640
The main NCSU contacts are:
J.J. Classen, Associate Professor F.J. Humenik, Coordinator Biological & Agricultural Animal Waste Management Programs, Engineering CALS Campus Box 7625 Campus Box 7927 v: 919-515-6800 f: 919-515-7760 v: 919-515-6767 f: 919-513-1023
Lenord Bull, Associate Director Craig Baird Animal & Poultry Waste Animal Waste Management Programs, Management Center CALS Campus Box 7608 Campus Box 7927 v: 919-515-6836 f: 919-513-1762 v: 919-513-2515 f: 919-513-1023
Brome Agri Sales Ltd 01/15/03 Page 5 of 24
Environmental Technology Verification Solids Separation Test Plan
The solids separator vendor for this technology verification is Brome Agri Sales Ltd. The Brome Agri Sales Ltd contacts for this project are:
John Brown Lee Brock Brome Agri Sales Ltd Brock Equipment and Parts 2389 Route 202 Hwy 264A West Dunham, Quebe JOE 1M0 PO Box 100
Bailey, NC 27807 v: 450-266-5323 f: 450-266-5708 v: 800-849-7569 f: 252-235-4111
2.1 Roles and Responsibilities
The primary roles and responsibilities of each party shall include:
2.1.1 Verification Organization (NSF)
• Coordinate with the Testing Organization to prepare a site-specific test plan; • Coordinate with technical reviewers and Vendor to review the test plan prior to the
initiation of verification testing; • Coordinate with USEPA and the Vendor to approve the final, site-specific test plan; • Review the quality systems of the testing organization and subsequently, qualify the
testing organization; • Oversee the technology evaluation and associated laboratory testing; • Review data generated during verification testing; • Oversee the development of a verification report and verification statement; • Print and distribute the verification report and verification statement; and • Provide quality assurance oversight at all stages of the verification process.
2.1.2 U.S. Environmental Protection Agency (USEPA) This test plan has been developed with financial and quality assurance assistance from the ETV Program, which is overseen by the USEPA’s Office of Research and Development. The verification report generated following this technology verification will be subject to review and approval by USEPA.
2.1.3 Technology Panel A Technology Panel was formed to assist with the development of technology test plans. The Animal Waste Treatment Technology Panel has ensured that data to be generated during verification testing are relevant and that the method of evaluation for different technologies is fair and consistent. This, and all animal waste treatment test plans, is subject to the Panel’s review.
Brome Agri Sales Ltd 01/15/03 Page 6 of 24

Environmental Technology Verification Solids Separation Test Plan
2.1.4 Testing Organization (NCSU)
• Coordinate with the Verification Organization and Vendor relative to preparing and finalizing the Test Plan;
• Conduct the technology verification in accordance with the Test Plan, with oversight by the Verification Organization;
• Analyze all influent and effluent samples collected during the technology verification process, in accordance with the procedures outlined in the Test Plan and attached SOPs;
• Coordinate with and report to the Verification Organization during the technology verification process;
• Provide analytical results of the technology verification to the Verification Organization; and
• If necessary, document changes in plans for testing and analysis, and notify the Verification Organization of any and all such changes before changes are executed.
2.1.5 Vendor – Brome Agri Sales Ltd.
• Assist in the preparation of the technology-specific test plan for technology verification and approve the final version of the test plan;
• Provide a complete field-ready version of the technology of the selected capacity for verification and assist the Testing Organization with installation at the test site;
• Provide start-up services and technical support as required during the period prior to the evaluation;
• Provide technical assistance to the Testing Organization during operation and monitoring of the equipment undergoing verification testing as requested;
• Remove equipment associated with the technology following the technology verification; and
• Provide funding for verification testing.
Brome Agri Sales Ltd 01/15/03 Page 7 of 24
Environmental Technology Verification Solids Separation Test Plan
3 EQUIPMENT CAPABILITIES AND DESCRIPTION 3.1 Description of Equipment The Maximizer Separator is designed to remove suspended solids from swine and other animal waste slurries. It consists of a series of perforated metal screens, rubber paddles that wipe across the screens, and a squeezing mechanism for final drying of the removed solids. The system uses a 2 hp motor to operate the separator, a 3 hp motor to operate the squeezing mechanism, and a ½ hp motor to pump the secondary chamber once per week. The electrical configuration can be adapted to what is needed in a particular installation. The system will be installed at the test site utilizing 240V single-phase power.
3.2 Engineering and Scientific Concepts on which the Equipment is Based According to manufacturer literature, the principle behind the Maximizer Separator solids separation process is simple. Hydrostatic pressure is applied to manure that is in contact with the surface of the separator screen. The manure creates a biological membrane. The membrane forms as a result of mutual attraction of the suspended particles in the manure. The consolidated particles adhere to the screen and seal it off. Rubber paddles gently wiping over the screen at timed intervals momentarily destroy the membrane and allow the liquid to pass through the screen and leave the solids behind. As the paddles move along the screen the solids are carried away allowing the biological membrane to form again. The process then repeats itself over and over. Final dehydration is achieved by the compression of the solids in a squeezing section.
3.3 Operation of the Maximizer Separator
Wastewater is pumped to the primary tank of the Maximizer Separator. The paddles drag the wastewater and solids up the inclined screen. Effluent liquid passes through the screen and is collected in the secondary tank. From there it is flows by gravity or is pumped to storage in the secondary tank. Approximately once per week, or as needed, any solids that accumulate in the secondary tank are pumped back into to the primary tank for separation. Once solids reach the top of the inclined screen, they pass through the squeezing auger to remove excess moisture. The final, dehydrated solids are collected on the ground underneath the squeeze auger or are conveyed away from the unit. The liquid that is removed by the squeeze auger is returned to the primary tank via tubing.
3.4 Nature, Production Rates, and Handling of Waste Material The Maximizer Separator can process between 30 and 42 gallons per minute, depending on solid loadings and required separation performance. The actual flow rate used during the verification test will be determined during equipment set up and will be noted in a memo to be attached as an addendum to this test plan.
3.5 Limitations of the Equipment
The Maximizer Separator is designed to remove the suspended solids fraction of the waste stream. As such, it cannot reduce soluble constituents in the wastewater. The actual removal efficiency for BOD will depend on the ratio of soluble to non-soluble BOD in the influent slurry.
Brome Agri Sales Ltd 01/15/03 Page 8 of 24
Environmental Technology Verification Solids Separation Test Plan
4 EXPERIMENTAL DESIGN 4.1 Quantitative and Qualitative Evaluation Criteria The sampling procedures defined below shall provide the information needed to complete a mass balance on influent and effluent constituents. The mass balance is the basis for the evaluation. The parameters to be measured represent the constituents of interest in solid separation operations. Critical parameters to be determined in liquid streams include pH, conductivity, total organic carbon, ammonia, TKN, total phosphorus, soluble phosphorus, total solids, total suspended solids, volatile solids, chloride, potassium, copper, and zinc. The same parameters shall be measured in the recovered solids with the exception of conductivity, total organic carbon, TKN, and total suspended solids. In lieu of total organic carbon and TKN measurements in the recovered solids, total carbon and total nitrogen shall be determined by the combustion method. In addition, bulk density shall be determined. Because chloride is conserved through solid separation operations, it is included as a check on the mass balance. The recovery of chloride represents the maximum recovery of parameters in a given operation or test.
In addition to the parameters for mass balance determination, one sample per week will be taken from the influent, effluent, and recovered solids for the determination of E. coli bacteria as an indication of the pathogen load.
Power consumption by the technology shall be verified, as it is an important component of equipment performance. Current and voltage will be monitored by an Extech, Model 380940 clamp-on power datalogger that also measures voltage. This is a digital device that is calibrated at the factory and does not require field calibration. The time of operation will be determined by start and stop times recorded as part of the daily log. From this information, the total power will be calculated.
In addition, operation and maintenance requirements of the Maximizer Separator during the test period shall be evaluated on a qualitative basis. Important considerations such as ease of cleaning, time required for cleaning, ease of performing inspections, frequency of operational problems during testing, completeness of the O&M Manual, and extent of required operator oversight will be considered.
Control system features shall be verified during the test period. The emergency stop pushbutton shall be activated during operation of the Maximizer Separator to verify that it disables the drive/motor. The three-way switch between auto, off, and manual operation as well as the float switch mechanism will tested at least during the set up phase with water.
4.2 Verification Testing Phases
4.2.1 Start-Up Period
Prior to testing, the Maximizer Separator shall be operating properly as determined by observation of the vendor. The set up period shall be limited to five days to accommodate scheduling and ensure the site and program are not used for research and development. Test site personnel shall determine the specific time of day for sampling, considering availability of staff, access to the analytical laboratory, availability of vendor personnel, and the needs of the farm
Brome Agri Sales Ltd 01/15/03 Page 9 of 24

Environmental Technology Verification Solids Separation Test Plan
staff. The schedule during the start-up period will be adjusted to accommodate the installation of the unit and initiation of its operation. NCSU personnel will be available on the scheduled arrival date to facilitate set up of the unit and ensure proper plumbing and electrical connections. Samples for which results are required prior to the start of testing must be transported to the laboratory before the end of business on the second day of set up, as samples taken to the laboratory after that time might not be processed prior to the start of the verification testing.
4.2.2 Operational Phase of Verification Testing The test period for the verification of solids separation technologies under this test plan is 33 days, consisting of a maximum of five days for technology set up and determination by the vendor of valid operation and 28 days of testing. Sampling and evaluation procedures shall be carried out three days per week (Monday through Friday) for a period of at least four weeks of valid operation. A total of 12 samples of the influent, effluent, and recovered solids shall be collected, one set on each of the twelve sampling days during the verification period. Valid operation means that procedures and equipment are operating correctly (pumps working, hoses intact, waste flowing) but is not an indication of technology performance. Interruption of testing for inclement weather or any other reason shall not automatically invalidate the verification test. The Verification Organization shall be notified in advance of anticipated interruptions in the verification test schedule.
For safety considerations, two NC State personnel shall be present during each testing operation. During the evaluation period, wastewater from the 250 sow farrow-to-finish unit shall be diverted to the influent-mixing tank. Floating solids will be excluded (expanded metal screen) because they are characteristic of sows rather than finishing pigs, which are the source of most of the flushed swine waste in production systems. Exclusion of the floating solids also allows more effective mixing in the influent tank with minimum agitation to minimize parameter changes and provide a homogeneous wastewater for determining mass input to test equipment. The testing shall be done as a batch process. After no more than 30 minutes in the influent-mixing tank, the wastewater shall be pumped to the separator at the vendor-recommended flow rate for the verification test. A 7.5 hp, 208 volt, centrifugal pump shall be used, capable of passing solids up to 1.5 inches in diameter. Liquid effluent shall be collected in the effluent collection tank. All of the solids shall be collected below the discharge apparatus of the unit in a separate container of known volume, which can be weighed. Measurements shall include total volume of wastewater entering the unit, total volume of wastewater leaving the unit, total weight of solids recovered from the unit, and concentrations of each measured component. The volume entering and leaving the unit shall be based on the dimensions of the mixing tank and the receiving tank. The solids shall be collected in large containers and the total weight of solids shall be determined using appropriate scales at the testing location. Concentrations of the quality parameters shall be determined by laboratory analysis.
It is preferable that the verification testing begin on a Monday. The daily operation of the verification test will be consistent to the extent possible, with testing taking place during the morning hours. At the start of each test day, the separator shall be inspected for unsafe conditions and to verify that manure has not crusted over the screen since the last operation. If the daily inspection indicates an unsafe condition, the unit shall not be started until that condition is corrected. If a crust has developed, the unit shall be washed with a water hose prior to start up.
Brome Agri Sales Ltd 01/15/03 Page 10 of 24
Environmental Technology Verification Solids Separation Test Plan
Once the inspection is complete, wastewater flow shall be started and the unit shall begin operation. The status of the unit shall be recorded on the daily log sheet.
After the last test is complete the unit shall be thoroughly cleaned with a water hose. The approximate volume of solids removed during this cleaning shall be recorded as will the time required to clean the unit. A narrative description of the cleaning process, including any difficulties, shall be included in the report.
Evaluation of operation and maintenance requirements and control system features of the Maximizer Separator shall be conducted during the verification test period, as described in Section 4.1.
4.3 Sampling Methods Triplicate samples shall be taken from the mixing tank for influent samples just before pumping to the Maximizer Separator begins and from the collection tank for liquid effluent samples after mixing for ten minutes (mixing shall be initiated once processing by the Maximizer Separator is complete). After mixing of the separated solids for five minutes, triplicate samples shall be taken from the mass of recovered solids. Each replicate shall be analyzed as an independent sample and the results averaged. Influent and effluent samples shall be taken using separate sampling containers of at least 500 mL capacity suspended on a pole, if needed, approximately two feet below the wastewater surface. The sample(s) shall be transferred immediately to a labeled plastic sample bottle provided by the Environmental Analysis Laboratory. Duplicate analyses for QA/QC purposes shall be taken from the same sample bottle at the laboratory by laboratory staff.
Representative samples from the separated solids shall be produced by dividing the solids into quarter sections and mixing alternate sections. This process will be repeated at least three times. Samples (at least 50 g) shall be taken with a shovel from three different locations within the stacked solids. The mass of the solids samples shall be recorded from the on-site scales.
All samples shall be iced and transported to the Environmental Analysis Laboratory by NCSU staff within one hour after the last sample of a day’s test has been collected. For the standard parameters listed above, no preservation methods are necessary if sample analyses commence within twenty-four hours of sample collection. All samples shall be processed within the holding times recommended in Standard Methods for the Examination of Water and Wastewater (19th
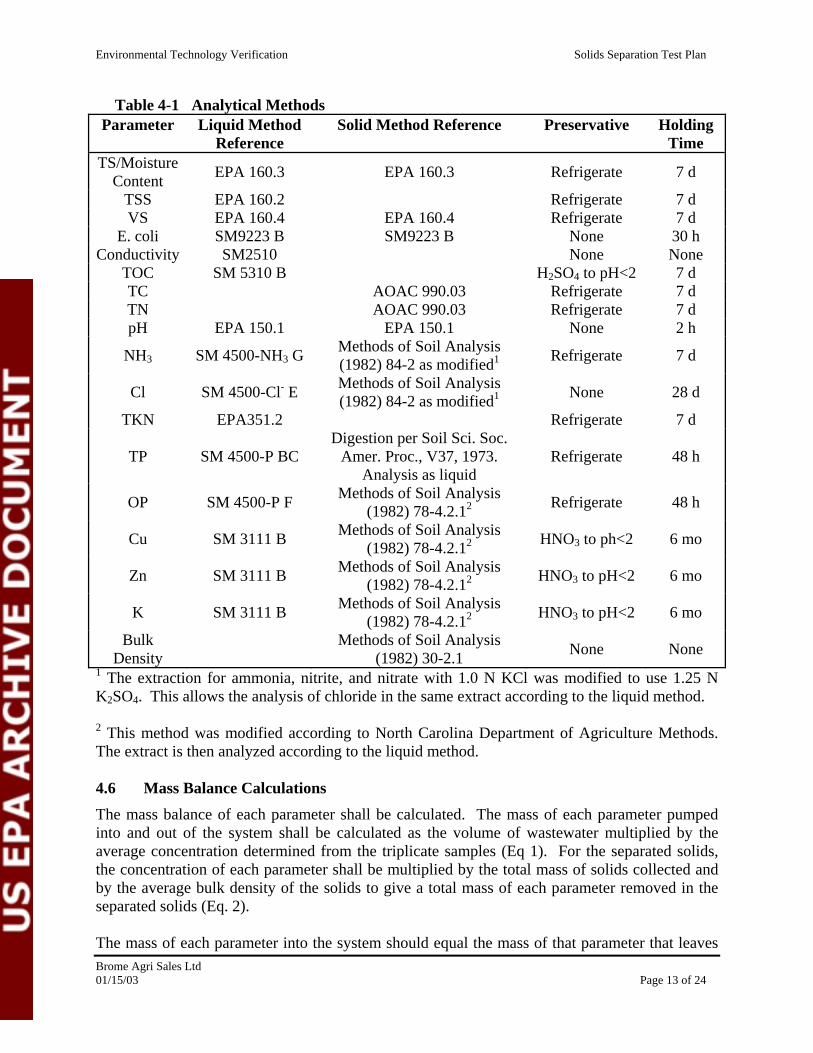
ed.). Unused samples shall be held in refrigerated storage in the Environmental Analysis Laboratory until the QA/QC checks are completed by the laboratory manager. Table 4-1 lists the constituents that will be measured in the influent, effluent, and solid samples collected on each day of operation. Table 4-1 also lists the analytical methods and preservation/holding times for each parameter to be measured.
Each sample container shall be labeled with the vendor name, sample location, date and time of collection, replicate number, and name/initials of the person collecting the sample. Daily sampling records shall also be maintained, recording sample location, date and time of sampling, replicate number, type of sample(s) (influent, effluent, solids), name/initials of the person collecting the sample, and preservative used, and date and time of sample receipt by the
Brome Agri Sales Ltd 01/15/03 Page 11 of 24
Environmental Technology Verification Solids Separation Test Plan
Environmental Analysis Laboratory. Sampling records shall be forwarded to the Verification Organization (via facsimile or overnight carrier) at the completion of each week of testing.
4.4 Supplemental Analyses As described in the generic ETV test plan for evaluating solids separators, other parameters considered non-critical may be added at the discretion and expense of the vendor. These may include, but are not limited to, iron, magnesium, calcium, alkalinity, COD, and sulfate. No supplemental analyses shall be performed for the evaluation of the Maximizer Separator.
4.5 Analytical Procedures The Environmental Analysis Laboratory of the Biological & Agricultural Engineering Department at North Carolina State University shall perform all analyses. Analytical methods used shall be those methods routinely used by the laboratory. These procedures are based on USEPA methods and Standard Methods for the Examination of Water and Wastewater (19th ed.), as modified by the laboratory to accommodate differences in solids content and flow characteristics between water and animal wastewater. The methods are referenced in Table 4-1. SM refers to Standard Methods procedures; EPA refers to USEPA procedures. Detailed operating procedures are maintained by the testing organization.
The analytical methods employed by the Environmental Analysis Laboratory differ from USEPA methods and Standard Methods only in the sizes of some pump tubes and dialyzer, and, in the case of TKN, a reduction in the amount of HgO (from 8g to 1g) used to prevent coating of the flow cells. The determination of bulk density of separated manure solids differs from that of soil only in that the manure solids are not dried at 105oC; the bulk density is determined as is. A 50 mL beaker is filled to the top with the separated solids without packing and leveled. The total weight is recorded. The tare weight of the beaker is subtracted from the total weight and divided by 50 mL. The determination is made three times and the average recorded. Results are expressed as g/mL.
Brome Agri Sales Ltd 01/15/03 Page 12 of 24
Environmental Technology Verification Solids Separation Test Plan
Table 4-1 Analytical Methods Parameter Liquid Method Solid Method Reference Preservative Holding
Reference Time TS/Moisture
Content EPA 160.3 EPA 160.3 Refrigerate 7 d
TSS EPA 160.2 Refrigerate 7 d VS EPA 160.4 EPA 160.4 Refrigerate 7 d
E. coli SM9223 B SM9223 B None 30 h Conductivity SM2510 None None
TOC SM 5310 B H2SO4 to pH<2 7 d TC AOAC 990.03 Refrigerate 7 d TN AOAC 990.03 Refrigerate 7 d pH EPA 150.1 EPA 150.1 None 2 h
NH3 SM 4500-NH3 G Methods of Soil Analysis (1982) 84-2 as modified1 Refrigerate 7 d
Cl SM 4500-Cl E Methods of Soil Analysis (1982) 84-2 as modified1 None 28 d
TKN EPA351.2 Refrigerate 7 d Digestion per Soil Sci. Soc.
TP SM 4500-P BC Amer. Proc., V37, 1973. Refrigerate 48 h Analysis as liquid
OP SM 4500-P F Methods of Soil Analysis (1982) 78-4.2.12 Refrigerate 48 h
Cu SM 3111 B Methods of Soil Analysis (1982) 78-4.2.12 HNO3 to ph<2 6 mo
Zn SM 3111 B Methods of Soil Analysis (1982) 78-4.2.12 HNO3 to pH<2 6 mo
K SM 3111 B Methods of Soil Analysis (1982) 78-4.2.12 HNO3 to pH<2 6 mo
Bulk Density
Methods of Soil Analysis (1982) 30-2.1 None None
1 The extraction for ammonia, nitrite, and nitrate with 1.0 N KCl was modified to use 1.25 N K2SO4. This allows the analysis of chloride in the same extract according to the liquid method.
2 This method was modified according to North Carolina Department of Agriculture Methods. The extract is then analyzed according to the liquid method.
4.6 Mass Balance Calculations The mass balance of each parameter shall be calculated. The mass of each parameter pumped into and out of the system shall be calculated as the volume of wastewater multiplied by the average concentration determined from the triplicate samples (Eq 1). For the separated solids, the concentration of each parameter shall be multiplied by the total mass of solids collected and by the average bulk density of the solids to give a total mass of each parameter removed in the separated solids (Eq. 2).
The mass of each parameter into the system should equal the mass of that parameter that leaves Brome Agri Sales Ltd 01/15/03 Page 13 of 24

,M iI L, = V I L, × Ci
I L (Equation 1)
MiI − ( Mi
L + MiS )
R = Mi
× 100 (Equation 3) i I
Environmental Technology Verification Solids Separation Test Plan
the system in both the solid and liquid form. The validity of the mass balance shall be determined as the magnitude of the difference between what goes into the system and what comes out of the system expressed as a percent (Eq. 3).
M iS = M s ×Ci
S (Equation 2)
Where:
M I L, ,S i = Mass of component i in the influent,
liquid effluent, or separated solids. M = Mass of recovered solids. s , ,Ci
I L S = Average concentration of component i in the
influent, liquid effluent, o r separated solids., ,V I L S = Volume of influent, liquid effluent, or separated solids.ρΒ = Average bulk density of separated solids.Ri = Percent of component i not recovered in
liquid effluent or separa ted solids.
Brome Agri Sales Ltd 01/15/03 Page 14 of 24
Environmental Technology Verification Solids Separation Test Plan
5 QUALITY ASSURANCE PROJECT PLAN The Quality Assurance Project Plan for the ETV consists of the following components:
• Measurement of precision and accuracy • Methodology for use of blanks • Performance evaluation samples • Duplicate samples • Data correctness • Calculation of data quality indicators • Data reporting • Corrective action plan • On-site audits shall be conducted during the technology evaluation by both the
Verification Organization and the Testing Organization, as described in 5.8.2..
The project plan QA manager is Dr. John J. Classen. The manager of the Environmental Analysis Laboratory is Ms. Rachel Huie. The sampling manager is Mr. Craig Baird.
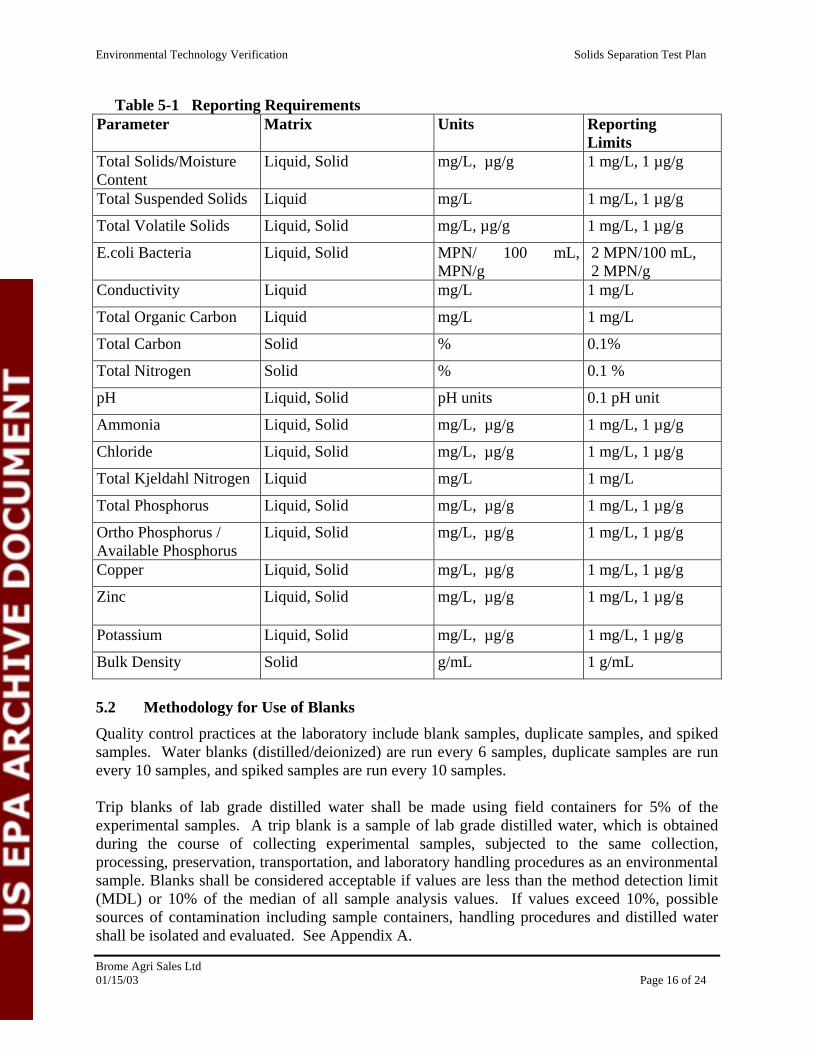
5.1 Reporting Requirements It should be noted that since the Environmental Analysis Laboratory processes many samples during the workday, all samples requiring the same analysis are processed together. However, required QA/QC data will be obtained using samples submitted by this project.
Table 5-1 summarizes the reporting requirements for each parameter analysis performed during this Environmental Technology Verification testing period.
Brome Agri Sales Ltd 01/15/03 Page 15 of 24
Environmental Technology Verification Solids Separation Test Plan
Table 5-1 Reporting Requirements Parameter Matrix Units Reporting
Limits Total Solids/Moisture Content
Liquid, Solid mg/L, µg/g 1 mg/L, 1 µg/g
Total Suspended Solids Liquid mg/L 1 mg/L, 1 µg/g
Total Volatile Solids Liquid, Solid mg/L, µg/g 1 mg/L, 1 µg/g
E.coli Bacteria Liquid, Solid MPN/ 100 mL, MPN/g
2 MPN/100 mL, 2 MPN/g
Conductivity Liquid mg/L 1 mg/L
Total Organic Carbon Liquid mg/L 1 mg/L
Total Carbon Solid % 0.1%
Total Nitrogen Solid % 0.1 %
pH Liquid, Solid pH units 0.1 pH unit
Ammonia Liquid, Solid mg/L, µg/g 1 mg/L, 1 µg/g
Chloride Liquid, Solid mg/L, µg/g 1 mg/L, 1 µg/g
Total Kjeldahl Nitrogen Liquid mg/L 1 mg/L
Total Phosphorus Liquid, Solid mg/L, µg/g 1 mg/L, 1 µg/g
Ortho Phosphorus / Available Phosphorus
Liquid, Solid mg/L, µg/g 1 mg/L, 1 µg/g
Copper Liquid, Solid mg/L, µg/g 1 mg/L, 1 µg/g
Zinc Liquid, Solid mg/L, µg/g 1 mg/L, 1 µg/g
Potassium Liquid, Solid mg/L, µg/g 1 mg/L, 1 µg/g
Bulk Density Solid g/mL 1 g/mL
5.2 Methodology for Use of Blanks Quality control practices at the laboratory include blank samples, duplicate samples, and spiked samples. Water blanks (distilled/deionized) are run every 6 samples, duplicate samples are run every 10 samples, and spiked samples are run every 10 samples.
Trip blanks of lab grade distilled water shall be made using field containers for 5% of the experimental samples. A trip blank is a sample of lab grade distilled water, which is obtained during the course of collecting experimental samples, subjected to the same collection, processing, preservation, transportation, and laboratory handling procedures as an environmental sample. Blanks shall be considered acceptable if values are less than the method detection limit (MDL) or 10% of the median of all sample analysis values. If values exceed 10%, possible sources of contamination including sample containers, handling procedures and distilled water shall be isolated and evaluated. See Appendix A.
Brome Agri Sales Ltd 01/15/03 Page 16 of 24
Environmental Technology Verification Solids Separation Test Plan
5.3 Measurement of Accuracy in a Matrix Spike Sample
Matrix spike samples shall be prepared from samples obtained during this ETV project. The matrix spikes shall be prepared and analyzed every 10 samples. Recoveries between 85 and 115% of true value shall be considered acceptable. If values are outside the acceptable range, a duplicate sample shall be spiked and analyzed. If this spiked sample recovery is still outside of range, and the rest of the quality control parameters are within acceptance criteria, the spiked sample may be labeled as having possible matrix effect.
It is not suitable to spike samples for all parameters, however. Measurements of pH, conductivity, solids, and E. coli shall be conducted without spiked samples.
5.4 Measurement of Precision A duplicate sample is an aliquot of an already collected, processed, and preserved field sample, which is used as a measure of laboratory analytical precision of various constituents of the sample matrix. Duplicate samples shall be considered acceptable if the values are within 25% of each other. If the values exceed 25% difference, the sampling method and analytical method shall be evaluated to assess ways to obtain more representative or consistent samples.
5.5 External Quality Control Checks After initial calibration, the laboratory shall analyze an external quality control check. This check shall be prepared form a source other than that from which their initial calibration standards were prepared.
5.6 Data Correctness Data correctness refers to data quality, for which there are four indicators:
· Representativeness · Completeness · Accuracy · Precision
5.6.1 Representativeness
As specified by NSF, representativeness of samples for the ETV shall be ensured by executing consistent sample collection procedures, including sample locations, timing of sample collection, sampling procedures, sample preservation, sample packaging, and sample transport. Each of these items was addressed above in the procedures described as part of the experimental design.
5.6.2 Completeness
Completeness refers to the amount of data collected from a measurement process compared to the amount that was expected to be obtained. For this ETV test plan, completeness refers to the proportion of valid, acceptable data generated using each method. The completeness objective for data generated through this test plan is 85%, meaning that at a minimum, 85% of the data identified in Section 4 shall be reported at the conclusion of testing.
Brome Agri Sales Ltd 01/15/03 Page 17 of 24

∑ (xi − x)2
Standard Deviation = (Equation 4) n −1
⎡(x − x )⎤Percent Recovery = ⎢
known measured ⎥ × 100 (Equation 6)
⎣ xknown ⎦
Environmental Technology Verification Solids Separation Test Plan
5.6.3 Accuracy
Accuracy of test parameters is addressed in Sections 5.3 and 5.7.3.
5.6.4 Precision
Precision of test parameters is addressed in Sections 5.4 and 5.7.1.
5.7 Calculation of Data Quality Indicators
5.7.1 Precision As specified in Standard Methods (Method 1030 C), precision is specified by the standard deviation of the results of replicate analyses. The overall precision of a study includes the random errors involved in sampling as well as the errors in sample preparation and analysis.
Where: x = sample mean
xi = ith data point n = number of data points
5.7.2 Relative Percent Deviation For this pilot, duplicate samples shall be analyzed to determine the overall precision of an analysis using relative percent deviation. All parameters measured in the Environmental Analysis Laboratory shall be subjected to duplicate analysis as described in Section 5.4.
⎡ ⎤x1 −x2Relative Percent Deviation = ⎢ ⎥ × 100 (Equation 5) ⎣ x ⎦
Divide the absolute standard deviation by the value of the mean and then multiply by 100.
5.7.3 Accuracy Accuracy is quantified as the percent recovery of a parameter in a sample to which a known quantity of that parameter was added. An example of an accuracy determination in this pilot is the analysis of ammonia in a sample to which a standard quantity has been added.
Brome Agri Sales Ltd 01/15/03 Page 18 of 24

Environmental Technology Verification Solids Separation Test Plan
5.7.4 Completeness
nCompleteness =
⎛⎜⎜
valid and acceptable ⎞⎟⎟ × 100 (Equation 7)
⎝ ntotal ⎠5.8 Data Reporting Data reports shall be prepared by the testing organization, North Carolina State University. Reports shall include date and time of analysis for each sample, including quality assurance samples, daily results of mass balance calculations, percent removal of each parameter of interest, the time of day of each sample event, and any observations by NCSU personnel related to the operation of the technology, i.e. power consumption, chemical use, and maintenance issues. Data reports and laboratory bench sheets shall be copied and faxed to NSF International weekly.
5.8.1 Project Reports A verification report shall be prepared by Dr. John Classen within thirty (30) days of completion of testing. Upon satisfactory review and revision by other NCSU staff, this report shall be sent to NSF for review and then to Brome Agri Sales Ltd., QA reviewers from both NSF and EPA, and selected external peer-reviewers. Finally, the report shall be forwarded by NSF to USEPA for approval. Data presented to the Vendor in the project report prepared by NCSU is not considered ETV verification data until NSF and USEPA have reviewed the data and approved the final verification report and verification statement.
5.8.2 Audit Reports QA inspections conducted by NSF shall be formally documented in an Audit Report and submitted to the USEPA Pilot Manager, USEPA Pilot Quality Manager, and NSF Partner Manager for review.
The NSF Partner Manager, Project Coordinator, QA Director, or other qualified NSF designee shall conduct a technical system audit and a performance evaluation audit of measurement systems used in testing at least once during the verification testing period for a given technology. In addition to the daily quality control checks on the analytical data, the NCSU QA manager shall check all technical systems and measurement performance at least once during the verification testing period for a given technology.
Brome Agri Sales Ltd 01/15/03 Page 19 of 24
Environmental Technology Verification Solids Separation Test Plan
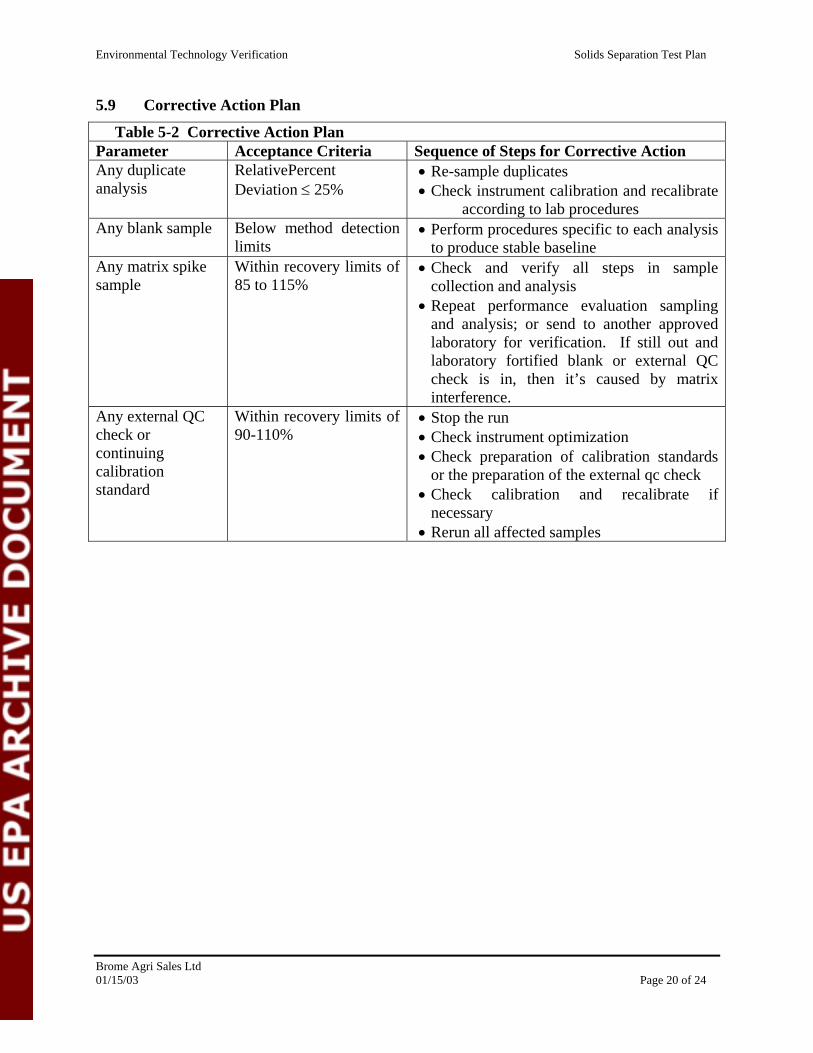
5.9 Corrective Action Plan
Table 5-2 Corrective Action Plan Parameter Acceptance Criteria Sequence of Steps for Corrective Action Any duplicate analysis
RelativePercent Deviation ≤ 25%
• Re-sample duplicates • Check instrument calibration and recalibrate
according to lab procedures Any blank sample Below method detection
limits • Perform procedures specific to each analysis
to produce stable baseline Any matrix spike sample
Within recovery limits of 85 to 115%
• Check and verify all steps in sample collection and analysis
• Repeat performance evaluation sampling and analysis; or send to another approved laboratory for verification. If still out and laboratory fortified blank or external QC check is in, then it’s caused by matrix interference.
Any external QC check or continuing calibration standard
Within recovery limits of 90-110%
• Stop the run • Check instrument optimization • Check preparation of calibration standards
or the preparation of the external qc check • Check calibration and recalibrate if
necessary • Rerun all affected samples
Brome Agri Sales Ltd 01/15/03 Page 20 of 24

6
Environmental Technology Verification Solids Separation Test Plan
DATA REPORTING, REDUCTION, AND VALIDATION Field personnel from NCSU are responsible for measurement and reporting of liquid volume and solid mass determinations. The Environmental Analysis Laboratory is responsible for all other analytical measurements. Results of analytical tests as well as QA/QC tests shall be delivered to the main contact at NCSU, Dr. John J. Classen, who shall be responsible for calculating the mass flow of each parameter. Dr. Classen is also responsible for conducting and reporting all statistical calculations and results. Data summary sheets, including all raw and reduced data, shall be submitted to NSF International along with the final report. The Environmental Analysis Laboratory shall maintain hard and electronic copies of raw data for at least five (5) years. NCSU shall have no responsibility for data storage after that time. Permanent data and report storage shall be the responsibility of NSF International or USEPA.
The Verification Report shall be a comprehensive document containing all raw and analyzed data, all QA/QC data sheets, a description of all types of data collected, a detailed description of the testing procedure and methods, results and QA/QC results.
A recommended Table of Contents for the Verification Report is as follows.
• Preface • Glossary • Acknowledgements • Executive Summary • Introduction and Background • Procedures and Methods Used In Testing (summarizing essential information
from the Test Plan) • Results and Discussion • Limitations • Conclusions • Recommendations • References • Appendices (including raw data)
The exact details of the Verification Report shall be agreed upon by NSF and NCSU.
Brome Agri Sales Ltd 01/15/03 Page 21 of 24

7
Environmental Technology Verification Solids Separation Test Plan
SAFETY CONSIDERATIONS This section describes safety considerations appropriate for the equipment being tested. The key safety considerations for this pilot are electrical hazards, mechanical hazards, and pathogenic organisms associated with wastewater. Precautions shall be taken based on standard practices for these hazards: power shall be disconnected prior to servicing equipment, all shafts and bearings shall be covered or enclosed, and care shall be taken in sample collection to protect the health of NCSU staff. Details of safety precautions are included in the safety plan for the Lake Wheeler Road Field Laboratory Swine Educational Unit and are available at the main office of the Unit. Safety measures specific to the Brome Agri Maximizer Separator are described in the separator’s O & M manual, included in Appendix A. All personnel involved in this project shall review and sign the safety plan prior to working on the site. To ensure personal safety, two NC State employees will be present during testing of each technology as designated by the principal investigator.
All applicable safety rules of the University shall be enforced by the Testing Organization for the duration of the verification test. In particular, laboratory operations shall be in accordance with the safety plan (02-09-353) approved by the department of Environmental Safety and Health at North Carolina State University.
Brome Agri Sales Ltd 01/15/03 Page 22 of 24
8
Environmental Technology Verification Solids Separation Test Plan
REFERENCES Clesceri, L. S., A. E. Greenberg, et al. (1995). Standard Methods for the Examination of Water and Wastewater., 19th ed, APHA, AWWA, WPCF.
Page, A.L., ed. Methods of Soil Analysis, 1982. American Society of Agronomy, Inc.; Soil Science Society of America, Inc., Madison, Wisconsin.
Journal of the Association of Official Analytical Chemists, 1989 Vo 72, p770, Method 990.03, Protein (crude) in Animal Feed, Combustion Method
Brome Agri Sales Ltd 01/15/03 Page 23 of 24
Environmental Technology Verification Solids Separation Test Plan
Environmental Analysis Laboratory Local Quality Assurance / Quality Control Procedures
The value of laboratory data is directly related to the confidence in which the investigator places the results and the procedures used to obtain those results. In the Biological & Agricultural Environmental Analysis Laboratory (EAL), that confidence is assured through standard good laboratory practices, including an effective quality assurance / quality control program. The heart of that program is the use of spiked and duplicate samples. The procedures for using and interpreting these tools are the subject of this document.
Spiked and duplicate samples, external quality control checks, and standard checks are used throughout the sample runs to ensure the accuracy and precision of the analytical results. All analytical runs begin with at least three working calibration standards to generate a standard curve. After initial calibration, a DI water blank is analyzed, followed by the external quality control check. Spiked and duplicate samples from the ETV project are run every 10 samples. The value of the spike is selected to produce results near 50% of the selected calibration range. A DI water blank and a mid-range continuing calibration standard are run every ten samples and at the end of the analytical run. Any sample result above the highest calibration standard will be diluted and reanalyzed.
Recovery of the spiked samples must fall within 85-115% of true value. Duplicate samples must fall within 25% of each other. If results fall outside of these ranges, the samples are reanalyzed. If the external quality control check and/or continuing calibration standard(s) are out of acceptance criteria, the analytical run is stopped until the cause is determined.
Brome Agri Sales Ltd 01/15/03 Page 24 of 24


