UCRL-TR-217159 Environmental transport and fate of endocrine disruptors from non-potable reuse of municipal wastewater B. Hudson, H. Beller, C. M. Bartel, S. Kane, C. Campbell, A. Grayson, N. Liu, S. Burastero November 16, 2005
Transcript
UCRL-TR-217159
Environmental transport and fate ofendocrine disruptors from non-potablereuse of municipal wastewater
B. Hudson, H. Beller, C. M. Bartel, S. Kane, C.Campbell, A. Grayson, N. Liu, S. Burastero
November 16, 2005
Disclaimer
This document was prepared as an account of work sponsored by an agency of the United States Government. Neither the United States Government nor the University of California nor any of their employees, makes any warranty, express or implied, or assumes any legal liability or responsibility for the accuracy, completeness, or usefulness of any information, apparatus, product, or process disclosed, or represents that its use would not infringe privately owned rights. Reference herein to any specific commercial product, process, or service by trade name, trademark, manufacturer, or otherwise, does not necessarily constitute or imply its endorsement, recommendation, or favoring by the United States Government or the University of California. The views and opinions of authors expressed herein do not necessarily state or reflect those of the United States Government or the University of California, and shall not be used for advertising or product endorsement purposes.
This work was performed under the auspices of the U.S. Department of Energy by University of California, Lawrence Livermore National Laboratory under Contract W-7405-Eng-48.
Environmental transport and fate of endocrine disruptorsfrom non-potable reuse of municipal wastewater
Final Report for 03-ERD-065
Bryant Hudson1, Harry Beller2, Cheryl Moody Bartel1, Staci Kane2,Chris Campbell3, Allen Grayson3, Nan Liu4, and Stephen Burastero5
1. Chemical Biology and Nuclear Science Division, CMS2. Environmental Restoration, EPD, SEP
3. Water Guidance and Monitoring Group, EPD, SEP4.Biosciences Directorate
5. Health Services Department, SEP
2
INTRODUCTION ......................................................................................................................3WATER RECYCLING AND GROUNDWATER QUALITY ....................................................4SCOPE AND OBJECTIVES ......................................................................................................4SELECTION OF TARGET COMPOUNDS ...............................................................................5
DESCRIPTION OF STUDY SITE: LAS POSITAS GOLF COURSE (LPGC) ...........................8TRITIUM AS A VALUABLE TRACER AT THE LPGC.......................................................93H-3He AGE DATING OF GROUNDWATER.....................................................................13
HYDROLOGIC MODEL FOR LPGC......................................................................................14EDC TRANSPORT MODEL....................................................................................................17FIELD SAMPLING PROCEDURES........................................................................................19DEVELOPMENT OF LC/MS/MS METHODS FOR TARGET COMPOUNDS.......................20LC/MS/MS RESULTS .............................................................................................................24
BIOASSAY FOR ESTROGENIC ACTIVITY..........................................................................30ESTROGENIC BIOASSAY RESULTS ...................................................................................32CONCLUSIONS AND SIGNIFICANCE .................................................................................33REFERENCES .........................................................................................................................34
3
INTRODUCTION
Endocrine Disrupting Compounds (EDCs) are a group of hormonally active agents ofemerging concern to the regulatory and engineering community, particularly among potablewater and wastewater reuse agencies (a primary source for EDCs is municipal wastewatertreatment facilities). EDCs are natural and synthetic compounds with the potential to elicitnegative effects on endocrine systems of humans and wildlife by either stimulating or inhibitingnormal hormonal activity. A wide range of chemical compounds have been identified thatinduce estrogen-like responses, including natural and synthetic hormones, pharmaceuticals,pesticides, industrial chemicals, and heavy metals (NRC, 1999; Giesy et al., 2002). The U.S.Environmental Protection Agency (US EPA) defines an EDC as:
an exogenous agent that interferes with the synthesis, secretion, transport, binding, action, or elimination ofnatural hormones in the body that are responsible for the maintenance of homeostasis, reproduction,development, and/or behavior. (US EPA, 1997)
This broad class of chemicals includes both natural and synthetic estrogens (e.g.,xenoestrogens and pseudoestrogens). Specific examples of estrogenic EDCs include: pesticideslike atrazine, dieldrin, and toxaphene (Hayes et al., 2002; Ramamoorthy et al., 1997; Arnold etal. 1996a); surfactants such as alkyphenol ethoxylates and their metabolic products (Folmar etal., 2002; Legler et al., 2002a; Ying et al., 2002); natural hormones and pharmaceutical estrogenssuch as 17b-estradiol and 17a-ethynylestradiol (Legler et al., 2002a; Folmar et al., 2000);phytoestrogens including isoflavonoids and coumestrol (Bacaloni et al., 2005; Stopper et al.,2005); and other industrial compounds like PCBs, bisphenol A, and chlorinated dibenzodioxins(Howdeshell et al., 1999; Ramamoorthy et al., 1997; Mocarelli et al., 1996).
A variety of these compounds have been detected in the environment, with over 60compounds currently identified (e.g., Kolpin et al., 2002, NRC, 1999). Given that many of theEDCs identified have the potential to cause an estrogenic response at very low concentrations(parts per billion to parts per trillion) it is cause for concern that measurable concentrations ofmany of the EDCs mentioned above have been found in wastewater, surface waters, sediments,groundwater, and even drinking water (Petrovic et al., 2004; Benfenati et al., 2003, Petrovic etal., 2003; Snyder et al., 2003). Wastewater treatment plants have been studied as a major sourcefor EDCs (Westerhoff et al., 2005; Snyder et al., 2003; Kolpin et al., 2002; Legler et al., 2002a).Various compounds have been reported to have endocrine-disrupting effects on fish and wildlife,as detailed elsewhere (Johnson et al., 1998; Fry, 1995; Guillette et al., 1994; McLachlan, 1985;Fry and Toone, 1981; Colborn et al., 1993). At the same time, human exposure to EDCs is acritical concern with unknown long-term impacts. There is concern with regard to potentialhuman health effects of EDCs because of their environmental persistence, tendency toaccumulate in adipose tissue, and potential for additive toxicity when multiple EDCs are present.
In light of these serious potential impacts to receptor populations, the US EPA continuesto compile, evaluate, and update the current state of knowledge on EDCs and has initiated anEDC screening program (http://www.epa.gov/scipoly/oscpendo/index.htm). Recent advances inanalytical chemistry (in particular, liquid chromatography/tandem mass spectrometry, orLC/MS/MS) as well as widespread interest in EDCs has promoted the development of advanced
4
analytical methods, including gas chromatography/tandem mass spectrometry (GC/MS/MS) andLC/MS/MS (e.g., Ternes et al., 2004; Petrovic et al., 2002; Huang and Sedlak, 2001; Petrovicand Barceló, 2000; Fan et al., 2005; Heisterkamp et al., 2004; Zhang et al., 2004; Wozei, 2004).These analytical techniques provide excellent sensitivity and precision for monitoring EDCs.Although concentration measurements are necessary in studies of EDC fate and transport in theenvironment, they do not provide direct data on estrogenic effects or synergistic effects frommultiple EDCs. Furthermore, since these advanced techniques target specific EDCs, the targetcompounds must be EDCs that have already been identified. Therefore, as a complement tohighly sensitive and specific chemical analysis of known EDCs, bioassays are needed tocharacterize total estrogenic potency in environmental samples.
WATER RECYCLING AND GROUNDWATER QUALITY
Water is a limited resource in many regions of the world and recycling of wastewater isan attractive option for enhancing supply. Artificially recharging recycled (reclaimed)wastewater into groundwater aquifers has become an important management strategy forincreasing the potable water supply in many regions. Projects designed to treat wastewater tovery high purity standards for indirect potable reuse have met with significant public oppositionin most areas in the United States. These projects are often labeled “toilet to tap” by projectopponents. At the same time, water-recycling projects for non-potable reuse, such as landscapeirrigation, that use less rigorously treated water have been widely accepted and implemented. Innon-potable reuse projects, wastewater is filtered and disinfected, but many dissolvedcompounds are not removed. Issues related to contaminants covered by primary and secondarydrinking water standards are well understood; however, there are a variety of trace organiccompounds, such as pharmaceuticals and EDCs, whose impacts are largely unknown.
SCOPE AND OBJECTIVES
This project was designed to investigate the important but virtually unstudied topic of thesubsurface transport and fate of EDCs when treated wastewater is used for landscape irrigation(non-potable water reuse). Although potable water reuse was outside the scope of this project,the investigation clearly has relevance to such water recycling practices.
The target compounds, which are discussed in the following section and include EDCssuch as 4-nonylphenol (NP) and 17b-estradiol, were studied not only because of their potentialestrogenic effects on receptors but also because they can be useful as tracers of wastewaterresidue in groundwater. Since the compounds were expected to occur at very low (part pertrillion) concentrations in groundwater, highly selective and sensitive analytical techniques hadto be developed for their analysis. This project assessed the distributions of these compounds inwastewater effluents and groundwater, and examined their fate in laboratory soil columnssimulating the infiltration of treated wastewater into an aquifer (e.g., as could occur duringirrigation of a golf course or park with nonpotable treated water). Bioassays were used todetermine the estrogenic activity present in effluents and groundwater, and the results werecorrelated with those from chemical analysis. In vitro assays for estrogenic activity wereemployed to provide an integrated measure of estrogenic potency of environmental sampleswithout requiring knowledge or measurement of all bioactive compounds in the samples.
5
For this project, the Las Positas Golf Course (LPGC) in the City of Livermore providedan ideal setting. Since 1978, irrigation of this area with treated wastewater has dominated theoverall water budget. For a variety of reasons, a group of 10 monitoring wells were installed toevaluate wastewater impacts on the local groundwater. Additionally, these wells were regularlymonitored for tritium (3H). Overall volumes of irrigation water have been recorded along withtotal flows through the Livermore Water Reclamation Plant (LWRP). The EnvironmentalProtection Department at LLNL has carefully monitored 3H effluent leaving the laboratory formany years. For two years preceding the initiation of this project, Grayson and Hudson, workingwith LWRP staff, had demonstrated that these data could be used to accurately calculate the 3Hconcentration in the applied irrigation water as a function of time. This was accomplished byperforming two carefully monitored tritium releases from LLNL and following the 3H throughthe LWRP. Combining these data with our ability to age-date groundwater using the 3H-3He age-dating technique, it was possible determine both the age and the degree of dilution from otherwater sources. This information was critical in the evaluation of observed concentrations of traceorganic compounds from wastewater.
The project included the following tasks:
1. Develop a conceptual model for Las Positas Golf Course (LPGC) irrigation that integratesexisting meteorological, hydrologic, and environmental monitoring data.
2. Develop analytical methods (involving solid-phase extraction and isotope dilutionLC/MS/MS) for the specific and sensitive measurement of target EDCs.
3. Develop a bioassay for estrogenic activity for application to effluent and groundwatersamples.
4. Perform detailed hydrological evaluation of groundwater taken from LPGC.
5. Characterize the source term for target EDCs in wastewater.
6. Evaluate the utility of EDCs as source tracers for groundwater contamination.
SELECTION OF TARGET COMPOUNDS
ALKYLPHENOL ETHOXYLATE METABOLITES
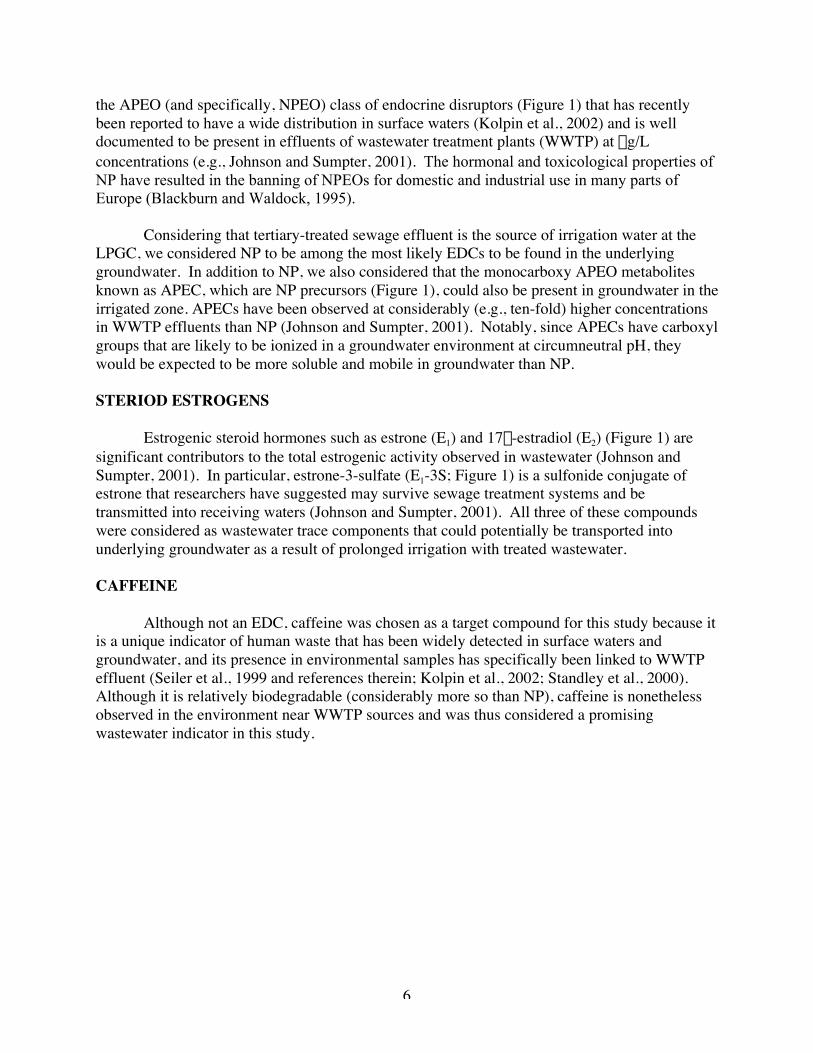
Alkylphenol ethoxylates (APEOs), a class of nonionic surfactants, and their metabolitesare the most prominent group of EDCs identified in wastewater and treated wastewater. Inparticular, nonylphenol ethoxylates (NPEOs) constitute the largest subgroup of the APEOs(encompassing more than 80% of the world market). Municipal wastewater treatment (includingbiological treatment) tends to result in efficient elimination of the parent APEOs but formation ofbiologically refractory metabolites including the following: alkylphenol mono- and diethoxylates(i.e., n=1 or 2 in Figure 1), alkylphenol carboxylic acids (e.g., NP1EC and NP2EC; Figure 1),and 4-nonylphenol (NP; Figure 1) (Ahel et al., 1994). NP is a metabolite and representative of
6
the APEO (and specifically, NPEO) class of endocrine disruptors (Figure 1) that has recentlybeen reported to have a wide distribution in surface waters (Kolpin et al., 2002) and is welldocumented to be present in effluents of wastewater treatment plants (WWTP) at mg/Lconcentrations (e.g., Johnson and Sumpter, 2001). The hormonal and toxicological properties ofNP have resulted in the banning of NPEOs for domestic and industrial use in many parts ofEurope (Blackburn and Waldock, 1995).
Considering that tertiary-treated sewage effluent is the source of irrigation water at theLPGC, we considered NP to be among the most likely EDCs to be found in the underlyinggroundwater. In addition to NP, we also considered that the monocarboxy APEO metabolitesknown as APEC, which are NP precursors (Figure 1), could also be present in groundwater in theirrigated zone. APECs have been observed at considerably (e.g., ten-fold) higher concentrationsin WWTP effluents than NP (Johnson and Sumpter, 2001). Notably, since APECs have carboxylgroups that are likely to be ionized in a groundwater environment at circumneutral pH, theywould be expected to be more soluble and mobile in groundwater than NP.
STERIOD ESTROGENS
Estrogenic steroid hormones such as estrone (E1) and 17b-estradiol (E2) (Figure 1) aresignificant contributors to the total estrogenic activity observed in wastewater (Johnson andSumpter, 2001). In particular, estrone-3-sulfate (E1-3S; Figure 1) is a sulfonide conjugate ofestrone that researchers have suggested may survive sewage treatment systems and betransmitted into receiving waters (Johnson and Sumpter, 2001). All three of these compoundswere considered as wastewater trace components that could potentially be transported intounderlying groundwater as a result of prolonged irrigation with treated wastewater.
CAFFEINE
Although not an EDC, caffeine was chosen as a target compound for this study because itis a unique indicator of human waste that has been widely detected in surface waters andgroundwater, and its presence in environmental samples has specifically been linked to WWTPeffluent (Seiler et al., 1999 and references therein; Kolpin et al., 2002; Standley et al., 2000).Although it is relatively biodegradable (considerably more so than NP), caffeine is nonethelessobserved in the environment near WWTP sources and was thus considered a promisingwastewater indicator in this study.
7
Figure 1. Structures of EDC-related chemicals addressed in this study. The value of “n” forAPEOs is 3 to 20. Not all metabolites in the biodegradation of NPEOs to NP are shown, but therelationships among APEOs, APECs, and NP can be ascertained from the figure.
OH
C9H19
4-nonylphenol (NP)
O
C9H19
OH
APEOs (specifically, NPEOs)
AP2EC
O
C9H19
OCH2COOH
O
HO3S
Estrone-3-sulfate (E1-3S)
AP1EC
O
C9H19
COOH
O
HO
Estrone
OH
HO
Estradiol
[]n
8
DESCRIPTION OF STUDY SITE: LAS POSITAS GOLF COURSE (LPGC)
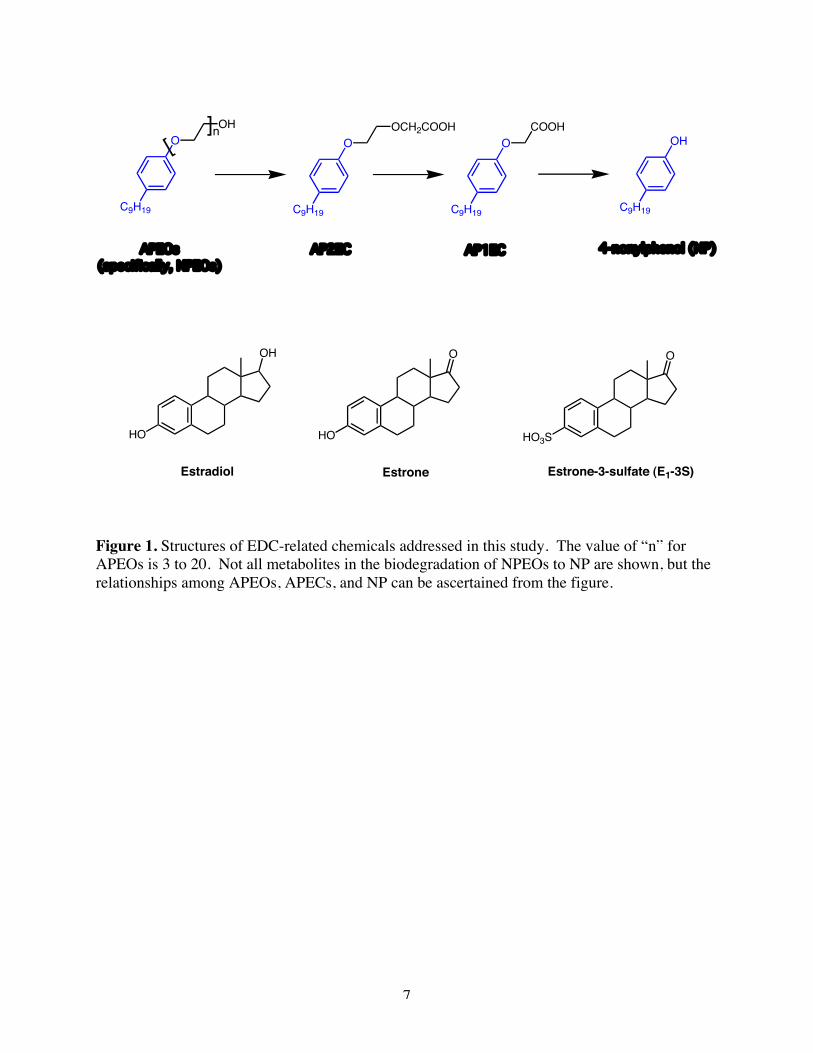
The Las Positas Golf Course (LPGC) in Livermore, California (Figure 2) provides aunique opportunity to investigate the transport and impact of wastewater compounds ongroundwater resources. Recycled water has been used since 1978 to provide turf irrigation forthe golf course in what is a relatively arid climate. Average yearly precipitation at LPGC isapproximately 15” per year and occurs primarily in the winter (Figure 3). Irrigation is necessaryin the summer and approximately 36” per year of recycled water is required to maintainvegetation at the LPGC.
Figure 2. Aerial view of study site with monitoring well locations highlighted.
11C3
11B1
2J2
1P2
2R1
2Q1
Groundwater 3H-3Heages range from 4 to25 years
9
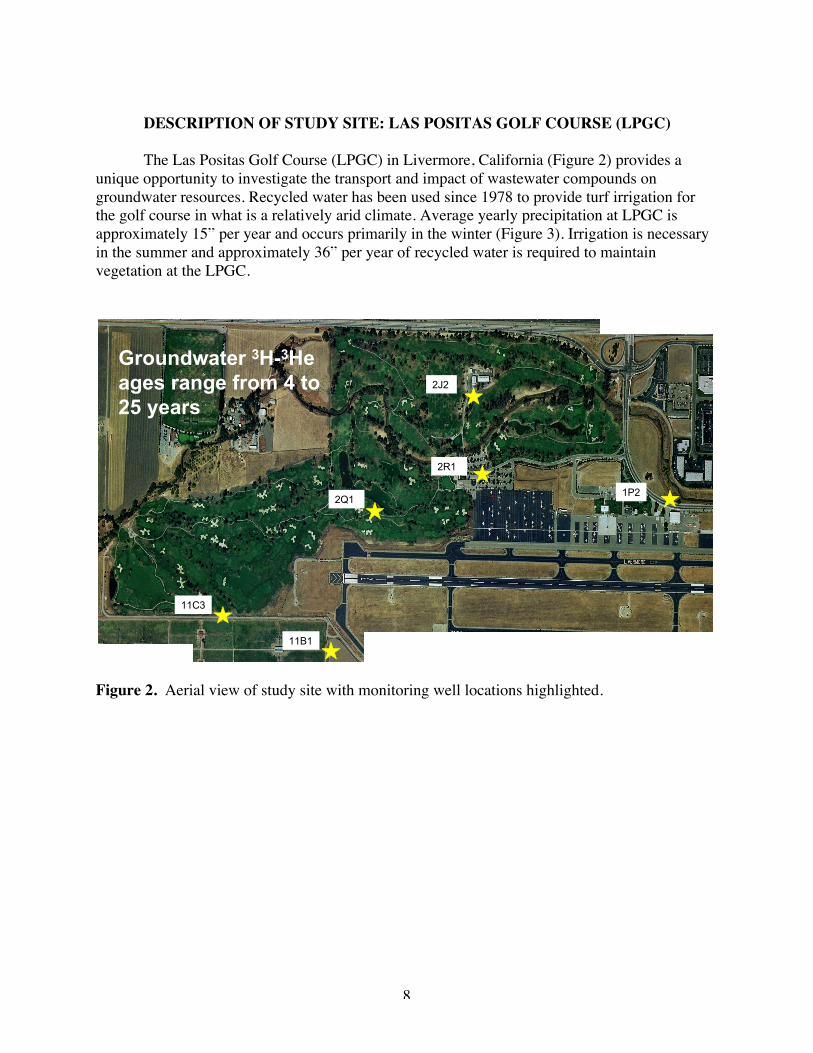
Figure 3. Rainfall trends for the study area since 1970.
TRITIUM AS A VALUABLE TRACER AT THE LPGC
Tritium is a radioactive isotope of hydrogen (3H, half-life =12.3 years) that is naturallypresent in the environment due to interactions of cosmic rays with the atmosphere. Tritium isalso present due to man-made sources, most notably nuclear weapons. Nuclear weapons testingin the 1960s increased the tritium concentration in precipitation by more than a factor of 1000over natural levels in 1963. Tritium has been routinely used at LLNL since the beginning of thelaboratory in 1952. While tritium is radioactive, the nuclear decay energy is quite low. Tritiumdecays by beta emission, that is, an energetic electron is emitted when tritium transforms tostable 3He. The average electron energy in 7 keV can only penetrate 1 x 10⁻⁶ m of water beforestopping. This decay energy is so low that only very sensitive methods can detect its presence.
Because of tritium’s low decay energy, this radioactive isotope has found significant usein consumer products. Luminous watch dials and building signs using tritium are quite common.In the course of LLNL’s national security mission, tritium has been used in a variety of programsand some tritium is released from the laboratory to the sanitary sewer system. Such releases areregulated and carefully monitored. The typical annual release in recent years equals the amountof tritium contained in one wrist watch. While this is a very low level, methods have beendeveloped at LLNL and other laboratories to detect tritium at extraordinarily low levels.
Since the release of radioactive materials into the environment is a source of communityconcern, LLNL developed detailed and aggressive environmental monitoring programs tomonitor radioactive material releases. It is the combination of the tritium releases combined withdetailed monitoring programs that makes the LPGC interesting. It is appropriate to note that therelease of trace amounts of tritium is not unique to LLNL. Many large cities have far largerannual tritium releases to their wastewater systems. Again, these releases are carefully regulated,but do not receive the level of monitoring that LLNL has put in place.
Livermore Rainfall
0
500
1000
1500
2000
2500
3000
3500
1970 1975 1980 1985 1990 1995
Date
Rai
nfal
l (0.
01 in
ches
)
TotalApril-OctNov-MarchAverage
10
In the mid 1970s, the city of Livermore began a program to recycle wastewater and usethe water to irrigate the LPGC. The U.S. Geological Survey installed several groundwatermonitoring wells nearby the LPGC and LLNL and recognized the opportunity to use these wellsfor tritium monitoring.
The monitoring results show the clear connection between the application of recycledwater and the local shallow groundwater. The overall trend in tritium releases from LLNL isdecreasing. While the LLNL tritium releases have always been well below regulatory limits, thegeneral goal of programs using tritium at LLNL has been to reduce releases as can be reasonablyachieved. We see in Figure 4 a close match between the monitoring wells and the recycled water.As will be discussed, the relationship between the tritium concentration observed in themonitoring wells and the irrigation water is relatively complex, nevertheless, the presence of thetritium tracer provides a clear indication of the connection.
Figure 4. Time trends for tritium concentrations in LWRP effluent and selected monitoringwells.
ISOTOPIC DATA FOR LPGC GROUNDWATER
We have selected five groundwater monitoring wells for detailed analysis ofenvironmental isotopes and wastewater compounds and the well characteristics are provided inTable 1. Three of these wells (2J2, 2Q1, 11C3) were recently constructed by the local wateragency (Alameda County Zone 7) for this project. Table 2 gives sampling dates and waterchemistry data for these wells. The major ions for these samples are sodium and chloride asmight be expected for groundwater with a significant wastewater component.
10
100
1000
10000
1975 1980 1985 1990 1995 2000 2005
Date
3 H (
pC
i/L) 1P2
2R111B1LWRPExpon. (LWRP)
11
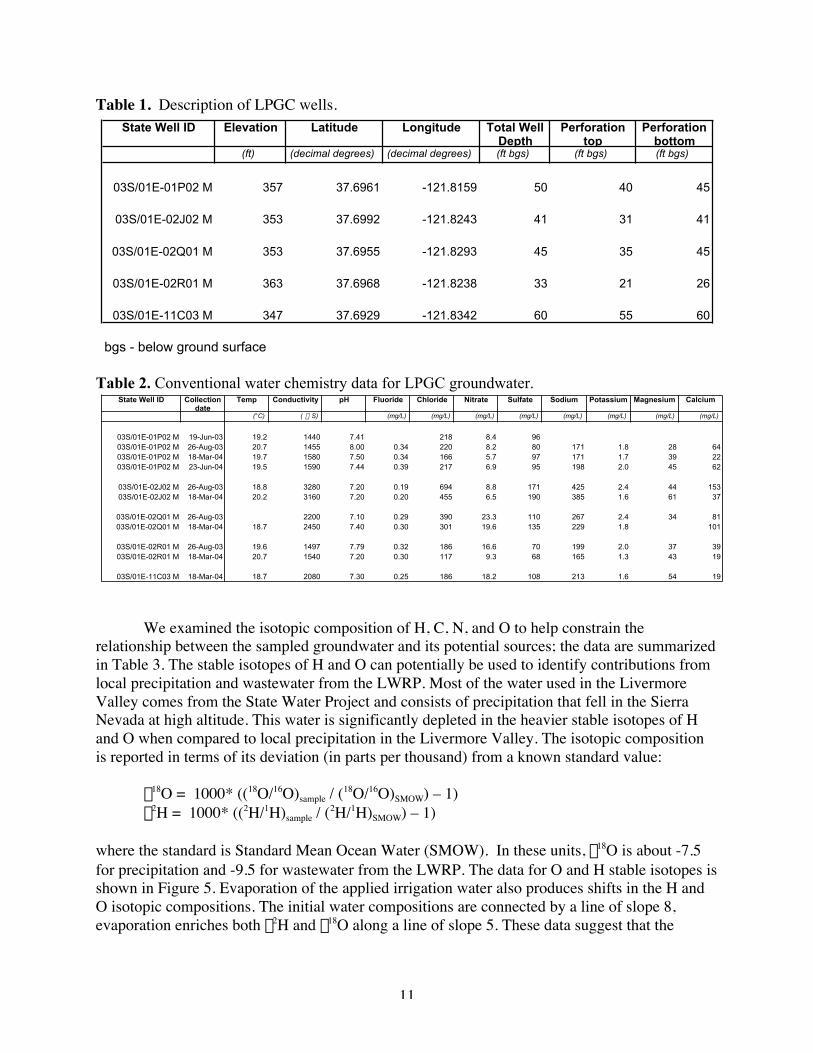
Table 1. Description of LPGC wells.
Table 2. Conventional water chemistry data for LPGC groundwater.
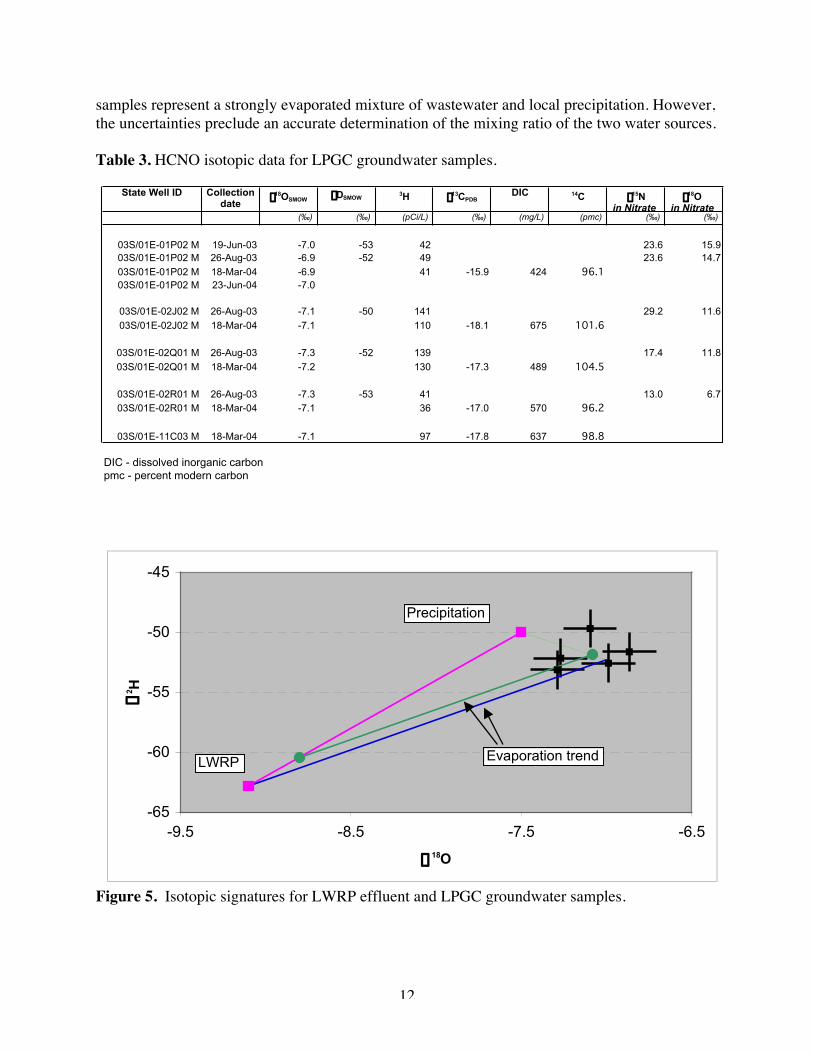
We examined the isotopic composition of H, C, N, and O to help constrain therelationship between the sampled groundwater and its potential sources; the data are summarizedin Table 3. The stable isotopes of H and O can potentially be used to identify contributions fromlocal precipitation and wastewater from the LWRP. Most of the water used in the LivermoreValley comes from the State Water Project and consists of precipitation that fell in the SierraNevada at high altitude. This water is significantly depleted in the heavier stable isotopes of Hand O when compared to local precipitation in the Livermore Valley. The isotopic compositionis reported in terms of its deviation (in parts per thousand) from a known standard value:
where the standard is Standard Mean Ocean Water (SMOW). In these units, d18O is about -7.5for precipitation and -9.5 for wastewater from the LWRP. The data for O and H stable isotopes isshown in Figure 5. Evaporation of the applied irrigation water also produces shifts in the H andO isotopic compositions. The initial water compositions are connected by a line of slope 8,evaporation enriches both d2H and d18O along a line of slope 5. These data suggest that the
samples represent a strongly evaporated mixture of wastewater and local precipitation. However,the uncertainties preclude an accurate determination of the mixing ratio of the two water sources.
Table 3. HCNO isotopic data for LPGC groundwater samples.
Figure 5. Isotopic signatures for LWRP effluent and LPGC groundwater samples.
-65
-60
-55
-50
-45
-9.5 -8.5 -7.5 -6.5
d 18O
d 2 H
LWRP
Precipitation
Evaporation trend
State Well ID Collection date
d18OSMOWdDSMOW
3H d13CPDBDIC 14C d15N
in Nitrated18O
in Nitrate(‰) (‰) (pCi/L) (‰) (mg/L) (pmc) (‰) (‰)
03S/01E-01P02 M 19-Jun-03 -7.0 -53 42 23.6 15.903S/01E-01P02 M 26-Aug-03 -6.9 -52 49 23.6 14.7
03S/01E-01P02 M 18-Mar-04 -6.9 41 -15.9 424 96.103S/01E-01P02 M 23-Jun-04 -7.0
03S/01E-02J02 M 26-Aug-03 -7.1 -50 141 29.2 11.6
03S/01E-02J02 M 18-Mar-04 -7.1 110 -18.1 675 101.6
03S/01E-02Q01 M 26-Aug-03 -7.3 -52 139 17.4 11.8
03S/01E-02Q01 M 18-Mar-04 -7.2 130 -17.3 489 104.5
03S/01E-02R01 M 26-Aug-03 -7.3 -53 41 13.0 6.703S/01E-02R01 M 18-Mar-04 -7.1 36 -17.0 570 96.2
03S/01E-11C03 M 18-Mar-04 -7.1 97 -17.8 637 98.8
DIC - dissolved inorganic carbonpmc - percent modern carbon
13
The isotopic composition of N and O in the nitrate present in the groundwater samplesalso shows the contribution of a wastewater component. Denitrification occurring duringtreatment leads to the correlated enrichment of d15N and d18O in the remaining nitrate. All of thegroundwater samples show this effect.
3H-3He AGE DATING OF GROUNDWATER
The decay of tritium into 3He can be used as a groundwater chronometer. Once waterenters the saturated zone (no gas phase present), 3He begins to accumulate in the groundwaterand the accumulation age can be calculated using:
Age (yrs) = 17.8 x ln( 3He*/3H +1)
where 3He* is the 3He due to 3H decay:
3He* = 4He x ((3He/4He)meas – 0.985 x (3He/4He)air).
The factor of 0.985 reflects the slightly lower solubility of 3He relative to 4He in water.In addition to the 3H-3He age, we can compute the concentration of 3H when the groundwatersystem began to accumulate 3He by adding 3H* to the measured 3H observed in the sample.These data are summarized in Table 4.
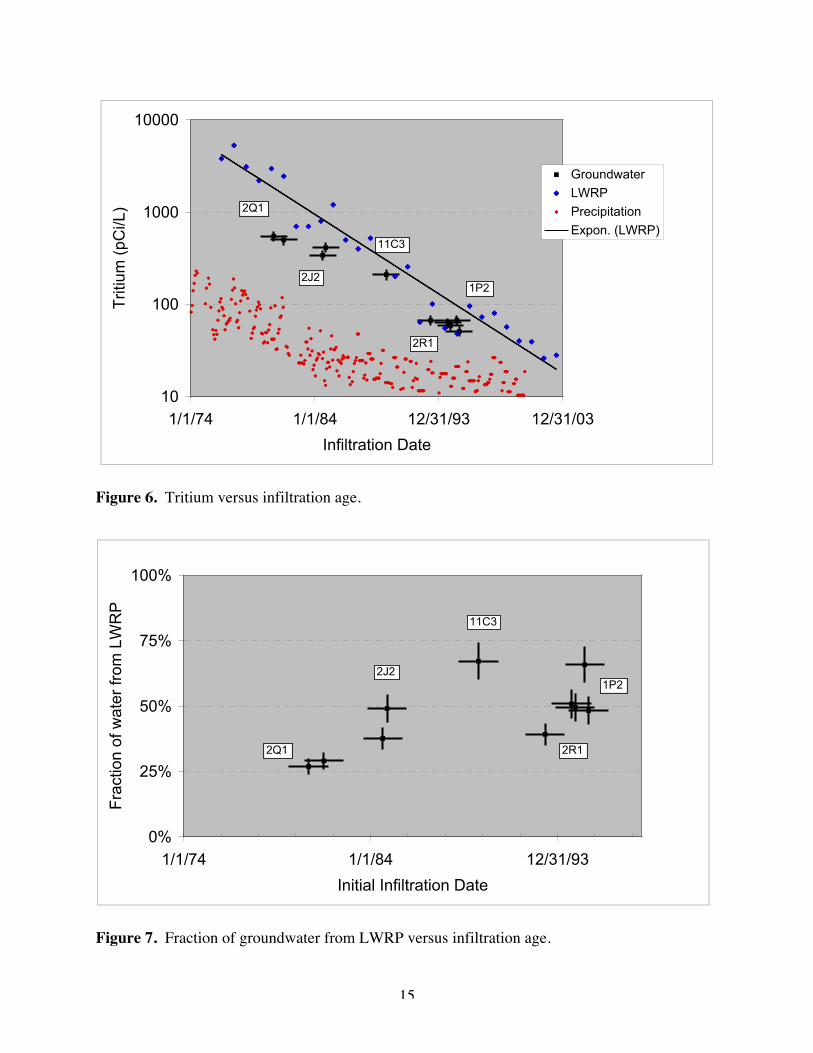
We can look at the relationship between the inferred initial 3H concentration in thegroundwater samples as compared to the irrigation water from the LWRP as a function ofgroundwater age. The 3H-3He age is close to the water infiltration age but we need to add timefor the passage of the water through the unsaturated zone. For a simple piston model, weestimate a 3.5 years travel time. One additional factor comes from the fact that not all of thewater in a given sample has the same infiltration history and thus a distribution of ages exists. Ifthe 3H concentration were uniform in time, the 3H-3He age would equal the mean groundwaterage. Since 3H is decreasing with time, the 3H-3He age is slightly greater than the mean water ageand we estimate that, for these samples, the 3H-3He age is approximately 20% greater than themean age of the groundwater. While both of these corrections have significant uncertainty, theyare small and of opposite direction and the net impact on the ages is small. These results aresummarized in Table 5. We can now compare the inferred 3H concentrations to that present inthe irrigation water (Figure 6). We see that the 3H concentrations fall between the two sourcesand we can calculate that fraction of the groundwater due to the LWRP contribution. Wecalculate that the LWRP contribution ranges from 27 to 67% (Figure 7). Our initial estimate of36” of irrigation water versus 15” of precipitation is easily reconciled with this result when wetake evaporation into account. Irrigation water applied in the summer undergoes much greaterevaporation than does winter precipitation. This model predicts significant enrichment innonvolatile dissolved components such as chloride. The LWRP wastewater averages 161 mg/Lof Cl- over the period of interest (1975 – 2000). This is a significant environmental source of Cl-
that dominates other potential sources for these samples. The recovered groundwater samplesshow values greater than or equal to the LWRP value for Cl- (Figure 8). Thus, we see that eventhough precipitation accounts for about half of the water, evaporation of the LWRP source morethan makes up for this dilution.
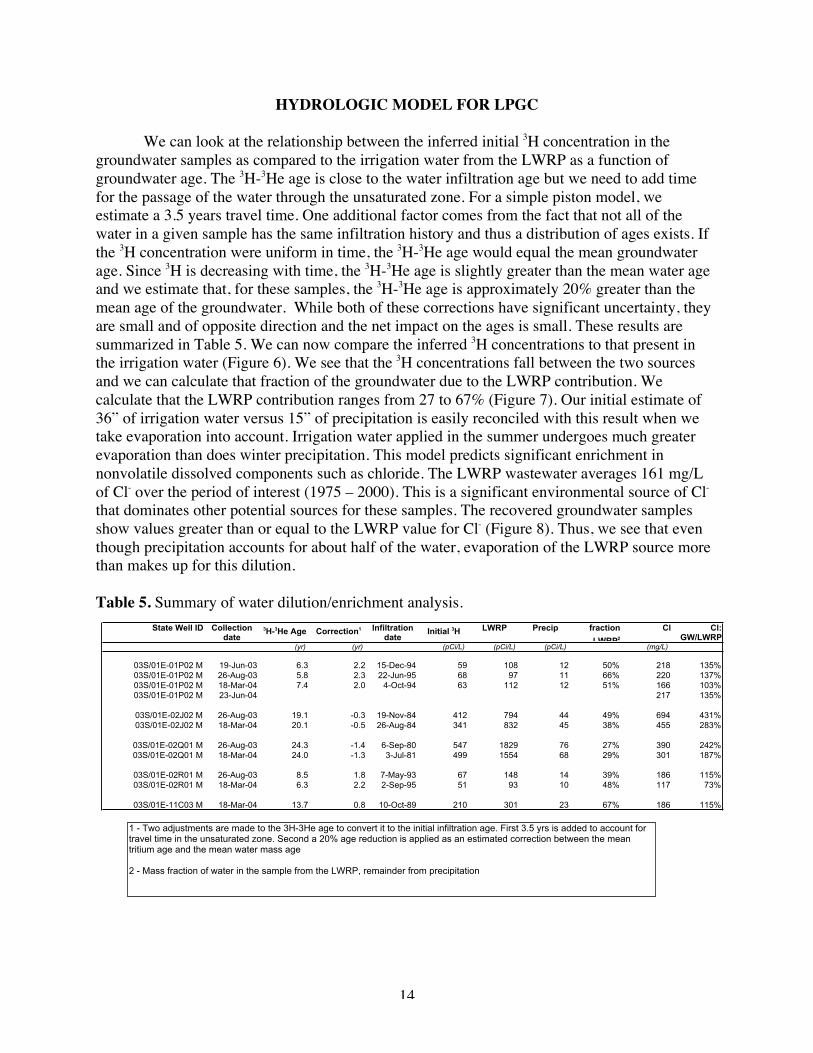
Table 5. Summary of water dilution/enrichment analysis.State Well ID Collection
date3H-3He Age Correction1 Infiltration
dateInitial 3H LWRP Precip fraction
LWRP2
Cl Cl: GW/LWRP
(yr) (yr) (pCi/L) (pCi/L) (pCi/L) (mg/L)
03S/01E-01P02 M 19-Jun-03 6.3 2.2 15-Dec-94 59 108 12 50% 218 135%03S/01E-01P02 M 26-Aug-03 5.8 2.3 22-Jun-95 68 97 11 66% 220 137%03S/01E-01P02 M 18-Mar-04 7.4 2.0 4-Oct-94 63 112 12 51% 166 103%03S/01E-01P02 M 23-Jun-04 217 135%
1 - Two adjustments are made to the 3H-3He age to convert it to the initial infiltration age. First 3.5 yrs is added to account for travel time in the unsaturated zone. Second a 20% age reduction is applied as an estimated correction between the mean tritium age and the mean water mass age
2 - Mass fraction of water in the sample from the LWRP, remainder from precipitation
15
Figure 6. Tritium versus infiltration age.
Figure 7. Fraction of groundwater from LWRP versus infiltration age.
10
100
1000
10000
1/1/74 1/1/84 12/31/93 12/31/03
Infiltration Date
Trit
ium
(pC
i/L)
Groundwater
LWRP
Precipitation
Expon. (LWRP)
1P22J2
2Q1
2R1
11C3
0%
25%
50%
75%
100%
1/1/74 1/1/84 12/31/93
Initial Infiltration Date
Fra
ctio
n of
wat
er fr
om L
WR
P
1P22J2
2Q1 2R1
11C3
16
Figure 8. Net chloride enrichment versus infiltration age.
In summary, the recovered groundwater samples for this study were derived from amixture of wastewater and local precipitation that infiltrated from surface application betweenabout 1980 and 1995. While local precipitation causes some dilution of the wastewater,evaporative enrichment has produced net enrichments of nonvolatile dissolved components suchas Cl-.
0%
100%
200%
300%
400%
500%
1/1/74 1/1/84 12/31/93
Initial Infiltration Date
Net
Cl e
nric
hmen
t
1P2
2J2
2Q1
2R1
11C3
17
EDC TRANSPORT MODEL
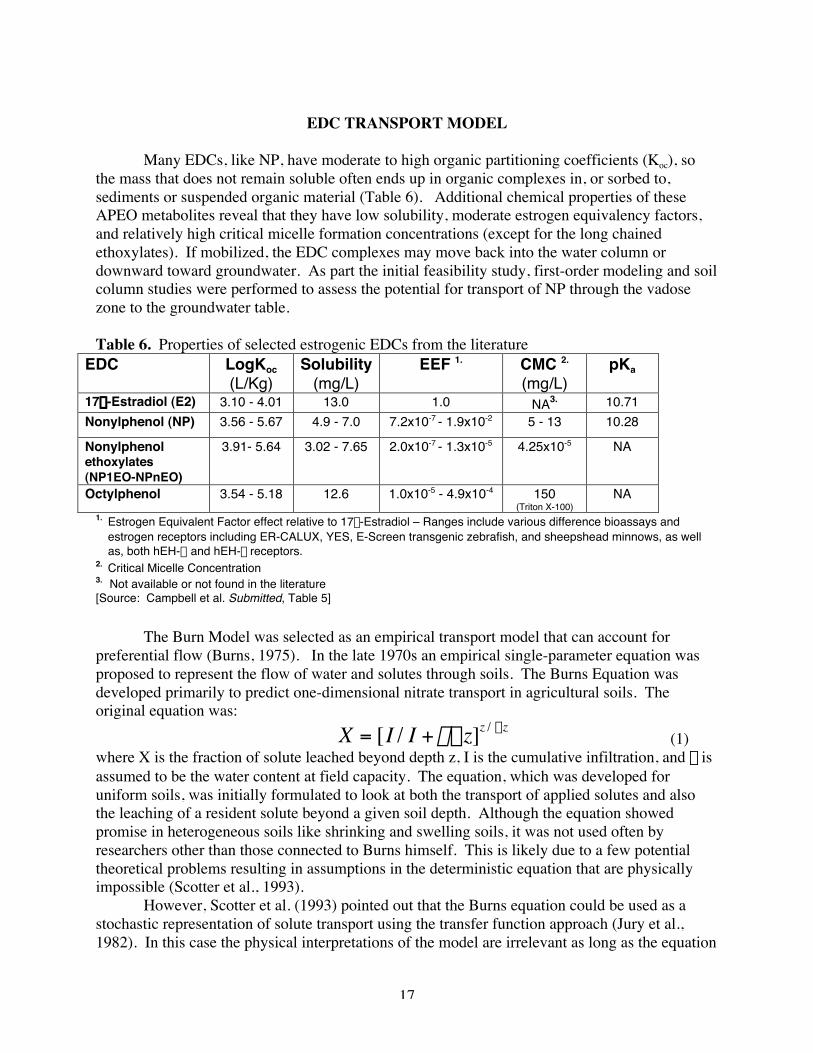
Many EDCs, like NP, have moderate to high organic partitioning coefficients (Koc), sothe mass that does not remain soluble often ends up in organic complexes in, or sorbed to,sediments or suspended organic material (Table 6). Additional chemical properties of theseAPEO metabolites reveal that they have low solubility, moderate estrogen equivalency factors,and relatively high critical micelle formation concentrations (except for the long chainedethoxylates). If mobilized, the EDC complexes may move back into the water column ordownward toward groundwater. As part the initial feasibility study, first-order modeling and soilcolumn studies were performed to assess the potential for transport of NP through the vadosezone to the groundwater table.
Table 6. Properties of selected estrogenic EDCs from the literatureEDC LogKoc
NA1. Estrogen Equivalent Factor effect relative to 17b-Estradiol – Ranges include various difference bioassays and
estrogen receptors including ER-CALUX, YES, E-Screen transgenic zebrafish, and sheepshead minnows, as wellas, both hEH-a and hEH-b receptors.
2. Critical Micelle Concentration3. Not available or not found in the literature[Source: Campbell et al. Submitted, Table 5]
The Burn Model was selected as an empirical transport model that can account forpreferential flow (Burns, 1975). In the late 1970s an empirical single-parameter equation wasproposed to represent the flow of water and solutes through soils. The Burns Equation wasdeveloped primarily to predict one-dimensional nitrate transport in agricultural soils. Theoriginal equation was:
X = [I / I +qDz]z / Dz(1)
where X is the fraction of solute leached beyond depth z, I is the cumulative infiltration, and q isassumed to be the water content at field capacity. The equation, which was developed foruniform soils, was initially formulated to look at both the transport of applied solutes and alsothe leaching of a resident solute beyond a given soil depth. Although the equation showedpromise in heterogeneous soils like shrinking and swelling soils, it was not used often byresearchers other than those connected to Burns himself. This is likely due to a few potentialtheoretical problems resulting in assumptions in the deterministic equation that are physicallyimpossible (Scotter et al., 1993).
However, Scotter et al. (1993) pointed out that the Burns equation could be used as astochastic representation of solute transport using the transfer function approach (Jury et al.,1982). In this case the physical interpretations of the model are irrelevant as long as the equation
18
represents the distribution of solute travel times through isolated stream tubes in the soil. As atransfer function, the model has the special advantage of needing only a single parameter, q,compared to the convection-dispersion equation or the convective lognormal transfer function(Jury and Roth, 1990), which each require at least two parameters.
As a transfer function the Burns equation is used to predict the transport of a solute as:P(z, I) = exp(-
zqI
) (2)
or the probability that a solute molecule applied to the surface will appear at depth z after totaldrainage I. Thus the appropriate form of the equation for a front application or a residentconcentration cumulative BTC is:
C(z,I )r = C0
r [1 - exp(- zqI
)] (3)
where Cro is the peak resident concentration.
The applicable forms for flux and resident concentration pulses have also been derived byScotter et al. (1993). For a resident solute pulse, the Burns Equation is:
C(z,I )r =
MqI
⋅ exp(-zqI
) (4)
and for flux concentrations from resident pulse:C(z,I )
f =Mzq
I2 ⋅ exp(- zqI
) (5)
where M is the total mass per unit area and volume respectively. Solute retardation (R) may beincluded in the flux concentration equation (White et al., 1998) as follows:
C(z,I )f =
MRzqI
Ê Ë
ˆ ¯ ⋅exp -
RzqI
Ê Ë
ˆ ¯ . (6)
A simple linear form of solute retardation may be used: R = 1+rbKd/q (7)
where rb is the soil bulk density and Kd the partitioning coefficient between solution and surfacecomplexation of a contaminant (White et al., 1998). Or for contaminants with a high affinity fororganic material a partitioning coefficient for organic carbon may be used:
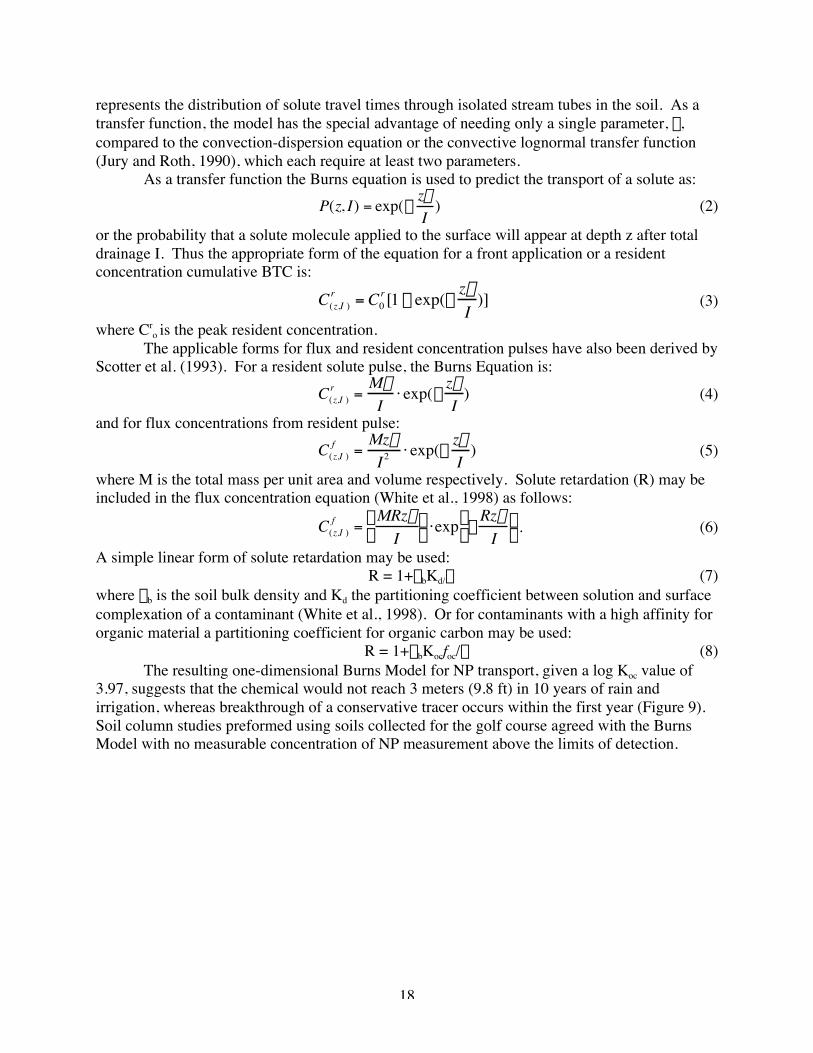
R = 1+rbKocfoc/q (8)The resulting one-dimensional Burns Model for NP transport, given a log Koc value of
3.97, suggests that the chemical would not reach 3 meters (9.8 ft) in 10 years of rain andirrigation, whereas breakthrough of a conservative tracer occurs within the first year (Figure 9).Soil column studies preformed using soils collected for the golf course agreed with the BurnsModel with no measurable concentration of NP measurement above the limits of detection.
19
Figure 9. Simulation results using the Burns Model to predict the depth distribution of aconservative tracer (representing water) and NP in the soils under the golf course for 1, 5, and 10years assuming a constant source concentration. Ordinate represents depth in meters.
FIELD SAMPLING PROCEDURES
Groundwater samples were collected from the Las Positas Golf Course, Livermore,California in July 2002, June 2003, August 2003, March 2004, and June 2004. Monitoring wellsare 2” diameter PVC with a 5 or 10’ screened interval (Table 1). Depth to water isapproximately 20’. Each well was purged three casing volumes prior to sample collection; pH,dissolved oxygen, oxidation reduction potential, conductivity, temperature, and turbidity weremeasured at each well, and all parameters were stable prior to sample collection. Samples werecollected in copper tubes and one-liter pre-cleaned amber IsoChem bottles. Copper tubes werestored at room temperature prior to analysis. Glass bottles were filled directly from the samplingport after triple rinsing each bottle. Bottles were filled to the bottom of the threads for the cap.The samples were stored without preservation at 4 oC prior to extraction. Gloves were worn bythe sampler and care was taken to avoid any contact with other liquids or with skin.
For this study, water samples from the LWRP were collected after tertiary treatment(representative of the water used for irrigation of the LPGC). Specifically, this water had passedthrough primary treatment (solids removal), secondary treatment (activated sludge, or biological,treatment), and secondary clarifiers (solids removal under quiescent conditions). Tertiarytreatment included filtration through “sand beds” with anthracite media, UV disinfection, andchlorination with sodium hypochlorite.
Water Table (9.14m)
0
1
2
3
4
5
6
7
8
9
10
0 10 20 30 40 50 60
Concentration at that depth (pCi/L)
Water Table (9.14 m)
0
1
2
3
4
5
6
7
8
9
10
0 0.5 1 1.5 2 2.5 3 3.5 4 4.5 5
Concentration at that depth (ug/L)
Burns Model for Tracer Burns Model for 4-NP
1 yr
5yrs
10 yrs
1 yr 5 yrs 10 yrs
20
DEVELOPMENT OF LC/MS/MS METHODS FOR TARGET COMPOUNDS
A 500-mL sample was spiked with appropriate isotopically-labeled internal standards.For nonylphenol, the internal standard employed for quantification was [ring-13C6]-n-nonylphenol (Cambridge Isotope Laboratories, Andover, MA). For the other APEO metabolitesstudied (AP1EC and AP2EC), the internal standard was 13C2-n-nonylphenoxyacetic acid(custom-synthesized by Cerilliant, Round Rock, TX); this NP1EC analog was used to representboth AP1EC and AP2EC. For the steroid estrogens 17 b-estradiol and estrone, the internalstandard employed for quantification was 17b-estradiol 16,17,17-d3 (ICN, Pointe-Claire,Quebec). Estrone-2,4,16,16-d4 3-sulfate was the internal standard employed for quantification ofestrone 3-sulfate (Cambridge Isotope Laboratories, Inc.). For caffeine, the internal standard usedfor quantification was caffeine-trimethyl 13C3 (Sigma Aldrich, MO).
Samples were pre-concentrated employing solid-phase extraction (SPE)(ENVI-18 disks,Supelco, Bellefonte, PA), followed by elution of the analytes with 10 mL of ultra-pure methanol.This constituted a 50-fold concentration of the analytes. Additionally, for each batch of samples,a 500-mL aliquot of reagent water was spiked with internal standards and extractedsimultaneously with the aqueous samples. To improve sensitivity for some target analytes (e.g.,17b-estradiol and estrone), an aliquot of the methanol extract was concentrated (e.g., 10-foldfrom 2 mL to 200 mL) with a gentle stream of nitrogen gas prior to LC/MS/MS analysis.
A Waters Model 2690 (Waters Corporation, Milford, MA) HPLC (High PerformanceLiquid Chromatography) instrument with a Nova-Pak C18 column (150 x 2.1 mm, 4-mm particlesize; Waters Corporation) was used for chromatographic separation of analytes. The sampleinjection volume was 25 mL. The mobile phase typically consisted of methanol:reagent watermixtures, with the flow rates ranging from 100-200 mL/min, depending on the analyte of interest.In some cases, chromatographic optimization studies revealed that methanol:water mixtures werenot sufficient for good chromatographic separation or retention. For example, chromatographicseparation of estrone 3-sulfate was achieved with a 40:60 mixture of methanol and 5 mMammonium acetate (in 90% water:10% methanol) and chromatographic separation of APECswas achieved with a 65:35 mixture of those two eluents.
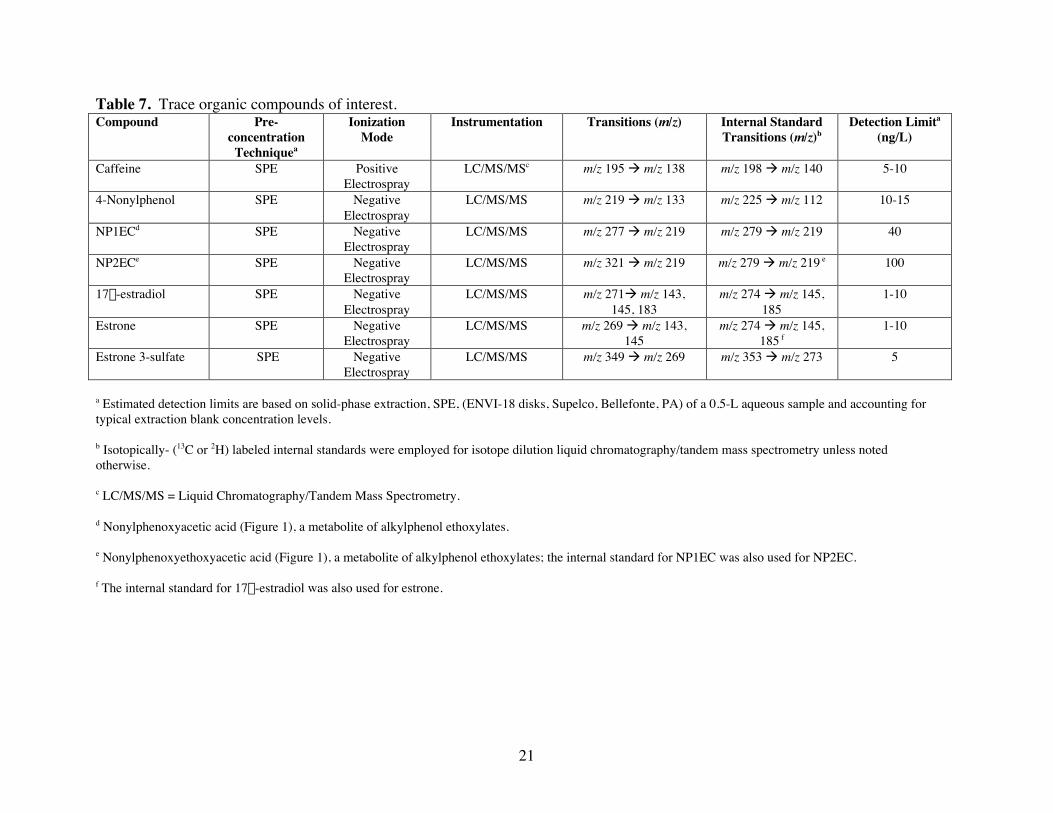
A triple quadrupole mass spectrometer - Quattro LC™ (Micromass, Manchester, UK) -was employed for mass determination and quantification. Operating conditions included anitrogen flow rate of 75 L/hr for the nebulizer and a flow rate of 350 L/hr during desolvation.Ion source temperatures were 80oC for the source block and 300oC for desolvation. Compound-specific optimization of MS and MS/MS parameters (e.g., sample cone voltage, capillaryvoltage, collision energy) for method development involved infusions of standards (typically 10mL/min for a 200 mg/L standard) and acquisition in full-scan mode or daughter ion mode.Optimized parameters are listed in Table 7. Isotope dilution quantification (with compound-specific corrections for internal standard recovery) was performed in selected reactionmonitoring mode for all analytes. Representative calibration curves for target analytes in thisstudy are presented in Figures 10-13.
21
Table 7. Trace organic compounds of interest.Compound Pre-
a Estimated detection limits are based on solid-phase extraction, SPE, (ENVI-18 disks, Supelco, Bellefonte, PA) of a 0.5-L aqueous sample and accounting fortypical extraction blank concentration levels.
b Isotopically- (13C or 2H) labeled internal standards were employed for isotope dilution liquid chromatography/tandem mass spectrometry unless notedotherwise.
c LC/MS/MS = Liquid Chromatography/Tandem Mass Spectrometry.
d Nonylphenoxyacetic acid (Figure 1), a metabolite of alkylphenol ethoxylates.
e Nonylphenoxyethoxyacetic acid (Figure 1), a metabolite of alkylphenol ethoxylates; the internal standard for NP1EC was also used for NP2EC.
f The internal standard for 17b-estradiol was also used for estrone.
22
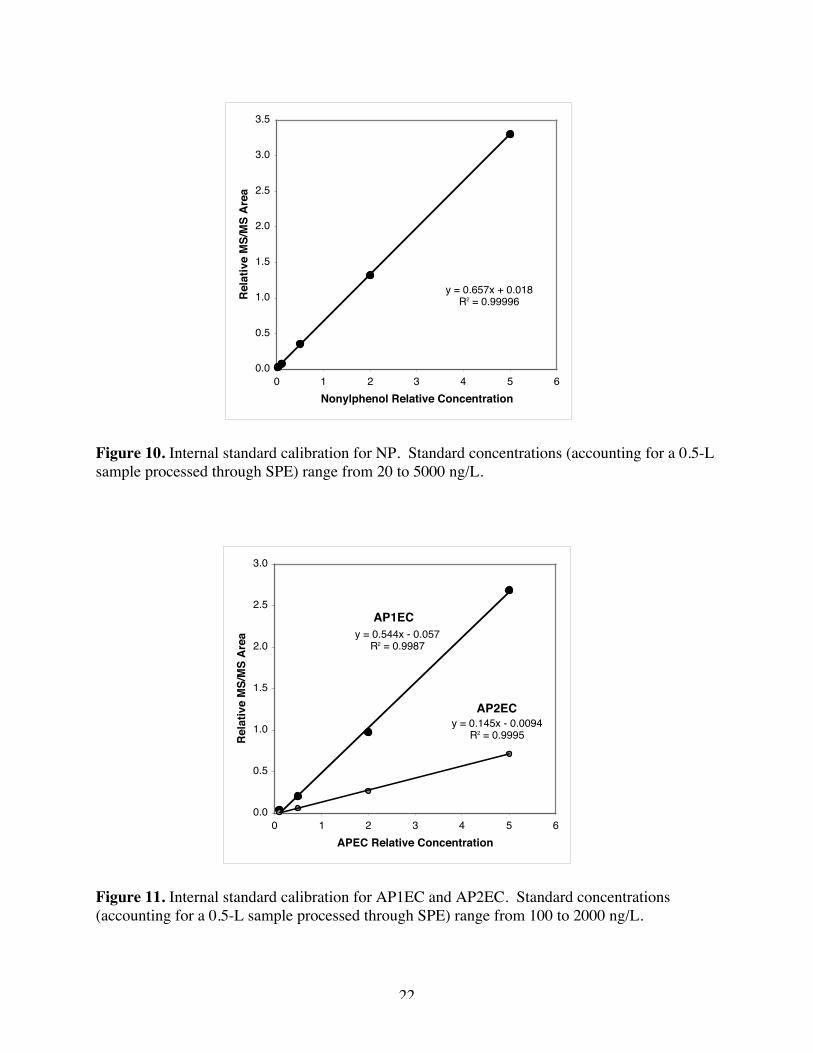
Figure 10. Internal standard calibration for NP. Standard concentrations (accounting for a 0.5-Lsample processed through SPE) range from 20 to 5000 ng/L.
Figure 11. Internal standard calibration for AP1EC and AP2EC. Standard concentrations(accounting for a 0.5-L sample processed through SPE) range from 100 to 2000 ng/L.
y = 0.657x + 0.018R2 = 0.99996
0.0
0.5
1.0
1.5
2.0
2.5
3.0
3.5
0 1 2 3 4 5 6Nonylphenol Relative Concentration
Rela
tive
MS/
MS
Area
y = 0.544x - 0.057R2 = 0.9987
y = 0.145x - 0.0094R2 = 0.9995
0.0
0.5
1.0
1.5
2.0
2.5
3.0
0 1 2 3 4 5 6APEC Relative Concentration
Rela
tive
MS/
MS
Area
AP2EC
AP1EC
23
Figure 12. Internal standard calibration for estrone 3-sulfate. Standard concentrations(accounting for a 0.5-L sample processed through SPE) range from 20 to 5000 ng/L.
Figure 13. Internal standard calibration for caffeine. Standard concentrations (accounting for a0.5-L sample processed through SPE) range from 20 to 500 ng/L.
Concentrations of NP, AP1EC, AP2EC, and caffeine in tertiary-treated effluent samplescollected from the LWRP between 2002 and 2004 are given in Table 8. For NP, concentrationsaveraged 3 mg/L and consistently fell between 2 and 4 mg/L. These concentrations agree wellwith data reported for treated effluent from other WWTPs (e.g., Johnson and Sumpter, 2001 andreferences therein). A typical LC/MS/MS chromatogram of NP in a LWRP effluent sample(Figure 14) illustrates the very high signal:noise ratios observed in these samples. Analyticalrecovery of the labeled NP internal standard was considerably lower than typically observed withgroundwater samples (e.g., Table 9) and method blanks. Thus, it is likely that the lower“recovery” resulted from signal suppression from the complex effluent matrix rather than loss ofNP during sample treatment. Concentrations of AP1EC and AP2EC are reported only for theperiod when internal standard quantification was possible (i.e., after the custom synthesis of thelabeled AP1EC internal standard was completed). The overall average concentrations of 18mg/L for AP1EC and 61 mg/L for AP2EC are well within the range of values reported previouslyfor treated WWTP effluents (e.g., Field and Reed, 1996). The APEC results also agreequalitatively with published data from other WWTPs (Field and Reed, 1996) in the sense thatAP2EC concentrations were consistently greater than AP1EC concentrations (for this study, byan average factor of 3 to 4 and in other studies by a factor of 3 to 14). Analytical recoveries ofthe labeled AP1EC internal standard were considerably higher than for NP, which may beexplained by the different eluent and higher mass range used for APEC analysis. Caffeine,which is not an EDC but does have value as a wastewater indicator compound, was onlymeasured for this study in July 2003. The concentration, near 0.5 mg/L, is in the range of valuesreported for other WWTP effluents (Seiler et al., 1999; Buerge et al., 2003 and referencestherein).
The following compounds were not observed in LWRP samples:
• Estrone 3-sulfate was not detected in LWRP samples (grab and composite) collected inJuly 2003 despite detection limits on the order of 0.5 ng/L (the extract was concentrated10-fold more than for other analytes) and satisfactory analytical recovery of the labeledinternal standard (23 to 72% recovery).
• Semi-quantitative results indicate that collected LWRP effluent and groundwater samplesdid not contain 17b-estradiol or estrone at detectable concentration levels (i.e., above 5ng/L). Extraction method blank samples had satisfactory surrogate standard recoveriesand did not contain detectable levels of these compounds. Notably, surrogate standardrecoveries in LWRP effluent and groundwater samples for the isotopically labeled 17b-estradiol standard were low (<10%). The total dissolved solids content in LWRP effluentand groundwater samples was relatively high, and may have contributed to the lowsurrogate recoveries (i.e., electrospray ion suppression). As described previously, toimprove sensitivity for 17b-estradiol and estrone in samples, an aliquot of the methanolextract was concentrated (e.g., 10-fold) prior to LC/MS/MS analysis; analysis of
25
methanol extracts that had not been concentrated also showed poor surrogate recoveries.Furthermore, standard addition experiments were conducted with the concentratedgroundwater extracts, and percent recoveries remained low.
26
Table 8. NP, APEC, and caffeine concentrations in the LWRP (Livermore Wastewater Recycling Plant) tertiary effluent.
Table 9. NP, APEC, and caffeine concentrations in groundwater near the Livermore golf course.
Sampling date NP(ng/L)
NPrecovery (%)
AP1EC(ng/L)
AP1ECrecovery (%)
AP2EC(ng/L)
Caffeine(ng/L)
Caffeinerecovery (%)
July 2002 60 to 1800 (A,B,E)a 32 to 96June 2003 1000 to 2000 (A;4 others) 46 to 73August 2003 220 to 820 (A-D) 38 to 86 <40 to 140 (A-C) 72 to 90 <100 to 170
(A-C)March 2004 <11 (A-D,F)b 62 to 90 <10 to 65 (A-D,F) 72 to 88 <100 (A-D,F) <5 (A-D) 13-23June 2004 <blank (A)b,c 66 <40 (A) 105 <150 (A)
a Sampling locations: A=1P2, B=2R1, C=2J2, D=2Q1, E=11B1, F=11C3 (see Figure 2 for well locations).b Sampling artifacts for NP were effectively minimized by March 2004 (shaded region); all previous NP data are highly unlikely to berepresentative because of probable sampling artifacts.
c NP in the method blank run on June 2004 was 360 ng/L.
27
Figure 14. Typical LC/MS/MS chromatogram of NP (m/z 219‡133) in an LWRP effluentsample. The effective concentration of the internal standard (m/z 225‡112) is 1 mg/L.
2.50 3.00 3.50 4.00 4.50 5.00 5.50 6.00 6.500
100
0
100
0
100 225 > 1124.87
219 > 1333.70
TIC3.70
4.87
28
LPGC GROUNDWATER RESULTS
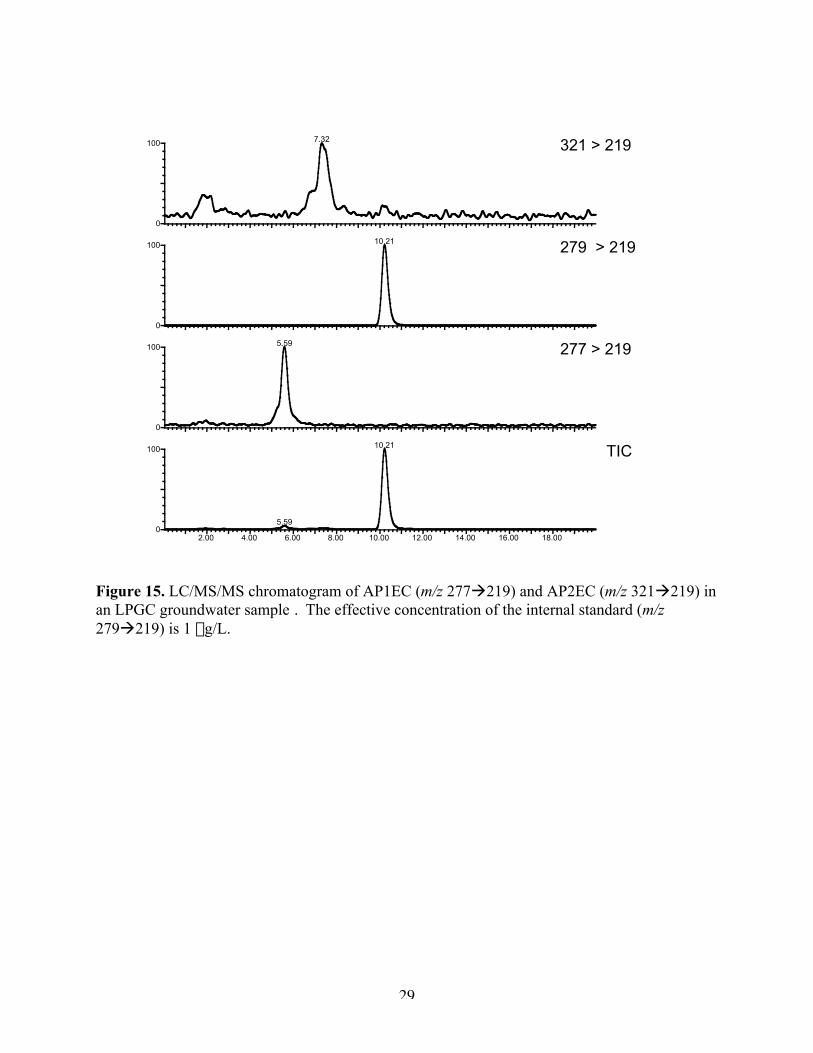
Concentrations of NP, AP1EC, AP2EC, and caffeine in groundwater samples collectedfrom the LPGC area between 2002 and 2004 are compiled in Table 9. Note that concentrationsin Table 9 are given in ng/L, whereas those in Table 8 are given in mg/L. For samplings beforeMarch 2004, NP concentrations ranged widely (between 60 and 2000 ng/L) and surprisinglyapproached the concentrations observed in the LWRP effluent (~3000 ng/L; Table 8). It waseventually determined that the downhole pump was a source of NP contamination forgroundwater samples; this was even the case when the well was purged with the pump butsampled with a Teflon bailer. In March 2004, when a new groundwater pumping system wasimplemented that included Teflon tubing, NP was no longer detectable in groundwater samples(< 11 ng/L; Table 9). Notably, analytical recoveries of the NP internal standard were favorablein these samples (62-90%; Table 9), demonstrating that the lack of NP detection was not due toinefficient extraction. Although NP was detected in a later sampling with the improved samplingequipment (June 2004), concentrations were below the concentration in a method blankprocessed in parallel with the samples; thus, these detections cannot be considered valid. Theseresults indicate that NP concentrations in groundwater were at least 270-fold lower than those inthe irrigation water (i.e., LWRP effluent). AP1EC and AP2EC were occasionally detected ingroundwater samples, but at concentrations of less than 200 ng/L. An LC/MS/MSchromatogram of APECs in a groundwater sample (Figure 15) illustrates that these peaks couldbe easily distinguished from background in this matrix. The maximum detected concentrationsof AP1EC and AP2EC in groundwater occurred in wells 2J2 and 2R1 and were ~130-fold and360-fold lower, respectively, than the average concentrations in irrigation water. Unlike thequalitative trends observed in the LWRP effluent samples, AP2EC concentrations were notconsistently higher than AP1EC concentrations in groundwater samples. Caffeine was notdetected in groundwater at a detection limit that was ~100-fold lower than the averageconcentration in the irrigation water. Estrone 3-sulfate (data not shown) was not detected inthree groundwater samples collected in July 2002 despite high analytical recovery (86 to 103%).
Overall, concentrations of NP, AP1EC, AP2EC, and caffeine were from ~130- to 360-fold lower in groundwater than in irrigation water (i.e., LWRP effluent). Since hydrologicalmodeling indicates that irrigation water was diluted only 33 to 73% with local precipitation inthe aquifer, attenuation of these compounds during transport through the vadose zone andsaturated zone (e.g., by sorption for the APEO metabolites and by biodegradation for caffeine)must have been very substantial. Sorption of NP is not surprising considering its highlyhydrophobic nature (e.g., Table 6, Figure 9).
29
Figure 15. LC/MS/MS chromatogram of AP1EC (m/z 277‡219) and AP2EC (m/z 321‡219) inan LPGC groundwater sample . The effective concentration of the internal standard (m/z279‡219) is 1 mg/L.
In vitro assays for estrogenic activity provide an integrated measure of estrogenic potencyof environmental samples without requiring knowledge of all bioactive compounds in thesamples. Chemical analysis of all known estrogenic compounds would be extremely costly andtime-consuming. In addition, unknown estrogenic compounds may be present. Several differentbioassays have been developed and have been tested for application to wastewater and surfacewater (Zacharewski, 1997; Murk et al., 2002) including cell proliferation assays (Soto et al.,1995), and reporter gene approaches including yeast-based screens (Routledge et al., 1996) andhuman cell line screens (Legler et al., 1999). Based on our initial investigation of availablebioassays, we focused on a system using a human breast cancer cell line (MCF-7) including adual-luciferase assay (Promega) for application to the target compounds and groundwatersamples. We performed a quantitative assessment of the bioassay including analysis ofreproducibility, detection limit, and response range. After bioassay optimization for theenvironmental matrices, we applied the assay to both LPGC groundwater and LWRP effluent.Estrogenic potencies from the bioassay were subsequently correlated with chemical dataobtained as described previously.
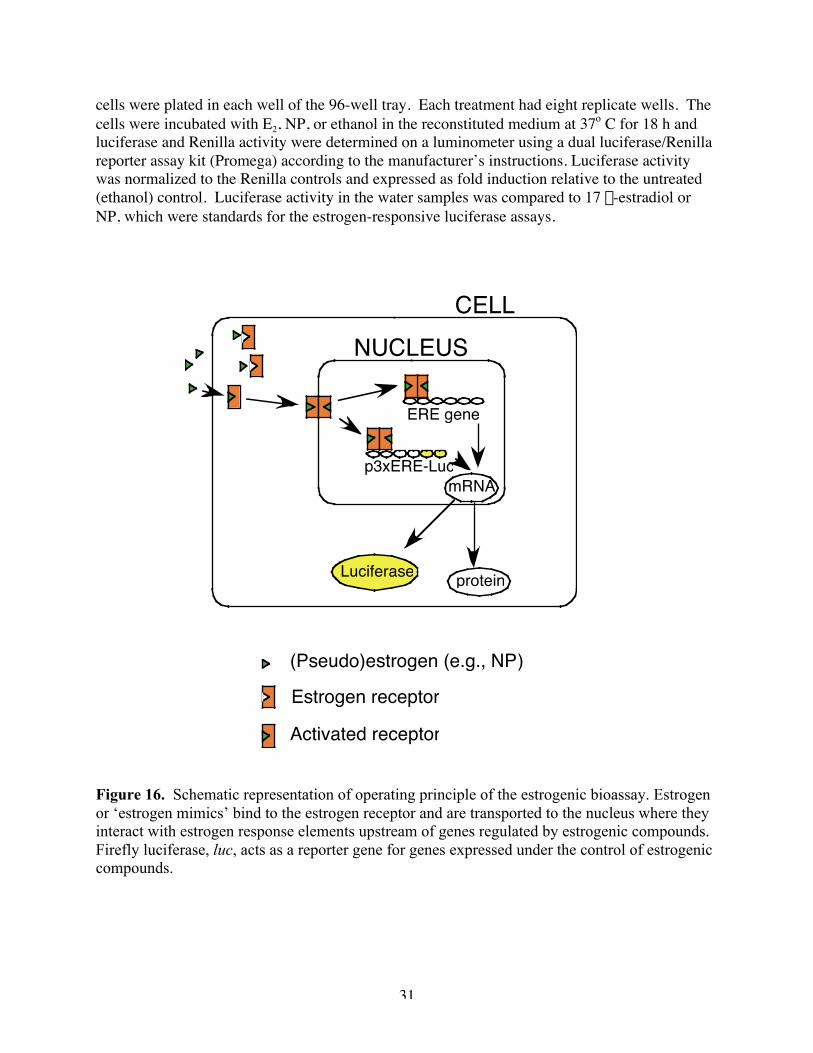
The reporter bioassay system employed is based on an estrogen-responsive luciferasereporter system. The human epithelial breast cancer cell line MCF-7 was used as a host. MCF-7cells contain endogenous estrogen receptors and have been well characterized in terms of theirresponse to estrogenic stimuli. The cells were transfected with a plasmid containing an estrogen-responsive reporter construct with three estrogen-responsive elements (EREs) upstream of theluciferase reporter gene (EREx3-Luc; Figure 16). This plasmid was co-transfected with acommercially available control Renilla reporter plasmid (pRL-TK, Promega) to monitor thetransfection efficiency and to normalize the luciferase activity.
MCF7 cells (purchased from the American Type Culture Collection, or ATCC) weremaintained in DMEM medium containing 10% fetal bovine serum (FBS), 2 mM glutamine and 1mg/mL insulin. MCF7 cells were plated in 6-well trays at 2x10⁶ cells/well in phenol red-freeDMEM medium containing 10% charcoal-stripped FBS and insulin (CS-DMEM) and incubatedat 37o C for 24 h. Experimental variability was significantly reduced by transfecting cells inlarger batches and subsequently splitting cells after trypsinization. Immediately beforetransfection, the medium was changed to 2 mL of phenol red-free Opti-MEM (Invitrogen) withreduced serum. Transfection was performed using Lipofactamine 2000 (Invitrogen) with EREx3-luc (5µg/well) and Renilla control plasmids (5µg/well) per the manufacturer’s instructions. Thecells were exposed to the plasmids for 24 h.
The transfected cells were trypsinized and plated in a 96-well tray at 2x10⁴ cells/well, andincubated at 37o C for 6 h. The cells were treated with 17 b-estradiol (E2) as a positive control orNP at various concentrations in ethanol at 2 µL. The same volume of ethanol was used as acontrol. For water samples, 5 mL of CS-DMEM was lyophilized and the water sample was usedto reconstitute the medium. LWRP water containing chlorine (residue from disinfection) waspre-treated by purging with N2 for 15 min or by addition of 20 mM sodium thiosulfate, whichreduces chlorine to chloride ions. Cells were suspended in reconstituted medium and 200 µL of
31
cells were plated in each well of the 96-well tray. Each treatment had eight replicate wells. Thecells were incubated with E2, NP, or ethanol in the reconstituted medium at 37o C for 18 h andluciferase and Renilla activity were determined on a luminometer using a dual luciferase/Renillareporter assay kit (Promega) according to the manufacturer’s instructions. Luciferase activitywas normalized to the Renilla controls and expressed as fold induction relative to the untreated(ethanol) control. Luciferase activity in the water samples was compared to 17 b-estradiol orNP, which were standards for the estrogen-responsive luciferase assays.
Figure 16. Schematic representation of operating principle of the estrogenic bioassay. Estrogenor ‘estrogen mimics’ bind to the estrogen receptor and are transported to the nucleus where theyinteract with estrogen response elements upstream of genes regulated by estrogenic compounds.Firefly luciferase, luc, acts as a reporter gene for genes expressed under the control of estrogeniccompounds.
protein
ERE gene
p3xERE-LucmRNA
Luciferase
CELLNUCLEUS
(Pseudo)estrogen (e.g., NP)
Estrogen receptor
Activated receptor
32
ESTROGENIC BIOASSAY RESULTS
Bioassay dose-response curves for E2 and NP are shown in Figure 17 A and B,respectively. The values represent the fold increase in luminescence response (fold-induction)relative to the control without estrogenic compounds (which is set at 1). There is some irregularbehavior in the dose-response curve although in general the fold-induction increases forincreasing concentrations of E2 and NP.
A B
MCF7/E2
0.8
1
1.2
1.4
1.6
1.8
2
2.2
2.4
2.6
0 0.1 0.5 1
E2 concentration (nM)
Luc
Indu
ctio
n (f
old)
MCF7/NP
0.8
0.9
1
1.1
1.2
1.3
1.4
1.5
1.6
1.7
0 0.002 0.023 0.227 2.273
NP concentration (µM)
Luc
Indu
ctio
n (f
old)
Figure 17. Luciferase reporter assay response to increasing concentrations of (A) 17 b-estradiol(E2) and (B) NP. Results are means and standard deviations for eight replicate samples. Notedifferences in concentration range between the two plots.
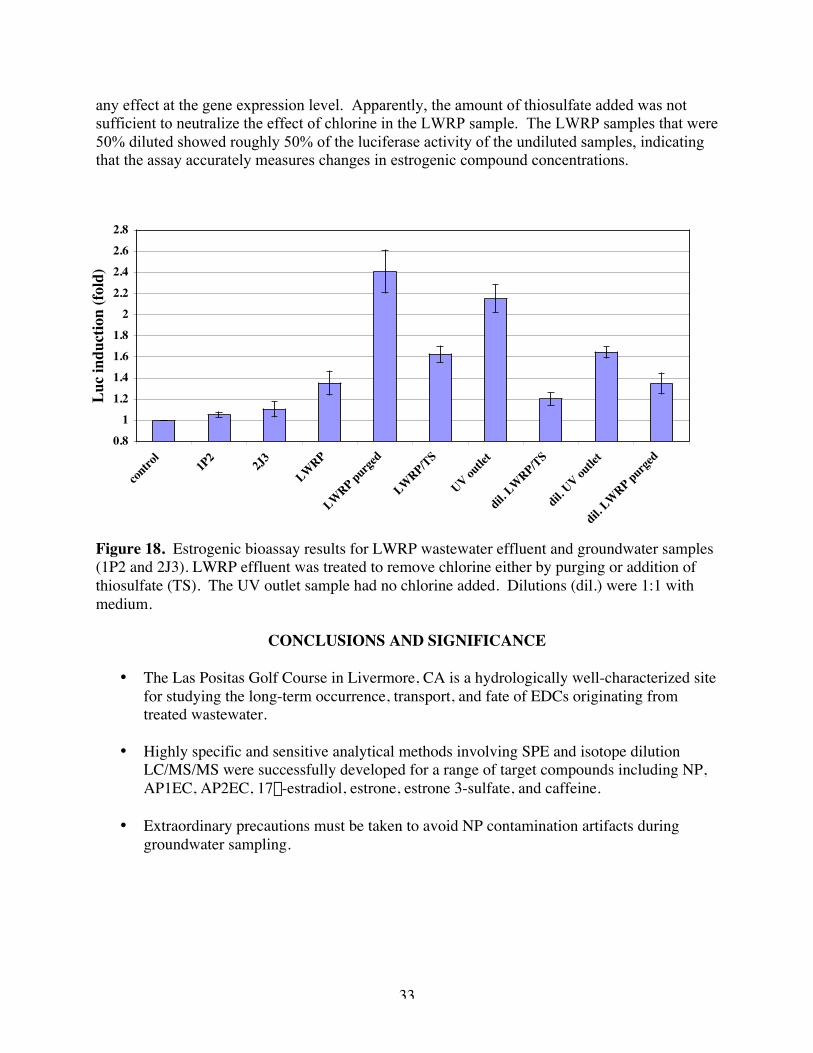
The results for the estrogenic bioassay applied to both LPGC groundwater (wells 1P2 and2J3) and LWRP effluent are shown in Figure 18. For the LWRP effluent samples, the level offold-induction of luciferase was significantly higher than for the control (ca. 2.4-fold higher).Although NP concentration data were not obtained from the assayed samples due to inadequatesample volumes, the LWRP samples typically contain from 0.01-0.023 mM NP (3 mg/L onaverage; Table 8). The estrogenic response to LWRP samples exceeds that which would be dueto the NP in the sample (ca. 1.4 fold induction for 0.023 mM NP), suggesting that otherestrogenic compounds are present in the LWRP effluent. In contrast, the groundwater samplesdid not show a significant increase in luciferase activity relative to the control, which wasconsistent with analytical data showing no detectable NP or steroid estrogens in the groundwatersamples. Although not statistically significant, the trend in slightly greater luciferase activity inthe groundwater samples may be due to the presence of other unknown estrogenic compounds.Removal of chlorine by purging with N2 or pre-treating with thiosulfate increased the luciferaseactivity of the LWRP effluent, suggesting that chlorine (or related byproducts) reduce thecellular response to EDCs. The effect is likely due to cell toxicity (Lu et al., 2002) rather than
33
any effect at the gene expression level. Apparently, the amount of thiosulfate added was notsufficient to neutralize the effect of chlorine in the LWRP sample. The LWRP samples that were50% diluted showed roughly 50% of the luciferase activity of the undiluted samples, indicatingthat the assay accurately measures changes in estrogenic compound concentrations.
Figure 18. Estrogenic bioassay results for LWRP wastewater effluent and groundwater samples(1P2 and 2J3). LWRP effluent was treated to remove chlorine either by purging or addition ofthiosulfate (TS). The UV outlet sample had no chlorine added. Dilutions (dil.) were 1:1 withmedium.
CONCLUSIONS AND SIGNIFICANCE
• The Las Positas Golf Course in Livermore, CA is a hydrologically well-characterized sitefor studying the long-term occurrence, transport, and fate of EDCs originating fromtreated wastewater.
• Highly specific and sensitive analytical methods involving SPE and isotope dilutionLC/MS/MS were successfully developed for a range of target compounds including NP,AP1EC, AP2EC, 17b-estradiol, estrone, estrone 3-sulfate, and caffeine.
• Extraordinary precautions must be taken to avoid NP contamination artifacts duringgroundwater sampling.
0.81
1.21.41.61.8
22.22.42.62.8
contro
l1P
22J3
LWRP
LWRP purged
LWRP/TS
UV outle
t
dil. LWRP/TS
dil. UV ou
tlet
dil. LWRP purge
d
Luc i
nduc
tion
(fold
)
34
• NP was not detected in LPGC groundwater (detection limit, 11 ng/L) despite averageconcentrations of 3000 ng/L in the irrigation water (i.e., LWRP tertiary-treated effluent);these results cannot be explained by low analytical recovery in groundwater samples,since recoveries were from 62 to 90% for the labeled NP internal standard. Maximumconcentrations of the APEO metabolites AP1EC and AP2EC in LPGC groundwater werefrom 130- to 360-fold lower than in irrigation water. Since hydrological modelingindicates that irrigation water was diluted only 33 to 73% with local precipitation in theaquifer, attenuation of these compounds during transport through the vadose zone andsaturated zone (e.g., by sorption of the APEO metabolites) must have been verysubstantial. High sorptive attenuation of NP is consistent with laboratory column studiesand modeling conducted for this project.
• The estrogenic bioassay showed a significant response to the LWRP samples thatcontained approximately 3 mg/L NP. No significant luciferase response was noted forcells exposed to LPGC groundwater, which was consistent with analytical data showingno detectable NP or steroid estrogens in the groundwater samples.
• To our knowledge, this is the first study of the subsurface transport of EDCs as a result oflandscape irrigation with treated wastewater.
REFERENCES
Ahel, M., Giger, W., and M. Koch. 1994. Behavior of alkylphenol polyethoxylate surfactants inthe aquatic environment – I. occurrence and transformation in sewage treatment. WaterResearch. 28:1131-1142.
Arnold, S. F., Klotz, D. M., Collins, B. M., Vonier, P. M., Guillette, Jr., L. J., and J. A.McLachlan. 1996a. Synergistic activation of estrogen receptor with combinations ofenvironmental chemicals. Science. 272:1489-1493.
Bacaloni, A., Cavaliere, C., Faberi, A., Foglia, P., Samperi, R., and A. Lagana. 2005.Determination of isoflavones and coumestrol in river water and domestic wastewater sewagetreatment plants. Analytica Chimica Acta. 531:229–237.
Benfenati, E., Barceló, D., Johnson, I., Galassi, S., and K. Levsen. 2003. Emerging organiccontaminants in leachates from industrial waste landfills and industrial effluent. Trends inAnalytical Chemistry. 22:757-765.
Blackburn, M. A. and M. J. Waldock. 1995. Concentrations of alkyphenols in rivers andestuaries in England and Wales. Water Research. 29:1623-1629.
Buerge, I. J., Poiger, T., Müller, M. D., and H.-R. Buser. 2003. Caffeine, an anthropogenicmarker for wastewater contamination of surface waters. Environmental Science and Technology.37:691-700.
35
Burns, I. G. 1975. An equation to predict the leaching of surface-applied nitrate. Journal ofAgricultural Science. 85:443-454.
Campbell, C. G., S. E. Borglin, F. B. Green, A. Grayson, E. Wozei, and W. T. Stringfellow.Submitted Environmental Monitoring, Fate, and Transport of Estrogenic Endocrine DisruptingCompounds: A Review.
Colborn, T., vom Saal, F. S. and A. M. Soto. 1993. Developmental effects of endocrinedisrupting chemicals in wildlife and humans. Environmental Health Perspectives. 101:378-384.
Dallinga, J. W., Moonen, E. J. C., Dumoulin, J. C. M., Evers, J. L. H., Geraedts, J. P. M., andJ.C.S. Kleinjans. 2002. Decreasing human semen quality and organochlorine compounds inblood. Human Reproduction. 17:1973-1979.
Fan, Y., Zhang, M., Da, S.-L., and Y.-Q. Feng. 2005. Determination of endocrine disruptors inenvironmental waters using poly(acrylamide-vinylpyridine) monolithic capillary for in-tubesolid-phase microextraction coupled to high-performance liquid chromatography withfluorescence detection. Analyst. 130:1065–1069.
Field, J. A., and R. L. Reed. 1996. Nonylphenol polyethoxy carboxylate metabolites of nonionicsurfactants in U.S. paper mill effluents, municipal sewage treatment plant effluents, and riverwaters. Environmental Science and Technology. 30:3544-3550.
Folmar, L.C., Hemmer, M. J., Denslow, N. D., Kroll, K., Chen, J., Cheek, A., Richman, H.,Meredith, H. and E. G. Grau. 2002. A comparison of the estrogenic potencies of estradiol,ethynylestradiol, diethylstilbestrol, nonylphenol and methoxychlor in vivo and in vitro. AquaticToxicology. 60:101–110.
Fox, P., Houston, S., Westerhoff, P., Drewes, J. E., Nellor, M., Yanko, W., Baird, R., Rincon,M., Arnold, R., Lansey, K., Bassett, R., Gerba, C., Karpiscak, M., Quanrud, D., Amy, G., and M.Reinhard. 2001. An investigation of soil-aquifer treatment for sustainable water reuse.(publication release by the National Center for Sustainable Water Supply).Fry, D. M., and C. K. Toone, 1981. DDT-induced feminization of gull embryos. Science.213:922-924.
Giesy, J. P., Hilscherova, K., Jones, P. D., Kannan, K., and M. Machala. 2002. Cell bioassays fordetections of aryl hydrocarbon (AhR) and estrogen receptor (ER) mediated activity inenvironmental samples. Marine Pollution Bulletin. 45:3-16.
Guenther, K., Heinke, V., Thiele, B., Kleist, E., Prast, H., and T. Raecker. 2002. Endocrinedisrupting nonylphenols are ubiquitous in food. Environmental Science and Technology.36:1676-1680.
Guillette, L. J., Gross, T. S., Masson, G. R., Matter, J. M., Percival, H. F., and A. R. Woodward.1994. Developmental abnormalities of the gonad and abnormal sex hormone concentrations in
36
juvenile alligators from contaminated and control lakes in Florida. Environmental HealthPerspectives. 102:680-687.
Hayes, T., Haston, K., Tsui, M., Hoang, A., Haeffele, C. and A. Yonk. 2002. Feminization ofmale frogs in the wild: water-borne herbicide threatens amphibian populations in parts of theUnited States. Nature. 419:895-896.
Heisterkamp, I., Ganrass, J., and W. Ruck. 2004. Bioassay-directed chemical analysis utilizingLC-MS: a tool for identifying estrogenic compounds in water samples? Analytical andBioanalytical Chemistry. 378:709-715.
Howdeshell, K. L., Hotchkiss, A. K., Thayer, K. A., Vandenbergh, J. G., and F. S. vom Saal.1999. Exposure to bisphenol A advances puberty. Nature. 401:763-764.
Huang, C. H. and D. L. Sedlak. 2001. Analysis of estrogenic hormones in municipal wastewatereffluent and surface water using enzyme linked immunosorbent assay and gas chromatography/tandem mass spectrometry. Environmental Toxicology and Chemistry. 20:133–139.
Itoh, N., Kayama, F., Tatsuki, T. J., and T. Tsukamoto. 2001. Have sperm counts deterioratedover the past 20 years in healthy, young Japanese men? Results from the Sapporo area. Journalof Andrology. 22:40-44.
Johnson, A. C., and J. P. Sumpter. 2001. Removal of endocrine-disrupting chemicals in activatedsludge treatment works. Environmental Science and Technology. 35:4697-4703.
Johnson, M. L., Salveson, A., Holmes, L., Denison, M., and D. M. Fry. 1998. Environmentalestrogens in agricultural drain water from the Central Valley of California. Bulletin ofEnvironmental Contamination and Toxicology. 60:609-614.
Jury, W. A. 1982. Simulation of solute transport using a transfer function. Water ResourceResearch. 18:363.
Jury, W. A. and K. Roth. 1990. Transfer functions and solute movement through soil. Basel,Germany, Birkhauser Verlag.
Kolpin, D. W., Furlong, E. T., Meyer, M. T., Thurman, E. M., Zaugg, S. D., Barber, L. B., andH. T. Buxton. 2002. Pharmaceuticals, hormones, and other organic wastewater contaminants inU.S. streams, 1999-2000: a national reconnaissance. Environmental Science and Technology.36:1202-1211.
Legler, J., van den Brink, C. E., Brouwer, A., Murk, A. J., van der Saag, P. T., Vethaak, A. D.,and B. van der Burg. 1999. Development of a stably transfected estrogen receptor-mediatedluciferase reporter gene assay in the human T47D breast cancer cell line. Toxicology Science.48:55-66.
37
Legler, J., Zeinstra, L. M., Schuitemaker, F., Lanser, P. H., Bogerd, J., Brouwer, A., Vethaak, A.D., DeVoogt, P., Murk, A. J., and B. Van der Burg. 2002a. Comparison of in vivo and in vitroreporter gene assays for short-term screening of estrogenic activity. Environmental Science andTechnology. 36:4410-4415.
Levin, A. D. and T. Asano. 2004. Recovering sustainable water from wastewater. EnvironmentalScience and Technology. 201A-208A.
Lu, W.Q., Chen, X. N., Yue, F., Jenter, C., Gminski, R., Li, X. Y., Xie, H., and Mersch-Sundermann, V. 2002. Studies on the in vivo and in vitro mutagenicity and the lipid peroxidationof chlorinated surface (drinking) water in rats and metabolically competent human cells. Mutat.Res. 513:151-157.
McLachlan, J. A. (ed.) 1985. Estrogens in the Environment. Elsevier Publishing, New York.
Mocarelli, P., Brambilla, P., Geryhoux, P. M., Patterson, D. G., and L. L. Needham. 1996.Change in sex ratio with exposure to dioxin. Lancet. 348:409.
Müller, S.O. 2004. Xenoestrogens: mechanisms of action and detection methods. Analytical andBioanalytical Chemistry. 378: 582-587.
NRC (National Resource Council). 1999. Hormonally active agents in the environment.National Academy Press, Washington, D. C.
Petrovic, M., and D. Barceló. 2000. Determination of anionic and nonionic surfactants, theirdegradation products, and endocrine-disrupting compounds in sewage sludge by liquidchromatography/mass spectrometry. Analytical Chemistry. 72:4560-4567
Petrovic, M., and D. Barceló. 2004. Analysis and fate of surfactants in sludge and sludge-amended soils. Trends in Analytical Chemistry. 23:762-771.
Petrovic, M., Eljarrat, E., Lopez de Alda, M. J. and D. Barceló. 2002. Recent advances in themass spectrometric analysis related to endocrine disrupting compounds in aquatic environmentalsamples. Journal of Chromatography. 974:23-51.
Petrovic, M., Eljarrat, E., Lopez de Alda, M. J. and D. Barceló. 2004. Endocrine disruptingcompounds and other emerging contaminants in the environment: a survey on new monitoringstrategies and occurrence data. Analytical and Bioanalytical Chemistry. 378:549-562.
Petrovic, M., Gonzalez, S., and D. Barceló. 2003. Analysis and removal of emergingcontaminants in wastewater and drinking water. Trends in Analytical Chemistry. 22:685-696.
Ramamoorthy, K., Wang, F., Chen, I. C., Safe, S., Norris, J. D., Mcdonnell, D. P., Gaido, K. W.,Bocchinfuso,W. P. and K. S. Korach. 1997. Potency of combined estrogenic pesticides. Science.275:405.
38
Routledge, E. J., and J. P. Sumpter. 1996. Estrogenic activity of surfactants and some of theirdegradation products assessed using a recombinant yeast screen. Environmental Toxicology andChemistry. 15:241-248.
Scotter, D. R., White, R. E., and J. S. Dyson. 1993. The Burns leaching equation. Journal of SoilScience. 44:25-33.
Seiler, R. L., Zaugg, S. D., Thomas, J. M., and D. L. Howcroft. 1999. Caffeine andpharmaceuticals as indicators of wastewater contamination in wells. Ground Water. 37:405-410.
Sharpe, R. M., and N. E. Skakkebaek. 1993. Are estrogens involved in falling sperm counts anddisorders of the male reproductive tract? Lancet. 341:1392-1395.
Snyder, S. A, Westerhoff, P., Yoon, Y., and D. L. Sedlak. 2003. Pharmaceuticals, personal careproducts, and endocrine disruptors in water: implications for the water industry. EnvironmentalEngineering Science. 20:449-469.
Soto, A. M., Sonnenschein, C., Chung, K. L., Fernandez, M. F., Olea, N., and F. O. Serrano.1995. The E-SCREEN assay as a tool to identify estrogens: an update on estrogenicenvironmental pollutants. Environmental Health Perspectives. 103(Suppl.):113-122.
Standley, L. J., Kaplan, L. A., and D. Smith. 2000. Molecular tracers of organic matter sources tosurface water resources. Environmental Science and Technology. 34:3124-3130.
Stopper, H., Schmitt, E., and K. Kobras. 2005. Genotoxicity of phytoestrogens. MutationResearch. 574:139–155.
Swan, S. H., Elkin, E. P., and L. Fenster. 1997. Have sperm densities declined? A reanalysis ofglobal trend data. Environmental Health Perspectives. 105:1228-1232.
Ternes, T. A., Joss, A., and H. Siegrist. 2004. Scrutinizing pharmaceuticals and personal careproducts in wastewater treatment. Environmental Science and Technology. 393A-399A.
United States Environmental Protection Agency (US EPA). 1997. Special report onenvironmental endocrine disruption: an effects assessment and analysis. Washington, D. C:Office of Research and Development. EPA/630/R-96/012.
Westerhoff, P., Yeomin, Y., Snyder, S., and E. Wert. 2005. Fate of endocrine-disruptorpharmaceutical, and personal care product chemicals during simulated drinking water treatmentprocesses. Environmental Science and Technology. 39:6649-6663.
White , R. E., Heng, L. K., and R. B. Edis.1998. Transfer function approaches to modeling solutetransport in soils. Chapter 12. In H Magdi Selim and L Ma (eds.). Physical nonequilibrium insoils: modeling and application. Sleep Bear Press. Ann Arbor Press, Inc. Chelsea, MI. 311-347.
39
Wozei, E. 2004. Investigating the reduction of estrogenic activity by activated sludge. DoctoralThesis. University of California, Berkeley, 155.
Ying, G.-G., Williams, B. and R. Kookana. 2002. Environmental fate of alkyphenols andalkyphenol ethoxylates – a review. Environmental International. 28:215-226.
Zacharewski, T. 1997. In vitro bioassays for assessing estrogenic substances. EnvironmentalScience and Technology. 31:613-623.
Zhang, F., Bartels, M. J., Brodeur, J. C., McClymont, E. L., and K. B. Woodburn. 2004.Quantitation of 17 alpha-ethinylestradiol in aquatic samples using liquid-liquid phase extraction,dansyl derivatization, and liquid chromatography/positive electrospray tandem massspectrometry. Rapid Communications in Mass Spectrometry. 18:2739-2742.