32
Envisioning Europe’s Economic Future from a Long-Run Historical Perspective Thomas Piketty Paris School of Economics Council for European Studies, Paris, July 9 2015
| Date post: | 02-Jan-2016 |
| Category: |
Documents |
| Upload: | clare-nichols |
| View: | 215 times |
| Download: | 0 times |

Envisioning Europe’s Economic Future from a Long-Run Historical Perspective
Thomas PikettyParis School of Economics
Council for European Studies, Paris, July 9 2015

This presentation: three points
• 1. Inequality in the long-run: over the course of the 20th century, Europe has become more egalitarian than the US institutions and policies matter
• 2. But the European social state is fragile: lack of fiscal union, tax competition, public debt crisis, unemployment, rise of nationalism
• 3. EU institutions need to be fundamentally transformed in order to address this: Euro-chamber
(see « Manifesto for a Euro political union »)
1. Inequality in the long run• Here I will present some results based upon Capital in the 21st
century (Harvard University Press, March 2014)
• This book studies the global dynamics of income and wealth distribution since 18c in 20+ countries; I use historical data collected over the past 15 years with Atkinson, Saez, Postel-Vinay, Rosenthal, Alvaredo, Zucman, and 30+ others; I try to shift attention from rising income inequality to rising wealth inequality
• All data series are available in a technical appendix available on line: see http://piketty.pse.ens.fr/capital21c
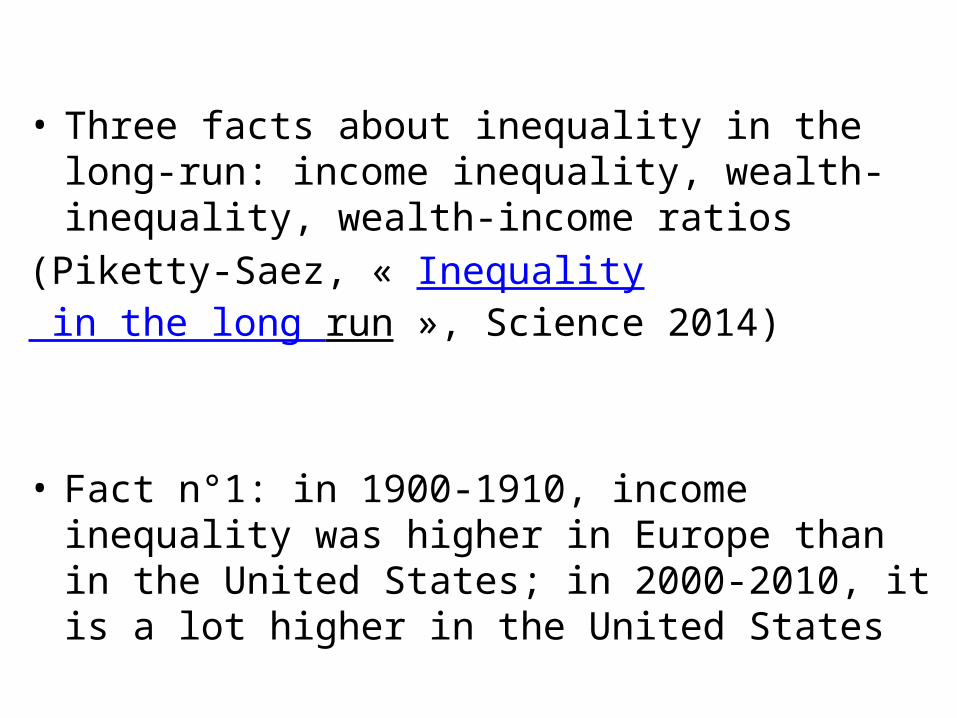
• Three facts about inequality in the long-run: income inequality, wealth-inequality, wealth-income ratios
(Piketty-Saez, « Inequality in the long run », Science 2014)
• Fact n°1: in 1900-1910, income inequality was higher in Europe than in the United States; in 2000-2010, it is a lot higher in the United States

25%
30%
35%
40%
45%
50%
1900 1910 1920 1930 1940 1950 1960 1970 1980 1990 2000 2010
Shar
e of
top
inco
me
deci
le in
tota
l pre
tax
inco
me
(dec
enni
al a
vera
ges)
The share of total income accruing to top decile income holders was higher in Europe than in the U.S. around 1900-1910; it is a lot higher in the U.S. than in Europe around 2000-2010.
Sources and series: see piketty.pse.ens.fr/capital21c (fig.9,8)
Figure 1. Income inequality: Europe and the U.S., 1900-2010
Top 10% income share: Europe
Top 10% income share: U.S.

25%
30%
35%
40%
45%
50%
1910 1920 1930 1940 1950 1960 1970 1980 1990 2000 2010
Sha
re o
f top
dec
ile in
nat
iona
l inc
ome
The top decile share in U.S. national income dropped from 45-50% in the 1910s-1920s to less than 35% in the 1950s (this is the fall documented by Kuznets); it then rose from less than 35% in the 1970s to 45-50% in the 2000s-2010s.
Sources and series: see
Figure I.1. Income inequality in the United States, 1910-2012
Share of top decile in total income (including capital gains)
Excluding capital gains

25%
30%
35%
40%
45%
50%
1900 1910 1920 1930 1940 1950 1960 1970 1980 1990 2000 2010
Shar
e of
top
inco
me
deci
le in
tota
l pre
tax
inco
me
(dec
enni
al a
vera
ges)
The share of total income accruing to top decile income holders was higher in Europe than in the U.S. around 1900-1910; it is a lot higher in the U.S. than in Europe around 2000-2010.
Sources and series: see piketty.pse.ens.fr/capital21c (fig.9,8)
Figure 1. Income inequality: Europe and the U.S., 1900-2010
Top 10% income share: Europe
Top 10% income share: U.S.
19001901190219031904190519061907190819091910191119121913191419151916191719181919192019211922192319241925192619271928192919301931193219331934193519361937193819391940194119421943194419451946194719481949195019511952195319541955195619571958195919601961196219631964196519661967196819691970197119721973197419751976197719781979198019811982198319841985198619871988198919901991199219931994199519961997199819992000200120022003200420052006200720082009201025%
30%
35%
40%
45%
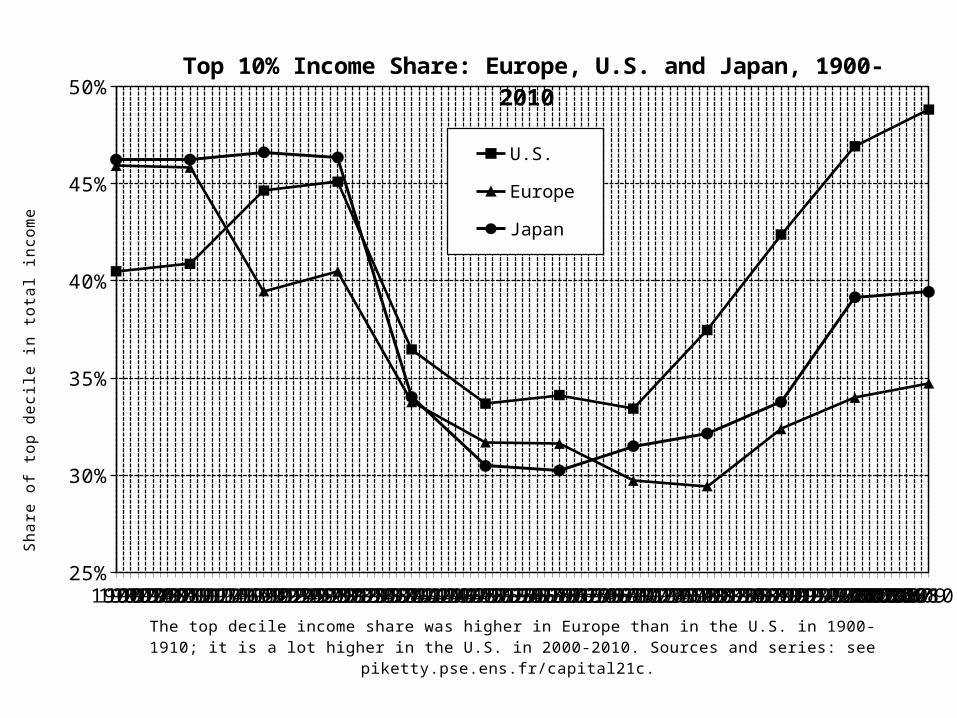
50%Top 10% Income Share: Europe, U.S. and Japan, 1900-2010
U.S.
Europe
Japan
The top decile income share was higher in Europe than in the U.S. in 1900-1910; it is a lot higher in the U.S. in 2000-2010. Sources and series: see piketty.pse.ens.fr/capital21c.
Sh
are
of t
op
de
cile
in to
tal i
nco
me

• The higher rise in US inequality in recent decades is mostly due to rising inequality of labor income
• It is due to a mixture of reasons: changing supply and demand for skills; race between education and technology; globalization; more unequal to access to skills in the US (rising tuitions, insufficient public investment); unprecedented rise of top managerial compensation in the US (changing incentives, cuts in top income tax rates); falling minimum wage in the US
institutions and policies matter ; Europe’s social model allows to spread the benefits from globalization more evenly


• Fact n°2: wealth inequality is always a lot higher than income inequality; it is now higher in the US than in Europe (same reasons as before)
• Fact n°3: wealth inequality is much less extreme today than a century ago in Europe, although the total capitalization of private wealth relative to national income has now recovered from the 1914-1945 shocks
• There’s nothing bad with high wealth-income ratio (as long as there’s a strong middle class share in total wealth), but this creates new policy challenges, particularly for Europe

50%
60%
70%
80%
90%
100%
1870 1890 1910 1930 1950 1970 1990 2010
Shar
e of
top
wea
lth d
ecile
in to
tal n
et w
ealth
(dec
enni
al a
vera
ges)
The share of total net wealth belonging to top decile wealth holders has become higher in the US than in Europe over the course of the 20th century. But it is still smaller than what it was in Europe before World War 1.
Sources and series: see piketty.pse.ens.fr/capital21c (fig.10,6)
Figure 2. Wealth inequality: Europe and the U.S., 1870-2010
Top 10% wealth share: Europe
Top 10% wealth share: U.S.
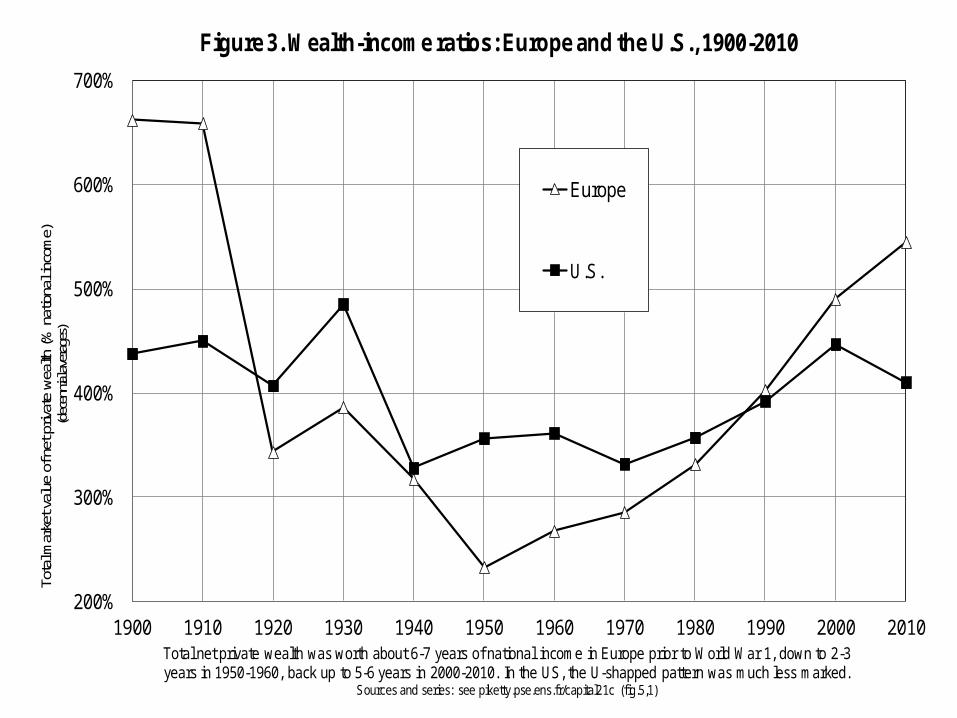
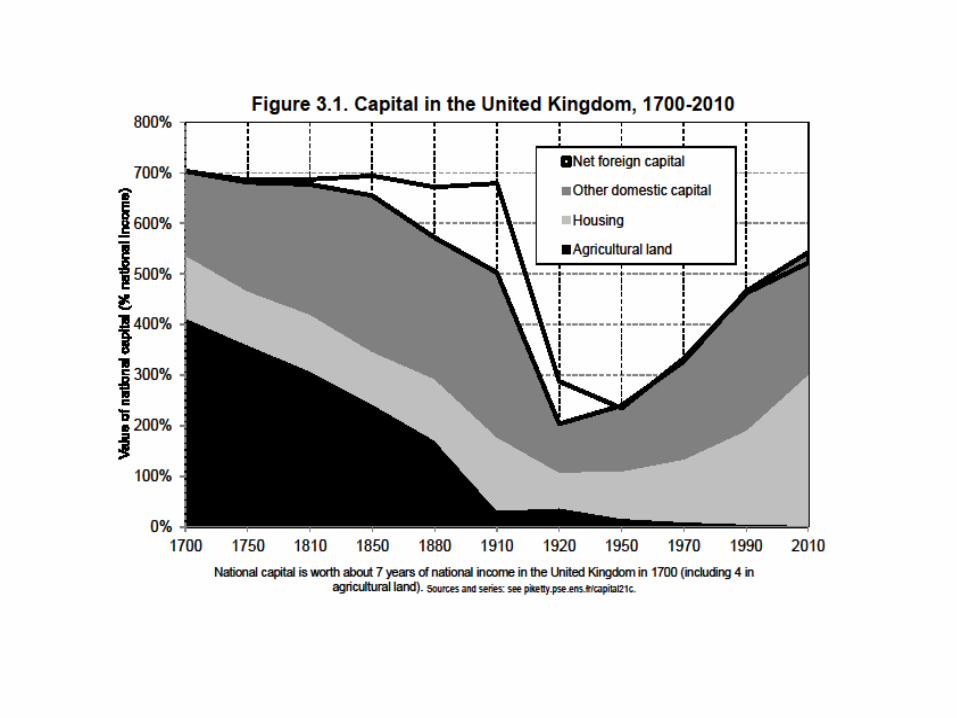
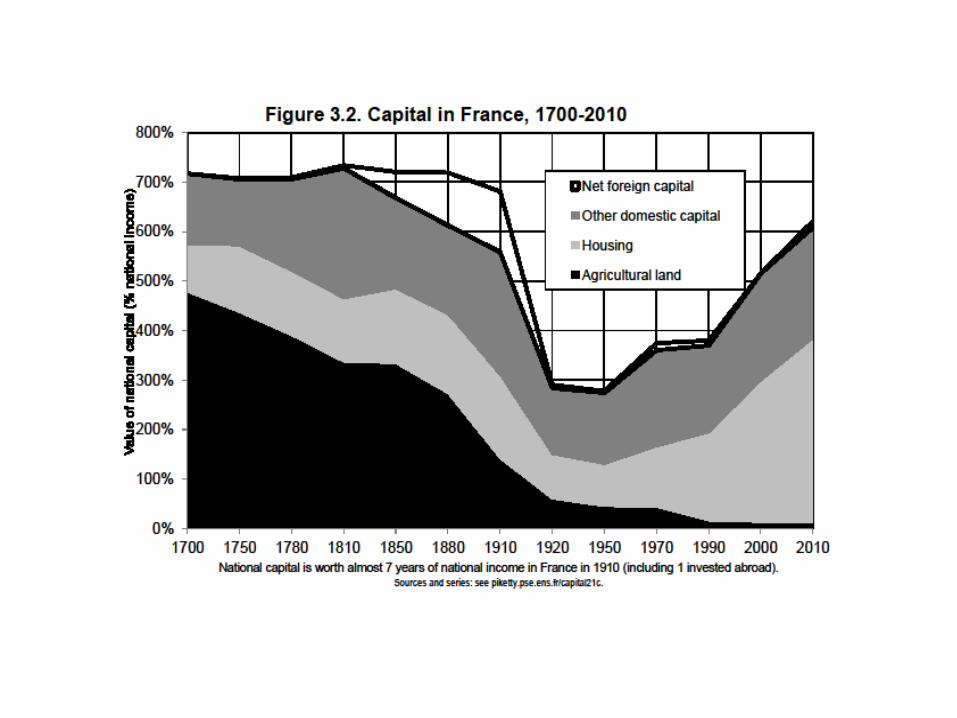
200%
300%
400%
500%
600%
700%
1900 1910 1920 1930 1940 1950 1960 1970 1980 1990 2000 2010
Tota
l mar
ket v
alue
of n
et p
rivat
e w
ealth
(% n
atio
nal i
ncom
e)(d
ecen
nial a
vera
ges)
Total net private wealth was worth about 6-7 years of national income in Europe prior to World War 1, down to 2-3 years in 1950-1960, back up to 5-6 years in 2000-2010. In the US, the U-shapped pattern was much less marked.
Sources and series: see piketty.pse.ens.fr/capital21c (fig.5,1)
Figure 3. Wealth-income ratios: Europe and the U.S., 1900-2010
Europe
U.S.
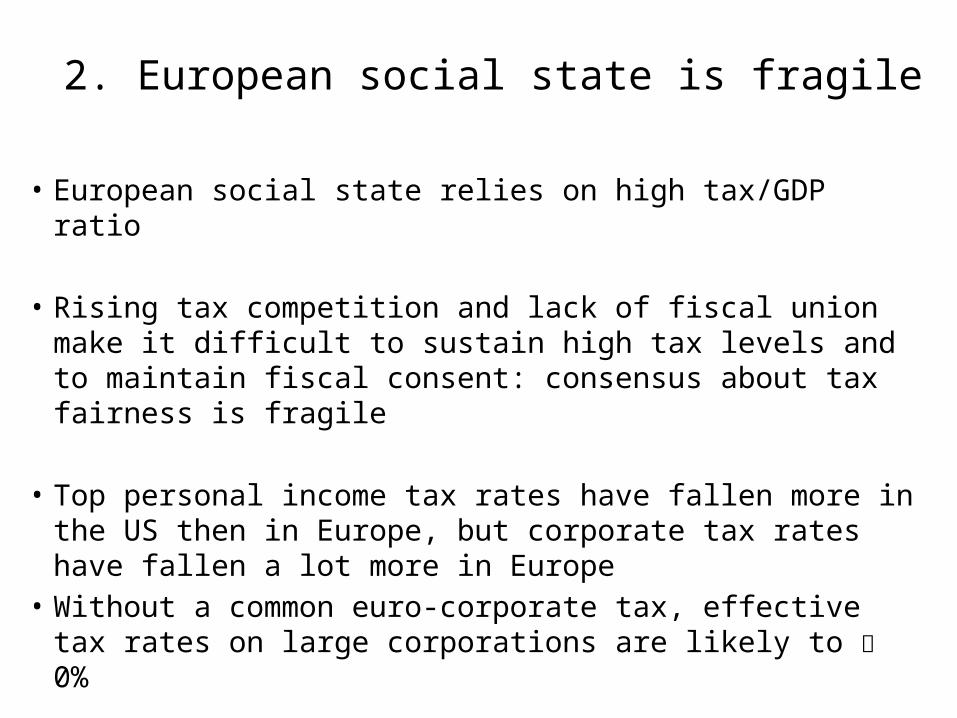
2. European social state is fragile
• European social state relies on high tax/GDP ratio
• Rising tax competition and lack of fiscal union make it difficult to sustain high tax levels and to maintain fiscal consent: consensus about tax fairness is fragile
• Top personal income tax rates have fallen more in the US then in Europe, but corporate tax rates have fallen a lot more in Europe
• Without a common euro-corporate tax, effective tax rates on large corporations are likely to 0%


Corporate tax competition in the EU
20%
22%
24%
26%
28%
30%
32%
34%
36%
38%
1995 1997 1999 2001 2003 2005 2007 2009 2011Source: Taxation trends in the EU, Eurostat 2011
Average statutory corporatetax rate (EU 27)
Average effective corporatetax rate (EU 27)
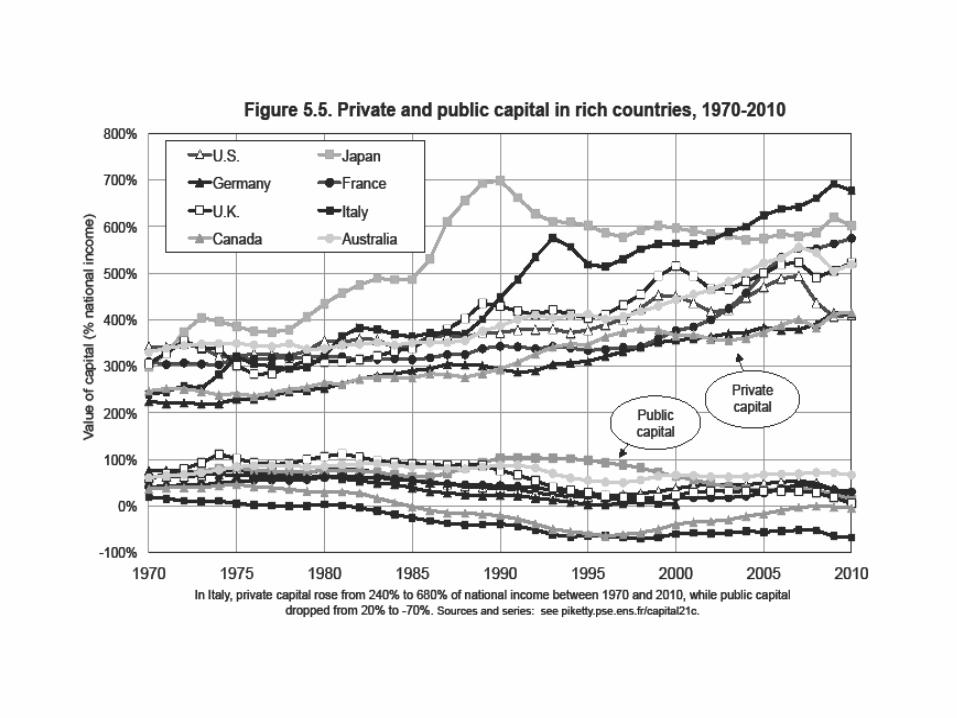
• Rise of European private wealth-income ratios is not bad in itself (postwar reconstruction, growth slowdown), … except that financial and real-estate bubbles need to be properly regulated
new policy challenges (prudential regulation, access to property for young generations, return of inheritance) multidimensional approach to the history and metamorphosis of capital and property relations

200%
300%
400%
500%
600%
700%
1900 1910 1920 1930 1940 1950 1960 1970 1980 1990 2000 2010
Tota
l mar
ket v
alue
of n
et p
rivat
e w
ealth
(% n
atio
nal i
ncom
e)(d
ecen
nial a
vera
ges)
Total net private wealth was worth about 6-7 years of national income in Europe prior to World War 1, down to 2-3 years in 1950-1960, back up to 5-6 years in 2000-2010. In the US, the U-shapped pattern was much less marked.
Sources and series: see piketty.pse.ens.fr/capital21c (fig.5,1)
Figure 3. Wealth-income ratios: Europe and the U.S., 1900-2010
Europe
U.S.


1970 1975 1980 1985 1990 1995 2000 2005 2010100%
200%
300%
400%
500%
600%
700%
800%
Figure S5.2. Private capital in rich countries: from the Japanese to the Spanish bubble
U.S.A Japan Germany
France U.K. Italy
Canada Australia Spain
Private capital almost reached 8 years of national income in Spain at the end of the 2000s (ie. one more year than Japan in 1990). Sources and series: see piketty.pse.ens.fr/capital21c.
Va
lue
of
pri
vate
ca
pita
l (%
of
na
tion
al i
nco
me
)
• Rise of European private wealth-income ratios is not bad in itself… except that it is partly due to transfers from public to private wealth: privatization of public assets at low prices, rise of public debt to historically high levels
public debt crisis, lack of confidence in Euro-zone institutions, recession, unemployment
(GDP 2015 < GDP 2007 : Europe’s lost decade) structural pb: a single currency with 18 diff. public debt, 18 diff. interest rates, 18 diff. tax systems = a very bad and unstable system
3. What can the EU do about this?• See « Manifesto for a Euro political union »• Common corporate tax, fight against tax havens, etc.: EU is perceived
by lower social groups as being pro-capital; this needs to be reversed• Common fund for all euro-zone public debts >60% GDP: separate
country accounts, but common interest rate• Public-private investment plan in universities, innovation, green
technologies • Erasmus: 2 bil.€/y; pub. debt interest payments: 200bil.€/y. Is this
the right way to prepare 21c? This looks more like 19c British strategy to reduce large public debt than post-WW2 pro-growth strategy, when public debt over 200% GDP in Germany and France was reduced to zero very fast (inflation, debt restructuring) in order to invest in growth
• Does Europe suffer from historical amnesia?

• In order to adopt these policies, one needs to fundamentally transform the existing EU institutional architecture: with unanimity rule for fiscal issues, it is impossible to do anything; the system of automatic rules and sanctions for choice of deficit level is not working
• In order to adopt these policies (corporate tax base and rate, deficit level, euro-zone budget, etc.) under majority rule, one needs a euro-zone parliament
• Best option: Euro-chamber based upon members of national parliaments (in proportion to each country’s population: say, 40 national MPs from Germany, 30 national MPs from France, etc.)

• Is the Euro-chamber the same as pre-1979 European Parliament?• No : Euro-chamber would have substantial legistative powers (pre-
1979 EP was a deliberative assembly)
• Europe has yet to invent its own original form of bicameralism: even if one day all countries adopt € (this will take time…), it makes sense to have 2 separate chambers: (1) a European Parliament elected directly by the citizens of all member countries
(2) a Euro Chamber representing the member countries through their national parliaments
→ Euro-chamber replaces Council, not the EP
• This is a way to force national MPs to become European law makers and to stop complaining about Europe

• Should the EP feel threatened by the Euro-chamber?• No : Euro-chamber is the way to bring more political union
• National parliaments - e.g. Bundestag - already have a say (and will always have) about all decisions involving national taxpayers
• The Euro-chamber is the way to force national parliaments to take decisions together under majority rule, so that in effect individual national parliaments can be put in a minority
• This is a much better solution than to give veto power to each national parliament = the current situation (= what the UK would like to reinforce)
• Council of finance ministers will never work like a parliamentary chamber: you cannot represent a 80million or 60million country with 1 individual → opacity, lack of public deliberation
→ the objective is to replace Eurogroup by Euro-chamber

• Is the Euro-Chamber realistic?• Yes. We need new solutions now.
• Main pb: French government fears political union, does not make any proposal, and prefers to complain about Germany…
• Other main pb: Germany might seriously fear to be put in a minority regarding choice of deficit level. But if France, Italy, Spain were putting the Euro-chamber proposal on the table, and accept to follow majority rule, then ultimately a compromise would be worked out with Germany.
• All national governments have spent a lot of energy trying to pretend that the new 2012 treaty (fiscal compact) was working, while it’s not; in order to change their discourse, maybe we need a big shock. Greek electoral shock not enough? Do we need to wait until Spanish elections in late 2015? Or French regional elections with FN victory? Or new financial panic? Or new Greek vote ? Or everything together?


