Page 1
Earth Observation for Sustainable Development
Urban Development Project
This project has received funding from the European Union’s Horizon 2020 research and innovation programme under grant agreement No 685761.
ESA Ref: AO/1-8346/15/I-NB
Doc. No.: City Operations Report
Issue/Rev.: 1.0
Date: 16.11.2018
EO4SD-Urban Project: Mumbai City Report
Lead: Partners: Financed by:
Page 2
Earth Observation for Sustainable Doc. No.: City-Operations Report
Development – Urban Project Issue/Rev-No.: 1.0
EO4SD-Urban Mumbai City Operations Report Page I
Consortium Partners
No. Name Short Name Country
1 GAF AG GAF Germany
2 Système d'Information à Référence Spatiale SAS SIRS France
3 GISAT S.R.O. GISAT Czech Republic
4 Egis SA EGIS France
5 Deutsche Luft- und Raumfahrt e. V DLR Germany
6 Netherlands Geomatics & Earth Observation B.V. NEO The Netherlands
7 JOANNEUM Research Forschungsgesellschaft mbH JR Austria
8 GISBOX SRL GISBOX Romania
Disclaimer:
The contents of this document are the copyright of GAF AG and Partners. It is released by GAF AG on
the condition that it will not be copied in whole, in section or otherwise reproduced (whether by
photographic, reprographic or any other method) and that the contents thereof shall not be divulged to
any other person other than of the addressed (save to the other authorised officers of their organisation
having a need to know such contents, for the purpose of which disclosure is made by GAF AG) without
prior consent of GAF AG.
Page 3
Earth Observation for Sustainable Doc. No.: City-Operations Report
Development – Urban Project Issue/Rev-No.: 1.0
EO4SD-Urban Mumbai City Operations Report Page II
Summary
This document contains information related to the provision of geo-spatial products over Mumbai city,
India, from the European Space Agency (ESA) supported project “Earth Observation for Sustainable
Development” Urban Applications (EO4SD-Urban) to the World Bank funded “Metro Mumbai Urban
Phase 2” Program.
Affiliation/Function Name Date
Prepared SIRS S. Delbour, D. Fretin 15/11/2018
Reviewed SIRS C. Sannier 16/11/2018
Approved GAF AG, Project Coordinator T. Haeusler 16/11/2018
The document is accepted under the assumption that all verification activities were carried out correctly
and any discrepancies are documented properly.
Distribution
Affiliation Name Copies
ESA Z. Bartalis electronic copy
World Bank Chyi-Yun Huang electronic copy
Document Status Sheet
Issue Date Details
1.0 16/11/2018 First Document Issue
Document Change Record
# Date Request Location Details
1 16/11/2018 Initial version
Page 4
Earth Observation for Sustainable Doc. No.: City-Operations Report
Development – Urban Project Issue/Rev-No.: 1.0
EO4SD-Urban Mumbai City Operations Report Page III
This page is intentionally left blank!
Page 5
Earth Observation for Sustainable Doc. No.: City-Operations Report
Development – Urban Project Issue/Rev-No.: 1.0
EO4SD-Urban Mumbai City Operations Report Page IV
Executive Summary
The European Space Agency (ESA) has been working closely together with the International Finance
Institutes (IFIs) and their client countries to demonstrate the benefits of Earth Observation (EO) in the
IFI development programmes. Earth Observation for Sustainable Development (EO4SD) is a new ESA
initiative, which aims to achieve an increase in the uptake of satellite-based information in the regional
and global IFI programmes. The overall aim of the EO4SD Urban project is to integrate the application
of satellite data for urban development programmes being implemented by the IFIs or Multi-Lateral
Development Banks (MDBs) with the developing countries. The overall goal will be achieved via
implementation of the following main objectives:
To provide a service portfolio of Baseline and Derived urban-related geo-spatial products
To provide the geo-spatial products and services on a geographical regional basis
To ensure that the products and services are user-driven
This Report describes the generation and the provision of EO-based information products to the World
Bank (WB) for supporting it in the implementation of “Metro Mumbai Urban Phase 2” funded
program and the Mumbai Metropolitan Region Development Authority (MMRDA) as main stakeholder.
The Report provides a Service Description by referring to the user driven service requirements and the
associated product list with the detailed product specifications. The following products were requested:
Urban Extent
Percentage Impervious Surface
Urban Land Use / Land Cover (LU/LC) & Changes
Building Footprints & Changes
The current Version of this Report contains the description of the generation and delivery of the Land
Use/Land Cover (LU/LC) and the LU/LC Changes between two-time periods of 2005 and 2015. The
Derived product of Building Footprints around Panvel Station are also included in this Report.
This City Operations Report for Mumbai systematically reviews the main production steps involved and
importantly highlights the Quality Control (QC) mechanisms involved; the steps of QC and the
assessment of quality is provided in related QC forms in the Annexe of this Report. There is also the
provision of standard analytical work undertaken with the products which can be further included as
inputs into further urban development assessments, modelling and reports.
Page 6
Earth Observation for Sustainable Doc. No.: City-Operations Report
Development – Urban Project Issue/Rev-No.: 1.0
EO4SD-Urban Mumbai City Operations Report Page V
This page is intentionally left blank!
Page 7
Earth Observation for Sustainable Doc. No.: City-Operations Report
Development – Urban Project Issue/Rev-No.: 1.0
EO4SD-Urban Mumbai City Operations Report Page VI
Table of Contents
1 GENERAL BACKGROUND OF EO4SD-URBAN ................................................................... 1 2 SERVICE DESCRIPTION........................................................................................................... 1
2.1 STAKEHOLDERS AND REQUIREMENTS ..................................................................................... 1
2.2 SERVICE AREA SPECIFICATION ............................................................................................... 2
2.3 PRODUCT LIST AND PRODUCT SPECIFICATIONS ...................................................................... 3
2.4 LAND USE/LAND COVER NOMENCLATURE ............................................................................. 3
2.5 PERCENTAGE IMPERVIOUS SURFACE ...................................................................................... 6
2.6 BUILDING FOOTPRINTS ............................................................................................................ 6
2.7 TERMS OF ACCESS ................................................................................................................... 7
3 SERVICE OPERATIONS ............................................................................................................ 8
3.1 SOURCE DATA ......................................................................................................................... 8
3.2 PROCESSING METHODS ........................................................................................................... 8
3.3 ACCURACY ASSESSMENT OF MAP PRODUCTS ........................................................................ 9
3.3.1 The Accuracy Assessment of the LU/LC Product ............................................................................. 9
3.3.2 The Accuracy Assessment of the Percentage Impervious Surface Product .................................... 12
3.3.3 The Accuracy Assessment of Building Footprints Product ............................................................. 14
3.4 QUALITY CONTROL/ASSURANCE .......................................................................................... 16
3.5 METADATA ............................................................................................................................ 17
4 ANALYSIS OF MAPPING RESULTS ..................................................................................... 18
4.1 LAND USE LAND COVER 2005 AND 2015 .............................................................................. 19
4.1.1 Spatial Distribution of Main LU/LC Change Categories ................................................................ 22
4.1.2 Changes of Agricultural Areas ........................................................................................................ 24
4.1.3 Changes of Natural and Semi Natural Areas ................................................................................... 26
4.2 BUILDING FOOTPRINTS AROUND PANVEL RAILWAY STATION ............................................. 28
4.3 CONCLUDING POINTS ............................................................................................................ 29
5 REFERENCES ............................................................................................................................ 30
Annexes
Annex 1: Processing Methods for EO4SD-Urban Products
Annex 2: Filled Quality Control Sheets
Page 8
Earth Observation for Sustainable Doc. No.: City-Operations Report
Development – Urban Project Issue/Rev-No.: 1.0
EO4SD-Urban Mumbai City Operations Report Page VII
List of Figures
Figure 1: Illustration of the Area of Mapping for Mumbai alongside the “Panvel – Virar” Railway ..... 2 Figure 2: Mapping result of the AoI defined for Mumbai of the year 2015 overlaid with randomly
distributed sample points used for accuracy assessment. ....................................................... 11 Figure 3: Subset of building footprints randomly distributed per stratum used for accuracy assessment.
............................................................................................................................................... 15 Figure 4: Quality Control process for EO4SD-Urban product generation. At each intermediate
processing step output properties are compared against pre-defined requirements. .............. 16 Figure 5: Detailed Land Use Land Cover 2015 alongside the railroad in Mumbai. ............................. 19 Figure 6: Detailed Land Use Land Cover 2015 around Panvel Railway Station in Mumbai. .............. 20 Figure 7: Detailed Land Use Land Cover 2005 structure: Presented as Overall in % (left) and km2 (right).
............................................................................................................................................... 21 Figure 8: Detailed Land Use Land Cover 2015 structure: Presented as Overall in % (left) and km2 (right).
............................................................................................................................................... 21 Figure 9: Land Use Land Cover change types – spatial distribution. .................................................... 23 Figure 10: Land Use Land Cover Change Types 2005-2015 for Mumbai AoI; in % (left) and km² (right)
............................................................................................................................................... 24 Figure 11: Spatial distribution of changes from Agricultural Areas to other Classes between 2005 and
2015. ...................................................................................................................................... 25 Figure 12: Changes of Agricultural Areas into other LU classes between 2005 and 2015; in % (left) and
km2 (right). ............................................................................................................................ 25 Figure 13: Spatial distribution of changes from Natural Areas to other Classes between 2005 and 2015.
............................................................................................................................................... 26 Figure 14: Changes of Natural Areas into other LU classes between 2005 and 2015; in % (left) and km2
(right). .................................................................................................................................... 27 Figure 15: Detailed Building Footprints around Panvel Railway Station in 2015. ............................... 28 Figure 16: Building Footprints changes around Panvel Railway Station between 2005 and 2015. ...... 29
List of Tables
Table 1: LU/LC Nomenclature for 2005 and 2015. ............................................................................... 4 Table 2: Building Footprints - Nomenclature ......................................................................................... 6 Table 3: Number of sampling points for the EO4SD-Urban mapping classes after applied sampling
design with information on overall land cover by class. ........................................................ 10 Table 4: Acquisition dates and size of the WV2 images available for the 5 test sites analysed in the
validation exercise along with the number of corresponding 30x30m validation samples.... 13 Table 5: Number of sampling units per stratum for the Building Footprints product. .......................... 14 Table 6: Detailed information on area and percentage of total area for each class for 2005 and 2015 as
well as the changes. ................................................................................................................ 22 Table 7: Overall LU/LC Main Changes Statistics. ................................................................................ 24 Table 8 : Statistics of changes of Agricultural areas. ............................................................................ 26 Table 9: Statistics of changes of Natural areas. ................................................................................... 27
Page 9
Earth Observation for Sustainable Doc. No.: City-Operations Report
Development – Urban Project Issue/Rev-No.: 1.0
EO4SD-Urban Mumbai City Operations Report Page VIII
List of Abbreviations
CDS City Development Strategy
CS Client States
DEM Digital Elevation Model
DLR German Space Agency
EEA European Environmental Agency
EGIS Consulting Company for Environmental Impact Assessment and Urban Planning, France
EO Earth Observation
ESA European Space Agency
EU European Union
GAF GAF AG, Geospatial Service Provider, Germany
GIS Geographic Information System
GISAT Geospatial Service Provider, Czech Republic
GISBOX Romanian company with activities of Photogrammetry and GIS
GUF Global Urban Footprint
HR High Resolution
HRL High Resolution Layer
IFI International Financing Institute
INSPIRE Infrastructure for Spatial Information in the European Community
ISO/TC 211 Standardization of Digital Geographic Information
JR JOANNEUM Research, Austria
LC / LU Land Cover / Land Use
LULCC Land Use and Land Cover Change
MMU Minimum Mapping Unit
NDVI Normalized Difference Vegetation Index
NEO Geospatial Service Provider, The Netherlands
QA Quality Assurance
QC Quality Control
QM Quality Management
SP Service Provider
VHR Very High Resolution
WB World Bank
WBG World Bank Group
Page 10
Earth Observation for Sustainable Doc. No.: City-Operations Report
Development – Urban Project Issue/Rev-No.: 1.0
EO4SD-Urban Mumbai City Operations Report Page IX
This page is intentionally left blank!
Page 11
Earth Observation for Sustainable Doc. No.: City-Operations Report
Development – Urban Project Issue/Rev-No.: 1.0
EO4SD-Urban Mumbai City Operations Report Page 1
1 General Background of EO4SD-Urban
Since 2008 the European Space Agency (ESA) has worked closely together with the International
Finance Institutes (IFIs) and their client countries to harness the benefits of Earth Observation (EO) in
their operations and resources management. Earth Observation for Sustainable Development (EO4SD)
is a new ESA initiative, which aims to achieve an increase in the uptake of satellite-based information
in the regional and global IFI programmes. The EO4SD-Urban project initiated in May 2016 (with a
duration of 3 years) has the overall aim to integrate the application of satellite data for urban
development programmes being implemented by the IFIs with the developing countries. The overall
goal will be achieved via implementation of the following main objectives:
To provide the services on a regional basis (i.e. large geographical areas); in the context of the
current proposal with a focus on S. Asia, SE Asia and Africa, for at least 35-40 cities.
To ensure that the products and services are user-driven; i.e. priority products and services to
be agreed on with the MDBs in relation to their regional programs and furthermore to implement
the project with a strong stakeholder engagement especially in context with the validation of the
products/services on their utility.
To provide a service portfolio of Baseline and Derived urban-related geo-spatial products that
have clear technical specifications and are produced on an operational manner that are
stringently quality controlled and validated by the user community.
To provide a technology transfer component in the project via capacity building exercises in the
different regions in close co-operation with the MDB programmes.
This Report supports the fulfilment of the third objective which requires the provision of geo-spatial
Baseline and Derived geo-spatial products to various stakeholders in the IFIs and counterpart City
authorities. The Report provides a Service Description, and then in Chapter 3 systematically reviews the
main production steps involved and importantly highlights whenever there are Quality control (QC)
mechanisms involved with the related QC forms in the Annexe of this Report. The description of the
processes is kept intentionally at a top leave and avoiding technical details as the Report is considered
mainly for non-technical IFI staff and experts and City authorities. Finally, Chapter 4 presents the
standard analytical work undertaken with the products which can be inputs into further urban
development assessments, modelling and reports.
2 Service Description
The following Section summarises the service as it has been performed for the city of Mumbai, India
within the EO4SD-Urban Project and as it has been delivered to Gerald Ollivier, Task Team Leader
(TTL) of the World Bank “Metro Mumbai Urban Phase 2” Program in July 2018.
2.1 Stakeholders and Requirements
The EO4SD-Urban products described in this Report has been provided for Mumbai upon request of the
World Bank (WB) for supporting its funding project called “Metro Mumbai Urban Phase 2” Program.
This is linked to the GEF funded project focused on Transit Oriented Development (TOD).
The main stakeholder is therefore the Transport Unit of the Mumbai Metropolitan Region Development
Authority (MMRDA).
In line with the Millennium Development Goals followed by India, Prime Minister Modi launched three
major urban development initiatives in June 2015 that are handled by the Ministry of Urban
Development (MoUD), in addition to several other programs such as National Urban Information
System (NUIS) or the Swachh Bharat Mission initiated in October 2014. In such a context, the concept
of Transit Oriented Development is interesting as its aim is to prevent a disorganised growth of the city
but rather channel it along transportation corridors. New urban areas with mixed land use would develop
within walking distance around metro stations.
Page 12
Earth Observation for Sustainable Doc. No.: City-Operations Report
Development – Urban Project Issue/Rev-No.: 1.0
EO4SD-Urban Mumbai City Operations Report Page 2
The aim of the WB funded project is to provide a holistic approach to the preparation of the new metro
lines to be developed in the city. In the past, this type of projects did not have a global view on the
metropolitan area in order to define the best routes of the new lines and as a result, they did not
correspond to local needs in terms of commuting. Therefore, the WB decided to invest funds to bring a
different approach to have transport planners and urban planners to work together in defining the new
routes. For achieving this goal, Earth Observation derived products could provide a general view of the
metropolitan area and see its evolution over time. Geospatial data would be helpful for both City Master
Plan as well as Transport Plan. The MMRDA has an important GIS department. Even if GIS data
production as well as urban planning activities are often outsourced to private companies, the staff
members perform GIS analysis.
The long-term objective of the World Bank is to make use of this project and EOSD-Urban products as
a pilot and if it turns successful, the experience could be replicated in other cities considering Mumbai
as an example to be followed. Besides, geospatial products can be useful for the WB regarding internal
analytics improving the level of urban information to counterparts and the Bank itself, knowledge of
utilities, better and cheaper techniques, homogeneous data and rather difficult to obtain, and quick
assessment of the land use evolution over time.
2.2 Service Area Specification
The Area of Interest (AoI) for the service implementation which has finally been agreed with the
stakeholders is an area alongside an existing railroad between Virar and Panvel.
Figure 1: Illustration of the Area of Mapping for Mumbai alongside the “Panvel – Virar” Railway
The mapping area has a total surface of 150 km2.
Page 13
Earth Observation for Sustainable Doc. No.: City-Operations Report
Development – Urban Project Issue/Rev-No.: 1.0
EO4SD-Urban Mumbai City Operations Report Page 3
2.3 Product List and Product Specifications
Given the requirements and discussions with the stakeholders, the final list of products is as follows:
Urban Extent
Percentage Impervious Surface
Urban Land Use / Land Cover (LU/LC) & Changes
Building Footprints & Changes
The first two products have been provided by the German Aerospace Agency (DLR) over the full
metropolitan area for the reference year 2015. The others have been generated by SIRS for two different
time slots 2005 and 2015 to offer the possibility to compare and assess the evolution based on historic
and recent information. The current Report will focus on the provision of the Baseline LU/LC product
over the AoI and the Building Footprints product around Panvel Station.
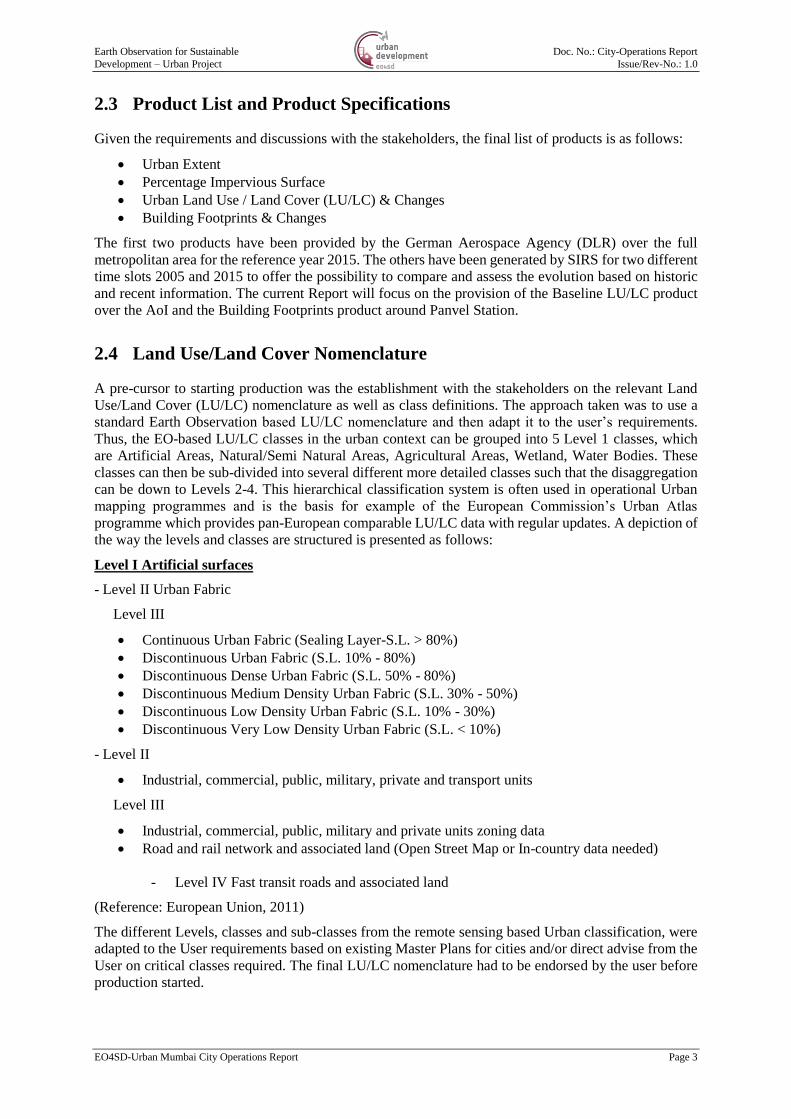
2.4 Land Use/Land Cover Nomenclature
A pre-cursor to starting production was the establishment with the stakeholders on the relevant Land
Use/Land Cover (LU/LC) nomenclature as well as class definitions. The approach taken was to use a
standard Earth Observation based LU/LC nomenclature and then adapt it to the user’s requirements.
Thus, the EO-based LU/LC classes in the urban context can be grouped into 5 Level 1 classes, which
are Artificial Areas, Natural/Semi Natural Areas, Agricultural Areas, Wetland, Water Bodies. These
classes can then be sub-divided into several different more detailed classes such that the disaggregation
can be down to Levels 2-4. This hierarchical classification system is often used in operational Urban
mapping programmes and is the basis for example of the European Commission’s Urban Atlas
programme which provides pan-European comparable LU/LC data with regular updates. A depiction of
the way the levels and classes are structured is presented as follows:
Level I Artificial surfaces
- Level II Urban Fabric
Level III
Continuous Urban Fabric (Sealing Layer-S.L. > 80%)
Discontinuous Urban Fabric (S.L. 10% - 80%)
Discontinuous Dense Urban Fabric (S.L. 50% - 80%)
Discontinuous Medium Density Urban Fabric (S.L. 30% - 50%)
Discontinuous Low Density Urban Fabric (S.L. 10% - 30%)
Discontinuous Very Low Density Urban Fabric (S.L. < 10%)
- Level II
Industrial, commercial, public, military, private and transport units
Level III
Industrial, commercial, public, military and private units zoning data
Road and rail network and associated land (Open Street Map or In-country data needed)
- Level IV Fast transit roads and associated land
(Reference: European Union, 2011)
The different Levels, classes and sub-classes from the remote sensing based Urban classification, were
adapted to the User requirements based on existing Master Plans for cities and/or direct advise from the
User on critical classes required. The final LU/LC nomenclature had to be endorsed by the user before
production started.
Page 14
Earth Observation for Sustainable Doc. No.: City-Operations Report
Development – Urban Project Issue/Rev-No.: 1.0
EO4SD-Urban Mumbai City Operations Report Page 4
Table 1: LU/LC Nomenclature for 2005 and 2015.
2005 & 2015
Level I Level II Level III Level IV
1000 Artificial Surfaces
1100 Residential 1110 Very Low Density
1120 Low Density
1130 Medium Density
1140 High Density
1150 Very High Density
1200 Industrial, Commercial,
Public, Military, Private and Transport Units
1210 Industrial, Commercial,
Public, Military and Private Units
1211 Commercial
1212 Industry
1213 University
1214 Schools
1215 Government
1216 Military
1217 Hospitals
1218 Public Buildings
1219 Non-Residential Urban Fabric
1220 Roads 1221 Arterial
1222 Collector
1230 Railway
1240 Airport
1250 Port
1300 Mine, Dump and Construction Sites
1310 Mineral Extraction and Dump Sites
1320 Construction Sites
1330 Land without Current Use
1400 Urban Open Spaces 1410 Urban Parks
1420 Recreation Facilities
(Sport Facilities, Stadiums, Golf
Courses, etc.)
1430 Cemeteries
2000 Agricultural Area
3000 Natural and
Semi-Natural Areas
3100 Forest and Shrub Lands
3200 Natural Areas (Savannah,
Grassland)
Page 15
Earth Observation for Sustainable Doc. No.: City-Operations Report
Development – Urban Project Issue/Rev-No.: 1.0
EO4SD-Urban Mumbai City Operations Report Page 5
3300 Bare Soil
4000 Wetlands
5000 Water
It is important to note that the possibility to classify at Level IV was highly dependent on the availability
of reliable reference datasets from the City or sources such as Google Earth. This aspect is further
discussed in Chapter 3.
Especially regarding the road hierarchy used in the classification at Level IV, the international road
classification standards have been followed; this is for example defined by the European Commission
(https://ec.europa.eu/transport/road_safety/specialist/knowledge/-
road/designing_for_road_function/road_classification_en).
Roads are divided into three groups: arterial or through traffic flow routes (in our case Arterial Roads),
distributor roads (in our case Collector Roads), and access roads (or Local Roads). The three road
types are defined as follows:
Arterial Roads:
Roads with a flow function allow efficient throughput of (long distance) motorized traffic. All
motorways and express roads as well as some urban ring roads have a flow function. The number of
access and exit points is limited. (https://ec.europa.eu/transport/road_safety/specialist/knowledge/-
road/designing_for_road_function/road_classification_en)
Collector Roads:
Roads with an area distributor function allow entering and leaving residential areas, recreational areas,
industrial zones, and rural settlements with scattered destinations. Junctions are for traffic exchange
(allowing changes in direction etc.); road sections between junctions should facilitate traffic in flowing.
(https://ec.europa.eu/transport/road_safety/specialist/knowledge/road/designing_for_road_function/roa
d_classification_en)
Local Roads:
Roads with an access function allow actual access to properties alongside a road or street. Both junctions
and the road sections between them are for traffic exchange. (https://ec.europa.eu/transport/-
road_safety/specialist/knowledge/road/designing_for_road_function/road_classification_en).
Arterial roads and collector roads only were considered in the LULC classification. They were integrated
within the LULC mapping by applying a buffer around the road centre lines of 22 m for arterial roads
and 8 m for collector ones.
Page 16
Earth Observation for Sustainable Doc. No.: City-Operations Report
Development – Urban Project Issue/Rev-No.: 1.0
EO4SD-Urban Mumbai City Operations Report Page 6
2.5 Percentage Impervious Surface
Settlement growth is associated not only to the construction of new buildings, but – more in general –
to a consistent increase of all the impervious surfaces (hence also including roads, parking lots, squares,
pavement, etc.), which do not allow water to penetrate, forcing it to run off. To effectively map the
percentage impervious surface (PIS) is then of high importance being it related to the risk of urban
floods, the urban heat island phenomenon as well as the reduction of ecological productivity. Moreover,
monitoring the change in the PIS over time is of great support for understanding, together with
information about the spatiotemporal settlement extent evolution, also more details about the type of
urbanization occurred (e.g., if areas with sparse buildings have been replaced by highly impervious
densely built-up areas or vice-versa).
In the framework of the EO4SD-Urban project, PIS maps are generated where one pixel is associated
with the estimated percentage of the corresponding surface at the ground covered by buildings or paved
surfaces, where we define:
building as any structure having a roof supported by columns or walls and intended for the shelter,
housing, or enclosure of any individual, animal, process, equipment, goods, or materials of any
kind;
paved surface as any level horizontal surface covered with paving material (i.e. asphalt, concrete,
concrete pavers, or bricks but excluding gravel, crushed rock, and similar materials).
The product provides for each pixel the estimated PIS. Specifically, values are integer and range from 0
(no impervious surface in the given pixel) to 100 (completely impervious surface in the given pixel)
with step 5.
2.6 Building Footprints
The product provides information on the spatial distribution, number and size of building footprints.
Building footprint are defined as the contour of houses and other manmade buildings as they are
commonly represented in cadastral systems. The spatial explicit representation of building footprints
and their type is derived by visual interpretation and digitisation of Very High Resolution (VHR) optical
imagery with the possibility to use auxiliary information such as Open Street Map (OSM) and other
sources.
Each digitised footprint can be further attributed with user required information to specify the type of
building. Within the scope of EO4SD-Urban service, the use/function of buildings were especially
derived from the LU/LC product at level IV of the ‘1000 – Artificial Surfaces’ Level I class.
Table 2: Building Footprints - Nomenclature
Building Footprints - Nomenclature
1100 - Residential 1215 - Government 1230 - Transportation (Railway Station)
1211 - Commercial 1216 - Military 1310 - Mineral Extraction and Dump Site
1212 - Industry 1217 - Hospital 1320 - Construction Building
1213 - University 1218 - Public Building 1410 - Building inside Urban Park
1214 - School 1219 - Non-Residential Urban Fabric 1420 - Recreation Facility
Information about the spatial location and type of buildings in urban and peri-urban areas is a valuable
baseline information for many purposes. Topological analyses can be performed to distinguish different
types of building blocks and generate different classes of housing density. Furthermore, with the
integration of 3D information models related to volume and estimated space for living can be designed.
In case of natural disasters like floods, landslides, wind storms, the extent and level of damages can be
immediately assessed and rescue organised.
Page 17
Earth Observation for Sustainable Doc. No.: City-Operations Report
Development – Urban Project Issue/Rev-No.: 1.0
EO4SD-Urban Mumbai City Operations Report Page 7
2.7 Terms of Access
The Dissemination of the digital data and the Report was undertaken via FTP.
Page 18
Earth Observation for Sustainable Doc. No.: City-Operations Report
Development – Urban Project Issue/Rev-No.: 1.0
EO4SD-Urban Mumbai City Operations Report Page 8
3 Service Operations
The following Sections present all steps of the service operations including the necessary input data, the
processing methods, the accuracy assessment and the Quality Control procedures. Methods are
presented in a top-level and standardised manner for all the EO4SD-Urban City Reports.
3.1 Source Data
This Section presents the remote sensing and ancillary datasets that were used. Different types of data
from several data providers have been acquired. A complete list of source data as well as a quality
assessment is provided in Annex 2.
A summary of the main data used is provided in the following Sections.
High Resolution Optical EO Data
The major data sources for the generation of urban extent and imperviousness products were Landsat
and Sentinel-2 data which were accessible and downloadable free of charge.
Very High Resolution Optical EO Data
The VHR data for the LU/LC and Building Footprints products had to be acquired and purchased
through commercial EO Data Providers such as Airbus Defence & Space and European Space Imaging.
It has to be noted that under the current collaboration project the VHR EO data had to be purchased
under mono-license agreements between GAF AG and the EO Data Providers. If EO data would have
to be distributed to other stakeholders, then further licences for multiple users would have to be
purchased.
The following VHR sensor data have been acquired to cover the entire AoI:
Pléiades-1A/B:
o 5 scenes for 2015
Quickbird-2:
o 4 scenes for 2005
Detailed lists of the used EO data as well as their quality is documented in the attached Quality Control
Sheets in Annex 2.
Ancillary Data
Open Street Map (OSM) data: OSM data is freely available and generated by volunteers across the
globe. The so-called crowd sourced data is not always complete but has for the most parts of the world
valuable spatial information. Data was downloaded to complement the Transport Network layer used as
basis for the generation of the LU/LC product and further enhanced. The spatial location of the OSM
based streets was also used as geospatial reference.
Detailed lists of the used ancillary data as well as their quality is documented in the attached Quality
Control Sheets in Annex 2.
3.2 Processing Methods
Data processing starts at an initial stage with quality checks and verification of all incoming data. This
assessment is performed in order to guarantee the correctness of data before geometric or radiometric
pre-processing is continued. These checks follow defined procedures in order to detect anomalies,
artefacts and inconsistencies. Furthermore, all image and statistical data were visualised and interpreted
by operators.
The main techniques and standards used for data analysis, processing and modelling for each product
are described in Annex 1.
Page 19
Earth Observation for Sustainable Doc. No.: City-Operations Report
Development – Urban Project Issue/Rev-No.: 1.0
EO4SD-Urban Mumbai City Operations Report Page 9
3.3 Accuracy Assessment of Map Products
Data and maps derived from remote sensing contain - like any other map - uncertainties which can be
caused by many factors. The components, which might have an influence on the quality of the maps
derived from EO include quality and suitability of satellite data, interoperability of different sensors,
radiometric and geometric processing, cartographic and thematic standards, and image interpretation
procedures, post-processing of the map products and finally the availability and quality of reference
data. However, the accuracy of map products has a major impact on secondary products and its utility
and therefore an accuracy assessment was considered as a critical component of the entire production
and products delivery process. The main goal of the thematic accuracy assessment was to guarantee the
quality of the mapping products with reference to the accuracy thresholds set by the user requirements.
The applied accuracy assessments were based on the use of reference data and applying statistical
sampling to deduce estimates of error in the classifications. In order to provide an efficient, reliable and
robust method to implement an accuracy assessment, there are three major components that had to be
defined: the sampling design, which determines the spatial location of the reference data, the response
design that describes how the reference data is obtained and an analysis design that defines the accuracy
estimates. These steps were undertaken in a harmonised manner for the validation of all the geo-spatial
products.
3.3.1 The Accuracy Assessment of the LU/LC Product
Sampling Design
The sampling design specifies the sample size, sample allocation and the reference assessment units
(i.e. pixels or image blocks). Generally, different sampling schemes can be used in collecting accuracy
assessment data including: simple random sampling, systematic sampling, stratified random sampling,
cluster sampling, and stratified systematic unaligned sampling. In the current project a single stage
stratified random sampling based on the method described by Olofson et al (20131) was applied which
used the map product as the basis for stratification. This ensured that all classes even very minor ones
were included in the sample.
However, in complex LU/LC products with many classes, this usually results in a large number of
strata (one stratum per LU/LC class), of which some classes cover only very small areas (e.g. sport
fields, cemeteries) and not being adequately represented in the sampling. In order to achieve a
representative sampling for the statistical analyses of the mapping accuracy it was decided to extend
the single stage stratified random sampling. At the first stage the number of required samples was
allocated within each of the Level I strata. In the second stage all Level III classes that were not covered
by the first sampling, were grouped into one new stratum. Within that stratum the same number of
samples was randomly allocated as the Level I strata received. To avoid a clustering of point samples
within classes and to minimise the effect of spatial autocorrelation a minimum distance in between the
sample points was set to be 150 m. The final sample size for each class can be considered to be as
close as possible to the proportion of the area covered by each stratum considering that the target was
to determine the overall accuracy of the entire map.
The total sample size per stratum was determined by the expected standard error and the estimated
error rate based on the following formula which assumes a simple random sampling (i.e. the
stratification is not considered):
1 Olofsson, P., Foody, G. M., Stehman, S. V., & Woodcock, C. E. (2013). Making better use of accuracy data in
land change studies: Estimating accuracy and area and quantifying uncertainty using stratified estimation.
Remote Sensing of Environment, 129, 122–131. doi:10.1016/j.rse.2012.10.031
Page 20
Earth Observation for Sustainable Doc. No.: City-Operations Report
Development – Urban Project Issue/Rev-No.: 1.0
EO4SD-Urban Mumbai City Operations Report Page 10
n = 𝑃∗𝑞
(𝐸
𝑧)²
n = number of samples per strata / map class
p = expected accuracy
q = 1 – p
E = Level of acceptable (allowable) sample error
Z = z-value (the given level of significance)
Hence, with an expected accuracy of p = 0.85, a 95% confidence level and an acceptable sampling
error of 5%, the minimum sample size is 196. A 10% oversampling was applied to compensate for
stratification inefficiencies and potentially inadequate samples (e.g. in case of cloudy or shady
reference data). For each Level I strata 215 samples have been randomly allocated. Afterwards, within
all classes of Level III that did not received samples in the first run, additionally 215 samples were
randomly drawn across all these classes.
Table 3: Number of sampling points for the EO4SD-Urban mapping classes after applied sampling design
with information on overall land cover by class.
Class Name Class
ID
No. of
Sampling
Points
Km²
coverage
Artficial Areas 1000 200 60,91
Agricultural Areas 2000 26 24,37
Natural & Semi Natural Areas 3000 36 46,34
Wetlands 4000 20 10,59
Water bodies 5000 18 7,23
Total -- 300 149,4 km²
Response Design
The response design determines the reference information for comparing the map labels to the reference
labels. Collecting reference data on the ground by means of intensive fieldwork is both costly, time
consuming and, in most projects, not feasible. The most cost-effective reference data sources are VHR
satellite data with 0.5 m to 1 m spatial resolution. Czaplewski (2003)2 indicated that visual interpretation
of EO data is acceptable if the spatial resolution of EO data is sufficiently better compared to the
thematic classification system. However, if there are no EO data with better spatial resolution available,
the assessment results need to be checked against the imagery used in the production process.
The calculated number of necessary sampling points for each mapping category was randomly
distributed among the strata and overlaid to the VHR data of each epoch. Figure 2 is showing the
mapping result with the overlaid sample points.
2 Czaplewski, R. L. (2003). Chapter 5: accuracy assessment of maps of forest condition: statistical design and
methodological considerations, pp. 115–140. In Michael A.Wulder, & Steven E. Franklin (Eds.), Remote
sensing of forest environments: concepts and case studies. Boston: Kluwer Academic Publishers (515 pp.).
Page 21
Earth Observation for Sustainable Doc. No.: City-Operations Report
Development – Urban Project Issue/Rev-No.: 1.0
EO4SD-Urban Mumbai City Operations Report Page 11
Figure 2: Mapping result of the AoI defined for Mumbai of the year 2015 overlaid with randomly
distributed sample points used for accuracy assessment.
In this way a reference information could be extracted for each sample point by visual interpretation of
the VHR data for all mapped classes. The size of the area to be observed had to be related to the
Minimum Mapping Unit (MMU) of the map product to be assessed. The reference information of each
sampling point was compared with the mapping results and the numbers of correctly and not-correctly
classified observations were recorded for each class. From this information the specific error matrices
and statistics were computed (see next Section).
Analysis
Each class usually has errors of both omission and commission, and in most situations, these errors for
a class are not equal. In order to calculate these errors as well as the uncertainties (confidence intervals)
for the area of each class a statistically sound accuracy assessment was implemented.
The confusion matrix is a common and effective way to represent quantitative errors in a categorical
map, especially for maps derived from remote sensing data. The matrices for each assessment epoch
were generated by comparing the “reference” information of the samples with their corresponding
classes on the map. The Reference represented the “truth”, while the Map provided the data obtained
from the map result. Thematic accuracy for each class and overall accuracy is then presented in error
matrices (see Annex 2). Unequal sampling intensity resulting from the random sampling approach was
accounted for by applying a weight factor (p) to each sample unit based on the ratio between the number
of samples and the size of the stratum considered3:
3 Selkowitz, D. J., & Stehman, S. V. (2011). Thematic accuracy of the National Land Cover Database (NLCD)
2001 land cover for Alaska. Remote Sensing of Environment, 115(6), 1401–1407. doi:10.1016/j.rse.2011.01.020.
Page 22
Earth Observation for Sustainable Doc. No.: City-Operations Report
Development – Urban Project Issue/Rev-No.: 1.0
EO4SD-Urban Mumbai City Operations Report Page 12
�̂�𝑖𝑗 = (1
𝑀) ∑
1
𝜋𝑢ℎ∗
𝑥∈(𝑖,𝑗)
Where i and j are the columns and rows in the matrix, M is the total number of possible units (population)
and π is the sampling intensity for a given sample unit u in stratum h.
Overall accuracy and User and producer accuracy were computed for all thematic classes and 95%
confidence intervals were calculated for each accuracy metric.
The standard error of the error rate was calculated as follows: 𝜎ℎ = √𝑝ℎ(1−𝑝ℎ)
𝑛ℎ where nh is the sample
size for stratum h and ph is the expected error rate. The standard error was calculated for each stratum
and an overall standard error was calculated based on the following formula:
𝜎 = √∑ 𝑤ℎ2. 𝜎ℎ
2
In which 𝑤ℎ2is the proportion of the total area covered by each stratum. The 95% Confidence Interval
(CI) is +/- 1.96*𝜎.
Results
The confusion matrices are provided within the Annex 2 and showing the mapping error for each
relevant class. For each class the number of samples which are correctly and not correctly classified are
listed, which allows the calculation of the user and producer accuracies for each class as well as the
confidence interval at 95% confidence levels based on the formulae above.
The Land Use/Land Cover product for Mumbai (for 2015) has an overall mapping accuracy of
93.36% with a CI ranging from 90.54 % to 96.18% at a 95% CI. The specific class accuracies are
given in Annex 2.
3.3.2 The Accuracy Assessment of the Percentage Impervious Surface
Product
In the following, we present the strategy designed for validating the PIS product; specifically, details
are given for all protocols adopted for each of the accuracy assessment components, namely response
design, sampling design, and analysis. Results are discussed afterwards.
Response Design
The response design encompasses all steps of the protocol that lead to a decision regarding agreement
of the reference and map classifications. The four major features of the response design are the source
of information used to determine the source of reference data, the spatial unit, the labelling protocol for
the reference classification, and a definition of agreement.
Source of Reference Data: Cloud-free VHR multi-spectral imagery (Visible + Near Infrared)
acquired at 2m spatial resolution (or higher) covering a portion of the AOI for which the Landsat-
based PIS product has been generated;
Spatial Assessment Unit: A 30x30m size unit has been chosen according to the spatial resolution
of the Landsat imagery employed to generate the PIS product;
Reference Labelling Protocol: We first compute for each VHR scene the NDVI and manually
identify the most suitable threshold that allows to exclude all the vegetated areas (i.e. non-
impervious). Then, we refine the resulting mask by extensive photointerpretation.
Definition of Agreement: We aggregate the above-mentioned masks at 30m spatial resolution and
compare per-pixel the resulting VHR-based reference PIS to the corresponding portion of the
Landsat-based PIS product.
Page 23
Earth Observation for Sustainable Doc. No.: City-Operations Report
Development – Urban Project Issue/Rev-No.: 1.0
EO4SD-Urban Mumbai City Operations Report Page 13
Sampling Design
The entirety of pixels covered by the available VHR imagery over the given AOI is employed for
assessing the quality of the Landsat-based PIS product.
Analysis
As measures for assessing the accuracy of the PIS maps, we compute:
the Pearson’s Correlation coefficient: it measures the strength of the linear relationship between
two variables and it is defined as the covariance of the two variables divided by the product of their
standard deviations; in particular, it is largely employed in the literature for validating the output
of regression models;
The Mean Error (ME): it is calculated as the difference between the estimated value (i.e., the
Landsat-based PIS) and the reference value (i.e., the VHR-based reference PIS) averaged over all
the pixels of the image;
The Mean Absolute Error (MAE): it is calculated as the absolute difference between the estimated
value (i.e., the Landsat-based PIS) and the reference value (i.e., the VHR-based reference) averaged
over all the pixels of the image.
Results
To assess the effectiveness of the method developed to generate the PIS maps, we analysed its
performances over 5 test sites (i.e. Antwerp, Helsinki, London, Madrid and Milan) by means of
WorldView-2 (WV2) scenes acquired in 2013-2014 at 2m spatial resolution. In particular, given the
spatial detail offered by WV2 imagery, it was possible to delineate with a very high degree of confidence
all the buildings and other impervious surfaces included in the different investigated areas. Details about
acquisition date and size are reported in Table 6, along with the overall number of final 30x30m
validation samples derived for the validation exercise. Such a task demanded a lot of manual interactions
and transferring it to other AOIs would require extensive efforts; however, we reasonably assume that
the final quality assessment figures (computed on the basis of more than 1.9 million validation samples)
shall be considered representative also for PIS maps generated in the framework of EO4SD-Urban.
Table 4 reports the quantitative results of the comparison between the PIS maps generated using
Landsat-7/8 data acquired in 2013-2014 and the WV2-based reference PIS maps. In particular, the
considered approach allowed to obtain a mean correlation of 0.8271 and average ME and MAE equal
to -0.09 and 13.33, respectively, hence assessing the great effectiveness of the Landsat-based PIS
products. However, it is worth also pointing out that due to the different acquisition geometries, WV2
and LS8 images generally exhibit a very small shift. Nevertheless, despite limited, such displacement
often results in a one-pixel shift between the Landsat-based PIS and the WV2-based reference PIS
aggregated at 30m resolution. This somehow affects the computation of the MAE and of the correlation
coefficient (which however yet resulted in highly satisfactory values). Instead, the bias does not alter
the ME which always exhibited values close to 0, thus confirming the capabilities of the technique and
the reliability of the final products.
Table 4: Acquisition dates and size of the WV2 images available for the 5 test sites analysed in the validation
exercise along with the number of corresponding 30x30m validation samples.
Acquisition Date
[DD.MM.YYYY]
Original Size
[2x2m pixel]
Validation Samples
[30x30m unit]
Antwerp 31.07.2014 5404 x 7844 188.280
Helsinki 21.04.2014 12468 x 9323 516.882
London 28.08.2013 7992 x 8832 313.937
Madrid 20.12.2013 10094 x 13105 588.202
Milan 14.05.2014 8418 x 7957 297.330
Page 24
Earth Observation for Sustainable Doc. No.: City-Operations Report
Development – Urban Project Issue/Rev-No.: 1.0
EO4SD-Urban Mumbai City Operations Report Page 14
3.3.3 The Accuracy Assessment of Building Footprints Product
Sampling Design
The reference assessment units were logically building footprints themselves. A single stage stratified
random sampling was applied which used the geospatial product for the reference year 2015 as the basis
for stratification. This ensured that all classes even very minor ones were included in the sample.
Regarding the sample size, a threshold of 10% of the total number of features had been set resulting to
550 sample units. Then, the sample size per stratum had been set to 40 by default, knowing that all
features were included in the sample for the strata with less than 40 features. Finally, the number of
sampling units related to 1100 - Residential class were increased in order to reach the target of 550 in
total (see Table 5).
Table 5: Number of sampling units per stratum for the Building Footprints product.
Class Name Class
ID
No. of
Sampling
elements
Residential 1100 316
Commercial 1211 40
Industry 1212 40
University 1213 18
School 1214 40
Government 1215 1
Hospital 1217 26
Public Building 1218 14
Non-Residential Urban Fabric 1219 40
Transportation 1230 5
Recreation Facility 1420 10
Total -- 550
Response Design
The calculated number of necessary sampling units for each building class was randomly distributed
among the strata and overlaid to the VHR data of each epoch. The Figure 3 shows the subset of building
footprints corresponding to the sample resulting from the strategy applied.
Page 25
Earth Observation for Sustainable Doc. No.: City-Operations Report
Development – Urban Project Issue/Rev-No.: 1.0
EO4SD-Urban Mumbai City Operations Report Page 15
Figure 3: Subset of building footprints randomly distributed per stratum used for accuracy assessment.
In this way a reference information could be extracted for each sample unit (i.e. building footprint) by
visual interpretation of the VHR data for all mapped classes. More precisely, the information is related
to the presence/absence of the building and its thematic class/function. The reference information of
each sampling unit was compared with the mapping results and the numbers of correctly and not-
correctly classified observations were recorded for each class. From this information the specific error
matrices and statistics were computed (see next Section).
Analysis
Each class usually has errors of both omission and commission, and in most situations, these errors for
a class are not equal. In order to calculate these errors as well as the uncertainties (confidence intervals)
for the area of each class, a statistically sound accuracy assessment was implemented in the same way
as for the Land Use / Land Cover product. Thematic accuracy for each class and overall accuracy for
both recent and historic information is then presented in error matrices (see Annex 2).
Results
The confusion matrices show the mapping error for each relevant class. The number of samples which
are correctly and not correctly classified are listed, which allows the calculation of the user and producer
accuracies for each class as well as the confidence interval at 95% confidence levels.
The Building Footprints product around Panvel Station (for 2015) has an overall thematic
mapping accuracy of 96.73% with a CI ranging from 95.24% to 98.21%at a 95% CI. The specific
class accuracies are given in Annex 2.
Page 26
Earth Observation for Sustainable Doc. No.: City-Operations Report
Development – Urban Project Issue/Rev-No.: 1.0
EO4SD-Urban Mumbai City Operations Report Page 16
3.4 Quality Control/Assurance
A detailed Quality Control and Quality Assurance (QC/QA) system has been developed which records
and documents all quality relevant processes ranging from the agreed product requirements, the different
types of input data and their quality as well as the subsequent processing and accuracy assessment steps.
The main goal of the QC/QA procedures was the verification of the completeness, logical consistency,
geometric and thematic accuracy and that metadata are following ISO standards on geographic data
quality and INSPIRE data specifications. These assessments were recorded in Data Quality Sheets
which are provided in Annex 2. The QC/QA procedures were based on an assessment of a series of
relevant data elements and processing steps which are part of the categories listed below:
Product requirements;
Specifications of input data: EO data, in-situ data, ancillary data;
Data quality checks: EO data quality, in-situ data quality, ancillary data quality;
Geometric correction, geometric accuracy, data fusion (if applicable), data processing;
Thematic processing: classification, plausibility checks;
Accuracy: thematic accuracy, error matrices
Delivery checks: completeness, compliancy with requirements
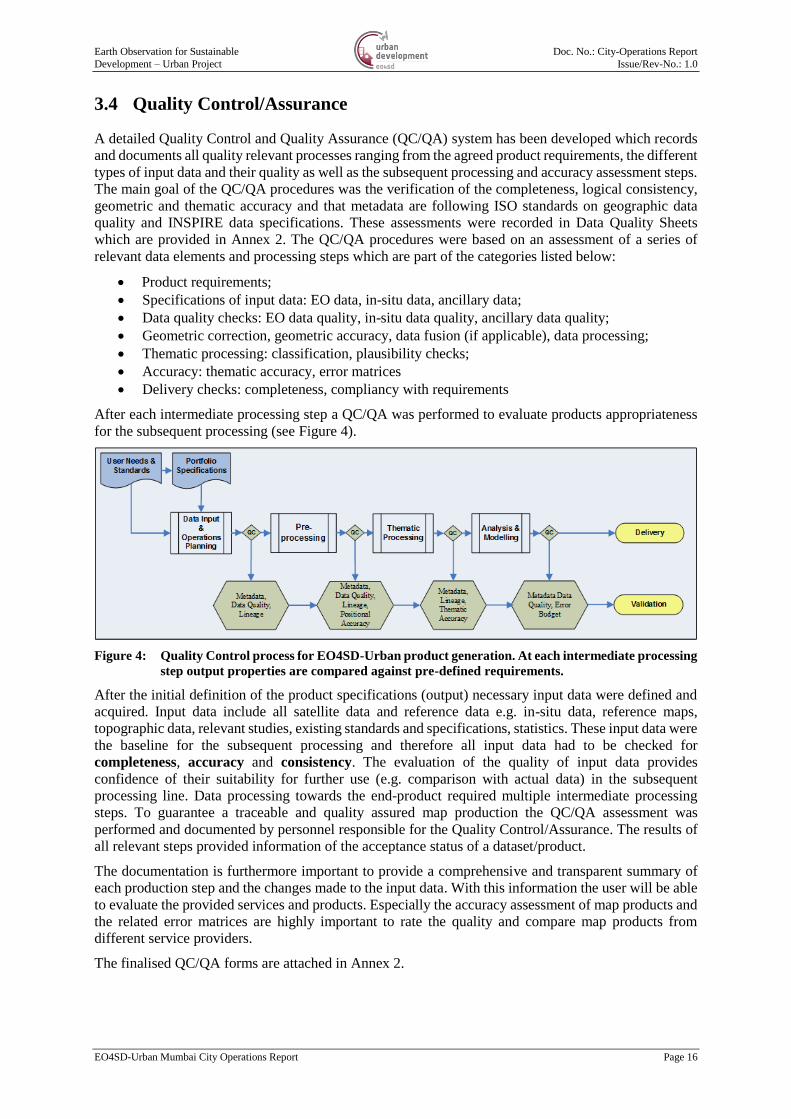
After each intermediate processing step a QC/QA was performed to evaluate products appropriateness
for the subsequent processing (see Figure 4).
Figure 4: Quality Control process for EO4SD-Urban product generation. At each intermediate processing
step output properties are compared against pre-defined requirements.
After the initial definition of the product specifications (output) necessary input data were defined and
acquired. Input data include all satellite data and reference data e.g. in-situ data, reference maps,
topographic data, relevant studies, existing standards and specifications, statistics. These input data were
the baseline for the subsequent processing and therefore all input data had to be checked for
completeness, accuracy and consistency. The evaluation of the quality of input data provides
confidence of their suitability for further use (e.g. comparison with actual data) in the subsequent
processing line. Data processing towards the end-product required multiple intermediate processing
steps. To guarantee a traceable and quality assured map production the QC/QA assessment was
performed and documented by personnel responsible for the Quality Control/Assurance. The results of
all relevant steps provided information of the acceptance status of a dataset/product.
The documentation is furthermore important to provide a comprehensive and transparent summary of
each production step and the changes made to the input data. With this information the user will be able
to evaluate the provided services and products. Especially the accuracy assessment of map products and
the related error matrices are highly important to rate the quality and compare map products from
different service providers.
The finalised QC/QA forms are attached in Annex 2.
Page 27
Earth Observation for Sustainable Doc. No.: City-Operations Report
Development – Urban Project Issue/Rev-No.: 1.0
EO4SD-Urban Mumbai City Operations Report Page 17
3.5 Metadata
Metadata provides additional information about the delivered products to enable it to be better
understood. In the current project a harmonised approach to provide metadata in a standardised format
applicable to all products and end-users was adopted. Metadata are provided as XML files, compliant
to the ISO standard 19115 "Metadata" and ISO 19139 "XML Scheme Implementation". The metadata
files have been created and validated by the GIS/IP-operator for each map product with the Infrastructure
for Spatial Information in Europe (INSPIRE) Metadata Editor available at: http://inspire-
geoportal.ec.europa.eu/editor/.
The European Community enacted a Directive in 2007 for the creation of a common geo-data
infrastructure to provide a consistent metadata scheme for geospatial services and products that could
be used not only in Europe but globally. The geospatial infrastructure called INSPIRE was built in a
close relation to existing International Organization for Standardization (ISO) standards. These are ISO
19115, ISO 19119 and ISO 15836. The primary incentive of INSPIRE is to facilitate the use and sharing
of spatial information by providing key elements and guidelines for the creation of metadata for
geospatial products and services.
The INSPIRE Metadata provides a core set of metadata elements which are part of all the delivered geo-
spatial products to the users. Furthermore, the metadata elements provide elements that are necessary to
perform queries, store and relocate data in an efficient manner. The minimum required information is
specified in the Commission Regulation (EC) No 1205/2008 of 3 December 2008 and contains 10
elements:
Information on overall Product in terms of: Point of contact for product generation, date of
creation
Identification of Product: Resource title, Abstract (a short description of product) and Locator
Classification of Spatial Data
Keywords (that define the product)
Geographic information: Area Coverage of the Product
Temporal Reference: Temporal extent; date of publication; date of last revision; date of
creation
Quality and Validity: Lineage, spatial resolution
Conformity: degree of conformance to specifications
Data access constraints or Limitations
Responsible party: contact details and role of contact group/person
These elements (not exhaustive) constitute the core information that has to be provided to meet the
minimum requirements for Metadata compliancy. Each element and its sub-categories or elements have
specific definitions; for example in the element “Quality” there is a component called “Lineage” which
has a specific definition as follows: “a statement on process history and/or overall quality of the spatial
data set. Where appropriate it may include a statement whether the data set has been validated or quality
assured, whether it is the official version (if multiple versions exist), and whether it has legal validity.
The value domain of this element is free text,” (INSPIRE Metadata Technical Guidelines, 2013). The
detailed information on the Metadata elements and their definitions can be found in the “INSPIRE
Metadata Implementing Rules: Technical Guidelines,” (2013). Each of the EO4SD-Urban products will
be accompanied by such a descriptive metadata file. It should be noted that the internal use of metadata
in these institutions might not be established at an operational level, but the file format (*.xml) and the
web accessibility of data viewers enable for the full utility of the metadata.
Page 28
Earth Observation for Sustainable Doc. No.: City-Operations Report
Development – Urban Project Issue/Rev-No.: 1.0
EO4SD-Urban Mumbai City Operations Report Page 18
4 Analysis of Mapping Results
This Chapter will present and assess all results which have been produced within the framework of the
current project, and provide the results of some standard analytics undertaken with these products
including the following:
Land Use Land Cover alongside the railroad - Status and Trends between 2005 and 2015
Building Footprints around Panvel station - Status and Trends between 2005 and 2015
It is envisaged that these analytics provide information on general trends and developments in the AoI
which can then be further interpreted and used by Urban planners and the City Authorities for city
planning.
It should be noted that all digital data sets for these products are provided in concurrence with this City
Report with all the related metadata and Quality Control documentation.
Page 29
Earth Observation for Sustainable Doc. No.: City-Operations Report
Development – Urban Project Issue/Rev-No.: 1.0
EO4SD-Urban Mumbai City Operations Report Page 19
4.1 Land Use Land Cover 2005 and 2015
This section will present the results of the LU/LC mapping for 2005 and 2015 as well the statistical
information on the changes between these two epochs. The LU/LC overview map for 2015 is depicted
in Figure 6 and a cartographic version of the map layout is provided as a pdf file in addition to the geo-
spatial product.
Figure 5: Detailed Land Use Land Cover 2015 alongside the railroad in Mumbai.
Page 30
Earth Observation for Sustainable Doc. No.: City-Operations Report
Development – Urban Project Issue/Rev-No.: 1.0
EO4SD-Urban Mumbai City Operations Report Page 20
Figure 6: Detailed Land Use Land Cover 2015 around Panvel Railway Station in Mumbai.
In the 2005 epoch the most dominant LU/LC classes occurring in the Overall area were: Agriculture
(24.3% of the total area), Natural areas (19.8 % of the total area) and Residential urban fabric units
(15.9% of the total area). By 2015 these classes remained as the most dominant with some slight
changes. For instance, the Residential area classes increased by 5.9% (8.7 km²) while the Agricultural
land drops to 16.3%, a decrease of 8% (12 km²). Besides, natural areas remain stable over time. Further
information on the class disaggregation and area coverage is presented in Figure 7 and Figure 8 for the
epochs 2005 and 2015 respectively.
Page 31
Earth Observation for Sustainable Doc. No.: City-Operations Report
Development – Urban Project Issue/Rev-No.: 1.0
EO4SD-Urban Mumbai City Operations Report Page 21
Figure 7: Detailed Land Use Land Cover 2005 structure: Presented as Overall in % (left) and km2 (right).
Figure 8: Detailed Land Use Land Cover 2015 structure: Presented as Overall in % (left) and km2 (right).
Description of LULC Changes
In addition to the overall LU/LC classification for the two epochs it is interesting to assess the different
trends between classes over the 10-year time. The quantitative figures for each class are first provided
in Table 6 to get an overview. The next Section will highlight the LU/LC change information between
the two epochs in more detail.
Page 32
Earth Observation for Sustainable Doc. No.: City-Operations Report
Development – Urban Project Issue/Rev-No.: 1.0
EO4SD-Urban Mumbai City Operations Report Page 22
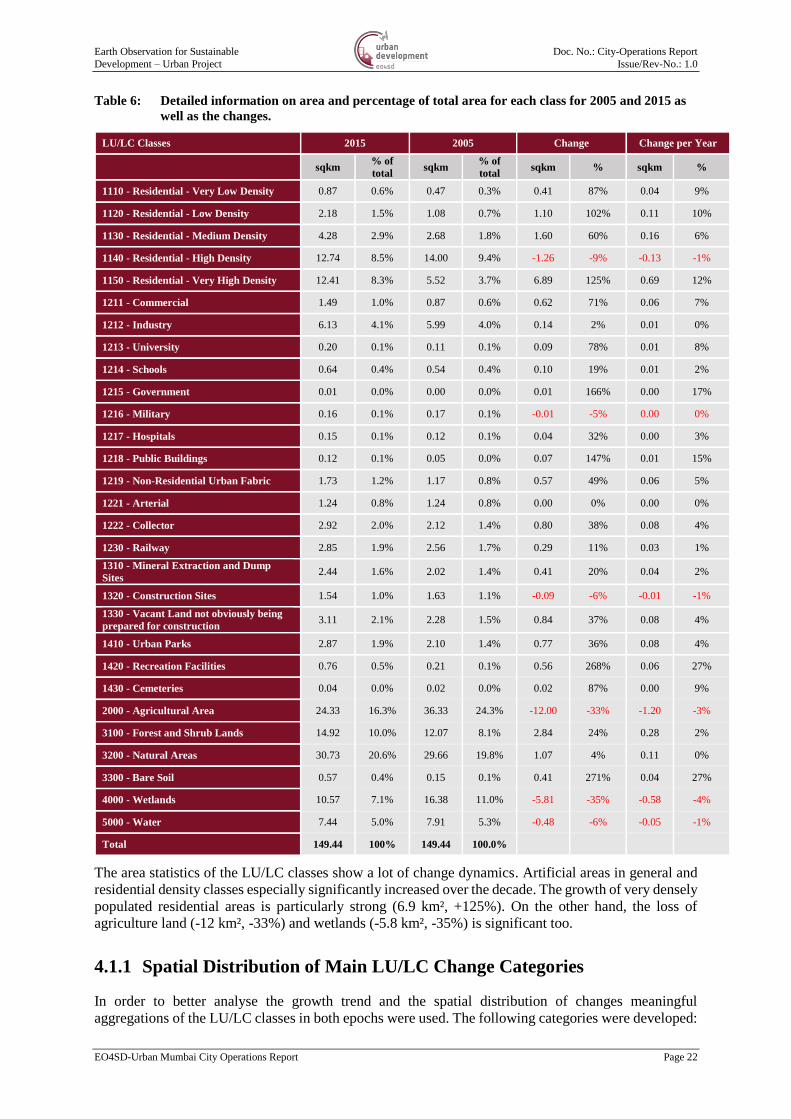
Table 6: Detailed information on area and percentage of total area for each class for 2005 and 2015 as
well as the changes.
LU/LC Classes 2015 2005 Change Change per Year
sqkm % of
total sqkm
% of
total sqkm % sqkm %
1110 - Residential - Very Low Density 0.87 0.6% 0.47 0.3% 0.41 87% 0.04 9%
1120 - Residential - Low Density 2.18 1.5% 1.08 0.7% 1.10 102% 0.11 10%
1130 - Residential - Medium Density 4.28 2.9% 2.68 1.8% 1.60 60% 0.16 6%
1140 - Residential - High Density 12.74 8.5% 14.00 9.4% -1.26 -9% -0.13 -1%
1150 - Residential - Very High Density 12.41 8.3% 5.52 3.7% 6.89 125% 0.69 12%
1211 - Commercial 1.49 1.0% 0.87 0.6% 0.62 71% 0.06 7%
1212 - Industry 6.13 4.1% 5.99 4.0% 0.14 2% 0.01 0%
1213 - University 0.20 0.1% 0.11 0.1% 0.09 78% 0.01 8%
1214 - Schools 0.64 0.4% 0.54 0.4% 0.10 19% 0.01 2%
1215 - Government 0.01 0.0% 0.00 0.0% 0.01 166% 0.00 17%
1216 - Military 0.16 0.1% 0.17 0.1% -0.01 -5% 0.00 0%
1217 - Hospitals 0.15 0.1% 0.12 0.1% 0.04 32% 0.00 3%
1218 - Public Buildings 0.12 0.1% 0.05 0.0% 0.07 147% 0.01 15%
1219 - Non-Residential Urban Fabric 1.73 1.2% 1.17 0.8% 0.57 49% 0.06 5%
1221 - Arterial 1.24 0.8% 1.24 0.8% 0.00 0% 0.00 0%
1222 - Collector 2.92 2.0% 2.12 1.4% 0.80 38% 0.08 4%
1230 - Railway 2.85 1.9% 2.56 1.7% 0.29 11% 0.03 1%
1310 - Mineral Extraction and Dump
Sites 2.44 1.6% 2.02 1.4% 0.41 20% 0.04 2%
1320 - Construction Sites 1.54 1.0% 1.63 1.1% -0.09 -6% -0.01 -1%
1330 - Vacant Land not obviously being
prepared for construction 3.11 2.1% 2.28 1.5% 0.84 37% 0.08 4%
1410 - Urban Parks 2.87 1.9% 2.10 1.4% 0.77 36% 0.08 4%
1420 - Recreation Facilities 0.76 0.5% 0.21 0.1% 0.56 268% 0.06 27%
1430 - Cemeteries 0.04 0.0% 0.02 0.0% 0.02 87% 0.00 9%
2000 - Agricultural Area 24.33 16.3% 36.33 24.3% -12.00 -33% -1.20 -3%
3100 - Forest and Shrub Lands 14.92 10.0% 12.07 8.1% 2.84 24% 0.28 2%
3200 - Natural Areas 30.73 20.6% 29.66 19.8% 1.07 4% 0.11 0%
3300 - Bare Soil 0.57 0.4% 0.15 0.1% 0.41 271% 0.04 27%
4000 - Wetlands 10.57 7.1% 16.38 11.0% -5.81 -35% -0.58 -4%
5000 - Water 7.44 5.0% 7.91 5.3% -0.48 -6% -0.05 -1%
Total 149.44 100% 149.44 100.0%
The area statistics of the LU/LC classes show a lot of change dynamics. Artificial areas in general and
residential density classes especially significantly increased over the decade. The growth of very densely
populated residential areas is particularly strong (6.9 km², +125%). On the other hand, the loss of
agriculture land (-12 km², -33%) and wetlands (-5.8 km², -35%) is significant too.
4.1.1 Spatial Distribution of Main LU/LC Change Categories
In order to better analyse the growth trend and the spatial distribution of changes meaningful
aggregations of the LU/LC classes in both epochs were used. The following categories were developed:
Page 33
Earth Observation for Sustainable Doc. No.: City-Operations Report
Development – Urban Project Issue/Rev-No.: 1.0
EO4SD-Urban Mumbai City Operations Report Page 23
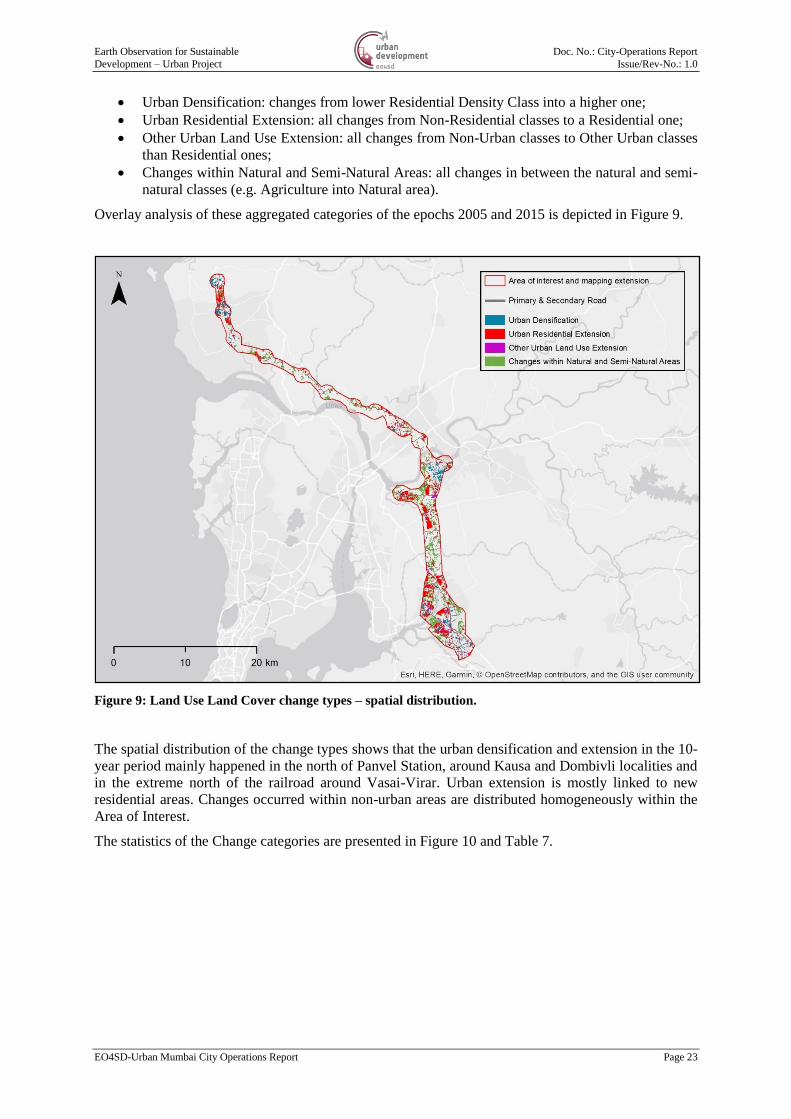
Urban Densification: changes from lower Residential Density Class into a higher one;
Urban Residential Extension: all changes from Non-Residential classes to a Residential one;
Other Urban Land Use Extension: all changes from Non-Urban classes to Other Urban classes
than Residential ones;
Changes within Natural and Semi-Natural Areas: all changes in between the natural and semi-
natural classes (e.g. Agriculture into Natural area).
Overlay analysis of these aggregated categories of the epochs 2005 and 2015 is depicted in Figure 9.
Figure 9: Land Use Land Cover change types – spatial distribution.
The spatial distribution of the change types shows that the urban densification and extension in the 10-
year period mainly happened in the north of Panvel Station, around Kausa and Dombivli localities and
in the extreme north of the railroad around Vasai-Virar. Urban extension is mostly linked to new
residential areas. Changes occurred within non-urban areas are distributed homogeneously within the
Area of Interest.
The statistics of the Change categories are presented in Figure 10 and Table 7.
Page 34
Earth Observation for Sustainable Doc. No.: City-Operations Report
Development – Urban Project Issue/Rev-No.: 1.0
EO4SD-Urban Mumbai City Operations Report Page 24
Figure 10: Land Use Land Cover Change Types 2005-2015 for Mumbai AoI; in % (left) and km² (right)
The quantitative results show that the most dynamic changes which occurred between 2005 – 2015 were
represented by the Urban Residential Extension, i.e. changes from non-residential to residential classes
with 40.0% from the total change area, and changes occurred within non-urban areas between natural
and semi-natural classes with 43.2%. Those changes represent 17.7 and 19.2 km² respectively over a
total change area of 44.3 km².
Table 7: Overall LU/LC Main Changes Statistics.
Change Classes Change Overall
sqkm %
Urban Densification 5.28 11.9%
Urban Residential Extension 17.74 40.0%
Other Urban Land Use Extension 2.15 4.9%
Change within Natural and Semi-Natural Areas 19.15 43.2%
Total 44.32 100.0%
4.1.2 Changes of Agricultural Areas
In order to deeper analyse the relatively large loss of Agricultural areas as noted in the earlier part of
Section 4.1, further change analysis was performed. The following change categories were developed
for this analysis:
Agriculture to Residential area
Agriculture to Industry, Commercial, Public or Military area
Agriculture to Plantations
The spatial distribution of these changes is displayed in Figure 11.
Page 35
Earth Observation for Sustainable Doc. No.: City-Operations Report
Development – Urban Project Issue/Rev-No.: 1.0
EO4SD-Urban Mumbai City Operations Report Page 25
Figure 11: Spatial distribution of changes from Agricultural Areas to other Classes between 2005 and
2015.
The conversion of agricultural areas into other LULC classes was mainly caused by both urban
residential and non-residential extension alongside the railroad. These two conversion types are shown
in Error! Reference source not found. in blue and red colours respectively.
Figure 12 and Table 8 below provide a quantitative overview of the changes of the agricultural areas
into other LU classes between 2005 and 2015 within the AoI.
Figure 12: Changes of Agricultural Areas into other LU classes between 2005 and 2015; in % (left) and
km2 (right).
Page 36
Earth Observation for Sustainable Doc. No.: City-Operations Report
Development – Urban Project Issue/Rev-No.: 1.0
EO4SD-Urban Mumbai City Operations Report Page 26
The statistics confirm that most of former agricultural areas has been converted into residential ones
over the decade representing 51.3% of the total changes for this specific land use class. More than a
third is used in 2015 for industrial, commercial, public or military activities (35.1%). The last change
trend is agricultural to forested areas, which only have a minor contribution to the LULC changes in the
period between 2005 – 2015. At the end, the overall changes related to the loss of agricultural areas
cover 3.3 km² over the Area of Interest of 150 km².
Table 8 : Statistics of changes of Agricultural areas.
Change Classes Change Overall
sqkm %
Agricultural Area to Residential 1.69 51.3%
Agricultural Area to Industrial, Commercial,
Public or Military Area 1.15 35.1%
Agricultural Area to Forest 0.45 13.6%
Total 3.29 100.0%
4.1.3 Changes of Natural and Semi Natural Areas
In order to deeper analyse the change dynamics affecting natural and semi-natural areas, further change
analysis was performed introducing the following categories:
Natural (including Forest/Semi-Natural/Wetland/Water classes) to Artificial
Natural (including Forest/Semi-Natural/Wetland/Water classes) to Agriculture
Forest to Semi-Natural
The spatial distribution of these changes is displayed in Figure 13.
Figure 13: Spatial distribution of changes from Natural Areas to other Classes between 2005 and 2015.
Page 37
Earth Observation for Sustainable Doc. No.: City-Operations Report
Development – Urban Project Issue/Rev-No.: 1.0
EO4SD-Urban Mumbai City Operations Report Page 27
Figure 13 clearly indicates that most of the changes affecting natural and semi-natural areas were
linked to urban extension.
Figure 14: Changes of Natural Areas into other LU classes between 2005 and 2015; in % (left) and km2
(right).
Figure 14 and Table 9 confirm this analysis, as this category of changes represents 88% of the total
change area related to natural and semi-natural habitats, i.e. 11.5 km² out of a total of 13.1 km². The
only other significant change type is natural to agricultural areas representing 11% (1.4 km²).
Table 9: Statistics of changes of Natural areas.
Change Classes Change Overall
sqkm %
Natural to Artificial 11.48 88%
Natural to Agriculture 1.44 11%
Forest to Semi Natural 0.17 1%
Total 13.08 100%
Page 38
Earth Observation for Sustainable Doc. No.: City-Operations Report
Development – Urban Project Issue/Rev-No.: 1.0
EO4SD-Urban Mumbai City Operations Report Page 28
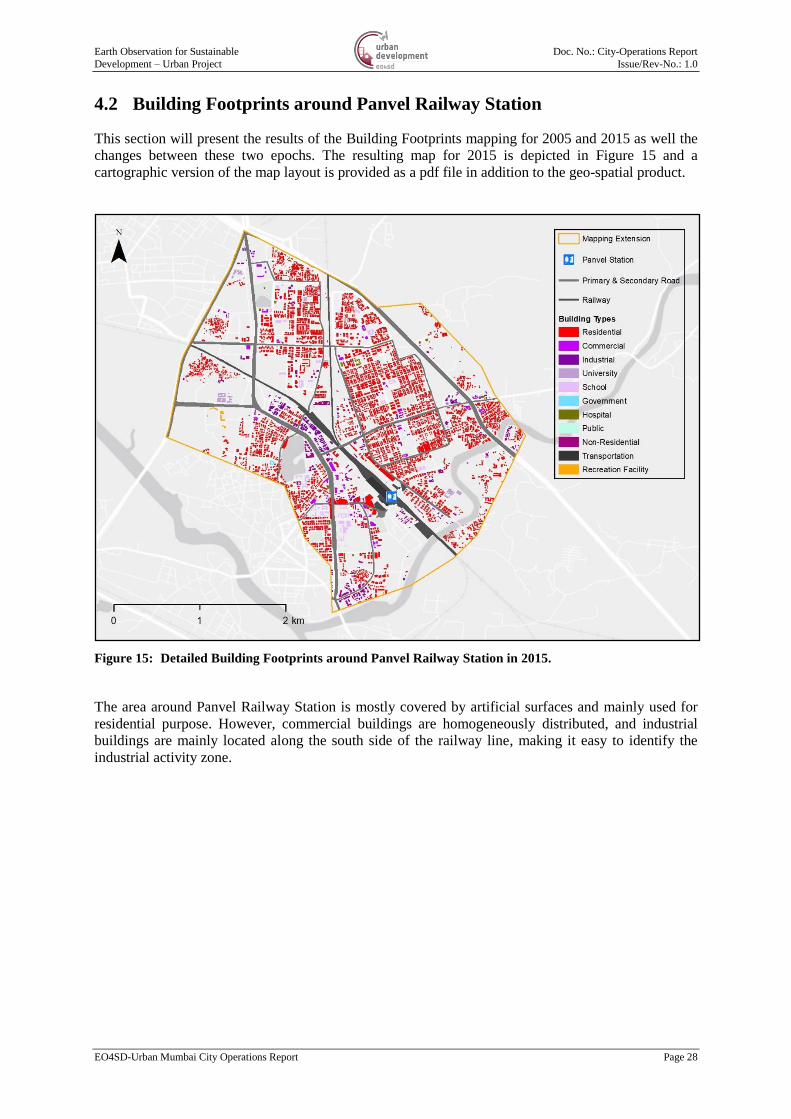
4.2 Building Footprints around Panvel Railway Station
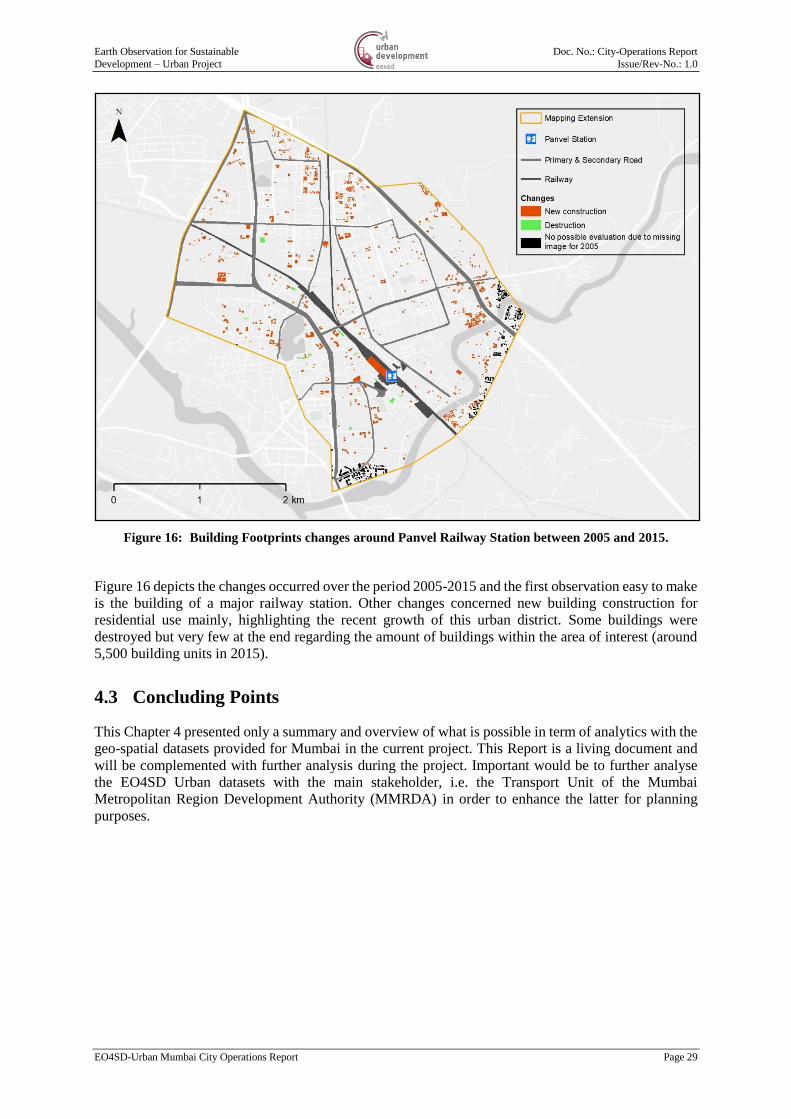
This section will present the results of the Building Footprints mapping for 2005 and 2015 as well the
changes between these two epochs. The resulting map for 2015 is depicted in Figure 15 and a
cartographic version of the map layout is provided as a pdf file in addition to the geo-spatial product.
Figure 15: Detailed Building Footprints around Panvel Railway Station in 2015.
The area around Panvel Railway Station is mostly covered by artificial surfaces and mainly used for
residential purpose. However, commercial buildings are homogeneously distributed, and industrial
buildings are mainly located along the south side of the railway line, making it easy to identify the
industrial activity zone.
Page 39
Earth Observation for Sustainable Doc. No.: City-Operations Report
Development – Urban Project Issue/Rev-No.: 1.0
EO4SD-Urban Mumbai City Operations Report Page 29
Figure 16: Building Footprints changes around Panvel Railway Station between 2005 and 2015.
Figure 16 depicts the changes occurred over the period 2005-2015 and the first observation easy to make
is the building of a major railway station. Other changes concerned new building construction for
residential use mainly, highlighting the recent growth of this urban district. Some buildings were
destroyed but very few at the end regarding the amount of buildings within the area of interest (around
5,500 building units in 2015).
4.3 Concluding Points
This Chapter 4 presented only a summary and overview of what is possible in term of analytics with the
geo-spatial datasets provided for Mumbai in the current project. This Report is a living document and
will be complemented with further analysis during the project. Important would be to further analyse
the EO4SD Urban datasets with the main stakeholder, i.e. the Transport Unit of the Mumbai
Metropolitan Region Development Authority (MMRDA) in order to enhance the latter for planning
purposes.
Page 40
Earth Observation for Sustainable Doc. No.: City-Operations Report
Development – Urban Project Issue/Rev-No.: 1.0
EO4SD-Urban Mumbai City Operations Report Page 30
5 References
Czaplewski, R. L. (2003). Chapter 5: Accuracy assessment of maps of forest condition: statistical design
and methodological considerations, pp. 115–140. In Michael A. Wulder, & Steven E. Franklin (Eds.),
Remote sensing of forest environments: concepts and case studies. Boston: Kluwer Academic Publishers
(515 pp.).
European Union (2011). Mapping Guide for a European Urban Atlas, Version 11.0
Goodchild, M., Chih-Chang, L. and Leung, Y. (1994): Visualizing fuzzy maps, pp. 158-67. In
Heamshaw, H.H. and Unwin, D.J. (Eds.), Visualization in geographical information systems.
Chichester: Wiley.
Olofsson, P., Foody, G. M., Stehman, S. V., & Woodcock, C. E. (2013). Making better use of accuracy
data in land change studies: Estimating accuracy and area and quantifying uncertainty using stratified
estimation. Remote Sensing of Environment, 129, 122–131. doi:10.1016/j.rse.2012.10.031
Selkowitz, D. J., & Stehman, S. V. (2011). Thematic accuracy of the National Land Cover Database
(NLCD) 2001 land cover for Alaska. Remote Sensing of Environment, 115(6), 1401–1407.
doi:10.1016/j.rse.2011.01.020.
Internet
Road classification, European Commission, 2017, https://ec.europa.eu/transport/road_safety/specialist-
/knowledge/road/designing_for_road_function/road_classification_en, last accessed 2017.08.17
Page 41
Earth Observation for Sustainable
Development Urban Project QA/QC Sheets developed by GAF AG
© 2018 GAF AG All Rights Reserved. Unless otherwise indicated, the templates of these QA/QC pages are copyrighted by GAF AG. No
part of these pages, either text or image may be used for any purpose other than use in the EO4SD-Urban Project. Therefore,
reproduction, modification, storage in a retrieval system or retransmission, in any form or by any means, electronic, mechanical or
otherwise, for reasons other than personal use, is strictly prohibited without prior written permission
Page 1
Annex 1 – Processing Methods for EO4SD-Urban Products
Page 42
Earth Observation for Sustainable
Development Urban Project QA/QC Sheets developed by GAF AG
© 2018 GAF AG All Rights Reserved. Unless otherwise indicated, the templates of these QA/QC pages are copyrighted by GAF AG. No
part of these pages, either text or image may be used for any purpose other than use in the EO4SD-Urban Project. Therefore,
reproduction, modification, storage in a retrieval system or retransmission, in any form or by any means, electronic, mechanical or
otherwise, for reasons other than personal use, is strictly prohibited without prior written permission
Page 2
This page is intentionally left blank!
Page 43
Earth Observation for Sustainable
Development Urban Project QA/QC Sheets developed by GAF AG
© 2018 GAF AG All Rights Reserved. Unless otherwise indicated, the templates of these QA/QC pages are copyrighted by GAF AG. No
part of these pages, either text or image may be used for any purpose other than use in the EO4SD-Urban Project. Therefore,
reproduction, modification, storage in a retrieval system or retransmission, in any form or by any means, electronic, mechanical or
otherwise, for reasons other than personal use, is strictly prohibited without prior written permission
Page 3
Summary of Processing Methods
Urban Land Use/Land Cover and Change
The input includes Very High Spatial Resolution (VHR) imagery from different sensors acquired at
different time. The data is pre-processed to ensure a high level of geometric and radiometric quality
(ortho-rectification, radiometric calibration, pan-sharpening).
The complexity when dealing with VHR images comes from the internal variability of the information
for a single land-use. For instance, an urban area is represented by a high number of heterogeneous pixel
values hampering the use of automated pixel-based classification techniques.
For these VHR images, it is possible to identify textures (or pattern) inside an entity such as an
agricultural parcel or an urban lot. In other words, whereas pixel-based techniques focus on the local
information of each single pixel (including intensity / DN value), texture analysis provides global
information in a group of neighbouring pixels (including distribution of a group intensity / DN values
but also spatial arrangement of these values). Texture and spectral information are combined with a
segmentation algorithm in an Object Based Image Analysis (OBIA) approach to reach a high degree of
automation for most of the peri-urban rural classes. However, within urban land, land use information
is often difficult to obtain from the imagery alone and ancillary/in situ data needs to be used. The
heterogeneity and format of these data mean that another information extraction method based on
Computer Aided Photo-Interpretation techniques (CAPI) need to be used to fully characterise the LULC
classes in urban areas. Therefore, a mix of automated (OBIA) and CAPI are used to optimise the
cost/quality ratio for the production of the LULC/LUCC product. The output format is typically in vector
form which makes it easier for integration in a GIS and for subsequent analysis.
Level 4 of the nomenclature can be obtained based on additional information. These can be generated
by more detailed CAPI (e.g. identification of waste sites) or by an automated approach based on
derived/additional products. An example is illustration by categorising the density of the urban fabric
which is related to population density and can then subsequently used for disaggregating population
data.
Information on urban fabric density can be obtained through several manners with increasing level of
complexity. The Imperviousness Degree (IMD) or Soil Sealing (SL) layer (see separate product) can be
produced relatively easily based on the urban extent derived from the LULC product and a linear model
between imperviousness areas and vegetation vigour that can be obtained from Sentinel 2 or equivalent
NDVI time series. This additional layer can be used to identify continuous and discontinuous urban
fabric classes. Five urban fabric classes can be extracted based on a fully automated procedure:
Continuous very dense urban fabric (IMD > 80%)
Discontinuous dense urban fabric: (IMD 50-80 %)
Discontinuous medium density urban fabric (IMD: 30-50 %)
Discontinuous low density urban fabric (IMD 10-30 %)
Discontinuous very low density urban fabric (IMD < 10 %)
Manual enhancement is the final post-processing step of the production framework. It will aim to
validate the detected classes and adjust classes’ polygon geometry if necessary to ensure that the correct
MMU is applied. Finally, a thorough completeness and logical consistency check is applied to ensure
the topological integrity and coherence of the product.
Page 44
Earth Observation for Sustainable
Development Urban Project QA/QC Sheets developed by GAF AG
© 2018 GAF AG All Rights Reserved. Unless otherwise indicated, the templates of these QA/QC pages are copyrighted by GAF AG. No
part of these pages, either text or image may be used for any purpose other than use in the EO4SD-Urban Project. Therefore,
reproduction, modification, storage in a retrieval system or retransmission, in any form or by any means, electronic, mechanical or
otherwise, for reasons other than personal use, is strictly prohibited without prior written permission
Page 4
Change detection: Four important aspects must be considered to monitor land use/land cover change
effectively with remote sensing images: (1) detecting that changes have occurred, (2) identifying the
nature of the change, (3) characterising the areal extent of the change and (4) assessing the spatial pattern
of the change.
The change detection layer can be derived based on an image-to-image approach provided the same
sensor is used. An original and efficient image processing chain is promoted to compare two dates’
images and provide multi-labelled changes. The approach mainly relies on texture analysis, which has
the benefits to deal easily with heterogeneous data and VHR images. The applied change mapping
approach is based on spectral information of both dates’ images and more accurate than a map-to-map
comparison.
Page 45
Earth Observation for Sustainable
Development Urban Project QA/QC Sheets developed by GAF AG
© 2018 GAF AG All Rights Reserved. Unless otherwise indicated, the templates of these QA/QC pages are copyrighted by GAF AG. No
part of these pages, either text or image may be used for any purpose other than use in the EO4SD-Urban Project. Therefore,
reproduction, modification, storage in a retrieval system or retransmission, in any form or by any means, electronic, mechanical or
otherwise, for reasons other than personal use, is strictly prohibited without prior written permission
Page 5
Summary of Processing Methods
Urban Extent
Reliably outlining urban areas is of high importance since an accurate characterization of the urban
extent is fundamental for accurately estimating, among others, the population distribution, the use of
resources (e.g., soil, energy, water, materials), infrastructure and transport needs, socioeconomic
development, human health and food security. Moreover, monitoring the change in the extent of urban
areas over time is of great support for properly modelling the spatial-temporal patterns of urbanisation
evolution and, thus, better estimating future trends and implementing suitable planning strategies.
The product is a binary mask outlining in the area of interest the urban areas (intended as built-up
structures) with respect to all other land-cover classes merged together into a single information class.
The urban class and the non-urban class are associated with value “255” and “0”, respectively.
Regrouping of relevant LULC thematic classes can be used to depict urban extent precisely. Instead, if
a detailed LULC product is not available for the selected study region, then the information will be
derived by the following approach.
The product is generated at 30 m spatial resolution by properly exploiting Landsat-4/5/7/8 multi-
temporal imagery acquired over the peri-urban and urban area within a given time interval of interest in
which no relevant changes are expected to occur (typically a time period of 1-2 years allows to obtain
very accurate results). For all the considered scenes, cloud masking and, optionally, atmospheric
correction are performed. Next, a series of features specifically suitable for delineating urban areas are
derived for each image. These include both spectral indexes (e.g., the normalized different vegetation
index (NDVI), the atmospherically resistant vegetation index (ARVI), the normalized difference water
index (NDWI), etc.) and texture features (e.g., occurrence textures, co-occurrence texture, local
coefficient of variation, etc.). The core idea is then to compute per each pixel key temporal statistics for
all the extracted features, like temporal maximum, minimum, mean, variance, median, etc. This allows
compressing all the information contained in the different multi-temporal acquisitions, but at the same
time to easily and effectively characterize the underlying dynamics. It is worth noting that for different
pixels in the study area, different number of scenes might be available. However, in the hypothesis of a
sufficient minimum number of acquisitions for computing consistent statistics, this does not represent
an issue. Moreover, in this framework it is also possible to obtain spatially consistent datasets to be
employed for the desired analyses even when investigating large areas. Training data for the urban and
non-urban class are then extracted by employing a strategy based on the analysis of the DLR Global
Urban Footprint (GUF) layer (which varies depending whether the target period of interest refers to a
time interval before or after that which the GUF refers to). Afterwards, a Support Vector Machines
(SVM) classifier is employed where a Radial Basis Function (RBF) kernel is used.
Page 46
Earth Observation for Sustainable
Development Urban Project QA/QC Sheets developed by GAF AG
© 2018 GAF AG All Rights Reserved. Unless otherwise indicated, the templates of these QA/QC pages are copyrighted by GAF AG. No
part of these pages, either text or image may be used for any purpose other than use in the EO4SD-Urban Project. Therefore,
reproduction, modification, storage in a retrieval system or retransmission, in any form or by any means, electronic, mechanical or
otherwise, for reasons other than personal use, is strictly prohibited without prior written permission
Page 6
Summary of Processing Methods
Urban Imperviousness
Imperviousness product is intended to represent the impervious surfaces because of urban development,
layers of completely or partly impermeable artificial material (asphalt, concrete, etc.) and infrastructure
construction. Therefore, the Imperviousness Degree (IMD) or Soil Sealing (SL) information can be
produced relatively easily based on the Urban Extent derived from the baseline LULC information
product and the linear model between impervious areas and vegetation presence that can be determined
and characterized from Landsat or Sentinel-2 NDVI time series.
More precisely, the raster product is generated at 10m - 30m spatial resolution by properly exploiting
Landsat-4/5/7/8 or Sentinel-2 multitemporal imagery acquired over the study area within a given time
interval of interest in which no relevant changes are expected to occur (typically a time period of 1-2
years allows to get very accurate results). Each acquired EO data is pre-processed (ortho-rectification,
radiometric calibration, pansharpening, cloud-masking). Then, the Normalized Difference Vegetation
Index (NDVI) is extracted for each image within the urban mask (corresponding to Urban Extent
product). NDVI is inversely correlated with the amount of impervious areas, i.e. the higher the NDVI
is, the higher the expected presence of vegetation, hence the lower the corresponding imperviousness
degree. The core idea is to compute per each pixel its temporal maximum which depicts the status at the
peak of the phenological cycle. It is worth noting that for different pixels in the study area, different
number of scenes might be available.
However, in the hypothesis of sufficient minimum number of acquisitions unavailable for computing
consistent statistics, this does not represent an issue. Indeed, in this framework, it is also possible to get
spatially consistent datasets useful for the desired analyses, even when investigating large territories.
Areas associated with different levels of impervious surfaces are then extracted by visual interpretation
from data sources with higher spatial resolution (e.g. VHR imagery, Google Earth imagery). OSM layers
or information derived from in-situ campaigns are other auxiliary data sources which can also be used
for this purpose. At the end, reference data are extracted in various parts of the study region and then
rasterized and aggregated at the spatial resolution of input EO data.
A support vector regression SVR module is then used for properly correlating the resulting training
information with the temporal maximum NDVI to finally derive the Percentage of Impervious Surface
(PIS) or Imperviousness Degree (IMD) for the entire AOI. Specifically, 8bit integer values from the
raster product range from 0 (no impervious surface in the given pixel) to 100 (completely impervious
surface in the given pixel).
Page 47
Earth Observation for Sustainable
Development Urban Project QA/QC Sheets developed by GAF AG
© 2018 GAF AG All Rights Reserved. Unless otherwise indicated, the templates of these QA/QC pages are copyrighted by GAF AG. No
part of these pages, either text or image may be used for any purpose other than use in the EO4SD-Urban Project. Therefore,
reproduction, modification, storage in a retrieval system or retransmission, in any form or by any means, electronic, mechanical or
otherwise, for reasons other than personal use, is strictly prohibited without prior written permission
Page 7
Summary of Processing Methods
Building Footprints & Change
Building is any structure having a roof supported by columns or walls and intended for the shelter,
housing, or enclosure of any individual, animal, process, equipment, goods, or materials of any kind.
Building footprint are defined as the contour of houses and other manmade buildings as they are
commonly represented in cadastral systems. The product provides information on the spatial
distribution, number and size of building footprints.
The spatial explicit representation of building footprints and their type is derived by visual interpretation
and digitisation of Very High Resolution (VHR) optical imagery. Particular attention is given to the best
possible use of the dynamic range of the datasets and to guarantee the best radiometric homogeneity, in
case of multiple images to be used. Auxiliary information from Open Street Map (OSM), available
cadastral information and aerial images can assist the production process regarding effort and delivery
time. The product is therefore mainly based on VHR images from space borne sensors (1m resolution
or better) and its results are represented as vector data.
Each digitised footprint can be further attributed with user required information to specify the type of
building. Within the scope of EO4SD-Urban service, the use/function of buildings is especially derived
from the LU/LC product at level IV of the ‘1000 – Artificial Surfaces’ Level I class. OSM and any
ancillary data provided by users can be helpful, especially for providing also the building names when
existing.
Change detection: Four important aspects must be considered to monitor building footprint changes
effectively with remote sensing images: (1) detecting that changes have occurred, (2) identifying the
nature of the change, (3) characterising the areal extent of the change and (4) assessing the spatial pattern
of the change.
The change detection is performed by visual comparison of the images from both dates. Changes
detectable from VHR optical imagery are building construction, extension or destruction. Changes
related to the type of buildings require the use of ancillary data such as OSM.
Page 48
Earth Observation for Sustainable
Development Urban Project QA/QC Sheets developed by GAF AG
© 2018 GAF AG All Rights Reserved. Unless otherwise indicated, the templates of these QA/QC pages are copyrighted by GAF AG. No
part of these pages, either text or image may be used for any purpose other than use in the EO4SD-Urban Project. Therefore,
reproduction, modification, storage in a retrieval system or retransmission, in any form or by any means, electronic, mechanical or
otherwise, for reasons other than personal use, is strictly prohibited without prior written permission
Page 8
This page is intentionally left blank!
Page 49
Earth Observation for Sustainable
Development Urban Project QA/QC Sheets developed by GAF AG
© 2018 GAF AG All Rights Reserved. Unless otherwise indicated, the templates of these QA/QC pages are copyrighted by GAF AG. No
part of these pages, either text or image may be used for any purpose other than use in the EO4SD-Urban Project. Therefore,
reproduction, modification, storage in a retrieval system or retransmission, in any form or by any means, electronic, mechanical or
otherwise, for reasons other than personal use, is strictly prohibited without prior written permission
Page 9
Annex 2 – Filled Quality Control Sheets
Quality Control Sheets for the following products are provided in the form of independent
documents:
Urban Land Use / Land Cover
Building Footprints
Page 50
Earth Observation for Sustainable
Development Urban Project QA/QC Sheets developed by GAF AG
© 2018 GAF AG All Rights Reserved. Unless otherwise indicated, the templates of these QA/QC pages are copyrighted by GAF AG. No
part of these pages, either text or image may be used for any purpose other than use in the EO4SD-Urban Project. Therefore,
reproduction, modification, storage in a retrieval system or retransmission, in any form or by any means, electronic, mechanical or
otherwise, for reasons other than personal use, is strictly prohibited without prior written permission
Page 10
This page is intentionally left blank!
Page 51
Earth Observation for Sustainable
Development Urban Project QA/QC Sheets developed by GAF AG
© 2018 GAF AG All Rights Reserved. Unless otherwise indicated, the templates of these QA/QC pages are copyrighted by GAF AG. No
part of these pages, either text or image may be used for any purpose other than use in the EO4SD-Urban Project. Therefore,
reproduction, modification, storage in a retrieval system or retransmission, in any form or by any means, electronic, mechanical or
otherwise, for reasons other than personal use, is strictly prohibited without prior written permission
This page is intentionally left blank!