Eyes Over Puget Sound Up-to-date observations of visible water quality conditions in Puget Sound and the Strait of Juan de Fuca Field log Weather Water column Aerial photos Ferry and Satellite Moorings Publication No. 14-03-074 Surface Conditions Report Start here June 23, 2014
Transcript
Eyes Over Puget Sound
Up-to-date observations of visible water quality conditions in Puget Sound and the Strait of Juan de Fuca
Field log Weather Water column Aerial photos Ferry and Satellite Moorings
Publication No. 14-03-074
Surface Conditions Report
Start here June 23, 2014
GUEST: What’s Blooming in Budd Inlet?
Personal field log p. 4 Meet our marine mooring program with Suzan Pool. Weather conditions p. 6 Onshore winds have been keeping the Puget Sound lowlands cool and cloudy, but sunlight and warmer temperatures returned before the flight. Water column p. 8 In early 2014, colder, saltier conditions developed throughout Puget Sound with lower oxygen in Whidbey Basin, Central and South Sound. Hood Canal remains unusually cold. Moorings p. 38 In the Mukilteo moorings, water masses are distinct, temperature is similar to last year, and salinity and dissolved oxygen are lower than the last few years. Aerial photography p. 11 Large organic mats of surface debris in Hood Canal, Padilla Bay and Lay Inlet. Many patches are macro-algae. Strong red-brown bloom in Discovery Bay and East Sound and parts of Georgia Basin. Sediment rich water north of San Juan Islands. Jelly fish are increasing in numbers. Ferry and satellite p. 36 High-tech hitch-hiking the state ferries. A collaborative effort.
LO
NG
-T
ERM
M
ARIN
E M
ON
ITO
RIN
G U
NIT
Mya Keyzers Laura Hermanson
Joe Leatherman
Skip Albertson
Dr. Christopher Krembs
Carol Maloy
Julia Bos Suzan Pool
www.ecy.wa.gov/programs/eap/mar_wat/eops/ Previous Eyes Over Puget Sound reports:
Marine conditions from 6-23-2014 at a glance Field log Weather Water column Aerial photos Ferry and Satellite Moorings
A Phytoplankton Monitoring Program Field log Weather Water column Aerial photos Ferry and Satellite Moorings
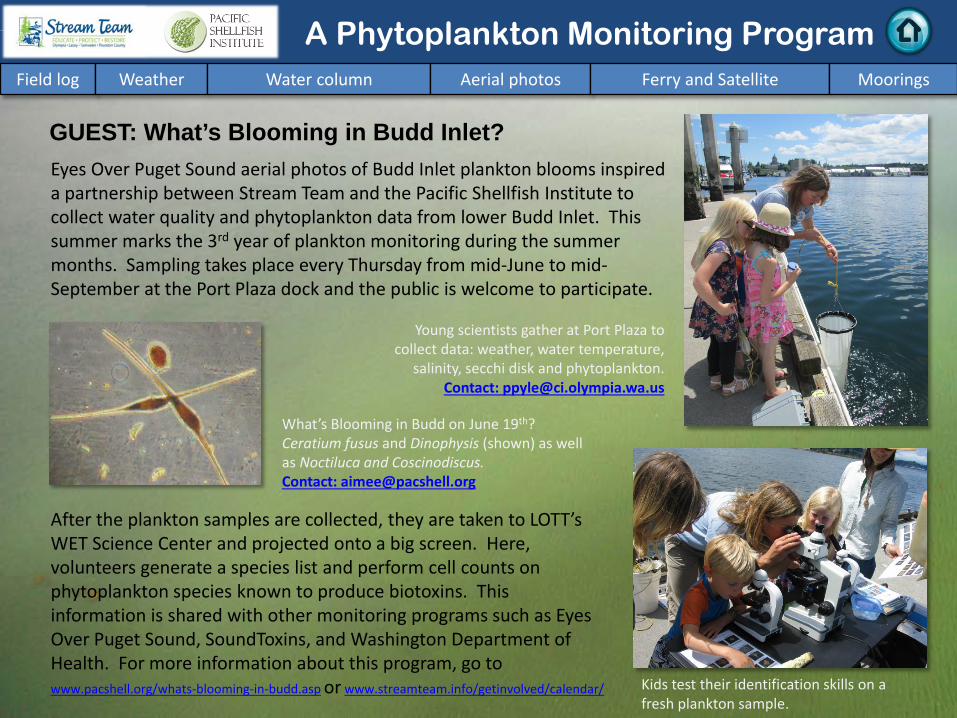
Eyes Over Puget Sound aerial photos of Budd Inlet plankton blooms inspired a partnership between Stream Team and the Pacific Shellfish Institute to collect water quality and phytoplankton data from lower Budd Inlet. This summer marks the 3rd year of plankton monitoring during the summer months. Sampling takes place every Thursday from mid-June to mid-September at the Port Plaza dock and the public is welcome to participate.
GUEST: What’s Blooming in Budd Inlet?
What’s Blooming in Budd on June 19th? Ceratium fusus and Dinophysis (shown) as well as Noctiluca and Coscinodiscus. Contact: [email protected]
Kids test their identification skills on a fresh plankton sample.
After the plankton samples are collected, they are taken to LOTT’s WET Science Center and projected onto a big screen. Here, volunteers generate a species list and perform cell counts on phytoplankton species known to produce biotoxins. This information is shared with other monitoring programs such as Eyes Over Puget Sound, SoundToxins, and Washington Department of Health. For more information about this program, go to www.pacshell.org/whats-blooming-in-budd.asp or www.streamteam.info/getinvolved/calendar/
Young scientists gather at Port Plaza to collect data: weather, water temperature,
Along with our monthly sampling, we deploy moored sensors in Puget Sound. The moorings measure temperature, salinity, and dissolved oxygen at fixed depths around the clock. Data are being analyzed to increase our knowledge and understanding of Puget Sound water circulation and quality.
Personal field impression 6-23-2014
Using moorings to measure marine water quality
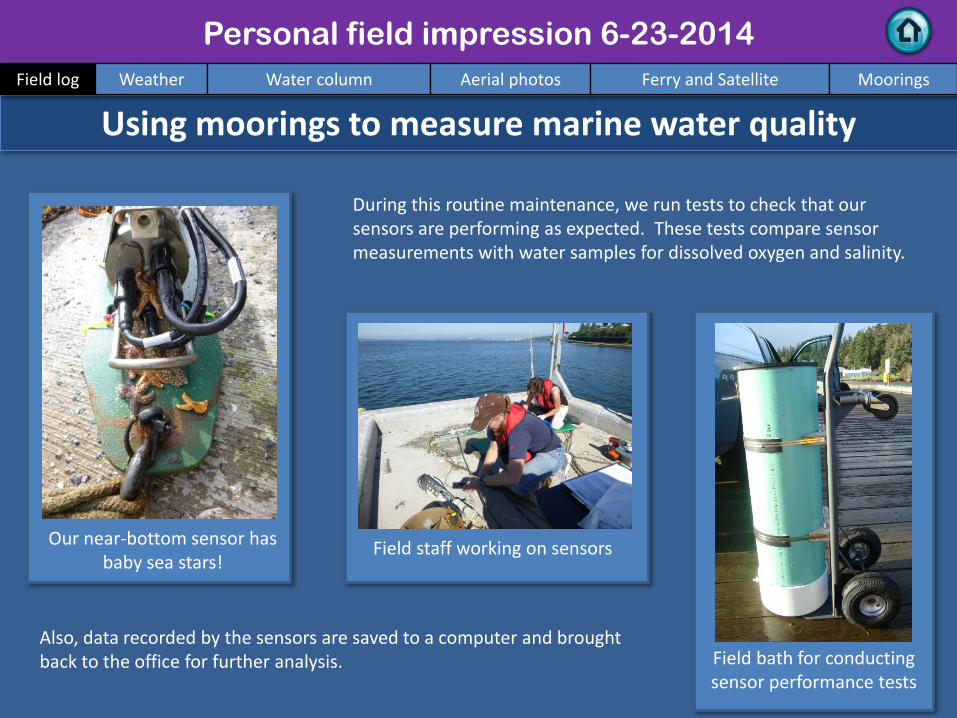
Sensors are typically in the water for up to 6 weeks. During this time, the sensors become mildly to heavily attached with sea critters such as sea stars, barnacles, anemones, nudibranchs, and shrimps. Therefore, we routinely retrieve, clean, test, and re-deploy the sensors.
Near-bottom sensor (left) has little biofouling compared to near-surface
sensor (right) with barnacles. Retrieving the mooring at the Mukilteo station.
Field log Weather Water column Aerial photos Ferry and Satellite Moorings
Also, data recorded by the sensors are saved to a computer and brought back to the office for further analysis.
Personal field impression 6-23-2014
Using moorings to measure marine water quality
Our near-bottom sensor has baby sea stars!
Field bath for conducting sensor performance tests
During this routine maintenance, we run tests to check that our sensors are performing as expected. These tests compare sensor measurements with water samples for dissolved oxygen and salinity.
Field staff working on sensors
Field log Weather Water column Aerial photos Ferry and Satellite Moorings
Field log Weather Water column Aerial photos Ferry and Satellite Moorings
Weather of the past two weeks before 6-23-2014
Meteorological conditions typically explain up to half of the variance in observed marine variables (Moore et al. 2008), particularly in shallower waters like those of south Puget Sound. I summarized the specific conditions prevalent during the past two weeks, from north to south. Source: http://www-k12.atmos.washington.edu/k12/grayskies/nw_weather.html
Moore et al. 2008. Local and large-scale climate forcing of Puget Sound oceanographic properties on seasonal to interdecadal timescales. Limnol. Oceanogr., 53(5), 1746–1758 Moore et al. 2008. Local and large-scale climate forcing of Puget Sound oceanographic properties on seasonal to interdecadal timescales. Limnol. Oceanogr., 53(5), 1746–1758
Higher than expected Lower than expected
Two week summary: Air temperatures. The air was warm on the day of the flight, but had been slightly below average during the previous week and higher than normal two weeks prior. Sunshine levels have increased during the past two days, but were generally low for the past week prior to that. River flows have been above normal. Winds have primarily been from the south up until the day of the flight.
We use a chartered float plane to access our monthly monitoring stations most cost effectively. We communicate data and environmental marine conditions using: 1. Marine Water
Condition Index (MWCI)
2. Eyes Over Puget Sound (EOPS)
3. Anomalies and source data
Field log Weather Water column Aerial photos Ferry and Satellite Moorings
Our long-term marine monitoring stations in Washington
Physical conditions tracked in statistically historic context
March 2014: Temperature expected Salinity decreasing Oxygen expected
The 2012 colder, fresher, higher oxygen conditions are gone. In 2013, Puget Sound was warmer, with normal salinity. Lower oxygen conditions appeared in the northern areas early in the year. In early 2014, colder, saltier conditions developed throughout Puget Sound with lower oxygen in Whidbey Basin, Central and South Sound. Hood Canal remains unusually cold.
Field log Weather Water column Aerial photos Ferry and Satellite Moorings
a) Pacific Decadal Oscillation Index (PDO, temperature) (explanation) b) Upwelling Index (anomalies) (Upwelling, low oxygen) (explanation) c) North Pacific Gyre Oscillation Index (NPGO, productivity) (explanation)
NPG
O (x10)
PDO
/Upw
ellin
g In
dex
Three-year running average of PDO, Upwelling, and NPGO indices scores
Ocean boundary conditions have been favorable for water quality in Puget Sound: (a) colder water (PDO), (b) less upwelled low oxygen and high nutrient ocean water reaching Puget Sound (Upwelling Index), and (c) higher surface productivity along the coast (NPGO). Where are we heading next?
Field log Weather Water column Aerial photos Ferry and Satellite Moorings
.
The ocean affects water quality: Ocean Climate Indices
Large organic mats of surface debris in Hood Canal, Padilla Bay and Lay Inlet. Many patches are macro-algae. Strong red-brown bloom in Discovery Bay and East Sound and parts of Georgia Basin. Sediment rich water north of the San Juan Islands. Jelly fish are increasing in numbers.
Field log Weather Water column Aerial photos Ferry and Satellite Moorings
Start here Mixing and Fronts: Fronts in the Straits, along Frazer river plume and Rosario Strait. Hood Canal and Central Sound with smaller tidal fronts.
Debris: Very abundant in Padilla Bay and Hood Canal and Georgia Basin. Smaller surface debris from remnant Noctiluca bloom in bays of Bainbridge Island and around Blake Island.
Visible blooms: Green-brown: Central Sound near Bainbridge Is., Carr Inlet and Saratoga Passage. Red-brown: Discovery Bay, East Sound, Utsalady Bay. Green: Fidalgo Bay. Green macro-algae: Padilla Bay, Hood Canal, Sinclair Inlet.
Jellyfish: Jellyfish patches increasing in Budd, Eld Inlets and Hood Canal.
Bloo
m
Debr
is Fr
ont
Suspended sediment: Large sediment in Frazer River plume. Port Susan decreasing sediment near surface. Pl
ume
Localized bloom, Horsehead Bay, Carr Inlet
Oil sheen in Cascade Bay, East Sound
1
7 8
Boat
Boat
2 3 5 6 7 8 9 10 14
11
4 5 6 10 12 13 14 20 19 18
1 2 3 4 5 6 7 8 9 10 12 13 14 15 16
20
19
18
Sheen
Bloo
m
Strait of Juan de Fuca
San Juan Islands Padilla Bay
Main Basin
Hood Canal
South Sound
Field log Weather Water column Aerial photos Ferry and Satellite Moorings
Observation Maps:
Afternoon flight, photos 12-20: Haze, strong winds and swell
Flight Information:
Morning flight, photos 1-11 Clouds and cloud reflections
8
16
19
11 10
9
2
13 14
15
17
Aerial photography and navigation guide
18
20
1
6
Central and North Sound
Hood Canal and South Sound
Seat
tle T
ides
: H.
tide
: 1:
52 A
M 4
:32
PM, ,
L. t
ide:
9:0
5 A
M,9
:22
PM
4
7
3
12
Whidbey Basin
5
Flight route
Large patch of organic surface debris, multiple jellyfish patches, and cloud reflections. Location: Eld Inlet (South Sound), 9:19 AM.
1 Aerial photography 6-23-2014 Navigate
Field log Weather Water column Aerial photos Ferry and Satellite Moorings
Debr
is
Jellyfish Jellyfish
2 Navigate Aerial photography 6-23-2014 Field log Weather Water column Aerial photos Ferry and Satellite Moorings
Multiple debris lines and patches accumulating along front . Location: Dewatto Bay, Hood Canal, 9:31 AM.
Boat
Debr
is
Debr
is
3 Navigate Aerial photography 6-23-2014
Debris lines of organic material accumulating along front. Location: Across Jackson Cove, Dabob Bay (Hood Canal), 9:42 AM.
Field log Weather Water column Aerial photos Ferry and Satellite Moorings
Debr
is
4 Navigate
Field log Weather Water column Aerial photos Ferry and Satellite Moorings
Aerial photography 6-23-2014
Red-brown bloom and line of organic debris. Location: Discovery Bay, (Strait of Juan de Fuca), 9:52 AM.
Bloo
m
Bloo
m
Debr
is
5 Navigate Aerial photography 6-23-2014 Field log Weather Water column Aerial photos Ferry and Satellite Moorings
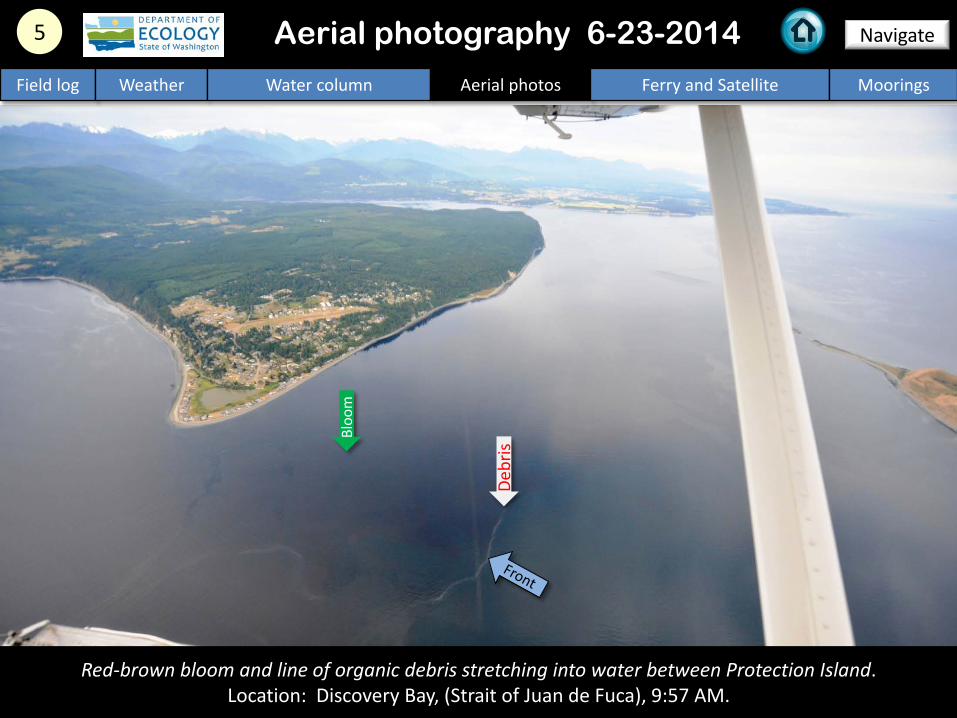
Red-brown bloom and line of organic debris stretching into water between Protection Island. Location: Discovery Bay, (Strait of Juan de Fuca), 9:57 AM.
Bloo
m
Debr
is
A ribbon of water with a red brown bloom lined with organic debris heading east parallel to Anacortes ferry track. Location: Lopez Sound, (San Juan Islands), 10:14 AM.
6 Navigate Aerial photography 6-23-2014 Field log Weather Water column Aerial photos Ferry and Satellite Moorings
Ferry
Bloo
m
Bloo
m
Debr
is
Ribbons of sediment-rich water and debris lines from Frazer River melt water. Location: North of Patos Island (Georgia Basin), 10:26 AM.
7 Navigate Aerial photography 6-23-2014 Field log Weather Water column Aerial photos Ferry and Satellite Moorings
Plum
e
Boat
Debr
is
Fron
t
Ribbons of sediment-rich water and debris lines from Frazer River melt water flowing southward. Location: North of Patos Island (Georgia Basin), 10:26 AM.
8 Navigate Aerial photography 6-23-2014 Field log Weather Water column Aerial photos Ferry and Satellite Moorings
Plum
e
Debr
is
Bands of large internal waves interacting with the water surface to form patterns. Location: North of Rosario Strait (Georgia Basin), 11:18 AM.
9 Navigate Aerial photography 6-23-2014 Field log Weather Water column Aerial photos Ferry and Satellite Moorings
Debr
is
Internal waves
10 Navigate Aerial photography 6-23-2014
Lines of organic surface debris gathering along fronts. Location: Near Lummi Bay (Georgia Strait), 11:19 AM.
Field log Weather Water column Aerial photos Ferry and Satellite Moorings
Tug
Bloo
m
Debr
is
11 Navigate Aerial photography 6-23-2014
Sediment rich water of the Nooksack flowing into Bay. Location: Portage Bay (Bellingham Bay), 11:58 AM
Field log Weather Water column Aerial photos Ferry and Satellite Moorings
Boat
Plum
e
Mats of organic material from macro-algae and intense green phytoplankton bloom stain water . Location: Fidalgo Bay (North Sound), 12:44 PM
12 Navigate
Field log Weather Water column Aerial photos Ferry and Satellite Moorings
Aerial photography 6-23-2014
Bloo
m
Debr
is
Debr
is
Long lines of organic surface debris and water of different color leaving Padilla Bay via Guemes Channnel . Location: Anacortes (North Sound), 12:45 PM.
13 Navigate
Field log Weather Water column Aerial photos Ferry and Satellite Moorings
Aerial photography 6-23-2014
Boat
Bloo
m
Bloo
m
Debr
is Debr
is
Long lines of organic surface debris and water of different color leaving Padilla Bay via Guemes Channnel . Location: Anacortes (North Sound), 12:45 PM.
14 Navigate
Field log Weather Water column Aerial photos Ferry and Satellite Moorings
Aerial photography 6-23-2014
Bloo
m
Debr
is
Debr
is
Front
15 Navigate
Field log Weather Water column Aerial photos Ferry and Satellite Moorings
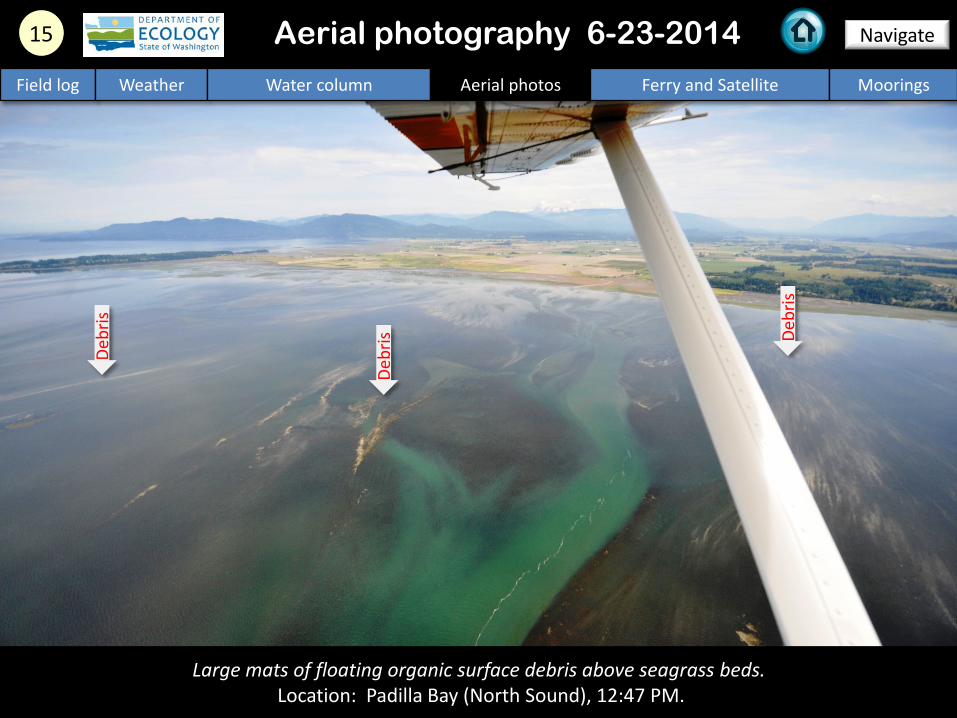
Large mats of floating organic surface debris above seagrass beds. Location: Padilla Bay (North Sound), 12:47 PM.
Aerial photography 6-23-2014
Debr
is
Debr
is
Debr
is
16 Navigate
Field log Weather Water column Aerial photos Ferry and Satellite Moorings
Large mats of decaying organic surface debris above seagrass beds. Location: Padilla Bay (North Sound), 12:47 PM.
Aerial photography 6-23-2014
Debr
is
17 Navigate
Field log Weather Water column Aerial photos Ferry and Satellite Moorings
Thick mats of macro-algae competing with seagrass for space near Indian Slough estuary. Location: Padilla Bay (North Sound), 12:48 PM.
Aerial photography 6-23-2014
Suspended sediment
18 Navigate
Field log Weather Water column Aerial photos Ferry and Satellite Moorings
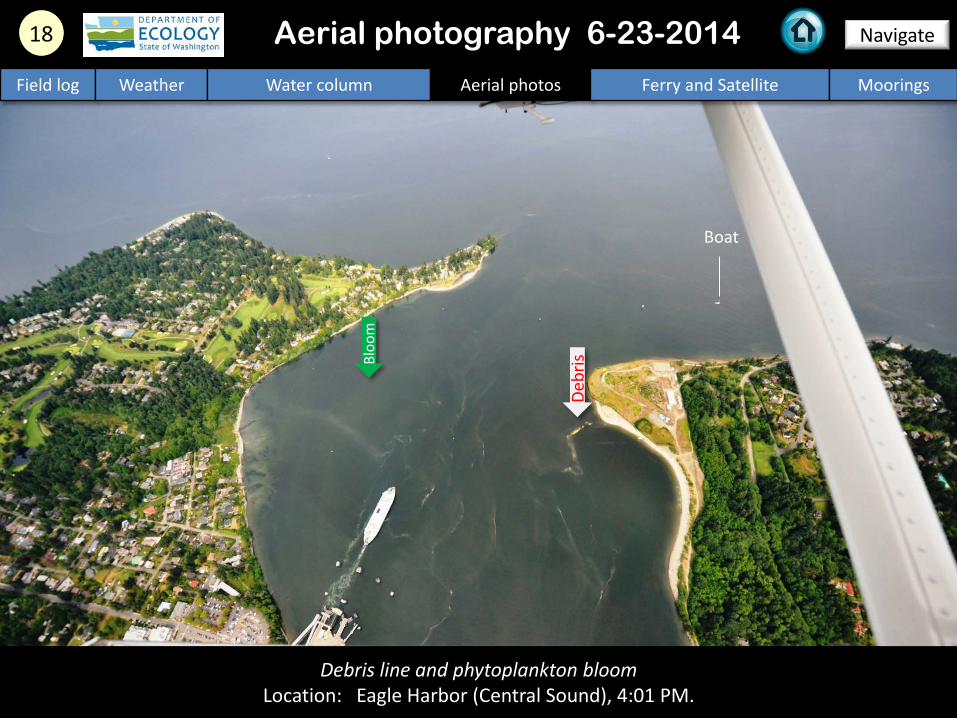
Debris line and phytoplankton bloom Location: Eagle Harbor (Central Sound), 4:01 PM.
Aerial photography 6-23-2014
Boat
Bloo
m
Debr
is
19 Navigate
Field log Weather Water column Aerial photos Ferry and Satellite Moorings
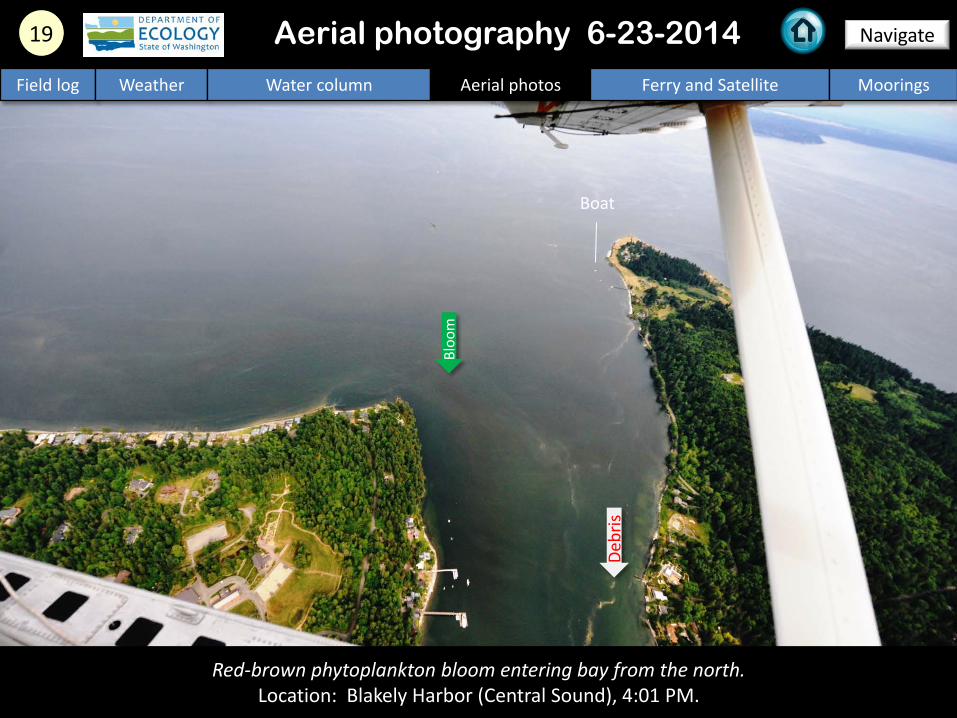
Red-brown phytoplankton bloom entering bay from the north. Location: Blakely Harbor (Central Sound), 4:01 PM.
Aerial photography 6-23-2014
Bloo
m
Boat
Debr
is
20 Navigate
Field log Weather Water column Aerial photos Ferry and Satellite Moorings
Large mats of organic surface debris from macroalgae and bloom. Location: Lay Inlet (Carr Inlet), 4:14 PM.
Aerial photography 6-23-2014
Bloo
m
Boat
Bloo
m
Debr
is
North Sound/San Juans
Numbers on map refer to picture numbers for spatial reference
Date: 6-23-2014 Central Sound
Aerial photography observations in Central Sound Observations in Central and North Sound Navigate
Field log Weather Water column Aerial photos Ferry and Satellite Moorings
12 13
6
14
15
16
17
10
9
8 7
4
11
5
19
18
South Sound Hood Canal
Date: 6-23-2014
Observations in Hood Canal and South Sound
Numbers on map refer to picture numbers for spatial reference
Navigate
Field log Weather Water column Aerial photos Ferry and Satellite Moorings
1
20
2
3
Legend to map annotations
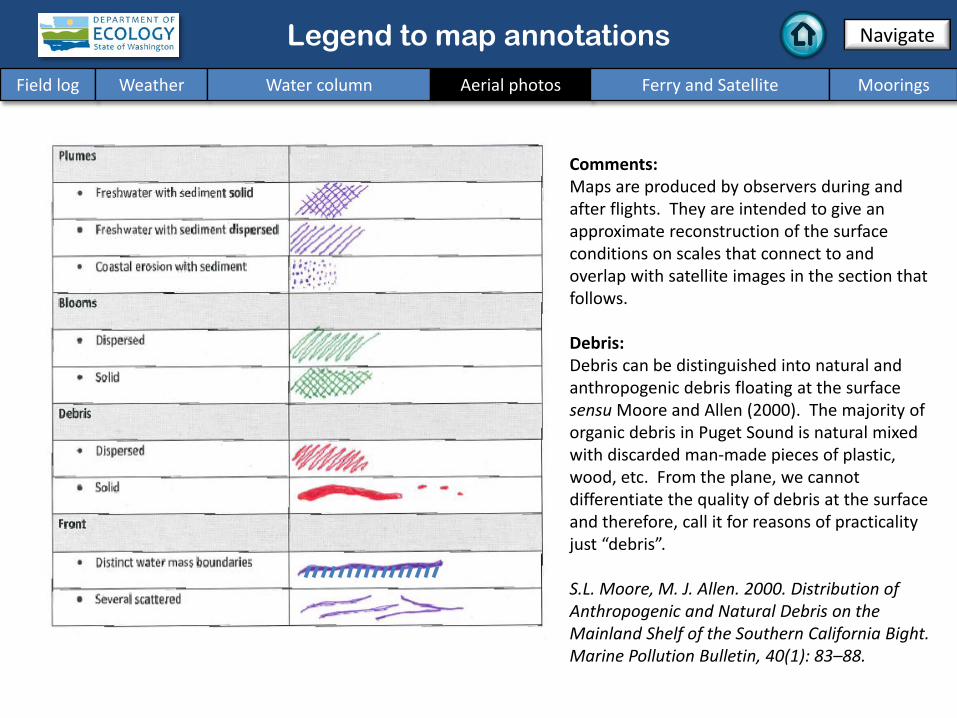
Comments: Maps are produced by observers during and after flights. They are intended to give an approximate reconstruction of the surface conditions on scales that connect to and overlap with satellite images in the section that follows. Debris: Debris can be distinguished into natural and anthropogenic debris floating at the surface sensu Moore and Allen (2000). The majority of organic debris in Puget Sound is natural mixed with discarded man-made pieces of plastic, wood, etc. From the plane, we cannot differentiate the quality of debris at the surface and therefore, call it for reasons of practicality just “debris”. S.L. Moore, M. J. Allen. 2000. Distribution of Anthropogenic and Natural Debris on the Mainland Shelf of the Southern California Bight. Marine Pollution Bulletin, 40(1): 83–88.
Navigate
Field log Weather Water column Aerial photos Ferry and Satellite Moorings
Field log Weather Water column Aerial photos Ferry and Satellite Moorings
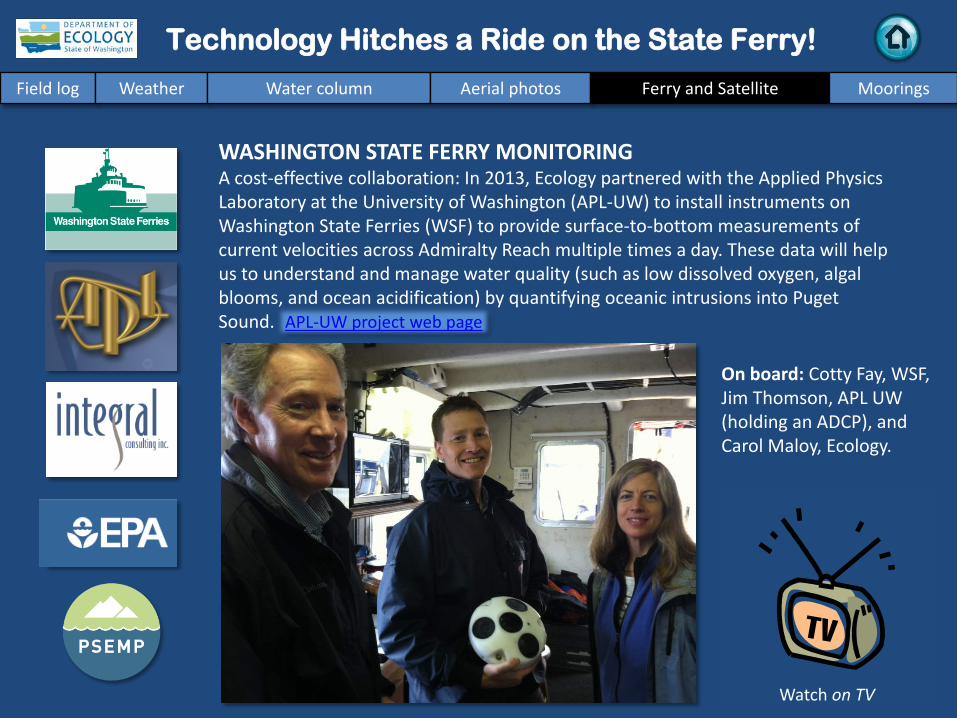
Technology Hitches a Ride on the State Ferry!
WASHINGTON STATE FERRY MONITORING A cost-effective collaboration: In 2013, Ecology partnered with the Applied Physics Laboratory at the University of Washington (APL-UW) to install instruments on Washington State Ferries (WSF) to provide surface-to-bottom measurements of current velocities across Admiralty Reach multiple times a day. These data will help us to understand and manage water quality (such as low dissolved oxygen, algal blooms, and ocean acidification) by quantifying oceanic intrusions into Puget Sound.
On board: Cotty Fay, WSF, Jim Thomson, APL UW (holding an ADCP), and Carol Maloy, Ecology.
Field log Weather Water column Aerial photos Ferry and Satellite Moorings
Technology Hitches a Ride on the State Ferry!
Read more on Ecology’s Blog
Working across agencies and institutions: People on the ferry monitoring team from Ecology, WSF, Applied Physics Lab UW, Integral Consulting, and the Puget Sound Partnership.
A sensor called an Acoustic Doppler Current Profilers, or ADCP, was installed on the hull of
the Salish in May. ADCPs send sound waves (pings) down through the water column
beneath the ferry as it is under way. The time it takes for the echoes to return to the
ADCP is used to calculate the speed and direction (velocity) of the water
flowing under the ferry.
Admiralty Reach is where water exchange (intrusions of ocean water) occurs between the Strait of Juan de Fuca and Puget Sound.
At our Mukilteo moorings, we observed multiple water masses based on temperature, salinity, and dissolved oxygen. The near-surface sensor (2-6 m) most often measured salinity at 22-28 psu. The near-bottom sensor (12-16 m) measured two water masses, mainly around 28 psu at 11 °C. Dissolved oxygen was mostly between 4 and 5 mg/l.
Mooring observations and trends 6-10-2014 to 6-23-2014
Left Panels: Density is defined by salinity and temperature. Probability of finding a specific density over the past two-week period. High probability shown in warm colors. Right Panel: Dissolved oxygen concentration in relation to salinity. High probability shown in warm colors.
12-16 m depth
Dissolved oxygen not measured
2-6 m depth
Field log Weather Water column Aerial photos Ferry and Satellite Moorings
Mooring observations and trends 5-24-2014 to 6-23-2014
Our mooring station in Mukilteo is located in Whidbey Basin and near Everett. We present data of daily means for the past 31 days. Daily means of temperature and salinity fluctuated in late May and mid-June and this trend seems to correspond with shifting winds. In the middle of the 31-day period, increasing tidal range and decreasing river flows seem to have slightly influenced increasing salinity and decreasing temperature.
Click on icon to view real-time data of the moorings
Data are plotted in Pacific Standard Time. Wind data are from Paine Field in Everett. River flow data are from USGS.
Field log Weather Water column Aerial photos Ferry and Satellite Moorings
Mooring observations and trends Mukilteo 2010 to 2014
At the Mukilteo mooring, we use the near-bottom sensor (12- 16 m deep) to measure significant inter-annual variability in temperature, salinity and dissolved oxygen. Inter-annual variability is shown over a 4.5-year period. All three variables show strong seasonality. For 2014, trends in salinity and dissolved oxygen appear to decline whereas trends in temperature are similar to 2013. Sensor issues and biofouling have a potential effect on the lower salinity and dissolved oxygen measurements earlier this year.
Please note that data are provisional. Data are in GMT.
Field log Weather Water column Aerial photos Ferry and Satellite Moorings
You may subscribe or unsubscribe to the Eyes Over Puget Sound email listserv by going to: http://listserv.wa.gov/cgi-bin/wa?A0=ECOLOGY-EYES-OVER-PUGET-SOUND
Many thanks to our business partners: Clipper Navigation, Swantown Marina, and Kenmore Air.
We are looking for feedback to improve our products.