EPA Climate Change Regulation Joseph A. Siegel US EPA Region 2 Conference on Carbon Politics and Finance October 29, 2010 Fordham Graduate School of Business Center for Research in Contemporary Finance New York, New York
Transcript
EPA Climate Change Regulation Joseph A. Siegel
US EPA Region 2
Conference on Carbon Politics and Finance
October 29, 2010Fordham Graduate School of Business
Center for Research in Contemporary FinanceNew York, New York
Administrator Lisa Jackson Sept. 14, 2010
Remarks on the 40th Anniversary of the Clean Air Act
“The Clean Air Act does not require EPA to act in a reckless and irresponsible manner. We will proceed carefully through [a] series of sensible steps…. I am outlining today five principles that will inform all of our clean air efforts in the months and years ahead. These are the guiding points that will help us confront everything from lingering challenges like smog and mercury, to new challenges like greenhouse gases.”
– EPA/NHTSA Final GHG Rule for Light Duty Vehicles
• April 1, 2010
– EPA NHTSA Proposed Heavy Duty Vehicle Rule
• Oct. 25, 2010
– Final Renewable Fuel Standards
• March 26, 2010
– California Waiver Granted• June 30, 2009
• Stationary Sources– Final CAA Tailoring Rule
• May 13, 2010
– Johnson Memo Reconsideration – Final Action March 29, 2010
– Final GHG Reporting Rule• Published 10/30/09
– Proposed Waste Energy Recovery Registry
• July 2009
Final Endangerment Finding
• 2 Findings:– Endangerment Finding: The mix of 6 Key GHGs threaten the
public health and welfare of current and future generations• CO2, CH4, N2O, HFCs, PFCs, SF6
– Cause or Contribute Finding: Combination of 4 GHGs from new motor vehicles and engines contribute to atmospheric concentrations of these GHGs and therefore are a threat
• Co2, CH4, N2O, and HFCs• Sector contributes 4% of global GHG and 23% of US GHG
EPA/NHTSA Final Light Duty Rule
• Covers MY 2012 -2016– Will reach 35.5 mpg by 2016 instead of 2020 under
EISA; Standard of 250 g CO2/mile• Large pickup trucks: 25 mpg
• Compact cars: 41 mpg
Stationary Source Control For GHGs
• March 29, 2010 Final Action– Administrator Jackson announced that regulation begins in 2011– “Johnson Memo Reconsideration”
GHG Tailoring Rule
2011 2012 2013 2014 2015
• Step 1: Source already subject to PSD “anyway” (tpy CO2e) New source: NA Modification: 75,000
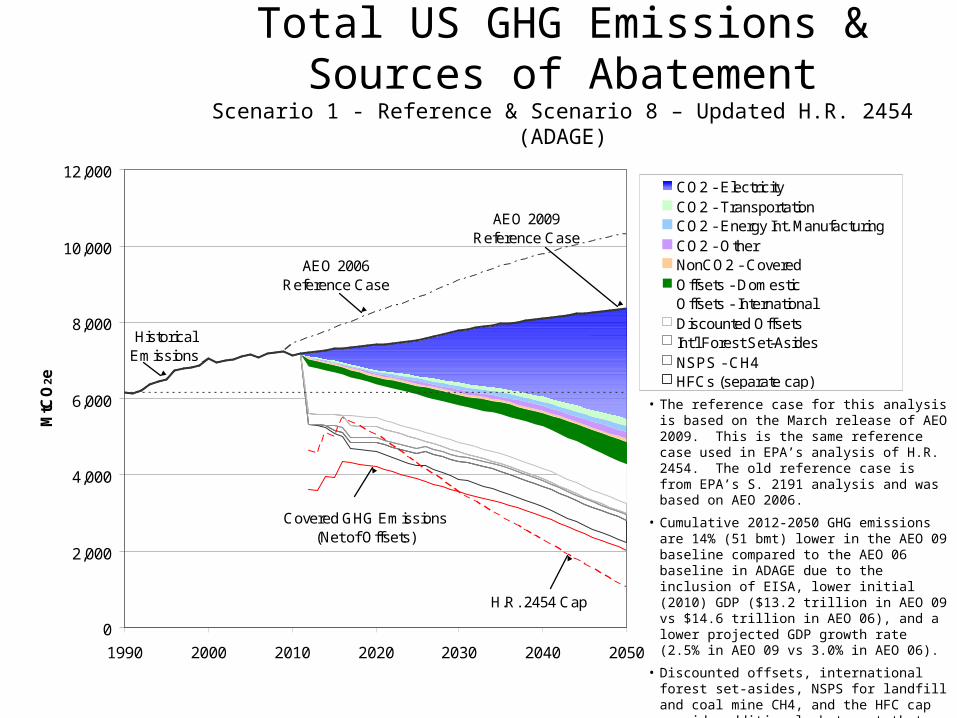
• The reference case for this analysis is based on the March release of AEO 2009. This is the same reference case used in EPA’s analysis of H.R. 2454. The old reference case is from EPA’s S. 2191 analysis and was based on AEO 2006.
• Cumulative 2012-2050 GHG emissions are 14% (51 bmt) lower in the AEO 09 baseline compared to the AEO 06 baseline in ADAGE due to the inclusion of EISA, lower initial (2010) GDP ($13.2 trillion in AEO 09 vs $14.6 trillion in AEO 06), and a lower projected GDP growth rate (2.5% in AEO 09 vs 3.0% in AEO 06).
• Discounted offsets, international forest set-asides, NSPS for landfill and coal mine CH4, and the HFC cap provide additional abatement that does not help to meet the main cap.
• The average annual cost of the APA per household is the 2010 through 2050 average of the net present value of the per household consumption loss in “scenario 2 – APA.”
• The net present value of the per household consumption loss is the cost in a particular year discounted back to today.
• The costs above include the effects of higher energy prices, price changes for other goods and services, impacts on wages and returns to capital, and importantly, the the value of emissions allowances returned lump sum to households, which offsets much of the APA’s effect on household consumption. The cost does not include the impacts on leisure.
• This analysis is a cost-effectiveness analysis, not a cost-benefit analysis. As such, the benefits of reducing GHG emissions were not determined in this analysis.
• The $79 - $146 average annual cost per household is the annual cost of achieving the emissions reductions and resulting climate benefits associated with this bill.
• Across all scenarios, the highest average annual NPV cost per household is $350 in ADAGE scenario 7, requested by Senator Voinovich, without international offsets and restricted nuclear, bioelectricity and CCS.
• See Appendix 1 for a discussion of consumption accounting differences between ADAGE and IGEM and of composition of GDP.
• See Appendix 5 for a more detailed discussion of the average annual NPV cost per household calculation, and additional consumption cost metrics.
ConsumptionScenario 1 – Reference & Scenario 2 - APA


![FORDHAM #3 of 3; Fordham v Hobson (Dewsash) (Home.B) [2013] NSWCTTT 590](https://static.documents.pub/doc/80x56/55cf29a9bb61ebb2668b4659/fordham-3-of-3-fordham-v-hobson-dewsash-homeb-2013-nswcttt-590.jpg)


