123
EPA/ROD/R09-03/019 2003 EPA Superfund Record of Decision: DEL MONTE CORP. (OAHU PLANTATION) EPA ID: HID980637631 OU 01 KUNIA, HI 09/25/2003
EPA/ROD/R09-03/0192003
EPA Superfund
Record of Decision:
DEL MONTE CORP. (OAHU PLANTATION)EPA ID: HID980637631OU 01KUNIA, HI09/25/2003
RECORD OF DECISION
DEL MONTE CORPORATIONOAHU PLANTATIONSUPERFUND SITE
KUNIA, HAWAII
September 2003
United States Environmental Protection AgencyRegion IX - San Francisco, California

Contents
Part l - Declaration....................................................................... I-1l.1 Site Name and Location ......................................................... I-l1.2 Statement of Basis and Purpose ................................................. I-11.3 Assessment of the Site ......................................................... I-11.4 Description of the Selected Remedy ............................................. I-11.5 Statutory Determinations ....................................................... I-21.6 ROD Data Certification Checklist................................................ I-3
Part II - Decision Summary ............................................................. II-1-2
1 Site Name, Location and Description ............................................. II-1-2
2 Site History and Enforcement Activities.......................................... II-2-12.1 Site History................................................................. II-2-12.2 Remedial Investigation Activities ........................................... II-2-22.3 Enforcement Activities ...................................................... II-2-3
3 Community Participation ......................................................... II-3-1
4 Scope and Role of Response Action ............................................... II-4-1
5 Site Characteristics ............................................................ II-5-15.1 Location and Setting......................................................... II-5-1
5.1.1 Meteorology......................................................... II-5-25.1.2 Surface Water ...................................................... II-5-3
5.2 Geology ..................................................................... II-5-35.3 Hydrogeology ................................................................ II-5-4
5.3.1 Conceptual Hydrogeologic Model ..................................... II-5-55.4 Summary of RI Data Collection Activities .................................... II-5-7
5.4.1 Kunia Village Area Soil Sampling ................................... II-5-85.4.2 Kunia Village Area Surface Water and Sediment Sampling ............. II-5-85.4.3 Kunia Village Area Perched Groundwater Sampling .................... II-5-95.4.4 Basal Aquifer Investigation ........................................ II-5-105.4.5 Other Potential Source Areas........................................ II-5-10
5.5 Nature and Extent of Contamination........................................... II-5-135.6 Contaminant Fate and Transport............................................... II-5-15
6 Current and Potential Future Site and Resource Uses .............................. II-6-16.1 Land Uses..................................................................... II-6-16.2 Groundwater Uses.............................................................. II-6-1
7 Summary of Site Risks ............................................................ II-7-17.1 Summary of Human Health Risk Assessment....................................... II-7-1
7.1.1 Identification of Chemicals of Concern .............................. II-7-17.1.2 Exposure Assessment.................................................. II-7-27.1.3 Toxicity Assessment ................................................. II-7-3 7.1.4 Risk Characterization................................................ II-7-4
7.2 Summary of Ecological Risk Assessment ........................................ II-7-77.3 Conclusion ................................................................... II-7-7
8 Remediation Objectives ........................................................... II-8-1
9 Description of Alternatives ...................................................... II-9-19.1 Perched Aquifer Alternatives ................................................. II-9-1
9.1.1 Alternative Pl - No Action........................................... II-9-19.1.2 Alternative P2 - Groundwater Extraction and Treatment with Capping .. II-9-19.1.3 Alternative P3 - Groundwater Extraction and Treatment with Capping and Soil Vapor Extraction............................................ II-9-5
9.2 Basal Aquifer Alternatives ................................................... II-9-79.2.1 Alternative Bl - No Action .......................................... II-9-7
9.2.2 Alternative B2 - Groundwater Extraction and Treatment in the Source Area with an Option for Monitored Natural Attenuation in the
Downgradient Plume.................................................... II-9-89.2.3 Alternative B3 – Groundwater Extraction and Treatment in the Source Area and the Downgradient Plume .................................... II-9-12
10 Comparative Analysis of Alternatives ........................................... II-10-1l0.1 Overall Protection of Human Health and the Environment...................... U-10-210.2 Compliance with ARARs ..................................................... II-10-310.3 Long-Term Effectiveness ................................................... II-10-3l0.4 Reduction of Toxicity, Mobility, and Volume Through Treatment.............. II-10-410.5 Short-Term Effectiveness .................................................. II-10-510.6 Implementability........................................................... II-10-610.7 Cost....................................................................... II-10-810.8 State Acceptance........................................................... II-10-910.9 Community Acceptance ...................................................... II-10-9
11 Selected Remedy ................................................................ II-11-11l.l Description of the Selected Remedy ........................................ II-11-2
11.1.1 Perched Aquifer Remedy............................................ II-11-211.1.2 Basal Aquifer Remedy.............................................. II-11-7
11.2 Summary of Estimated Costs ...........,.................................... II-11-1211.3 Expected Outcomes of the Selected Remedy .................................. II-11-13
12 Applicable or Relevant and Appropriate Requirements (ARARs)...................... II-12-112.1 Chemical-Specific ARARs .................................................... II-12-2
l2.1.1 Chemical-Specific ARARs – Perched Aquifer.......................... II-l2-212.l.2 Chemical-Specific ARARs - Basal Aquifer............................ II-12-312.1.3 Chemical-Specific ARARs - Soils and Other Solids .................. II-12-4I2.1.4 Chemical-Specific ARARs – Air ..................................... II-12-412.1.5 Chemical-Specific ARARs - Surface Aquifer.......................... II-12-5
12.2 Location-specific ARARs .................................................... II-12-5 12.3 Action-specific ARARs ...................................................... II-12-5
12.3.1 Action-Specific ARARs – Perched Aquifer ........................... II-12-612.3.2 Action-Specific ARARs – Basal Aquifer ............................. II-12-6
l2.4 ARARs Waivers .............................................................. II-12-7
13 Statutory Determinations......................................................... II-13-113.1 Protection of Human Health and the Environment ............................. II-13-113.2 Compliance with ARARs ...................................................... II-13-113.3 Cost-Effectiveness ......................................................... II-13-113.4 Utilization of Permanent Solutions and Alternative Treatment Technologies
to the MaximumExtent Practicable ............................................ II-13-213.5 Preference for Treatment as a Principal Element ............................ II-13-213.6 Five-Year Reviews .......................................................... II-13-2
l4 Documentation of Significant Changes ............................................ II-14-1
Part III - Responsiveness Summary ..................................................... III-1-1
1 Responses to Written Comments................................................... III-1-11.1 Responses to Gomments from Mr. Roy Arno, Coromunity Member ................. III-1-1
2 Responses to Oral Comments ..................................................... III-2-12.1 Responses to Comments from Mr. Henry Curtis, Life of the Land............... III-2-12.2 Responses to Comments from Ms. Audrey Hyrne, Community Member............... III-2-22.3 Responses to Comments from Mr. Marcus Oshiro, Hawaii State House of
Representatives, District 39................................................. III-2-32.4 Responses to Comments from Ms. Kat Brady, Life of the Land.................. III-2-42.5 Responses to Comments from Ms. Kathy Masunaga, Community Member............. III-2-5
References ........................................................................... R-1

Tables
l Compounds Detected in Vadose Zone Soil Samples Collected in the Kunia Village Area2a Treatability Study Borehole Sail Sampling Results2b Analytical Results from Soil Samples Collected During Perched Well Drilling3 Monitoring Well and Extraction Well Perched Water Sampling Results4 Compounds Detected in Kunia Village Area Basal Gzoundwater Wells5 Regional Basal Groundwater Wells Analytical Results6 Region Well Sampling Results Conducted by Hawaii Bepartment of Health7 Summary of Chemicals of Concern and Exposure Point Concentrations8 Cancer Toxicity Data Summary9 Non-Cancer Toxicity Data Summary10 Risk Characterization Summary - Carcinogenic and Noncarcinogenic1la Summary of Remediation Alternative Evaluation for the Perched Aquifer11b Summary of Remediation Alternative Evaluation for the Basal Aquifer12 Summary of Estimated Alternative Costs13 Chemical-Specific Cleanup Standards for Chemicals of Concern14 Detailed Cost Estimate Range for the Selected Remedy15 Chemical-Specific ARARs for Selected Remedy16 Action-Specific ARARs for Selected Remedy
Figures
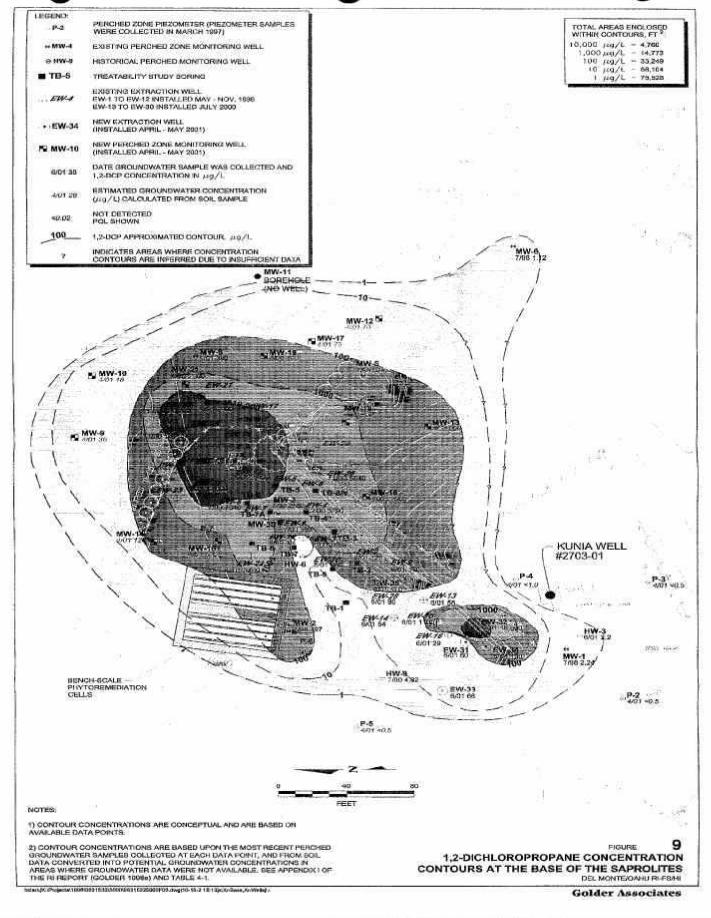
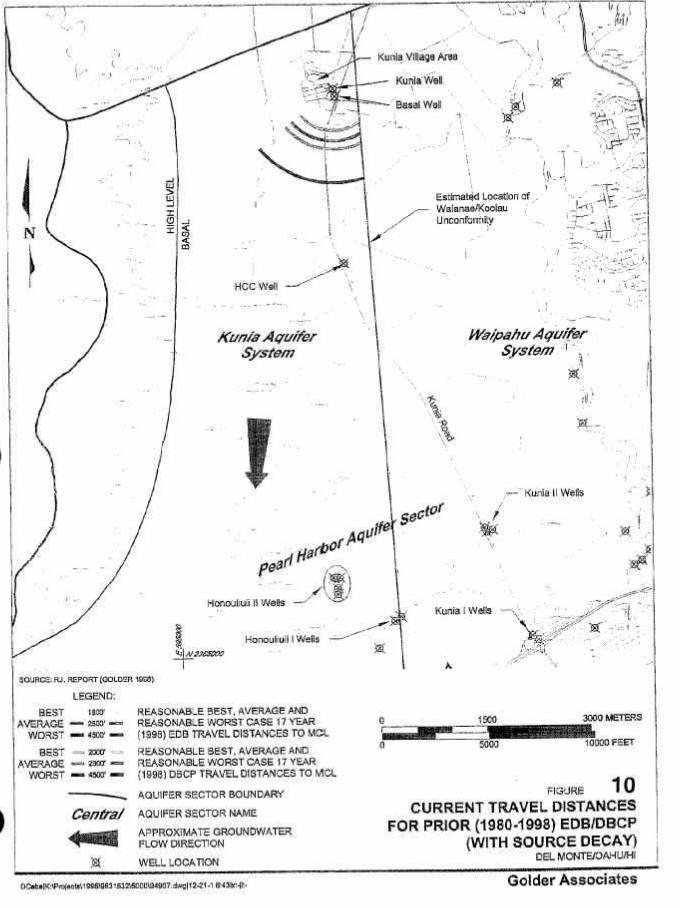
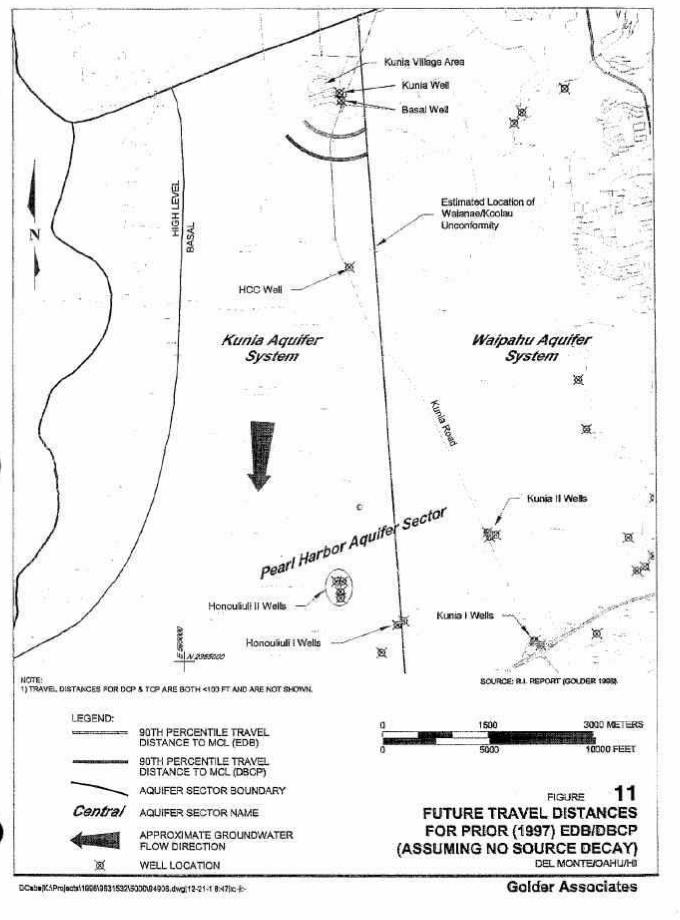
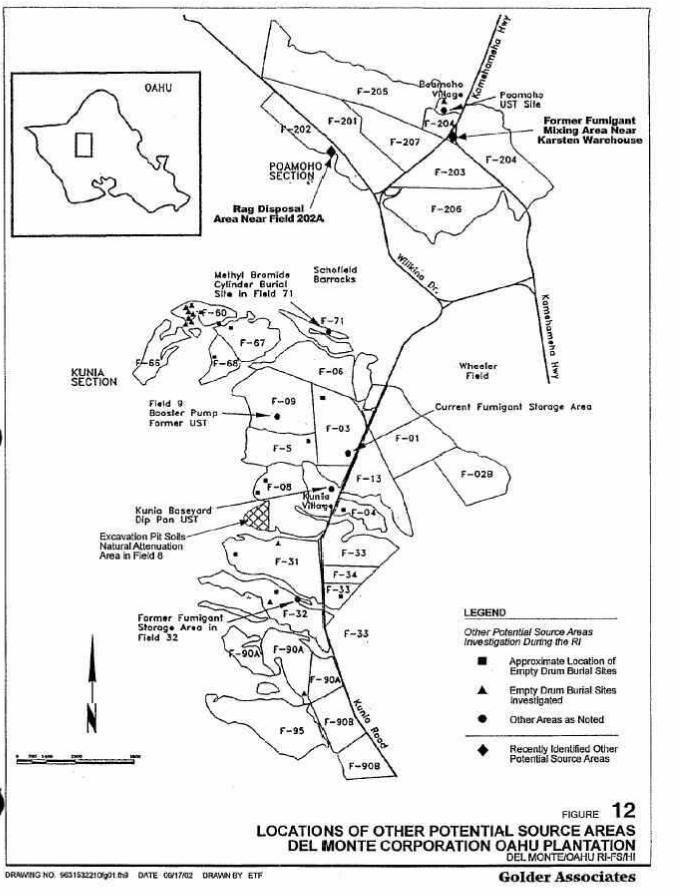
1 Del Monte Corporation (Oahu Plantation) Site Location Map2 Site Plan3 Kunia Village Vicinity4 Kunia Village Area5 Generalized Geologic Cross Section of the Central Oahu Area6 Perched Extraction Well Locations7 EDB Concentration Contours at the base of the Saprolites8 DBCP Concentration Contours at the base of the Saprolites9 DCP Concentration Contours at the base of the Sapralites10 Current Travcl Distances for Prior (1980-1998) EDB/DBCP (with Source Decay)1I Future Travel Distances for Prior (1997) EDB/DBCP (assuming no Source Decay)12 Locations of Other Potential Source Areas
Acronyms and Abbreviations
AOC Administrative Order of ConsentARARs Applicable or Relevant and Appropriate RequirementsATSDR Agency for Toxic Substances and Disease Registrybgs below ground surfaceBRA baseline risk assessmentBWS Board of Water SupplyCAMU corrective action management unitCERCLA Comprehensive Environmental Response, Compensation, and Liability ActCFR Code of Federal RegulationsCOCs contaminants of concernCOPCs contaminants of potential concernCWA Clean Water ActDBCP 1,2-dibromo-3-chloropropaneDCP 1,2-dichloropropancDNAPL dense nonaqueous phase liquidEDB ethylene dibromideEE/CA Engineering Evaluation/Cost AnalysisEPA United States Environmental Protection AgencyESD Explanation of Significant DifferencesFIFRA Federal 1nsecticide, Fungicide, and Rodenticide ActFS Feasibility StudyFSA Fuel Storage AnnexHAR Hawaii Administrative RulesHCC Hawaii Country ClubHDOH Hawaii Department of HealthHEAST Health Effects Assessment Summary TablesHI hazard indexHQ hazard quotientICR incremental cancer riskIRIS Integrated Risk Information Systemkg kilogramsKVA Kunia Village AreaLDRs land disposal restrictionsMCL maximum contaminant levelMCLG maximum contaminant level goalmgd million gallons per daymg/kg milligrams per kilogram (approximately equivalent to parts per million)µg/L micrograms per liter (approximately equivalent to parts per billion)MNA monitored natural attenuationmsl mean sea levelMTRs minimum technology requirementsNCP National Contingency PlanNPDES National Pollutant Discharge Elimination SystemO&M Operations and maintenancePRG preliminary remediation goalPRPs Potentially Responsible PartiesRAGS Risk Assessment Guidance for SuperfundRAOs remedial action objectivesRCRA Resource Conscrvation and Recovery ActRfD reference doseRI Remedial InvestigationRI/FS Remedial Investigation/Feasibility StudyRME reasonable maximum exposureROD Record of DecisionSARA Superfund Amendments and Reauthorization ActSDWA Safe Drinking Water ActSOW Statement of WorkSVE soil vapor extractionTBC to be consideredTCLP toxicity characteristic leaching procedure

TCP 1,2,3-trichloropropaneTPH total petroleum hydrocarbonsUCL upper confidence limitUIC underground injection controlUST underground storage tank
Part I - Declaration
1.1 Site Name and Location
This Record of Decision (ROD) addresses soil and groundwater contamination at the Del MonteCorporation (Oahu Plantation) Superfund Site (also listed as the “Del Monte Site” or just the“Site” in this ROD) in Kunia, Hawaii. The Del Monte Corporation (Oahu Plantation) Superfund Sitehas a CERCLIS ID of HID980637631.
1.2 Statement of Basis and Purpose
This ROD presents the selected remedial action for the Del Monte Corporation (Oahu Plantation)Superfund Site in accordance with the Comprehensive Environmental Response, Compensation andLiability Act of 1980, 42 U.S.C. §§ 9601 et. seq., as amended by the Superfund Amendments andReauthorization Act of 1986 (SARA) (collectively referred to herein as CERCLA) and to the extentpracticable, the National Oil and Hazardous Substances Pollution Contingency Plan, 40 CFR Part300 (NCP). This decision is based on the Administrative Record for this site.
The State of Hawaii, acting through the Hawaii Department of Health (HDOH), concurs with theselected remedy.
1.3 Assessment of the Site
The U.S. Environmental Protection Agency (EPA) has determined that the pesticides ethylenedibromide (EDB), 1,2-dibromo-3-chloropropane (DBCP), 1,2,3-trichloropropane (TCP) and1,2-dichloropropane (DCP) have been released into soil and groundwater at the Del Monte Site andthat a substantial threat of release to groundwater still exists. The response action selectedin this ROD is necessary to protect the public health or welfare or the environment from actualor threatened releases of hazardous substances into the environment.
1.4 Description of the Selected Remedy
This ROD addresses groundwater and soil contaminated with pesticides. The selected remedy willeliminate potential future exposure to contaminants in the Kunia Village Area and the basalaquifer.
EPA’s selected cleanup remedy is divided into two parts. 1) the shallow groundwater (perchedaquifer) and contaminated soil in the Kunia Village Area from approximately 20 feet below theground surface to 100 feet below ground surface and 2) the deep groundwater basal aquifer). Theselected remedy will address contamination through the following actions.
Perched Aquifer and Deep Soil Remedy Components
The contaminated soil in the Kunia Village source area has been designated as a principal threatat the site.
EPA’s goal is to prevent perched aquifer and deep soil contaminants (deeper than 20 feet) fromfurther contaminating the basal aquifer. This will be achieved by extracting and treatingcontaminated groundwater from the perched aquifer and treating deep soil. 3pecific componentsinclude:
• Pumping contaminated groundwater from the perched aquifer and treating the water usingplants (referred to as phytoremediation).
• Placing a vegetated soil covering (a cap) over the contaminated soil area (the sourcearea). The soil cap will reduce the amount of rainwater that moves through the soil andcarries contaminants down to the basal aquifer.
• Installing a soil vapor extraction (SVE) system to withdraw contaminants present in vaporform (volatile chemicals) from the soil. The extracted vapor wil1 he treated with a carbonfilter to remove the contaminants before the vapor is released to the atmosphere.
• Restricting land use to prevent exposure to contaminated soil and perched groundwaterimpacted by contaminants of concern (COCs) and to prevent activities that might interferewith the effectiveness of the remedy.
Basal Aquifer Remedy Components
EPA’s goal is to prevent future exposure to contaminated groundwater in the basal aquifer. Thiswill be achieved by cleaning up both the source area (including the Kunia Well) and thedowngradient plume. Specific components include:
• Installing monitoring wells to characterize the extent of contaminated groundwater in boththe source area and the downgradient plume.
• Pumping and treating contaminated groundwater in a phased manner, starting at the KuniaWell.
• Monitoring the effectiveness of source control and evaluating whether natural attenuationis effective at reducing contaminant concentrations in the downgradient plume to drinkingwater standards.
• If monitoring data show no evidence of natural breakdown, install additional pumping wellsto ensure the entire plume is captured and treated.
• Treating the contaminated groundwater to drinking water standards using air stripping andcarbon adsorption.
• Using treated groundwater for irrigation.
• Restricting land use to prevent exposure to basal groundwater impacted by COCs and toprevent activities that might interfere with the effectiveness of the remedy.
1.5 Statutory Determinations
The Selected Remedy is protective of human health and the environment. complies with Federal andState requirements that are applicable or relevant and appropriate to the remedial action, iscost effective, and utilizes permanent solutions and alternative treatment technologies to themaximum extent practicable. This remedy also satisfies the statutory preference for treatment asa principal element of the remedy (i.e., reduces the toxicity, mobility, or volume of hazardoussubstances, pollutants, or contaminants through treatment), including treatment of the principalthreat deep soil in the Kunia Village Area.
Because this remedy will not result in hazardous substances, pollutants, or contaminantsremaining onsite above levels that allow for unlimited use and unrestricted exposure, but itwill take more than five years to attain remedial action objectives and cleanup levels, a policyreview may be conducted within five years of construction completion for the Site to ensure thatthe remedy is, or will be, protective of human health and the environment.
1.6 ROD Data Certification Checklist
The following information is presented in the Decision Summary section of this ROD. Additionalinformation can be found in the Administrative Record file for this site.
• COCs and their respective concentrations (see Part II, Sections 5.5 and 7.1)
• Baseline risk represented by the COCs (see Part II, Section 7.1)
• Cleanup levels established for the COCs and the basis for these levels (see Part II,Section 8)
• How source materials constituting principal threats are addressed (see Part II, Section11, page 1)
• Current and future land and groundwater use assumptions used in the baseline riskassessment (BRA) and ROD (see Part II, Sections 6.2 and 7.1)
• Land and groundwater use that will be available at the site as a result of the selectedremedy (see Part II, Section 11.3)
• Estimated capital, operation and maintenance (O&M), and total present worth costs;discount rate; and the number of years over which the remedy cost estimates are projected(see Part II, Section 11.2)
• Decisive factors that led to selecting the remedy (i.e., how the selected remedy providesthe best balance of tradeoffs with respect to the balancing and modifying criteria) (seePart II, Section 11)
________________________ _______________Joel Jones, Acting Chief DateFederal Facility Cleanup Branch
Original signed by Joel Jones on September 25, 2003.
Part II - Decision Summary
This Decision Summary portion of the ROD summarizes the information and approaches that EPA usedto reach a decision on this remedy. It also establishes the remedy that EPA has selected.
1 Site Name, Location and Description
This ROD presents the selected remedial action to address soil and groundwater contamination atthe Del Monte Corporation (Oahu Plantation) Superfund Site (CERCLIS ID of HID980637631) locatedin Kunia, Hawaii on the island of Oahu. The Del Monte Site is part of a large pineappleplantation that is currently operated by Del Monte Fresh Produce (Hawaii), Inc. The northeasternportion of the Site (known as the “Poamoho Section”) is owned by the Galbraith Trust and theremainder of the Site (known as the “Kunia Section”) is owned by the Estate of James Campbell.Del Monte Fresh Produce (hereinafter referred to as “Del Monte”) leases the Poamoho Section andthe Kunia Section.
EPA is the lead regulatory agency overseeing the cleanup at the Del Monte Site. The HawaiiDepartment of Health (HDOH) is the lead agency for the State of Hawaii and provides support toEPA’s efforts. Del Monte conducted the Remedial Investigation and Feasibility Study (RI/FS) inaccordance with an Administrative Order of Consent (AOC) they signed with EPA and HDOH. EPAexpects to negotiate and sign a consent decree with Del Monte to implement the remedial actiondescribed in this ROD.
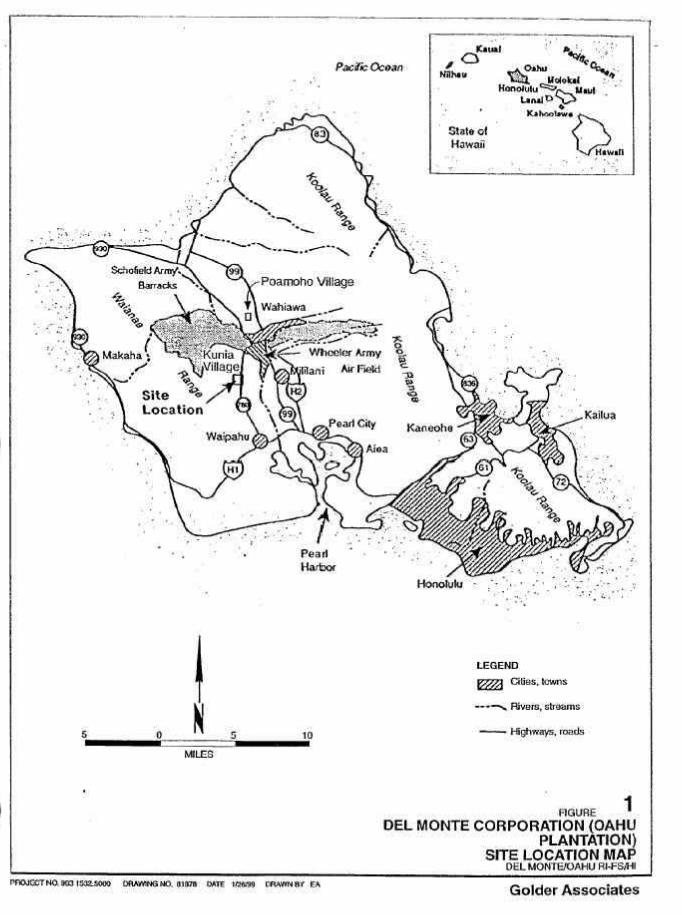
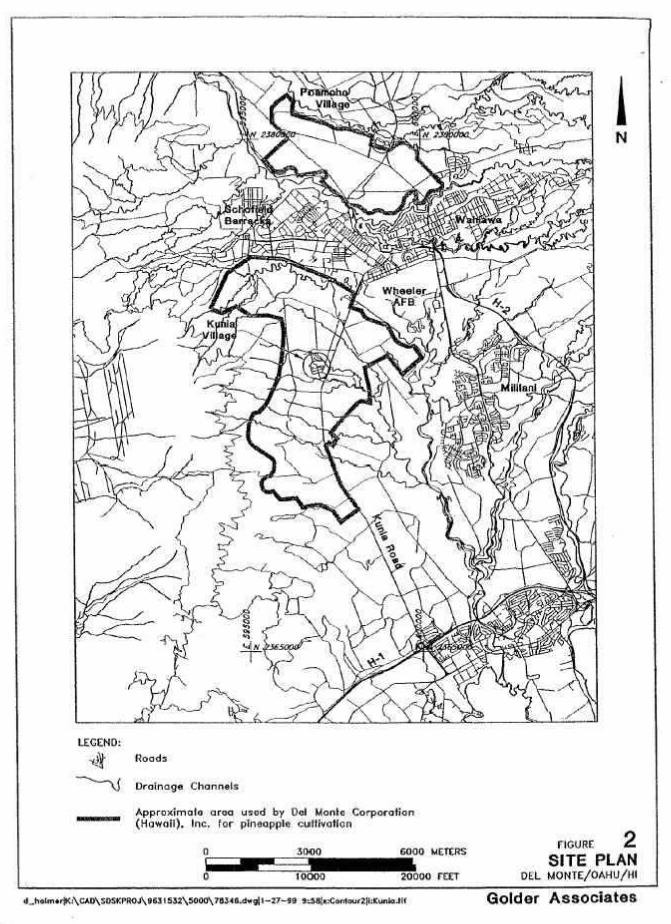
The Oahu Plantation is a 6,000-acre pineapple plantation currently operated by Del Monte. Theplantation is located on the western side of the Oahu central plain which stretches between theWaianae and Koolau Mountain ranges (Figures 1 and 2). The plantation has been used forcultivation of pineapple since the early 1940s. During that time, a number of chemicals wereapplied to the soil to kill nematodes (worms that attack pineapple roots). The facility iscomprised primarily of agricultural areas but also contains two company operated housingcomplexes (Kunia Village and Poamoho Village [see Figure 2]), as well as equipment maintenanceareas, pesticide storage facilities, warehouses, and administrative buildings.
2 Site History and Enforcement Activities
2.1 Site History
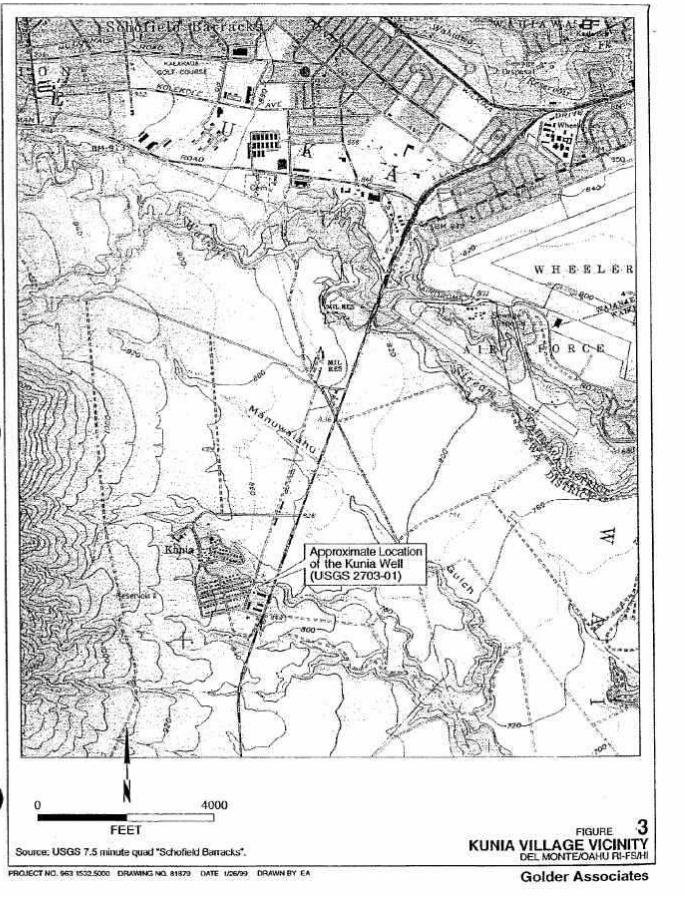
From 1946 through April 25, 1980, the Kunia Well (State Well No. 2703-01) (Figure 3) supplieddomestic water to the approximately 700 residents of Kunia Village as well as agricultural waterto the plantation. In April 1977, an accidental spill involving about 495 gallons of the soilfumigant EDB containing 0.25 percent DBCP occurred on bare ground within approximately 60 feetof the Kunia Well. The spill resulted from the failure of a hose connector on a bulk transportcontainer owned by Dow Chemical Company during transfer operations to an above ground storagetank. EDB contamination was not detected (detection limit of 0.5 micrograms per liter [µg/L]) inthe Kunia Well in testing conducted by the HDOH within one week of the spill. However,groundwater samples collected from the Kunia Well on April 14, 1980 indicated the presence ofEDB and DBCP at levels of 92 and 11 µg/L, respectively. The Kunia Well was re-sampled on April24, 1980, and EDB and DBCP were detected at 300 and 0.5 pg/L, respectively. The State ofHawaii’s Safe Drinking Water Standards for both EDB and DBCP are 0.04 µ/L. Del Monte immediatelydisconnected the Kunia Well from the Kunia Village drinking water system.
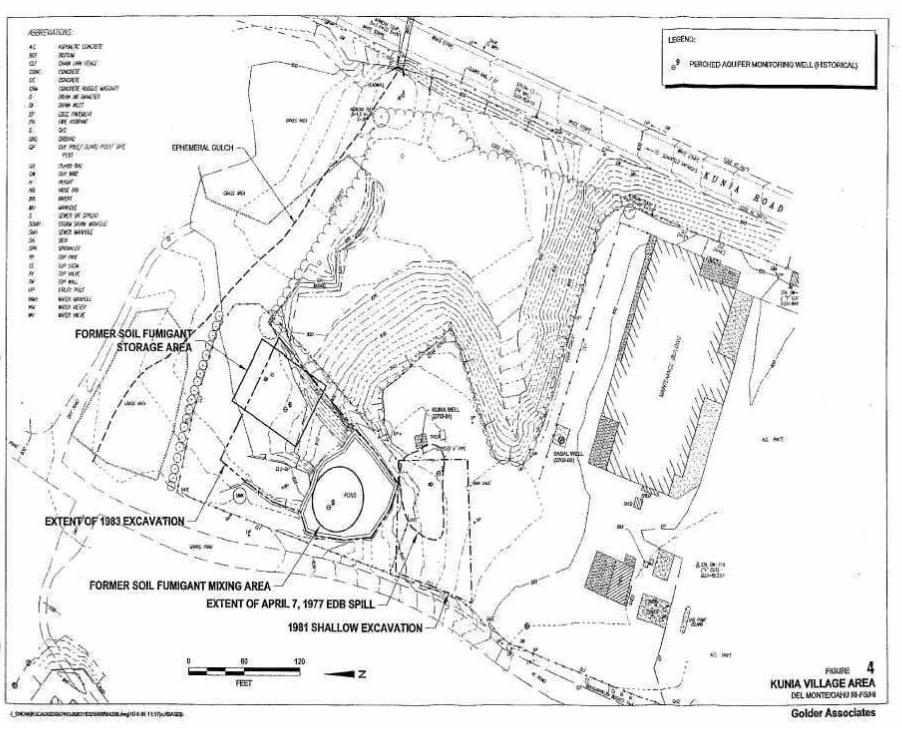
In response to the detection of the compounds in the Kunia Well, the operator of the plantationat the time, Del Monte Corporation, initiated soils and groundwater investigations to determinethe extent of contamination in the spill area and adjacent areas where pesticides had beenstored and mixed. In addition to the Kunia Well spill area, other areas impacted with fumigantsnear the well were identified, including the Former Fumigant Mixing Area and Former FumigantStorage Area (Figure 4). These areas are located within about 50 to 150 feet northwest of theKunia Well. The nature of accidental spillage near the former mixing and storage areas may havebeen intermittent over a span of years, and the quantity of accidental spillage in these areasis unknown.
Based on these investigations, 2,000 tons of contaminated soil were removed from the EDB spillarea in 1981, and 16,000 tons of contaminated soil were removed from the former pesticide mixingand storage areas in 1983 (Figure 4). These soil removal activities resulted in the creation ofa 60-foot deep by 75-foot-wide by 75-foot long excavation pit. The excavated soil was spread ona nearby field. With EPA’s approval, the pit was backfilled in October 1999 (Del Monte FreshProduce, 1999). In addition, three groundwater extraction wells were installed into the shallow,perched aquifer and pumped periodically from 1980 to 1994. The Kunia Well was also pumpedperiodically during this time period. The extracted perched groundwater was used for dustcontrol on in-field pineapple roads away from residential populations. Groundwater pumped fromthe Kunia Well was used for non-crop irrigation of a grass covered field approximately 350 feetnorth of the Kunia Well site. In September 1994, EPA requested that Del Monte cease pumping ofthe Kunia Well and perched groundwater wells due to concerns regarding use of the extractedwater.
A Preliminary Assessment/Site Investigation was conducted by EPA at the site in 1990. EPAsubsequently completed a Hazard Ranking Scoring process for the site in 1992, which led to aproposed listing on the National Priorities List (NPL). During 1994, a public health assessmentwas conducted by the Agency for Toxic Substances and Disease Registry (ATSDR) pursuant torequirements mandated by the proposed listing on the NPL. The ATSDR studied the historical datafor the site, including the pre-1980 use of the Kunia Well as the drinking water source. In areport dated February 7, 1995, ATSDR concluded that residents of Kunia Village had not beenexposed to significant levels of EDB and DBCP in their drinking water, and the Oahu Plantationwas classified as a “No Apparent Public Health Hazard” for past and current conditions (ATSDR,l995). 1t is not anticipated, according to ATSDR, that Kunia Village residents who utilized theKunia We11, as their drinking water source will have any adverse health effects. ATSDR alsoconcluded that the site may pose an “Indeterminate Health Risk,” for future exposures because ofthe need to characterize potential impacts on downgradient wells. The site was added to the NPLon December 16, 1994.
2.2 Remedial Investigation Activities
EPA developed the Remedial Investigation (RI)/Feasibility Study (FS) process for conductingenvironmental investigations under Superfund. The RI/FS approach is the methodology that theSuperfund program has established for characterizing the nature and extent of risks posed byuncontrolled hazardous waste sites to evaluate potential remedial options. The remedialinvestigation (RI) serves as a mechanism to collect data for site characterization. TheFeasibility Study (FS) serves as the mechanism for development, screening, and evaluation ofpotential remedial alternatives.
An AOC for an RI/FS and Engineering Evaluation and Cost Analysis (EE/CA) was signed by DelMonte, EPA, and the State on September 28, 1995. EPA and Del Monte agreed on January 23, l997 toinclude the soils operable unit m the FS rather than in a separate EE/CA to more effectivelycomplete the remedial evaluation process hy considering interactions of soils and groundwater.The AOC Statement of Work (SOW) developed by EPA and the State describes the investigative workat the Kunia Village Area and Other Potential Source Areas required to meet the RI/FSobjectives.
The overall goal of the RI field sampling activities was to estimate the nature and extent ofimpacts from chemicals of potential concern (COPCs) at known and suspected source areas, and tocharacterize the chemicals present in sufficient detail to prepare a Baseline Risk Assessment(BRA) and FS. Data that are required to support these goals include information on geology,hydrogeology, soils, surface water and sediments, and the nature and extent of chemicalsthroughout pertinent environmental media. The RI is summarized in Section 2.1. Subsequent tocompletion of the RI, additional site characterization was conducted and reported to EPA in anaddendum to the RI (Golder, 2002a) and in RI Technical Memorandum 02-02 (Golder, 2003b).
The rationale and approach for site field investigations were evaluated in the Work Plan forRemedial Investigation and Feasibility Study at the Del Monte Corporation (Oahu Plantation)Superfund Site (ICF, 1997). The Work Plan identified the following “known” sources (wherechemicals have been observed) which are collectively referred to as the Kunia Village Area(KVA):
• Kunia Well Spill Area;
• Former Fumigant Storage Area; and
• Former Fumigant Mixing Area.
Additionally, suspected sources of potentially hazardous chemicals (Other Potential SourceAreas) were selected by EPA and identified in the RI/PS Work Plan. Releases of potentialhazardous chemicals were not known to have occurred at these areas, but were suspected based onhistorical activities. These known and suspected source areas were investigated in the RI.
Remedial Investigation activities were performed during March through June of 1997 and duringAugust throug4 October 1997. Subsequent RI data were also collected in May of 1998 andJuly/August 1998. RI results were compiled and presented in the Remedial Investigation Reportfor the Del Monte Corporation (Oahu Plantation) Superfund Site (Golder, 1998a). The RI Reportwas approved by EPA in February 1999. From 2000 to 2001, Del Monte conducted a supplementalinvestigation in the Kunia Village Area of the site subsequent to the RI Report. Theseadditional data were reported to EPA in an addendum to the RI (Golder, 2002a). In late 2(02 andearly 2003, Del Monte conducted supplemental investigations in the Poamoho Section. These datawere reported to EPA in Remedial investigation Technical Memorandum 02-02 (Golder, 2003b).Afterthe RI, the FS along with the BRA represent the next steps of the RI/FS process. Based on theinformation presented in the RI, the BRA evaluates potential human health and environmentalrisks posed by COPCs characterized in the RI. The FS identifies and evaluates potential remedialmeasures needed to address any applicable or relevant and appropriate requirements (ARARs) orrisks identified in the BRA. The BRA was submitted to EPA on December 17, 1999 with minorrevisions submitted May 18, 2000. The FS was prepared in accordance with the AOC, the statutoryrequirements of CERCLA, and the Guidance for Conducting Remedial Investigations and FeasibilityStudies under CERCLA (EPA 1988b). The FS identified remedial action objectives, assembledremedial action alternatives, and provided an evaluation of the remedial action alternativesusing the Superfund evaluation criteria established in the NCP. The final FS (Golder, 2003a)was submitted to EPA in February 2003.
2.3 Enforcement Activities
On November 25, 1994, EPA signed a memorandum of action with the State of Hawaii whereby EPAagreed to assume the lead agency role with respect to the Site. On April 7, l99S and April 20,1995, General Notice letters were sent by EPA to identified current and former owner/operatorsof the Site notifying such parties that they might be potentially responsible parties (PRPs)with respect to the Site. On April 28, 1995, EPA sent Special Notice to the PRPs inviting themto participate in negotiations with EPA to conduct the Del Monte Site RI/FS. One of the PRPs,Del Monte, entered into negotiations with EPA. In September 1995, Del Monte signed an AOC withEPA and the State of Hawaii to conduct the RI/FS.
3 Community Participation
The Proposed Plan for this remedy, in the form of a fact sheet, was distributed to the partieson EPA's mailing list for the Del Monte Site in March 2003. The Proposed Plan, together with thefinal RI Report (Golder, 1998a) and FS (Golder, 2003a) reports and other pertinent documents,were also included in the Administrative Record file available at EPA's Superfund Records Centerat EPA's Regional Office in San Francisco and locally at the Del Monte Site InformationRepository at the Wahiawa Public Library. The Administrative Record for the Del Monte Site wasplaced in CD-ROM format in the repository.
EPA held a public meeting to present the Proposed Plan and EPA's preferred alternative on April2, 2003, at the Wahiawa Intermediate School Library in Wahiawa, Hawaii. At this meeting, EPAanswered questions and accepted oral comments pertaining to the Del Monte Site and the preferredalternative. A transcript of this meeting is available at the EPA's Superfund Records Center andat the information repository.
Notice of EPA's public meeting, availability of the Proposed Plan, and the announcement of a30-day public comment period was published in the Honolulu Advertiser on March 19. 2003.
The public comment period ran from March 19 to April 18, 2003. EPA received one written commentduring the public comment period. This comment and the substantive oral comments are addressedin the Responsiveness Summary, included as Part III of this ROD.
4 Scope and Role of Response Action
The Del Monte Site remedial action selected in this ROD is expected to be the only actionrequired at the Site and will result in remediation of the impacted soil and groundwater. Basedon the findings of the RI and the BRA at the site, the only areas and media requiring a responseaction are:
• Subsurface soil (greater than 20 feet below ground surface) in the Kunia Village sourcearea (designated as a principal threat at the site),
• Shallow, perched groundwater in the Kunia Village source area,
• Deep, basal aquifer groundwater in the Kunia Village source area, and
• The basal aquifer plume that has migrated downgradient of the source area.
Although there is no current exposure to contaminants in these areas/media, there is a potentialfuture risk of exposure to contaminated groundwater if these areas/media are not remediated.Each of these areas/media are addressed by the remedy selected in this ROD, including treatmentof the subsurface soil in the source area which has been designated as a principal threat.
Rased on the findings of the RI, no COCs were detected above EPA Region IX residentialPreliminary Remediation Goals (PRGs) in the Poamoho Section . EPA’s PRGs are developed based onpotential human health impacts and are commonly used as screening-level values for comparison tosite-specific concentrations detected during RI activities. Because of these findings, EPA plansto propose a Partial Site Deletion to remove the Poamoho Section from the NPL. The Partial SiteDeletion will be published in the Federal Register following a public comment period.
Although this ROD includes the only action expected to be necessary under CERCLA to cleanup theDel Monte Site, before the Site was listed on the NPL in 1994, several remedial actions wereimplemented by the owner, with oversight by the State of Hawaii. These actions included removalof 18,000 tons of soil from the Kunia Village source area and periodic extraction ofcontaminated groundwater from the shallow (perched) and deep (basal) groundwater systems in thesource area.
5 Site Characteristics
Most of the site characteristic information presented in this section is summarized from the RIand FS Reports (Golder 1998a and 2003a, respectively).
5.1 Location and Setting
The Oahu Plantation is a 6,000 acre pineapple plantation located on the north-central plateau ofthe Island of Oahu (Figures 1 and 2). The facility is approximately 15 miles from the City ofHonolulu, and the closest town is Wahiawa. Schofield Army Barracks and Wheeler Military Airfieldare located in close proximity to the plantation.
The plantation is located within the Schofield Plateau physiographic province which is boundedon the east by the Koolau Mountain Range and on the west by the Waianae Mountain Range (Figure1). The Schofield Plateau was formed by the burial of older Waianae lavas by the younger lavasof the Koolau volcano. The surface topography of the plateau ranges from nearly flat near thecentral area around the Wheeler Military Airfield (Figures 1 and 2) to steeply sloping,dissected terrain rising up to the mountain ranges east and west of the plateau. The crest ofthe plateau runs through the Schofield Barracks and forms a natural drainage divide for theisland. North of the divide, watercourses flow to the north, and south of the divide, they flowto the south to the west loch of Pearl Harbor. Narrow gulches dissect the plateau where streamshave eroded the land surface.
The Oahu Plantation facility is an agricultural operation currently managed by Del Monte. Whilecomprising primarily agricultural areas, the facility also contains two company operated housingcomplexes (Kunia Village and Poamoho Village), equipment maintenance areas, chemical storageareas, warehouses, and administrative buildings. A fresh pineapple packing facility is locatedwithin the property boundaries.
The plantation can be geographically divided into two major sections: the Kunia Section andPoamoho Section (Figure 2) located on either side of the Schofield Plateau drainage divide andseparated by an active military reservation, the Schofield Barracks. Pineapple production occursin both sections. The northern section (Poamoho Section) is a relatively flat area located tothe north of Wahiawa and Schofield Barracks. One of the company operated housing complexes(Poamoho Village) is situated adjacent to the northern section. The section is bounded byWahiawa Reservoir (Lake Wilson) to the south, Kaukonabua Gulch to the east and Poamoho Gulch tothe north. State Highways 80, 82, and 99 cross this parcel of land. The Poamoho Section islocated approximately 3 miles north of the known source areas near the Kunia Well.
The southern parcel of land, which includes most of the areas investigated during the RI, iscentered around Kunia Village (Figures 2 and 3), The land in this parcel gently slopes to theeast and southeast from a maximum elevation of about 1,200 feet to about 750 feet above mean sealevel (msl). The parcel is bounded by Waikele Stream Gulch to the north and by the SchofieldBarracks and Honouliuli Forest Preserve to the west. State Highway 750 (Kunia Road) crossedthrough this parcel of land.
The Kunia Section is the largest section of the plantation and contains the Kunia Well site.With the exception of 4 small Other Potential Source Areas, all of the known Other PotentialSources Areas are located in the Kunia Section. The 1977 EDB Spill Area and the Former FumigantStorage and Mixing Areas are located within the area collectively referred to in this documentas the KVA. Me results of the RI indicate that all of the known source areas for the NPL sitearea located within the Kunia Village Area of the Kunia Section of the Oahu Plantation.
A topographic survey of the KVA was conducted as part of the RI. The Spill Area and Kunia Wellare situated atop relatively level ground at a surface elevation of about 850 feet above msl.Because of earlier soil excavation activities, the Spill Area slopes gently to the north beforedropping steeply approximately 30 feet to the Former Mixing Area. In 1983, approximately 16,000tons of soil were excavated from the Former Mixing Area to remove impacted soils. The excavatedarea was approximately 60 feet deep at the center, however, over the years sediment and fillmaterial reduced the tota1 depth of the excavation. The soil removal activities resulted in nearvertical side walls around the excavation pit. 1mmediately after the completion of excavationactivities, a fence was constructed around the excavation area and the Former Storage Area torestrict access.
The entire fenced area around the pit (Figure 4) drains generally towards the excavation, whichfilled with water during periods of heavy rainfall. Collected water then infiltrated intoperched groundwater contributing to the migration of chemicals from the perched to the basalaquifer. With EPA*s approval, the pit was backfilled in October 1999. An ephemeral watercourse(guleh), which drains upland areas including pineapple fields on the west, runs outside of thenorthern side of the fenced area and discharges through a culvert running underneath Kunia Roadinto previous pineapple fields and eventually to Poliwai Gulch and Waikele Stream.
The Poliwai Gulch is normally dry, covered with grasses and trees, and is bermed at the lastpineapple field to prevent stormwater runoff. The distance from the fenced area to WaikeleStream is approximately 1.5 miles, and the distance from the confluence of Poliwai Gulch andWaikele Stream to Pearl Harbor is approximately 3.S miles.
5.1.1 Meteorology
The Island of Oahu, which lies south of the Tropic of Cancer and within the belt of northeasttrade winds, is characterized by moderate temperatures that remain relatively constantthroughout the year. The mean average temperature near sea level in Honolulu is 77.2 degrees.The lowest temperature ever recorded is 53 degrees and the highest is 95 degrees. The averagedaily temperature range in Honolulu is about 14 degrees. January and February are the coldestmonths and average about 73 degrees. August is the warmest at about 81 degrees. The decrease in
temperature with increasing altitude is about 3 degrees per thousand feet. Temperatures at OahuPlantation would therefore be expected to be about 3 degrees cooler than in Honolulu.
The mean maximum relative humidity in Honolulu is about 76% and the mean minimum is 59%. Themean wind speed is 11.3 miles per hour and the prevailing wind direction is east-northeast, thedirection of the trade winds.
Rainfall on Oahu is as little as 20 inches on the extreme leeward (or western) coast and as muchas 300 inches at the crest of the Koelau Range. In general, rainfall decreases progressivelyfrom the mountains to the sea.
Trade wind circulation results in greater amounts of rainfall on windward Oahu than leewardOahu. Rainfall in the Waianae Range is considerably less than the Koolau Range because the tradewind air has lost much of its moisture to the Koolau Range before it reaches the slopes of theWaianae Range. The occurrence of groundwater resources on Oahu is the direct result of rainfallinfiltration. Due to the much higher amounts of rainfall in the Koolau Range as compared to theWaianae Range, most of the recharge to basal groundwater is associated with the Koolau Range.
Based on data from a rain gauge located at the Kunia Well site, average rainfall for the KuniaVillage Area is about 36 inches per year, with October through March the wettest months at about4 to 5 inches per month and April through September the driest at about 1 to 2 inches per month.Over 50 inches of rain fell during a period of prolonged storms from November l996 through March1997 resulting in an exceptionally high stormwater level in the excavation pit.
The evaporation rate in the area is high. The average monthly potential evaporation exceedsaverage monthly rainfall from about April through October.
5.1.2 Surface Water
No permanent stream, springs, seeps or natural surface water bodies exist or were identifiedduring the RI within at least 2 miles of the Kunia Well site. A 2.4-million gallon man-madeirrigation basin is located within the plantation roughly one mile to the northwest of the KuniaVillage. The nearest permanent natural surface water body is Lake Wilson (Wahiawa Reservoir)located approximately 3 miles northeast of the Kunia Well site.
At the Kunia Village Area, an unnamed ephemeral gulch skirts the northern fenced boundary of thepit area and flows through a culvert under Kunia Road, eventually discharging into PoliwaiGulch, and Waikele Stream. This ephemeral gulch flows only intermittently during periods ofheavy rainfall. A narrow ravine, located between the Kunia Well and Kunia Road, does notrepresent a distinct stormwater drainage path. No stormwater flow was observed from the ravineeven during the exceptionally high rainfall that occurred during the RI sampling.
Water that periodically flows in the ephemeral gulch north of the pit area is notrepresentative, or contiguous with, the perched groundwater in the Kunia Village Area. Leakageof groundwater contributes little, if any, to streamflow, and surface water streams in theregion are believed to contribute little recharge to groundwater, primarily because of thelow-permeability clay-rich soils. Water level measurements collected from wells in the pit areaduring the RI confirm that water in the gulch is not comprised of perched groundwater discharge.Perched groundwater levels were much lower than the ephemeral gulch bed elevation.
The excavation pit in the Former Fumigant Mixing Area was backfilled during October 1999.Previous to that, surface water in the pit area would drain towards the pit and the pit wouldfill during periods of heavy rainfall. During unusually high rainfall events, such as wereobserved during the RI, the level of water in the pit could rise high enough to spill out anddischarge from the pit area to the ephemeral gulch.
5.2 Geology
The Island of Oahu is comprised of the remnants of two late Tertiary shield volcanoes and theirassociated rift zones. The western part of the island is the eroded Waianae volcano (about 3million years old), which was the first of the two volcanoes to emerge above sea level; theeastern part of the island consists of the eroded dome of the Koolau volcano (about 2 million
years old). The Waianae dome, because of its earlier emergence, was deeply eroded before theKoolau dome reached its maximum height. Piling up of lavas from the Koolau dome occurred on topof the older, eroded slopes of the Waianae dome and eventually produced the broad gently slopingfeature in the central area of Oahu called the Schofield Plateau.
Geologic materials present in the vicinity of the KVA include Waianae basalts to the west,Koolau basalts to the east and, directly underlying the KVA, the weathered remnants of basalticlavas. The surface contact of the Waianae basalts is some 4,000 feet to the west of the KVA. Thedip of the Waianae basalts located to the west of the KVA is variable, but is generally about 8N(to the east).
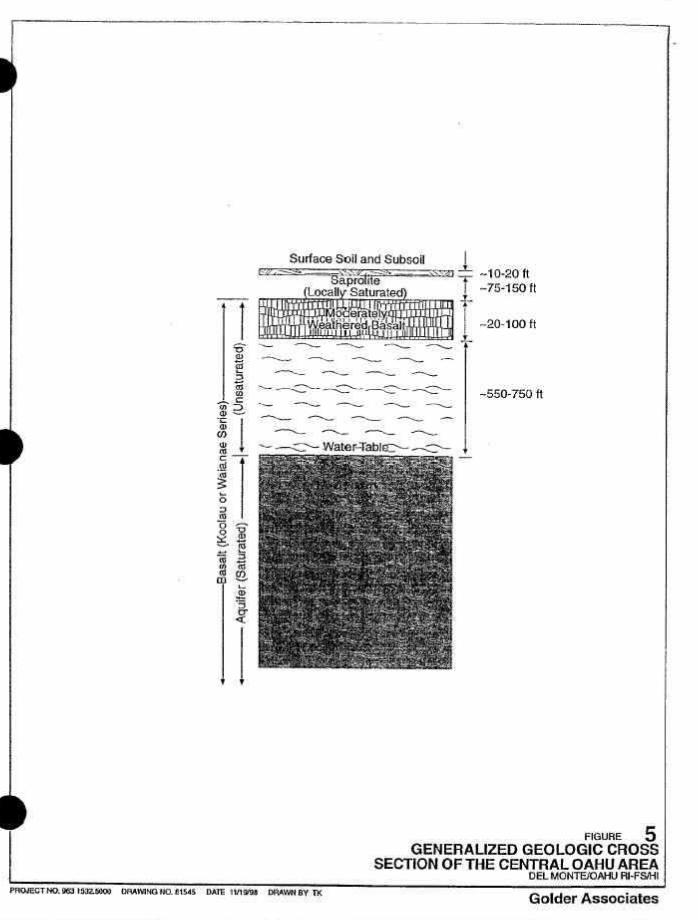
Near surface materials consist primarily of the weathered remnants of the original basalticsurface. In situ decomposition of basaltic bedrock has progressed to depths of approximately l00to 200 feet bgs. Near surface soils consist of several feet of a deep-red lateritic soillithosol having a loose, and generally porous structure. Underlying the surface soil is thesubsoil, which extends to depths of about l0 to 30 feet. The subsoil is similar to the surfacesoil in texture and mineralogy, but has larger and more distinct structural units. The subsoilgrades with depth to saprolite, which is a highly weathered basalt that retains some texturaland structural features of the parent rock, such as vesicles, fractures and relict minerals.Saprolite is a clay-rich thoroughly decomposed rock formed by m-situ weathering of the basalt.Beneath the saprolite lies basalt. In places, the basalt immediately beneath the saproliteexhibits some moderate weathering. This zone of weathered basalt is a transitional zone betweenthe highly weathered saprolite and fresh basalt.
As basalt weathers to saprolite, its porc structure is altered and, generally, permeability isdecreased as secondary clay minerals fill in pore spaces. In some areas, the permeabilities arelow enough to create locally perched water tables within the saprolite zone. The saprolitegenerally has a thickness of about 50 to 150 feet.
In the vicinity of the KVA, this sequence of surface soil, subsoil and saprolite is typical andgenerally mantles the basalt which is encountered at depths of approximately 150 to 200 feet.bgs. Beneath the saprolite lies the moderately weathered basalt and unweathered basalt, whichcomprises the remainder of the unsaturated zone and basal aquifer. A generalized geologic crosssection is shown in Figure 5.
The saprolites of the KVA are believed to be underlain by basalts of the Koolau volcanic series,given the location of the surface contact of the Waianae some 4,000 feet to the west. Thecontact between the Koolau and Waianae basalts therefore is present at depth beneath the KVA.The depth to the contact between the basalts has not been previously defined for the KVA. Basedon a projection of the surface contact of the Waianae basalts, however, and assuming a dip ofapproximately 8º to the east, the contact between the Waianae and Koolau basalts is believed tooccur no deeper than about 500 to 600 feet bgs. This places the contact between the Koolau andWaianac lavas at an elevation above the water table surface, which occurs at about 82S feet bgs.Therefore, the basal aquifer in the KVA is located within the Waianae basalts.
5.3 Hydrogeology
The most extensive bodies of freshwater on Oahu occur as basal groundwater. Basal groundwateroccurs when fresh water percolates into the saturated zone and displaces the underlyingseawater. The accumulating fresh water forms a lens-shaped body with a surface that extendsabove the surface of the salt water due to the contrast in densities between freshwater andseawater. The water table or potentiometric surface of a basal-water body is typically ratherflat and is no more than several feet to several tens of feet above sea level. The predominantvolume of the freshwater body lies below sea level.
The lavas from the Koolau volcano have the greatest areal extent on Oahu and comprise thelargest and most significant basal aquifers. Lavas from the Waianae volcano also comprisesignificant aquifers. The permeability of the unweathered rock that makes up the basal aquifersis generally high. The principal flow structures contributing the high permeability are clinkerlayers associated with a’a, lava tubes in pahoehoe, irregular openings between and within theflows, and contraction joints. Because most of the features that contribute to permeability lieparallel to flow surfaces, the stack of tabular units may be several orders of magnitude less
conductive vertically than horizontally. Vesicles, which make up a large part of the totalvolume of the lavas and contribute greatly to the porosity, are seldom interconnected andhave little effect on permeability. Connected porosity (through which water may flow) isbelieved to be generally less than 10%.
The Pearl Harbor Basal Water Body, comprised of lava flows associated with the Koolau andWaianae rift zones, serves as a primary source of potable and irrigation water for Honolulu andthe island. Lavas of the Waianae and Koolau volcanoes comprise separate sections, or hydrologicunits, of the Pearl Ikubor Basal Aquifer, informally termed the Waianae aquifer (or Ewa-KuniaAquifer System) and Koolau aquifer (or Waiawa – Waipahu Aquifer System). The presence of theseseparate areas has been inferred by observed head drops across the erosional unconformitybetween the two lavas, and differing water level trend patterns in wells installed in the twolavas. The differences have been attributed to the presence of a partial groundwater barrieralong the contact between the Waianae and Koolau lavas. The barrier is comprised of a weatheredzone and accumulations of alluvium, separating the lower, older Waianae lavas from the youngerKoolau lavas. Head drop across the unconformity is about 2 to 3 feet with heads in the Koolaubeing higher. Therefore, flow across the contact is always from the Koolau to the Waianaesections. This flow is the major source of recharge to the Waianae aquifer.
The KVA is located overtop the Pearl Harbor Basal Water Body near the contact between theWaianae and Koolau aquifer portions of the basal aquifer. The contact between the Koolau andWaianae basalts is generally mapped as lying along the exposed surface contact of the two units.This contact is approximately 4,000 feet west of the Kunia Well site. Since the Waianae basaltsdip from 5 to 10 degrees to the east, the effective separation lies further to the east. At adip of 10 degrees, the sea level contact (approximately the water table surface) is over 1 mileto the east of the surface contact. At a dip of 5 degrees, the sea level contact is even furtherto the east. This indicates the Kunia Well is constructed in the Waianae aquifer. Thisconclusion is supported by an analysis of hydraulic gradient data between the Kunia Well/BasalWell and existing monitoring wells known to be completed in the Waianae and Koolau aquifers.
5.3.1 Conceptual Hydrogeologic Model
Based on analysis of the geologic and hydrogeologic data collected during the RI, the followingconceptual hydrogeologic model has been developed to describe groundwater flow at the KVA:
• Surficial soil and saprolite occur to depths of approximately 80 to l00 feet and areunderlain by approximately 100 feet of unsaturated, weathered basalt prior to theoccurrence of unweathered basalt at 200 feet depth. A near-surface perched aquifer isconfined to the saprolite material above the weathered basalt;
• Surface soi1 and saprolites are of relatively low permeability, with horizontal hydraulicconductivity on the order of 0.01 to 1 feet/day and vertical hydraulic conductivity aboutone order of magnitude less. Surface water runoff from the KVA is concentrated in the pitarea due to local topography. Low hydraulic conductivity of the surface soil andsaprolites combined with surface water flow patterns creates locally saturated (perched)conditions in the saprolite in the pit vicinity;
• Horizontal flow in the perched aquifer occurs to the n/-northeast. The extent of theperched aquifer is limited however to the general area south of the ephemeral gulch. Northof the gulch the saprolites are unsaturated. Flow from the perched aquifer is p/lyvertically downward due to the higher permeability of the underlying basalt. Evidence ofthis downward flow is the high downward gradients (on the order of 0.5 to 1) in thesaprolite and absence of saturated conditions in the saprolite north of the gulch area.There me no surface seeps of perched aquifer groundwater or points of perched groundwaterdischarge to surface water (other than overflow from the pit resulting from extremely highprecipitation);
• During the RI, the water table surface of the perched aquifer in the KVA was encounteredat depths between about 0 feet (during rainy periods) near the edge of the pit to over &feet bgs, depending on location and season. Heads in the perched aquifer vary seasonallyon the basis of rainfall. During dry periods the water table surface is lower than thebottom of the pit. Between April 1997 and July 1998 for instance, groundwater headsgenerally declined from about 10 to 20 feet in the perched aquifer at most locations inthe KVA due to low rainfall;
• Downward migration occurs from the perched aquifer through the unsaturated basalts to thewater table. Immediately beneath the saprolite perched aquifer, approximately 100 feet ofweathered unsaturated basalt is present above unweathered basalt. The weathered basaltconsists of a transitional zone between the saprolite and unweathered basalt withhydraulic properties intermediate between the two materials. Hydrologic data collectedduring perched aquifer drilling indicate the weathered basalt zone is unsaturated.Hydraulically, it is therefore an element of the unsaturated basalt sequence, whichextends from the base of the saprolite to the water table surface;
• The saturated basalt is highly permeable, with groundwater flow at a gradient of about 1to 1.5 feet/mile. Hydraulic conductivity is on the order of about 2,000 feet/day.Effective porosity of the basalts is about 0.05 to 0.10. The best estimate of averagegroundwater flow velocity in the saturated basalt is on the order of about 1,000 to 1,500feet/year or about 3 to 4 feet/day;
• A variety of hydrogeologic data, consisting of KVA stratigraphic information, theprojected extension of the Waianae surface exposure, and regional water level data,indicate that the basal aquifer beneath the KVA occurs within the basalts of the Waianaevolcanic series. The direction of groundwater flow in this Ewa-Kunia Aquifer System is tothe south-southwest;
• Within the basal aquifer, flow across the Waianae/Koolau unconformity is from the Koolauto the Waianae due to higher hydraulic heads in the Koolau. Therefore, the Waianae doesnot discharge to the Koolau. Because impacts from infiltrating perched groundwater arelimited to the Waianae aquifer (or Ewa – Kunia Aquifer System), all potential downgradientreceptors are therefore located within the Waianae aquifer only. Discharge of the Waianaeaquifer would be to downgradient wells, and via leakage through the coastal caprock; and,
• The Hawaii Country Club (HCC) well is the nearest well potentially downgradient of theKVA. Hydrogeologic data are not definitive as to which aquifer the well is constructedwithin. However, the best professional judgment is that the well is completed in theWaianae aquifer, but due to proximity, is likely to be influenced by the Koolau aquifer(or Waiawa – Waipahu Aquifer System). The estimated travel time to the HCC well from theKVA is about S years or less. Other downgradient wells in the Waianae aquifer include theBoard of Water Supply (BWS) Honouliuli I and II wells, and the US Navy’s Barber’s PointShaft. All existing wells to the east of the Honouliuli wells, including the Kunia I/IIwells, are constructed in the Koolau aquifer.
5.4 Summary of RI Data Collection Activities
The overall goal of the RI field sampling activities was to estimate the nature and extent ofimpacts from COPCs at known and suspected source areas, and to characterize the chemicalspresent in sufficient detail to prepare a BRA and FS. Data required to support these goalsinclude information on geology, hydrogeology, soils, surface water and sediments, and the natureand extent of chemicals throughout pertinent environmental media.
The RI/FS Work Plan prepared by EPA identified the following “known” sources (where chemicalshave been observed) which are collectively referred to as the KVA:
• Kunia Well Spill Area;
• Former Fumigant Storage Area, and
• Former Fumigant Mixing Area.

Additionally, suspected sources of potentially hazardous chemicals (Other Potential SourceAreas) were selected by EPA based upon a review of historical activities at the Oahu Plantation.Releases of potential hazardous chemicals were not known to have occurred at these areas. Theother potential source areas investigated during the RI include (sec Figure 12 for locations):
• Perimeter Areas of the Former Fumigant Storage and Mixing Areas in the KVA;
• Former Fumigant Storage Area near Field 32;
• Empty Former Fumigant Drum Burial sites;
• Former Underground Storage Tank (UST) sites;
• Methyl Bromide Cylinder Burial Site in Field 71, and
• Current Soil Fumigant Storage Facility.
Although not identified as an Other Potential Source Area in the RI/FS Work Plan, the ExcavationPit Soils Natural Attenuation Area in Field 8 was also investigated during the RI at the requestof EPA. Subsequent to the RI, two newly identified Other Potential Source Areas were sampled;the Rag Disposal Area near Field 202A and the Former Fumigant Mixing Area near the KarstenWarehouse in the Poamoho Section (see Figure 12 for locations of all three of these areas).
These known and suspected source areas were investigated under the following media-specificgroupings:
• Soils. Includes surface and vadose zone soils in the KVA, as well as soils associated withthe Other Potential Source Areas;
• Surface Water and Sediment. Surface water and sediments arc associated with the ephemeralstream gulch northeast of the KVA, the smaller ravine southeast of the KVA, and theassociated run-off pathways. and
• Groundwater. Consists of the perched groundwater zone and basal aquifer in the KVA anddowngradient plume.
5.4.1 Kunia Village Area Soil Sampling
A total of 45 boreholes were drilled and sampled throughout the KVA. A total of 159 soil sampleswere collected from the 4S boreholes. Soil samples in the near-surface zone were collected atdepths of 0.5, 2, and 5 feet below ground surface (bgs). For subsurface soils above the perchedwater table (vadose zone soils), samples were collected at additional depths of l0, 15, and 25feet or until the perched aquifer was intercepted. Soil samples in the Former Fumigant MixingArea were collected at depths of 1 and 3 feet bgs.
Additional soil samples were collected from nine boreholes /ed in the Former Fumigant StorageArea of the KVA. The nine boreholes were drilled to further characterize the extent of COPCsdetected in deeper soils (i.e., below 30 ft depth) during drilling of monitoring wells MW-3 andMW-3S. A total of 42 samples were collected from the 9 boreholes. Soil samples were collected atten-foot depth intervals from each borehole starting at a depth of 25 to 30 feet bgs andcontinuing until encountering weathered basalt or auger refusal. The sampling frequency wasincreased to every five feet in acres where potentially higher concentrations of COPCs wereanticipated. Following completion of the RI, two additional boreholes were drilled and sampledin this area to f/er refine the distribution of contamination and assist with locatingextraction wells installed for the phytoremediation treatability study. Also, a total of 40 soilsamples were col1ected from IR boreholes in the Former Fumigant Storage and Mixing Areas duringinstallation of perched groundwater extraction wells in support of the phytoremediationtreatability study.
Additional data are needed to the southeast of Extraction Well 32 and to the south of MonitoringWell 16 to delineate the extent of soil contamination exceeding residential soil preliminaryremediation goals. Sampling to eliminate this data gap will be conducted during remedial design.
To evaluate chemical concentrations present in the soil air space, soil vapor sampling wasconducted at a depth of 11 feet bgs in two boreholes located in the Former Fumigant Storage Areaand two boreholes in the Kunia Well Spill Area. EPA also collected two soil vapor samples inNovember 1997. One sample was collected in the Kunia Spill Area and the other was collected inthe Former Fumigant Storage Area.
5.4.2 Kunia Village Area Surface Water and Sediment Sampling
Surface water and sediment sampling was conducted in the ephemeral gulch northeast of the KVAthat eventually drains into the Poliwai Gulch, and the smaller ravine just to the southeast ofthe KVA. The focus of the surface water and sediment investigation was to determine if COPCs instormwater runoff and eroded soils are present in the ravine and gulch sediment/soil or surfacewater at concentrations that pose an unacceptable risk to human health.
Sampling included the collection of five se6iment samples along the northeast ephemeral gulch,three soil samples within the ravine southeast of the Kunia Spill Area, and two surface/nearsurface sampling locations in areas downgradient of both the Kunia Well Spill Area and theFormer Fumigant Storage Area. Surface water samples were collected from three locations alongthe flowpath of the ephemeral gulch northeast of the Former Fumigant Mixing and Former FumigantStorage Areas during a period of heavy sustained rainfall. One surface water sample was alsocollected from the excavation pit water contained within the fenced area of the Former FumigantMixing Area.
5.4.3 Kunia Village Area Perched Groundwater
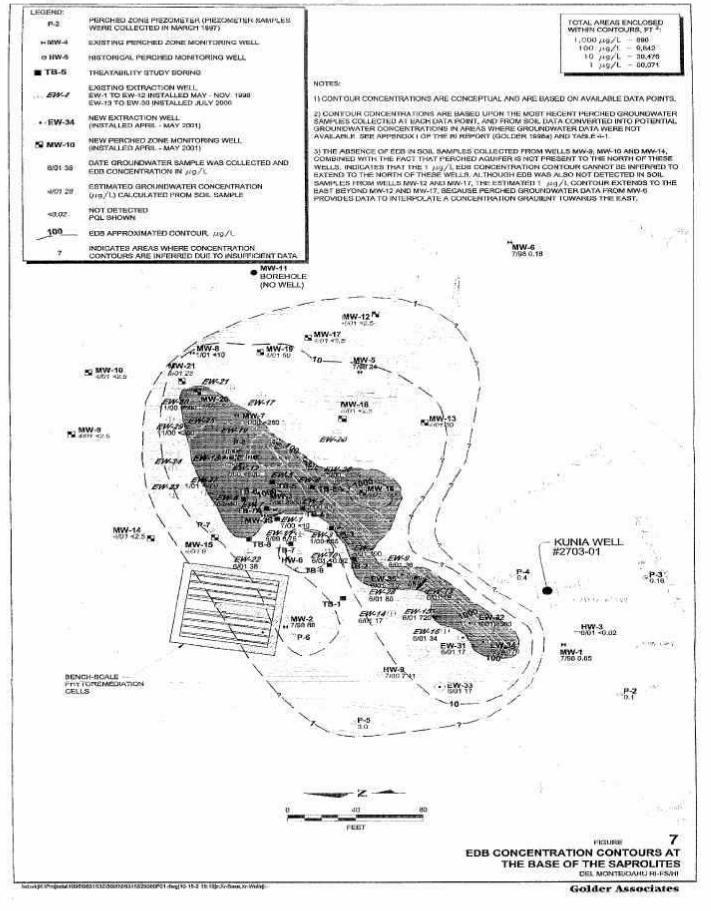
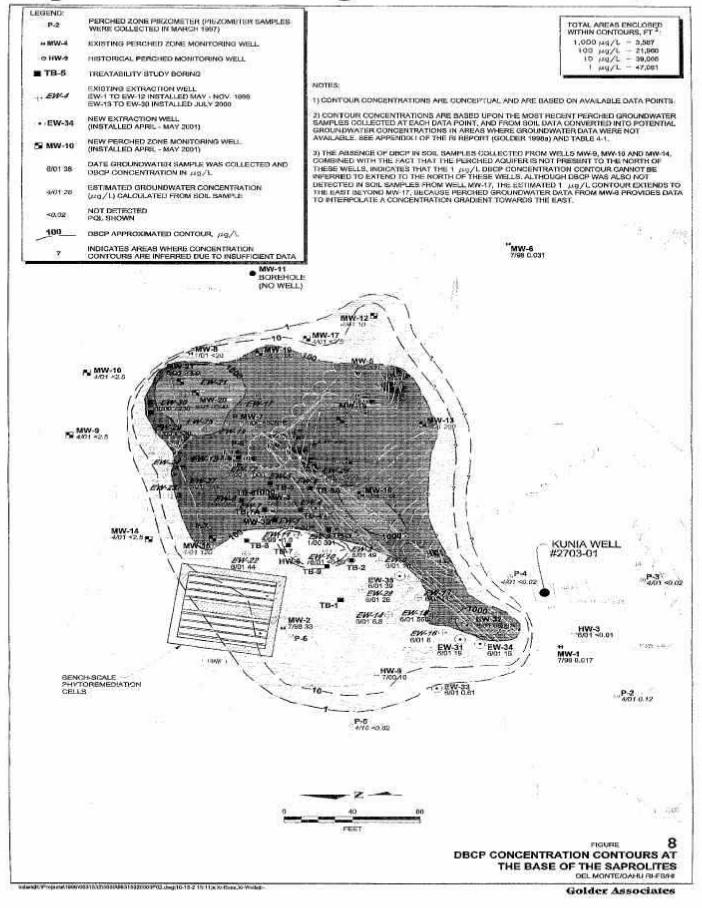
EDB, DCP and DBCP have historically been detected above their respective maximum contaminantlevels (MCLs) in the perched water-bearing zone in the vicinity of the KVA. The primary concernrelated to the residual COPCs is whether they pose an unacceptable risk to human health viatransport to either surface water via seeps or springs, or transport to the basal groundwater bymigration through the unsaturated basalt or through the Kunia Well annulus, or from potentialsurfacing of perched groundwater in the area.
Data collected to address these issues for the perched zone aquifer included measurements ofCOPC concentrations to assess the lateral and vertical distribution of chemicals in the perchedwater-bearing zone and measurements needed to assess the hydraulic characteristics andhydrogeology of the perched water-bearing zone including permeability, groundwater flowdirection and gradient.
The following methods of data collection were used:
• Piezometer Installation - Eight 1-inch diameter piezometers were installed in the upperportions of the perched water-bearing zone within the KVA. Data collected from thepiezometers were used to define the boundaries of the perched water-bearing zone,hydraulic properties of the perched groundwater system, and the lateral extent ofcontaminants.
• Perched Groundwater Monitoring Well Installation - Three perched zone monitoring wells(MW-1, MW-2, and MW-3) were installed in the KVA during an initial phase of field work.Data collected from the three initial perched zone monitoring wells combined with datacollected from the eight piezometers were evaluated and used to design the second phase offield investigation activities.
The second phase of field investigation included the installation of threeadditional monitoring wells to further define the lateral migration of COPCs in theperched groundwater system.
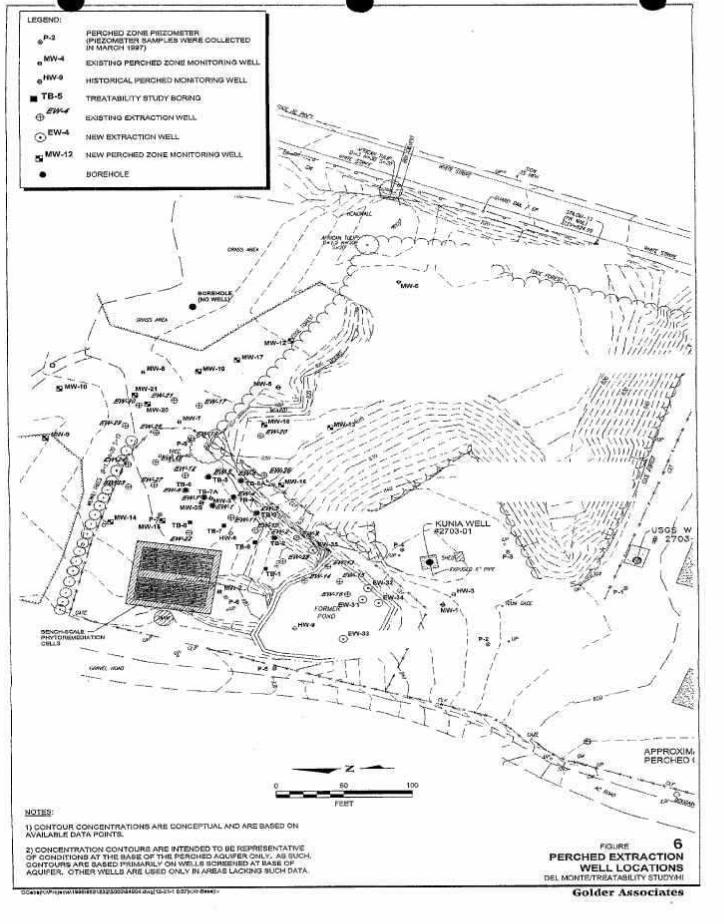
• In addition to the perched monitoring wells installed as part of the RI, a series of 3512-inch diameter perched aquifer extraction wells and 14 4-inch diameter monitoring wellswere installed after the RI in and adjacent to the Former Fumigant Storage Area and theFormer Fumigant Mixing Area in support of the Pilot-Scale Phytoremediation TreatabilityStudy. The 1ocations of all the perched zone monitoring and extraction wells (EW serieswells) installed to date are shown in Figure 6.
• Perched Groundwater Monitoring Well Sampling Program – In addition to the perchedgroundwater sampling conducted during monitoring well drilling and well installation, aquarterly groundwater sampling program was established for the six perched groundwatermonitoring wells (MW-l, MW-2, MW-3, MW-3S, MW-5, and MW-6). Locations of piezometers andperched zone monitoring wells are shown in Figure 6.
• Perched Groundwater Sampling – Perched groundwater samples were collected from EW serieswells during eight different sampling events between June 1998 and June 2001. Because oflow perched water levels and de-watering of the Former Fumigant Storage Area throughperched groundwater extraction, many of the EW series wells did not contain sufficientwater for sampling during some or all of the sampling events.
5.4.4 Basal Aquifer Investigation
The first step of the basal aquifer investigation was to conduct a series of activities, termed“vertical profiling” to evaluate the vertical distribution of chemicals within the Kunia Well,the possibility of chemical migration through the well’s annulus from the perched groundwateraquifer to the basal aquifer, and the suitability of the Kunia Well for use as a monitoringwe11. Based on the results of the profiling activity, the well was deemed suitable for use as amonitoring well and for aquifer testing.
The basal aquifer investigation proceeded with the following field investigative items:
Drilling and installation of a 993.5-ft deep, 8-inch diameter downgradient Basal We1I, locatedl56 ft south of the Kunia Well;
• Performance of a two-well pumping test using the Kunia Well as the pumping well, and thenew downgradient Basal Well as the observation well, to assess site specific hydraulicproperties and obtain additional chemical data;
• A program of periodic basal well sampling, involving the Kunia Well and new downgradientBasal Well. This monitoring program extended beyond the completion of the RI.
• Sampling of regional basal groundwater supply or monitoring wells including the ”NavyWell,” the Hawaii Country Club Well, a well at the US Air Force’s Waikakalaua Fuel StorageAnnex (PSA) area (Well ST12MW05) (the Waikakalaua FSA well ST12MW05 was determined to beneither upgradient or downgradient of the KVA and as such was only sampled once.), andHonouliuli II Well No. 2303-03. The Honouliuli II well provides additional water qualitydata from a portion of the Ewa-Kunia Aquifer System that is potentially downgradient ofthe KVA.
To eliminate data gaps from the Remedial Investigation, additional site characterization will beconducted during Remedial Design to determine the nature and extent of contamination in thebasal aquifer source area and the downgradient plume.
5.4.5 Other Potential Source Areas
The Other Potential Source Areas were selected by EPA based upon historical activities at theOahu Plantation. The primary purpose for evaluation of these sites was to determine whether theypose potential human health and environmental risks that require further characterization. Thefollowing sampling approach was applied in the Other Potential Source Areas.
Perimeter Areas of the Kunia Village Area – EPA identified areas where empty drums appeared tohave been stored around the perimeter of the KVA. One area is on the west side of themaintenance building; the second area is north of the Former Fumigant Storage Area. Fourperimeter area soil samples were collected at a depth of five feet from these areas.
Former Fumigant Storage Area Near Field 32 – Between the early 1940’s and 19S5, a soil fumigantcylinder and drum storage area was operated by Del Monte in a pineapple field area located nearthe current pineapple Field 32. The area encompasses approximately 90 feet by 110 feet.
Nine soil borings were installed in this area on a triangular grid with approximately 33-footspacing between holes. Soil samples were collected from depths of 0.5, 2, 4, 10, 15, and 25 feetbgs.
Empty Fumigant Drum Burial Sites – In the past, empty soil fumigant drums were buried inagricultural areas on the Oahu Plantation. This was done as specified on the FederalInsecticide, Fungicide and Rodenticide Act (FIFRA) product labels. Five of the 22 identifiedempty drum burial sites were selected for investigation. The sampling sites were chosen basedupon accessibility, geographic distribution, and to sample the potentially worst case scenarioin Field 60 where 8 of the 22 sites are located. The five sampling sites selected forinvestigation include:
• Empty Drum Burial Site behind the Poamoho Crateyard;
• Empty Drum Burial Site in Field F-90A (previously designated as Field 94);
• Empty Drum Burial Site in Field F-60;
• Empty Drum Burial Site in Field F-31, and
• Empty Drum Burial Site in Field F-32.
Geophysical equipment was used to delineate the boundaries of the five empty drum burial sites.Three boreholes were drilled at each empty drum burial site in the area identified by thegeophysical surveys to have the highest potential to contain buried material.
Physical evidence locating an empty drum burial site was not obtained at two of the initialsites investigated (Fields F-31 and F-32). Two additional empty drum burial sites wereidentified and sampled in Field F-60. where 8 of the 22 total buried drum sites are located.Additional geophysical surveys were performed at the two sites. The geophysical surveyssuccessfully determined the location of the two additional empty drum burial sites in FieldF-60.
Former Underground Storage Tank (UST) Sites – Three former UST sites were investigated as partof the RI (the Poamoho Crateyard, Maintenance Building Dip Pan, and Field 9 Booster Pump formerUSTs). The field investigations of the permanently closed USTs included collection of soilsamples in areas between or adjacent to the former USTs or associated piping where petroleumreleases may have occurred. The former UST sites had been permanently c1osed by removal prior tothe HDOH requirements for submittal of closure reports implemented in 1987. The RI sampling wasdesigned to supplement previous sampling at the sites and document UST closure.
Methyl Bromide Cylinder Burial Site in Field 71 – A buried metal cylinder containingapproximately 43.5 pounds of methyl bromide was reportedly buried in Field 71. Geophysicalsurvey equipment was used in an attempt to 1ocate the precise location of the buried cylinder.Although no definitive burial area was located using the geophysical survey, backhoe exploratorypits were excavated in the areas where two minor magnetic anomalies were identified. A third pitwas dug in the area based upon historical data. The excavated soil and the excavation pits wereinspected for any indication of buried debris. No indications of the buried methyl bromidecylinder were identified in any of the excavation pits; therefore, no soil samples werecollected for chemical analysis.
Current Soil Fumigant Storage Facility – The Current Soil Fumigant Storage Facility, aconcrete-lined above ground product storage, facility, was visually inspected by EPA during asite tour on April 29, 1997. Ka sampling was performed during the RI because there was noevidence that a release had occurred. The facility contains two 5,000-gallon stainless steelproduct storage tanks. Both tanks are contained in a covered concrete lined containment area andcan be visually inspected for cracks, 1eaks, or spills. Dispensing hoses are equipped with vaporreturn lines.
Excavation Pit Soils Natural Attenuation Area in Field 8 – As described above, the previousremedial actions included removal of approximately 18,000 tons of soils from the spill area, theformer mixing area, and the former storage area during 1981 and 1983. The excavated sods werespread in a thin layer over a fallow pineapple field area encompassing approximately 20 acres in
Field 8 located approximately 1,700 feet west of the Kunia Village Area. The excavation andnatural attenuation activities were approved by the State of Hawaii because the soil fumigantswere still registered for agricultura1 uses at the time.
Excavation was conducted with a backhoe and bucket excavator. The excavated soils were truckeddirectly to the soil spreading area. After spreading, approximately 20 tons of cow manure werespread onto the field area followed by harrowing to breakup the saprolite/soils. Since the1980s, four pineapple crops have been grown in the Natural Attenuation Area in Field 8.
During initial project scoping, EPA determined that it was not necessary to conductenvironmental sampling at the field 8 area. However, in response to community concerns, EPA andDel Monte decided to conduct environmental sampling in the area. The sampling program wasdesigned to determine if any residual contaminants remained in soil at levels that pose risks tohuman health or the environment. The investigation included collection of soil samples from theapproximate depths of 2, 10, and 15 feet in each of nine borehole locations distributed evenlythroughout the natural attenuation area.
Former Fumigant Mixing Area Near Karsten Warehouse – During the late l950s and early 1970s, afumigant mixing area near the Karsten Warehouse was used for diluting concentrated soilfumigants with diesel fuel. The soil fumigants included EDB and possibly Shell DD (a mixture of1,2-dichloropropane, 1,3-dichloropropene, 2,3-dichloropropene, 3,3-dichloropropene and traces oftrichloropropane). During the mixing operations, spills occasionally occurred. Rags used to wipedown the fumigant drums were discarded in the Rag Disposal Area discussed in the next section.
In September and October 2002, soil samples were collected within the 30 by 40 foot boundary ofthe Former Fumigant Mixing Area and analyzed for VOCs. The only compound detected at aconcentration greater than residential preliminary remediation goals (PRGs) was 1,2,3-TCP at 10micrograms per kilogram (µg/kg) at a depth of 15 feet bgs. EPA’s residential PRG for TCP is 5µg/Kg.
Additional sampling at depths below 15 feet bgs was conducted in February 2003 to determine theextent of TCP contamination. The second round of sampling showed TCP at levels below theresidential PRG with the highest level being 4A µg/Kg.
Rag Disposal Area Near Field 202A – The rags used in the Former Fumigant Mixing Area NearKarsten Warehouse were discarded in a debris disposal and burn area operated by the City andCounty of Honolulu. Sampling in this area was conducted in September and October 2002. Thesampling at the Rag Disposal Area differed from sampling at the Former Fumigant Mixing Areabecause the depth of the debris was unknown and the most critical samples would be the soilsamples beneath the disposal area.
Core samples were collected within the burn debris to a depth of approximately 3-5 feet beneaththe bottom of the debris for visual observation and field screening for the potential presenceof chemicals. Test pits identified the boundaries of the refuse disposal and burn site as anoblong area approximately 100 feet wide by 130 feet long. The nineteen samples were analyzed forVOCs, TPH-diesel Lindane, Toxaphene and Heptachlor.
No compounds were detected at concentrations above EPA’s residential PRGs. Three of the 19 soilsamples contained detected compounds: 1) benzene at 4.2 µg/Kg, which is less than the PRG of 600µg/Kg; 2) bromomethane at 7.5 µg/Kg, which is significantly less than the PRG of 3,900 µg/Kg;and 3) toluene at 5.2 µg/Kg, which has a PRG of 520,000 µg/Kg.
5.5 Nature and Extent of Contamination
The following is a summary of chemical compounds detected above regulatory screening criteria ineach of the study areas investigated as part of the RI. All four COCs (EDB, DBCP, DCP, and TCP)are classified as probable (B2) human carcinogens.
KVA Soil Samples – There were no COPCs detected in vadose zone soil samples above the EPARegion IX residential PRGs. (EPA’s PRGs are developed based on potential human health impactsand are commonly used as screening-level va1ues for comparison to site-specific concentrationsdetected during RI activities.) EDB. DBCP, and other VOCs were not detected in KVA shallow
vadose zone soils, with the exception of three samples in the former excavation pit where EDBwas detected at an estimated concentration of 0.37J to 0.38J µg/kg (see Table I). One soilsample at borehole number l contained total petroleum hydrocarbon (TPH) compounds in excess ofHawaii regulatory standards. Del Monte, in consultation with the HDOH, excavated the TPHimpacted soils, collected confirmatory samples from the excavation pit, and treated theexcavated soils by thermal desorption in compliance with applicable regulations. The cleanupactivities for petroleum constituents were documented in a Petroleum Release Report prepared byDel Monte and submitted to the State of Hawaii and EPA. Soil gas samples collected in the vadosezone did not contain concentrations of contaminants that would cause a risk.
Additional Soil Samples in the Former Fumigant Storage Area – Additional soil samples werecollected as part of Treatability Investigation Site Characterization activities. Results arepresented in Tables 2a and 2b. The primary purpose of the Treatability Investigation SiteCharacterization data was to provide additiona1 chemical data to optimize placement of a seriesof perched extraction wells needed for implementation of the Phytoremediation TreatabilityInvestigation. Several samples collected from soils at depths of 25 feet and deeper within theFormer Fumigant Mixing Area had detected concentrations of EDB, DRCP, and DCP. The highestcompound concentrations were typically detected at the base of the perched groundwater system.One exception to this is elevated levels of DBCP and DCP detected at depths of 30 to 40 feet intwo boreholes located in the northeastern portion of the Former Fumigant Storage Area. None ofthe detected concentrations indicate presence of dense nonaqueous phase liquid (DNAPL).
KVA Surface Water – Three surface water samples were collected along the flowpath of theephemeral gulch north of the Former Fumigant Mixing and Storage Areas. Water only flows in thegulch during heavy rainfall, and samples were collected during an unusually heavy rainfallevent. EDB and DBCP were detected in one of the samples at concentrations of l70 µg/L and 0.4µg/l respectively. A grab sample from the excavation pit collected at approximately the sametime contained similar concentrations of EDB and DBCP (167 and 0.3 pg/L, respectively). Duringthe time when the surface water samples were collected (March 1997), water within the excavationpit had risen to a historically high level due to the record rainfall during the winter of1996-97, and appears to have been flowing into the ephemeral gulch at a point where the surfacewater sample that exhibited the EDB/DBCP detections was collected. Because the samples bothcontained similar concentrations of EDB and DRCP the detections are believed to be the result ofwater from the excavation pit overflowing into the gulch. The other two samples collected in theephemeral gulch did not contain detectable levels of EDB and DBCP. Bromacil and lindane werealso observed in surface water samples, but at concentrations below MCLs or PRGs. With EPA*sapproval, Del Monte constructed an earthen berm to prevent potential future stormwater runofffrom the excavation pit as an interim measure during completion of the RI/FS. Additionalstormwater runoff samples were collected during October 1999. EDB and DBCP were not detected inthese samples.
The pit filled on a seasonal basis, but did not contain water every year. Del Monte personnelhave stated that rain water collected in the pit during just 3 of the 10 years before it wasbackfilled in October 1999. As a result of the backfilling, surface water no longer collects inthe area.
KVA Perched Groundwater – Samples collected from portions of the perched groundwater systembeneath the KVA indicated the presence of EDB, DBCP, DCP, TCP, benzene, and lindane in excess ofMCLs or PRGs. A summary of results for all perched zone monitoring wells and extraction wellsfor EDB, DBCP and DCP is presented in Table 3. The concentrations of these compounds aregenerally lowest in the Kunia Well Spill Area and the Former Fumigant Mixing Area. The highestdetected concentrations during the RI were generally detected in the Former Fumigant StorageArea in the vicinity of wells MW-3 and MW-3S. The large number of extraction and monitoringwells installed after the RI as part of the phytoremediation treatability study indicateadditional areas with high concentrations, including areas northeast of the Former FumigantStorage Area and areas to the southwest in the vicinity of the 1977 EDB spill (Figures 7, 8 and9). The results of the RI and subsequent Treatability Study work indicate that chemical impactsto perched groundwater are limited to an area roughly 400 ft by 400 ft at the Kunia VillageArea.
Hydropunch and monitoring well sampling of the perched groundwater system, as well as soilsampling results, indicates that contaminant concentrations are generally highest at the base ofthe perched groundwater system. One exception to this is the area around MW-3S, TB-4, TB-5, and
TB-6 (center of the Former Fumigant Storage Area) where concentrations of DBCP and DCP aregenerally highest at a depth of 30 to 40 feet. Outside of the MW-3S area contaminantconcentrations were generally present only below 50 feet.
Basal Aquifer Sampling Results – The presence of COPCs in the basal aquifer beneath the KVA wasinvestigated through the collection of groundwater samples from the Kunia Well and the new BasalWell (State Well No. 2703-02). Multiple samples have been collected from both wells and testedfor the full list of preliminary COPCs evaluated during the RI/FS. Results are presented inTable 4. EDB, DBCP, and TCP are the only compounds, that have been detected in either well aboveHDOH drinking water MCLs. The concentrations of EDB detected in the Kunia Well ranged from lessthan the detection limit to D.22 µg/L. DBCP ranged from 0.64 to 1A µg/L The concentrations ofEDB and DBCP detected in the Basal Well ranged from 0.1 to 0.26 µg/L and 0.66 to 0.93 µg/L,respectively. The Hawaii drinking water standard for EDB and DBCP is 0.04 µg/L. Theconcentrations of TCP ranged from non-detected to 1.0 µg/L in the Kunia Well and non-detected to0.8 µg/L in the Basal Well. The Hawaii drinking water standard for TCP is 0.6 µg/L. During theRI, it was determined that the Kunia Well annulus does not currently constitute a significantconduit for migration of constituents into the basal aquifer.
Regional basal wells were also included in the groundwater sampling program: the “Navy Well,”HCC Weil, Well ST12MW05 at the Air Force Waikakalaua FSA, and Honouliuli II Well 2303-03.Results are presented in Table 5 and are summarized below. Table 6 presents results fromregional basal well sampling conducted by the HDOH.
• The Navy Well is an upgradient well located approximately 1 mile north of the KVA. Thewell is completed within a transitional zone between the Schofield High-level Water Bodyand the Pearl Harbor Basal Aquifer. TCE was detected in the Navy Well at a maximumconcentration of 3.0 pg/L.
• The HCC well, located approximately l.5 miles south of the KVA, is the nearest potentiallydowngradient well. While there is some uncertainty as to which aquifer the well iscompleted in, the best professional judgment is that the well is completed in the Waianaeaquifer. However, even if the well is within the same aquifer as the Kunia We11/BasalWell, it may not be located on the downgradient flowpath from the KVA. EDB was detected intwo rounds of samp1ing at concentrations of 0.025 and 0.019J µg/L. DBCP was detected atconcentrations ranging from less than the detection limit (0.02 µg/L) to 0.071 µg/L. DCPand TCP were detected only during the Jul-98 sampling round below the laboratory’spractical quantitation limits at estimated concentrations of 0. l4 and 0.22 µg/L,respectively. The drinking water standards for DCP and TCP are 5.0 and 0.6 µg/L,respectively.
• TCE was detected at a concentration of 0.5 µg/L in well ST12MW05. The Air Force we11 islocated approximately 1.5 miles east of the KVA and is completed within the Koolau portionof the Pearl Harbor aquifer.
• There were no compounds detected in the Honouliuli II Well during the May-98 and Jul-98sampling rounds.
Other Potentia1 Source Areas – Other Potential Source Areas identified in the RI/FS Work Plan(ICF 1997), two additional empty drum burial sites, and the Natural Attenuation Area in Field 8were investigated as part of the RI. The Rag Disposal Area Near Field 202A and the FormerFumigant Mixing Area Near the Karsten Warehouse were investigated subsequent to the RI. With oneexception, no COPCs were identified at any of the Other Potential Source Areas above residentialPRGs or Hawaii action levels for TPH. The one exception is the presence of TPH-diesel compoundsdetected near a former underground storage tank located at the Field 9 Booster Pump site. Soilsamples co1lected at depths of l6 ft and 25 ft bgs had detected TPH concentrations in excess ofthe State of Hawaii Tier 1 Action Levels. In September 1998, Del Monte, in consultation with theState of Hawaii, excavated the petroleum impacted soil, conducted confirmation sampling, andtreated the impacted soils by thermal desorption at a State approved facility. The cleanupactivities for petroleum constituents were documented in a Petroleum Release Report submitted tothe State of Hawaii and EPA.
Based on the results of the RI, no further response actions arc necessary at the Other PotentialSource Areas.
5.6 Contaminant Fate and Transport
Fate and transport analysis was conducted to estimate exposure point concentrations for therelevant exposure pathways. The primary aims of this analysis were as follows:
• Identification of the relevant contaminant exposure pathways. An exposure pathwaydescribes the processes that link a chemical source to a potential receptor.
• Assessment of the environmental fate of COPCs along these pathways to describe thebehavior of each COPC in the environmental media in which it is transported, and
• Estimation of the resulting exposure point concentrations of COPCs to potential pathwayreceptors.
The potential exposure pathways considered included: 1) direct exposure to COPCs in site soils;2) airborne exposure to COPCs in on-site soils; 3) exposure to COPCs in surface water; and 4)exposure to COPCs via groundwater. There is currently no significant shallow soil or soil gascontamination present in the KVA, so exposure pathways 1 and 2 are not considered importantpathways. Because the excavation pit has been filled in, there is no longer the potential forexposure to contaminated surface water in the KVA, eliminating pathway 3. There are no directexposure pathways to the perched aquifer as it is not a drinking water source and it does notpose a significant risk from volatilization and inhalation exposure to COPCs. The only exposurepathways warranting detailed contaminant fate and transport evaluation are related to basalgroundwater. Thus, the focus of the transport analysis was on the basal aquifer. The primary aimof the fate and transport evaluation was to estimate the potential receptor point concentrationsin the basal aquifer that may occur from the KVA basal groundwater impacts.
Understanding the interaction between the perched and basal aquifers was an important element ofthe basal aquifer fate and transport modeling. This understanding is based on the recognitionthat levels of chemicals in the perched and basal aquifers have been declining for nearly 20years. These declines have been due at least in part to the source removal activities whichoccurred in the early 1980s, and pumping from perched groundwater extraction wells and the KuniaWell through the early 1990s. Due to the source removal work and attendant concentrationreductions, levels of chemicals in the basal groundwater are not expected to increase in thefuture. Therefore, the prediction of future impacts to downgradient basal aquifer water qualitycan be conservatively made using current concentrations.
The general approach to the contaminant transport model, BIOSCREEN, was to assess the potentialdowngradient extent of COPC migration from the KVA in the Waianae aquifer. Modeling wasconducted for the following two sets of analyses:
• Modeling of the present day downgradient impacts due to historical (1980 through 1997)COPC occurrences in basal groundwater (conducted for EDB and DBCP only); and
• Modeling of future impacts (present to future) due to the currently observed KVAconcentrations (conducted for EDB, DBCP, TCP, and DCP).
The primary results and conclusions of the fate and transport analysis are summarized below.
• The only significant current source of chemicals to the basal aquifer is area wideinfiltration of perched aquifer groundwater in the immediate vicinity of the KVA. TheKunia Well, while it may have served as a conduit for COPCs in the past, does notcurrently represent a significant conduit for vertical migration of chemicals to the basalaquifer and has not since about 1990. Even during the time period when the well may haveserved as a conduit. pumping of the well was sufficient to contain chemicals, whichreached the basal aquifer via this mechanism. Therefore, fate and transport modelingconsidered the impacts from KVA-area wide infiltration and not leakage through the KuniaWell annulus. The areal extent of the perched aquifer contaminant source to the basalaquifer can be approximated by the area exceeding 1 µg/L on Figures 8 and 9.
• Based on capture zone analysis, pumping of the Kunia Well prior to its disconnection fromthe potable water supply in April 1980 is believed sufficient to have contained basalaquifer COPCs and prevented migration away from the KVA. Pumping between 1980 and 1994 mayhave been sufficient to limit, perhaps significantly so, downgradient migration; however,it has been conservatively assumed in the RI that pumping after 1980 was not sufficientfor containment. Transport modeling of impacts from historical COPC occurrences istherefore conducted for basal groundwater impacts that occurred after April l 980.
• Contaminant transport modeling was conducted for EDB and DBCP for the historical modelingruns, and for EDB, DBCP, TCP, and DCP for the predictions of future migration. These fourcompounds are the only compounds consistently detected in the basal aquifer at the KVA.Historica1 data are not adequate to model prior occurrence of TCP and DCP.
• The thickness of basal groundwater impacted by chemicals infiltrating from the perchedgroundwater is estimated to he small in relation to the screened interval of the KuniaWell. A conservative estimate suggests that it does not exceed a thickness of about 1 to10 feet near the water table surface directly beneath the perched aquifer source area.
• The Kunia Well is located within the source area of COPCs in the basal aquifer, or isextremely close to it, and capture zone analyses predict that the well draws waterprimarily from the source area during sampling events. Chemical data obtained from thewell can therefore be used to estimate source area concentrations for subsequent transportmodeling. Because the well likely draws water from most of the 150-foot screened interval,and chemicals are believed restricted to the upper 1- to l0-feet, contaminantconcentrations observed in the well during pumping need to be increased to reflect thelevels considered representative of the surface impacted layer. The results of thevertical profiling are believed more representative of these 1evels than those measuredduring pumping. Estimates of EDB and DBCP impacts to the basal groundwater from perchedgroundwater generally support the view that vertical profiling results are representativeof the near water table surface source layer. EDB and DBCP levels measured during verticalprofiling were 5 to l0 times and 2 to 3 times higher than levels measured during pumping,respectively. For modeling potential impacts to basal groundwater quality, these factorswere used to adjust historical Kunia Well data obtained during pumping to reflect theconcentration in the thin, near surface impacted zone.
• Any potentia1 receptors of chemicals migrating away from the KVA are associated with theWaianae basalts, as groundwater beneath the KVA is within the Ewa-Kunia Aquifer System ofthe Pearl Harbor basal Aquifer Sector. Waipahu Aquifer System wells, such as the Kunia Iand II wells, are not at risk as they are hydraulically separated from the Ewa-KuniaAquifer System by the higher heads of the Waipahu Aquifer System. The higher head is dueto the greater recharge that occurs to the Waipahu Aquifer System and the discontinuitybetween the two aquifer systems, which acts as a barrier to water movement. Potentialdowngradient receptor points therefore include the HCC well, I4onouliuli I and U wells,and possibly other Ewa-Kunia Aquifer System wells further beyond the Honouliuli wells,such as the Barber’s Point Shaft. Though the wells are believed installed in the sameaquifer as the Kunia Well/Basal Well, there is uncertainty whether these wells are locatedalong the downgradient flowpath from the KVA.
• Although there is limited water quality data from the HCC Well prior to 1993, the firstobserved occurrence of DBCP was in 1993. Estimates of groundwater travel time from the KVAto the HCC well (about 5 years or less) indicate that DBCP should have been detected atthe well earlier than l993 if it was indeed derived from the KVA. But, if Kunia Wellpumping after l980 was more effective than assumed at containing DBCP. then the traveltime of DBCP to the HCC well could have been delayed, and DBCP occurrences at the HCC wellcould still be attributable to the KVA. There are also other sources of DBCP in centralOahu that could account for the HCC well contamination. Lt is not certain that the HCCwell is located on the downgradient flowpath from the KVA or is in the same aquifer.Hydraulic gradient data suggests the well is not on the flowpath from the KVA. Because ofthese uncertainties, it is not possible to determine whether the observed DBCP isassociated with the KVA. If the DBCP at the HCC well is attributable to the KVA, it isunlikely that the concentrations will increase in the future because sufficient time haspassed for the peak concentrations of a potential plume to have reached the well.
• For the Honouliuli II wells, travel time estimates indicate that KVA chemicals should havealready reached the wells, if they were to do so, but no chemicals had been observed as ofsampling conducted in December 1998.
• As illustrated in Figure 10, the modeling of historical impacts indicates that thefurthest downgradient distance of EDB and DBCP in excess of MCLs, assuming a “reasonableworst case” scenario, is about 4,500 feet from the KVA for both compounds. Using moretypical values for the various transport input parameters results in “average case”estimated travel distances of about 2,500 feet for EDB and 2,900 feet for DBCP. Therefore,under all scenarios, including the reasonable worst case scenario, the anticipated traveldistances of EDB and DBCP in excess of MCLs are still within the Del Monte Oahu Plantationproperty boundaries under existing pineapple fields.
• Basal aquifer impacts may extend beyond these distances, for instance to the HCC well andpossibly to the Honouliuli wells, but not likely at levels that are above drinking waterstandards. The model predicts, using the “reasonable average case” input parameters,current EDB and DBCP levels at the HCC well of approximately 0.01 to 0.02 µg/L(approximately equivalent to the method detection limits). This assumes the HCC well islocated along the downgradient flow path from the KVA, which is not certain. Recent DBCPanalytical results for the HCC well were 0.06 µg/l (April 1999) in sampling conducted byHDOH EDB was less than the quantitation limit of 0.04 µg/L. If the observed DBCP at theHCC well is associated with the KVA, then the model used herein is matching the observeddata reasonably well. The model predicts declines in DBCP concentrations in the vicinityof the HCC well in the future if the source area concentrations continue to decline.
• It is also possible that impacts above the detection limit, but below the MCL, may extendto the Honouliuli wells. Under the reasonable worst case scenario, EDB and DBCP levelsshould fall in the range of about 0.01 to 0.02 µg/L. Under the average case scenario,however, the estimated levels for both compounds should be less than 0.01 µg/L. As withthe HCC well, it is not certain, however, if these wells are located on the downgradientflow path from the KVA. No COPCs have ever been detected at these wells, includingsampling conducted through 1997.
• Modeling of future impacts from present-day concentrations (which conservatively assumesconstant source area concentrations into the future) indicates that the estimated maximumfuture travel distance from the KVA to a downgradient MCL exceedance is about 3,000 feetfor DBCP (Figure 11). The maximum travel distance of groundwater exceeding the EDB MCL isestimated to be approximately 2,000 feet. The estimated MCL exeeedance travel distancesusing “average” parameters are about 1,300 and 2,000 feet for EDB and DBCP, respectively.Estimated travel distances for groundwater with DCP and TCP MCL exceedances are muchshorter (less than about 100 ft). These estimated travel distances are much smaller thanthe EDB and DBCP travel distances because KVA DCP/TCP concentrations barely exceed MCLs.
• These modeling results indicate that there is little likelihood of future impacts to anyexisting downgradient well at levels above MCLs even if current concentrations remainconstant in the KVA. In addition, the anticipated future travel distances to the EDB andDRCP MCLs are still within the Del Monte plantation’s property boundaries under existingpineapple fields.
• The estimates of travel distances are based upon conservative assumptions andcalculations, including reasonable worst case scenarios and, therefore, likelyoverestimate actual conditions. For instance, the modeling is based on a water tablesurface concentration, which ignores typical well construction practices on Oahu wherewells are screened over large intervals. Also, no downward gradients or dilution due toinfiltrating rain water were assumed. In addition, only a relatively small amount ofcontainment (25%) was assumed from pumping during the period 1980 to 1994, based on theminimum pumping rate over the period (4 hours per day twice per week at 325 gpm). Duringthe early 1980s, when levels of COPCs were highest in the Kunia Well, pumping wasconsiderably greater than the minimum. The actual pumping rate varied from a minimum of 8hours per day twice per week to more. frequent and sometimes continuous operation. If agreater amount of containment was occurring than was assumed in the model, then theestimated travel distances and downgradient concentrations (historically observed impacts)would be lower than those presented herein.
Actual travel distances will be determined by data collected from groundwater monitoring wellsto be installed during design.
6 Current and Potential Future Site and Resource Uses
6.1 Land Uses
The Del Monte Oahu Plantation is a 6,000 acre pineapple plantation located approximately 15miles from Honolulu. The closest town is Wahiawa, which is located approximately 2 miles fromthe KVA. The Kunia Section of the Site extends to the southern boundary of Schofield ArmyBarracks and Wheeler Military Airfield and the Poamoho Section of the Site is north of theSchofield Army Barracks and Wheeler Military Airfield.
The Oahu Plantation facility is an active agricultural operation currently managed by Del Monte.While comprised primarily of agricultural areas, the facility also contains two company operatedhousing complexes (Kunia Village and Poamoho Village), equipment maintenance areas, chemicalstorage areas, warehouses, and administrative buildings. A fresh pineapple packing facility islocated within the property boundaries. The Kunia Village housing complex is in close proximityto the primary source areas located around the Kunia Village well and the surrounding historicalchemical storage and handling areas.
The United States Army plans to purchase a portion of the agricultural lands in the northernpart of the Kunia Section in order to develop the area as a target range and medium weightvehicle training area.
EPA plans to propose a Partial Site Deletion to remove the Poamoho Section from the Site. ThePartial Site Deletion will be published in the Federal Register following a public commentperiod.
Aside from the planned United States Army acquisition, it is anticipated that the landsencompassed by the Site will remain in agricultural use.
6.2 Groundwater Uses
The shallow, perched groundwater is not a current or potential future source of drinking waterbecause it does not provide sufficient sustainable yield for use as a water supply. Therefore,no drinking water or irrigation production wells pump from the shallow, perched groundwateraquifer.
There are production wells in the deeper basal aquifer in both the KVA and in downgradientareas. The Kunia Village Well was formerly used for drinking water purposes, but wasdisconnected from the potable water supply system in April 1980 after contamination wasdiscovered in the well. Between 1980 and 1994, the well was pumped periodically with the waterdischarged directly to non-crop fields.
It is expected that the Kunia Village Well may again be available for use as a source ofdrinking water after the perched and basal aquifer remedies are complete (includingpost-operation monitoring) and all contaminants in the basal aquifer are below drinking waterstandards. The estimated timeframe for remediation and post-operation monitoring is 10 to 15years.
The drinking water for the KVA is presently supplied primarily by the “Navy Well” andoccasionally, since 1991, by Del Monte Well No. 4. Both the “Navy Well” and Del Monte Well No. 4are located approximately 1.5 miles north (upgradient) of Kunia Village. These two drinkingwater supply wells have been approved by the HDOH. A packed tower aeration facility (i.e., anair stripper) was installed in 1989 to remove volatile organic compounds possibly migrating inthe high-level aquifer groundwater from the Schofield Army Barracks Superfund Site. The drinkingwater supply for the Kunia Vi1Iage has been treated using the packed tower aeration facilitysince 1991.

The HCC well is the nearest basal well potentially downgradient of the KVA. I3ydrogeologic dataare not definitive as to which aquifer the well is constructed within. However, the bestprofessional judgment is that the well is completed in the Waianae aquifer (which is the sameaquifer as the Kunia Village Well). The estimated travel time from the KVA to the HCC well isabout 5 years or less. The HCC well is currently treated for drinking water purposes. Drinkingwater for the golf course is supplied by Del Monte. from the potable water system that servesKunia Village. Other downgradient wells in the Waianae aquifer include the Honouliuli BWS wellsand the US Navy’s Barber*s Point Shaft.
In addition to being used for drinking water purposes, basal wells in the Waianae aquifer arepumped and used for irrigation purposes. Basal groundwater extracted and treated pursuant to theremedial action selected in this ROD will be used for irrigation of pineapple crops on the Site.
A11 existing wells to the east of the Honouliuli I wells, including the Kunia I/II wells, areconstructed in the Koolau aquifer. Within the basal aquifer, water flows from the Koolau aquiferto the Waianae aquifer due to higher hydraulic heads in the Koo1au. Water does not flow from theWaianae aquifer info the Koo1au aquifer. Basal wells in the Koolau aquifer are used for both /gwater and irrigation purposes.
Future basal groundwater use in the area is expected to be similar to current use, with activeextraction occurring for potable and irrigation uses. The potential use of basal groundwater fordrinking water purposes is the most conservative scenario used as a basis for reasonableexposure assessment assumptions and risk characterization conclusions discussed in Section 7.0.
7 Summary of Site Risks
A Baseline Risk Assessment (BRA) was prepared in 1999 by Del Monte’s consultants with EPA andState oversight (Golder and GlobalTox, 1999). The BRA was prepared in accordance with EPAguidance (EPA Risk Assessment Guidance for Superfund, Parts A-D (RAGS) (EPA 1989a, 1991b,l991c, 1991d, 1998a)).
The BRA estimates the human health and environmental risks that the site could pose if no actionwere taken. It is one of the factors that EPA considers in deciding whether to take action at asite. The risk assessment is also used to identify the contaminants and exposure pathways thatneed to be addressed by the remedial action. At the Del Monte Site, EPA's decision to takeaction is based principally on the potential future risks to Kunia Village residents anddowngradient residents within 1.5 miles of the KVA if no cleanup actions were taken to addresscontaminated groundwater. This section of the ROD summarizes the results of the BRA for the DelMonte Site.
7.l Summary of Human Health Risk Assessment
This summary of human health risk includes sections on the identification of COCs, exposureassessment, toxicity assessment, and risk characterization. As is described above in Section 5.8and in more detail in the BRA (Golder and GlobalTox, 1999), the only exposure pathways that arecomplete or potentially complete and contribute substantially to the estimated risks aregroundwater-related pathways. Thus, this section focuses only on risk associated with variouscurrent and future groundwater exposure scenarios.
7.1.1 Identification of Chemicals of Concern
This section describes the screening process used to determine the COPCs that were retained forevaluation in the BRA. The approach was conducted in accordance with RAGS Part A, Section 5.9,which describes screening as an essential aspect of producing a risk assessment that evaluatesconstituents that are important at a site. These important constituents are the COPCs. Theresults of the BRA are used to determine which of the COPCs should be considered as COCs for theSite.
For the BRA, EPA Region IX PRGs (EPA, 1999) were used to represent the Screening ToxicityValues. PRGs are risk-based screening tools used for evaluating contaminated sites. lf themaximum value for a chemical detected in a medium does not exceed the screening value, it doesnot represent a significant risk and was not carried further through the risk characterization
process. Conversely, if the maximum value detected in a medium exceeds the screening value itmay represent a potential risk and is retained for further risk characterization analysis.Specifically, the PRGs applied as Screening Toxicity Values were the residential tap water PRGsestablished for exposure to groundwater through ingestion, dermal contact and inhalation ofvolatile organic compounds.
Summary of COPC Screening for Groundwater – The maximum concentrations of several constituentsdetected during RI and post-RI sampling activities at the Kunia Village and Basal Wells exceededthe EPA Region IX PRGs. These constituents included EDB, DBCP, DCP, and TCP. Table 7 providesdetailed information on the range of concentrations detected, the frequency of detection and theexposure point concentrations used for current and future exposure scenarios for each of theseconstituents. These same constituents were detected during regional groundwater sampling at theHCC Well. As shown in the table, EDR and DBCP were the most frequently detected COCs ingroundwater at the site.
The arithmetic mean concentration shown in Table 7 was used for the calculations of ”average"potential risk and either the maximum detected concentration or the 95th percentile (95%) upperconfidence limit (UCL) on the arithmetic mean concentration (whichever was lower} was used asthe exposure point concentration for calculating the maximum potential risk for each COC in eachwell group.
7.1.2 Exposure Assessment
Exposure refers to the potential contact of an individual (or receptor) with a chemical.Exposure assessment is the determination or estimation of the magnitude, frequency, duration,and route of potential exposure. The exposure assessment methodology used in the BRA follows theprocedures outlined in Chapter 6 of RAGS, Part A (EPA, 1989a). This section briefly summarizesthe potentially exposed populations, the exposure pathways evaluated, and the exposurequantification from the BRA performed for the Del Monte Site. Considerably more detail on theexposure assessment can be found in the RA (Golder and GlobalTox, 1999).
Potential human exposures under current conditions were evaluated based on the assumption thatthe reasonable maximum exposure scenario is inhalation exposure to untreated HCC well water byHCC golf course maintenance workers. Only the inhalation pathway is evaluated because ingestionand dermal contact to irrigation water by maintenance workers is expected to be minimal. Waterused for drinking at the golf course is currently treated so this exposure route is notapplicable. There is no current exposure to con/ants in basal groundwater in the KVA because theKunia and Basal Wells are not used for drinking water purposes. There are no other currentreceptors with substantive exposures to contaminated groundwater.
Hypothetical future human exposure scenarios were evaluated to assess whether response actionsmay be necessary to address potential future risks. Hypothetical future receptors are assumed tobe:
• Kunia Section irrigation workers and residents exposed through inhalation (for sprayirrigation workers) and dermal contact (for drip irrigation workers) with contaminantsfrom the use of Kunia Well water without treatment.
• Hypothetical, future residents exposed to potentially contaminated groundwater, withouttreatment, through ingestion, inhalation and dermal contact at 1.5 miles downgradient(near the HCC Well), 3 miles downgradient, and 4.5 miles downgradient of the KVA.Residential exposure to contaminants could occur through the use of groundwater fordomestic purposes, such as ingestion of tap water, inhalation of contaminants from waterused for bathing, cooking and laundering, and dermal contact with the water.
The l.5-mile increment is based upon future hypothetical residential use of untreatedgroundwater from the HCC Well. The 3-mile increment would represent untreated groundwaterbetween the HCC and Honouliuli II Wells while the 4.5-mile increment would representuntreated groundwater located near the aquifer boundary of the Honouliuli Wells. It shouldbe noted that the fate and transport modeling indicates that the Honouliuli II Wel1 willnever be impacted above MCLs by contaminants from the Kunia Village Area under current andfuture conditions.

Based on potential for exposure frequency, duration, and estimated intake, potential residentsexposed to contaminated groundwater used for domestic purposes are expected to be the maximallyexposed population. The assumption that residents could be exposed to untreated groundwater fromthe Kunia Village Well or other downgradient production wells that become contaminated isconservative. There are not currently any wells serving untreated water for public drinkingwater supply from the contaminated portions of the basal aquifer. Further, regulations, such asthe Safe Drinking Water Act and Hawaii drinking water regulations, currently prohibit waterpurveyors from serving water contaminated in excess of drinking water standards to consumers.
7.1.3 Toxicity Assessment
The toxicity assessment identifies chemical-specific toxicity factors for each COC for thepurpose of determining individual and cumulative noncancer (i.e., Hazard Quotients [HQs]) andcancer (i.e., Incremental Cancer Risk [ICR]) risk values for the BRA. Table 8 shows the fourCOCs that are the major risk contributors for the Del Monte Site RA.
Toxicity values have been developed for evaluating potential human carcinogenic effects fromexposure to carcinogens. Potential human carcinogenic effects are evaluated using thechemical-specific slope factor and accompanying EPA weight-of-evidence determination. Slopefactors have been derived by EPA (and are published in the Integrated Risk Information System(IRIS} (EPA, 1997) or the Health Effects Assessment Summary Tables (HEAST) (EPA, 1998)) based onthe concept that for any exposure to a carcinogenic chemical there is always a carcinogenicresponse (i.e., no threshold level exists). Slope factors are used in risk assessment toestimate an upper-bound lifetime probability of an individual developing cancer as a result of aspecific exposure to a carcinogen.
A weight-of-evidence classification is assigned to carcinogenic substances based on the strengthof human and animal evidence of carcinogenicity. 7he EPA weight-of-evidence classifications areas follows:
Group A - Human carcinogenGroup B – Probable human carcinogenGroup Bl - Limited evidence of carcinogenicity in humansGroup B2 - Sufficient evidence of carcinogenicity in animals with inadequate or a
lack of evidence in humansGroup C – Possible human carcinogenGroup D - Not classifiable as to human carcinogenicityGroup E - Evidence of non-carcinogenicity in humans
Based on data from various animal studies and other scientific evaluations, all four COCs forbasal groundwater (EDB, DBCP, DCP, and TCP) are classified as probable (B2) human carcinogensfor an oral route of exposure. EDB and DBCP are also classified as probable human carcinogensfor the inhalation route. The carcinogenic oral slope factors (toxicity values) for these fourcompounds are shown in Table 8. The inhalation slope factors for EDB and DBCP are also presentedin Table 8.
At this time, slope factors are not available for the dermal route of exposure Thus, the dermalslope factors used in the assessment have been extrapolated from the oral slope factors. Achemical-specific oral-to-dermal adjustment factor is sometimes applied to the oral slope factorand is dependent upon how well the chemical is absorbed via the oral route. However, adjustmentis not necessary for the COCs evaluated at this site. Therefore, the same carcinogenic slopefactors presented in Table 8 for the oral route are used for the dermal route (see Table 8).
Systemic, toxic effects (other than cancer) may be associated with exposures to the COCs at theDel Monte Site. The toxicity value used to evaluate potentia1 noncancer (i.e, noncarcinogenic)effects is the reference dose (RfD) The RfD has been developed by EPA based on the assumptionthat thresholds exist for certain toxic effects. in other words, a certain amount (i.e., dose)of the chemical is required to be ingested, inhaled or absorbed through the skin to produce anundesirable noncancer health effect. In general, the RfD is an estimate of a daily exposurelevel for the human population, including sensitive subpopulations, that is likely to be withouta significant risk of noncancerous effects during a lifetime. The RfD is developed to reflectthe duration of exposure and the route of exposure (such as inhalation or ingestion).
The RfD has been developed based on dose-response data obtained from animal or human studieswith additional safety factors applied to reflect uncertainty in the information, asappropriate. The RfDs and primary target organs, as published by EPA in IRIS (EPA, 1997), HEAST(EPA, 1998), or Region IX PRG Toxicity Tables (EPA, 1999), are presented in Table 8.
RfDs have been developed for oral and inhalation routes of exposure, but not for dermalexposure. As was the case for the carcinogenic factors, the oral RfDs are used directly withoutadjustment to represent the dermal RfDs (see Table 8).
7.1.4 Risk Characterization
This section presents the results of the evaluation of the potential risks to human healthassociated with exposure to contaminated groundwater at the Del Monte Site. Exposure scenariosare evaluated by estimating the noncarcinogenic and carcinogenic risks associated with them.
For carcinogens, risks are generally expressed as the incremental probability of an individua1developing cancer over a lifetime as a result of exposure to the carcinogen. These risks areprobabilities that usually are expressed in scientific notation (e.g., 1 x 10⁻⁶). An excesslifetime cancer risk of 1 x 10⁻⁶ indicates that an individual has a 1 in l,000,000 chance ofdeveloping cancer as a result of site-related exposure. This is referred to as an "excesslifetime cancer risk" because it would be in addition to the risks of cancer individuals facefrom other causes such as smoking or exposure to too much sun. The chance of an individualdeveloping cancer from all other causes has been estimated to be as high as one in three. EPA’sgenerally acceptable risk range for site-related exposures is 10-4 to 10-6. An excess lifetimecancer risk of greater than one in ten thousand (1 x 10⁻⁴) is the point at which action isgenerally required at a site (EPA, 1991a).
The potential for noncarcinogenic effects is evaluated by comparing an exposure level over aspecified time period (e.g., a lifetime) with a RfD derived for a similar exposure period. Theratio of exposure to toxicity is called an HQ. An HQ less than one indicates that a receptor’sdose of a single contaminant is less than the RfD and that toxic noncarcinogenic effects fromexposure to that chemical are unlikely. HQs for all COCs that affect the same target organ(e.g., liver) are added together to generate the Hazard Index (HI). An HI less than oneindicates that noncarcinogenic effects from all the contaminants are unlikely. Conversely, an HIgreater than one indicates that site-related exposures may present a risk to human health.
Conclusions
Tables 9 and 10 present the risk characterization summaries for carcinogenic (Table 9) andnoncarcinogenic effects (Table 10). The risk estimates presented in these tables are based onreasonable maximum exposure (RME) and were developed by taking into account various conservativeassumptions about the frequency and duration of exposure to groundwater, as wells as thetoxicity of the primary COCs.
Key results for each exposure scenario are as follows:
Current HCC irrigation workers – The receptor for this scenario is a HCC golf course maintenanceworker that may be exposed to irrigation spray for 2.8 hours per day, 245 days per year. Duringthis time the worker may be operating the dry faucet valves of the system or maintaining golfcourse greens near the sprinkler irrigation system and is potentially exposed to contaminantsvolatilized from the irrigation water through ambient air inhalation.
The estimated excess lifetime cancer risk of 5.5 x 10⁻⁷. The highest estimated risk comes frompotential inhalation exposure to TCP (i.e., 5.4E-07). None of the chemicals of potential concernexceed an HQ of 1 for the exposure pathway. The HI for all contaminants via the inhalationpathway is 0.001. Because the cancer risks are less than 1 x 10⁻⁶ and the hazard quotient lessthan 1.0, continued use of HCC well water for irrigation activities is acceptable.
Hypothetical future Kunia Village residential exposure to untreated Kunia Well water – Thereceptor for this scenario is a future, hypothetical Kunia Village resident that may be exposedto contaminants in untreated basal groundwater from the Kunia Well During a lifetime theresident would potentially be exposed through ingestion of potable water, direct dermal contact
through residential water use (i.e., showering, bathing, laundry activities) and ambient airinhalation of contaminants volatilized from the water during residential use.
The estimated excess lifetime cancer risk for this scenario is 9.1x10⁻⁴. The highest estimatedrisk comes from inhalation exposure to TCP (4.9x10⁻⁴). Inhalation exposure to DBCP exceeds an HQof 1 (Hg = 2.5). The HI for all contaminants and pathways is 4.1. Therefore, the excess lifetimecancer risk for this scenario exceeds the lower end of EPA’s generally acceptable risk range of10-4 to 10-6 and the HI greater than one indicates that exposures may present a noncarcinogenicrisk to human health.
Hypothetical future Kunia Section irrigation workers potentially exposed due to use of untreatedKunia Well water for irrigation – The receptor for this scenario is a future hypotheticalirrigation worker (either drip or spray) that works approximately 2.8 hours per day, 24S daysper year (drip) or 3.1 hours per day, 252 days per year (spray). During this time the dripirrigation worker would be potentially exposed to through direct dermal contact to hands andarms during the installation or repair of drip tubing with untreated Kunia Well groundwater. Thespray irrigation worker is driving an irrigation truck up and down the field roads irrigatingthe Kunia Section of the plantation and would be potentially exposed to COCs that volatilizefrom the untreated irrigation water and could be inhaled through ambient air. Again, the use ofuntreated basal groundwater from the Kunia Well is not expected and is estimated for riskassessment purposes only.
The estimated excess lifetime cancer risk is 5.8x10⁻⁶ (drip workers) and 6.2x l0-5 (sprayworkers). The highest estimated risk for the drip irrigation worker comes from derma) exposureto EDB and TCP (3.5xl0-6 and 2.1x10⁻⁶, respectively). For the spray worker, the highestestimated risk is from inhalation exposure to TCP (6x10⁻⁵. None of the contaminants exceed an HQof l for the exposure pathways evaluated. The HI is 0.01 for the dermal pathway (drip worker)and 0.5 for the inhalation pathway (spray worker). The excess lifetime cancer risk for both ofthese scenarios exceeds the lower end of EPA’s generally acceptable risk range of 10-4 to 10-6and the HI less than one indicates that exposures do not present a noncarcinogenic risk to humanhea1th.
Hypothetical future (l.5 mi1e) downgradient residential exposure via untreated groundwater use -The receptor for this scenario is a future, hypothetical resident living 1.5 miles downgradientof the KVA that may be exposed to contaminants in untreated basal groundwater from the HCC Well.Potential residential exposure conditions are described above.
For the 1.5 mile location the estimated excess lifetime cancer risk is 1.7x l0-4. The highestestimated risk comes from inhalation exposure to TCP (l.lxl0-4). The remainder of the estimatedrisk is due to ingestion of groundwater containing EDB, DBCP, and TCP. Inhalation exposure toDBCP exceeds an HQ of 1 (HQ = 1.8). The HI for all contaminants and pathways is 2.4. The excesslifetime cancer risk for this scenario exceeds EPA’s acceptable risk range of 10-4 to l0-6 andthe HI greater than one indicates that exposures may present a noncarcinogenic risk to humanhealth.
Hypothetical future (3 mile) downgradient residential exposure via untreated groundwater use –The receptor for this scenario is a future, hypothetical resident living 3 miles downgradient ofthe KVA that may be exposed to contaminants in untreated basal groundwater extracted from themiddle of a hypothetical plume originating in the KVA. During a lifetime, the resident maypotentially be exposed through ingestion of untreated groundwater, direct dermal contact throughresidential untreated water use (i.e., showering, bathing, laundry activities) and ambient airinhalation of contaminants volatized from untreated water during residential use.
For the 3 mile location the estimated excess lifetime cancer risk ss 9.4xl0-6. The highestestimated risk comes from oral ingestion exposure to EDB (5.lx10-6). None of the contaminantsexceed an HQ of 1 for the exposure pathways evaluated. The HI for all eon/ants and pathways is0.04. The excess 1ifetime cancer risk for this scenario is near the middle of EPA’s generallyacceptable risk range of 10-4 to 10-6. The HI is well below one, indicating that exposures donot present a noncarcinogenic risk to human health.
Hypothetical future (4.5 mile) downgradient residential exposure via untreated groundwater use -The receptor for this scenario is a future, hypothetical resident living 4.5 miles downgradientof the KVA that may be exposed to contaminants in untreated basal groundwater extracted from the
middle of a hypothetica1 plume originating in the KVA (the Honouliuli II Wells arc locatedapproximately 4.5 miles downgradient of the KVA). During a lifetime, the resident maypotentially be exposed through ingestion of untreated groundwater, direct dermal contact throughresidential untreated water use (i.e., showering, bathing, laundry activities) and ambient airinhalation of contaminants volatilized from untreated water during residential use.
For the 4.5 mile 1ocation the estimated excess lifetime cancer risk is 6.1xl0-6. The highestestimated risk comes from oral ingestion exposure to EDB (3.3x10⁻⁶). None of the contaminantsexceed an HQ of 1 for the exposure pathways evaluated. The HI for all contaminants and pathwaysis 0.02. The excess lifetime cancer risk for this scenario falls in the lower end of EPA’sgenerally acceptable risk range of 10-4 to 10-6 and the HI greater than one indicates thatexposures do not present a noncarcinogenic risk to human health.
It should be noted that all of the scenarios described above involving potential future exposureto contaminated groundwater are very unlikely to occur because Safe Drinking Water Act (SDWA)and State of Hawaii regulations prohibit water purveyors from serving groundwater containingcontaminants at concentrations that exceed their State or Federal drinking water standards(MCLs).
Several assumptions used in the BRA evaluation contribute uncertainty to the risk assessment.Key uncertainties include:
• Uncertainty with the assumption that the 95% upper confidence limit value or the maximumdetected value are representative of contaminant concentrations in each medium. These areconservative estimates that likely overstate the expected exposure point concentrations.
• Uncertainty is present in the assumptions and factors used to produce the route-specificexposure point concentrations for several exposure scenarios (i.e., route-specific airconcentrations estimated for HCC spray irrigation; route-specific concentrations derivedfor hypothetical, future, untreated irrigation water for the Kunia Section).
• Uncertainty associated with the exposure factors and parameters used in the exposureassessment. These included the exposure setting, scenarios, pathways, and receptorsdeveloped in the conceptual site model. Additional uncertainty was associated withadjusting standard EPA occupational scenario parameters (i.e., adjusted site-specificparameters were used for the future hypothetical Kunia Section irrigation workers (dripand spray) and the current HCC maintenance worker scenarios). These adjusted parametersrepresent upper bound estimates for contaminant intake, exposure duration, and body weightthat may overestimate risk.
• Uncertainty associated with the toxicity assessment that extrapolates toxicologicalinformation derived from animal studies. These data were used to predict human healtheffects from exposure to environmental media that may not provide a comparable dose.Uncertainty is also introduced by a lack of toxicity data for several chemicals ofpotential concern that rely on route-to-route (i.e., oral for inhalation) extrapolatedtoxicity values.
7.2 Summary of Ecological Risk Assessment
Ecological risks are evaluated qualitatively because very few shallow soil and sediment samplescontained detectable COPCs. 1n addition, because the former excavation pit was backfilled duringOctober 1999, the only potential pathway for ecological receptors has been eliminated.Furthermore, because there is no physical connection of perched water (with the exception of theformer excavation pit prior to backfilling) with surface receptors, an exposure pathway does notexist for perched groundwater. The RI found that perched groundwater does not discharge tosurface water as evidenced by the low hydraulic heads in the perched aquifer in the vicinity ofthe ephemeral gulch, nor were any seeps or springs noted. It is also important to note that theKVA does not provide critical habitat for threatened and endangered species and typicallocation-specific laws and regulations that apply to wetlands and historic places are notappropriate nor applicable to this site. Therefore, the qualitative, screening-level ecologicalrisk assessment demonstrates that no current risk is attributable to the KVA because no pathwaysof exposure leading to ecological receptors are present.
7.3 Conclusion
In addition to the risk assessment, EPA has considered the state and federa1 drinking waterstandards (MCLs and maximum contaminant level goals [MCLGs]) that have been established forcontaminants found at the Del Monte Site. MCLs and MCLGs are set at levels, including anadequate margin of safety, where no known or anticipated adverse health effects are expected tooccur. Even if the cumulative carcinogenic site risk to an individual based on reasonablemaximum exposure is less than 10-4 and the non-carcinogenic hazard quotient is less than 1,remedial action will generally be warranted if MCLs or non-zero MCLGs are exceeded (”Role of theBaseline Risk Assessment in Superfund Remedy Selection Decisions,” OSWER Directive 93S5.0-30,April 22, 199la).
Based on the risk characterization results (Tables 9 and 10) that show potential cancer andnoncancer risks to Kunia Village and downgradient residents within l.5 miles of the KVAexceeding acceptable levels, the presence of contamination in excess of drinking water MCLs inthe basal aquifer, and the use of groundwater in the Del Monte Site vicinity as a source ofirrigation and drinking water, EPA has determined that actual or threatened releases ofhazardous substances at this site, if not addressed by implementing the response action selectedin this ROD, may present an imminent and substantial endangerment to public health, welfare, orthe environment. As described in the preceding paragraphs, the groundwater contamination doesnot represent a current threat to public health or welfare, but rather a potential futurethreat.
8 Remediation Objectives
EPA's Remedial Action Objectives (RAOs) for the Del Monte Site are to:
• Prevent exposure of the public to contaminated groundwater above chemical-specific cleanuplevels (described below);
• Inhibit further migration of the contaminant plume away from the KVA (source control);
• Limit discharge of Kunia Village Area perched groundwater and deep soil contaminants tobasal groundwater such that basal groundwater concentrations do not exceed thechemical-specific cleanup goals described below (source control), and;
• Restore basal groundwater to its beneficial use of drinking water supply within areasonable timeframe (aquifer restoration).
These objectives reflect EPA's regulatory goal of restoring usable groundwater to its beneficialuses wherever practicable, within a timeframe that is reasonable, or, if restoration is deemedimpracticable, to prevent further migration of the plume, prevent exposure to the contaminatedgroundwater, and evaluate further risk reduction (40 C.P.R. Section 300.430{a} {1) {iii} {F}).The RAOs address the risks associated with exposure to contaminated groundwater at the Del MonteSite (described above in Section 7) by significantly limiting the potential for future exposure.
To meet the RAOs, migration control will be required in the Kunia Village basal aquifer sourcearea as long as contaminant concentrations in groundwater exceed cleanup levels and downgradientactions will be required until the entire area of contamination meets the cleanup levels. TheRAOs for the Del Monte Site incorporate the following, chemical-specific cleanup levels in thebasal aquifer. As the table indicates, EPA has selected MCLs as the cleanup levels in the basalaquifer. MCLs (sometimes called drinking water standards) are regulatory limits that apply todrinking water served for consumption. EPA has selected the State of Hawaii MCLs as the cleanuplevel for three of the COCs because they are lower than the Federal MCLs.
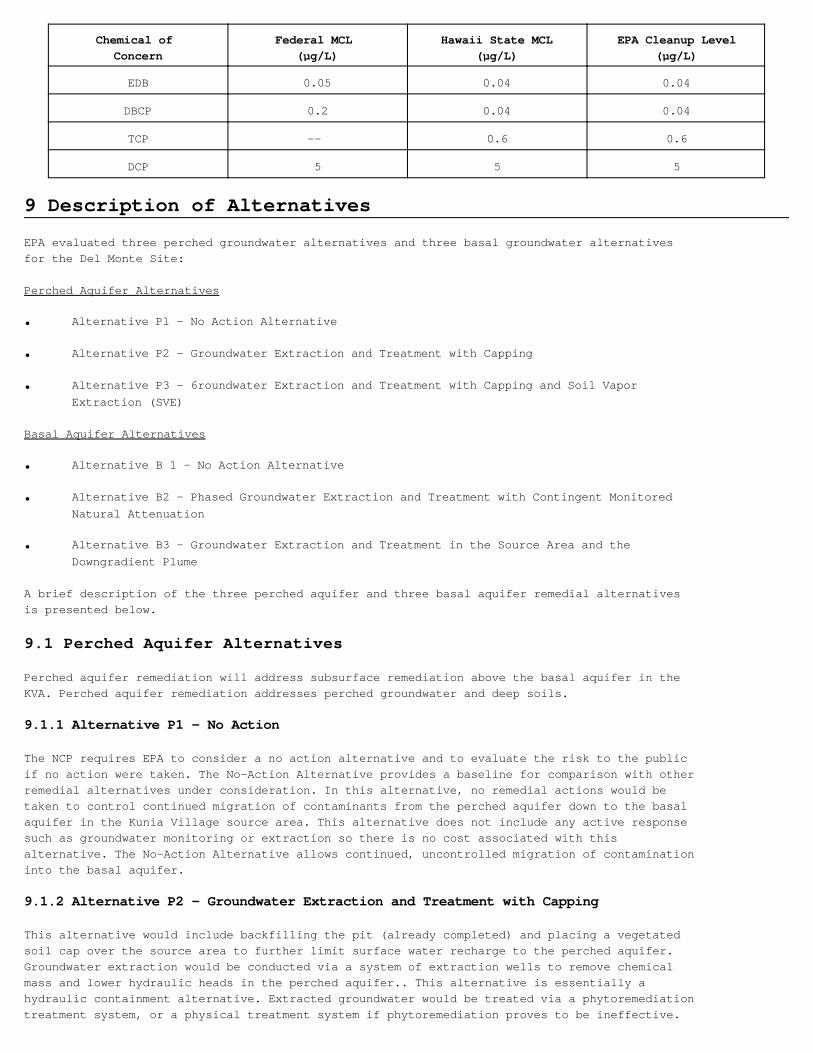
Chemical of Concern
Federal MCL (µg/L)
Hawaii State MCL(µg/L)
EPA Cleanup Level(µg/L)
EDB 0.05 0.04 0.04
DBCP 0.2 0.04 0.04
TCP –- 0.6 0.6
DCP 5 5 5
9 Description of Alternatives
EPA evaluated three perched groundwater alternatives and three basal groundwater alternativesfor the Del Monte Site:
Perched Aquifer Alternatives
• Alternative Pl - No Action Alternative
• Alternative P2 – Groundwater Extraction and Treatment with Capping
• Alternative P3 – 6roundwater Extraction and Treatment with Capping and Soil VaporExtraction (SVE)
Basal Aquifer Alternatives
• Alternative B 1 - No Action Alternative
• Alternative B2 - Phased Groundwater Extraction and Treatment with Contingent MonitoredNatural Attenuation
• Alternative B3 - Groundwater Extraction and Treatment in the Source Area and theDowngradient Plume
A brief description of the three perched aquifer and three basal aquifer remedial alternativesis presented below.
9.1 Perched Aquifer Alternatives
Perched aquifer remediation will address subsurface remediation above the basal aquifer in theKVA. Perched aquifer remediation addresses perched groundwater and deep soils.
9.1.1 Alternative P1 – No Action
The NCP requires EPA to consider a no action alternative and to evaluate the risk to the publicif no action were taken. The No-Action Alternative provides a baseline for comparison with otherremedial alternatives under consideration. In this alternative, no remedial actions would betaken to control continued migration of contaminants from the perched aquifer down to the basalaquifer in the Kunia Village source area. This alternative does not include any active responsesuch as groundwater monitoring or extraction so there is no cost associated with thisalternative. The No-Action Alternative allows continued, uncontrolled migration of contaminationinto the basal aquifer.
9.1.2 Alternative P2 – Groundwater Extraction and Treatment with Capping
This alternative would include backfilling the pit (already completed) and placing a vegetatedsoil cap over the source area to further limit surface water recharge to the perched aquifer.Groundwater extraction would be conducted via a system of extraction wel1s to remove chemicalmass and lower hydraulic heads in the perched aquifer.. This alternative is essentially ahydraulic containment alternative. Extracted groundwater would be treated via a phytoremediationtreatment system, or a physical treatment system if phytoremediation proves to be ineffective.
Del Monte has been successfully operating a phytoremediation treatment system for the perchedgroundwater since 1998. The system was installed as a Treatability Study during the RI/FS.
The major components of this alternative are:
• Backfilling the pit (already completed)
• Construction of a soil cap over the most affected area of the perched aquifer, includingappropriate storm water controls
• Installation of a groundwater extraction system (already completed) to provide hydrauliccontainment that reduces the mass flux of COCs into the under1ying basal aquifer
• Treatment of the extracted groundwater via phytoremediation or, if necessary, physicaltreatment
• Implementing institutional controls to prevent exposure to perched groundwater and soilimpacted by COCs and to prevent activities that might interfere with the effectiveness ofthe remedy
• Operation of the groundwater extraction and treatment system until the impact of' theperched aquifer on the basal aquifer is reduced to remediation goals
• Monitoring groundwater for the foreseeable future or for more than 30 years
• Cap maintenance and monitoring for the foreseeable future or for more than 30 years
• Maintenance of institutional eontro1s for the foreseeable future or for more than 30 years
Soil Cap
Capping is a cost-effective means of reducing mass flux out of the perched aquifer by reducinginfiltration. Capping would include the. pit area that has been backfilled and the rest of thesource area.
The soil cap will primarily consist of regrading the perched aquifer source area to provideproper stormwater drainage. The cap soil would be clean compacted Kolekole loam soil fi11 withtopsoil for the top six inches. To establish vegetation, the topsoil would be seeded withgrasses suitable for the local climate. The vegetated cover will promote evapotranspiration anddecrease erosion.
Stormwater diversion swales would be constructed around the source area. The grading andstormwater diversion would serve two purposes: they would reduce infiltration of stormwaterrun-on, and they would minimize erosion of the soil cap.
Design assumptions for this remedy component are as follows:
• Cap area: 12,000 square feet
• Cap thickness: 3 feet
• Total fill volume (cap and backfill): 14,000 cubic yards
• Total stormwater ditch length: 1,000 feet
Groundwater Extraction
Groundwater extraction for the perched aquifer is intended to reduce the mass flux of COCsentering the underlying basal aquifer from the perched aquifer. Groundwater extraction would beaccomplished by pumping from existing wells in the source area that were installed to supportthe phytoremediation treatability study, in addition to historical wells No. 3 and No. 9.
The existing collection tank would be used to isolate the treatment system from flow surges aspumps turn on and off. The collection tank would also provide holding capacity to allowgroundwater extraction to continue a short time (up to several weeks depending on the productionrate from the extraction wells) when the treatment system is taken offline for maintenance.Conversely, the collection tank would also allow the treatment system to operate for a shorttime during extraction system maintenance.
Design assumptions for this remediation component are as follows:
• Number of extraction wells pumped: 14
• Flow rate per well (average): 0.1 gpm
• Total extraction rate (average): Approximately 1 gpm
Groundwater Treatment
Phytoremediation (treatment using plants) would be used to treat the extracted perchedgroundwater. If necessary, physical treatment, which is a proven technology, could be used ifproblems are encountered with the phytoremediation.
Phytoremediation is an enhancement of land treatment. Extracted groundwater is used to irrigatephytoremediation cells. Both soil microbes and Koa Haole plants biologically degrade EDB andDBCP in the cells. In addition, the plants enhance evapotranspiration, which maximizes theamount of extracted water containing COCs that can be applied to the treatment cells. Tominimize volatilization, subsurface drip irrigation is used.
Rased on the estimated perched groundwater extraction rate, the pilot treatment system alreadyinstalled would be sufficient for full-scale treatment of perched groundwater. The pilottreatment cells are lined with 80-mil high-density polyethylene, and include a closed loopleachate recovery system. All leachate is reused as irrigation water in the phytoremediationcells.
Design assumptions for this remedy component are as follows:
• Influent groundwater rate: Approx. 1 gpm (10,000 gallons/week)
• Treatment cell size (2 units): 150 feet long, 50 feet wide, and 4 feet deep
• Treatment system capacity (existing pilot system): 10.000 – 20,000 gallons/week.
The backup option of physical treatment of perched groundwater could be accomplished most cost-effectively using a combination of air stripping and carbon adsorption. Air stripping is aconceptually simple process wherein air and water flow countercurrent (i.e., in oppositedirections) in a tower. The air extracts volatile compounds from the water. This air (off-gas)is treated to remove COCs if required by applicable air regulations, and then discharged intothe atmosphere. Following the air stripper the water would be treated using liquid-phase carbonabsorption. Liquid-phase carbon adsorption contacts water with granular activated carbon; COCsare removed from the water by adsorbing onto the carbon, The carbon is then disposed of orregenerated (treated to destroy contaminants and allow reuse of the carbon). Carbon disposal orregeneration would occur off-site at a permitted facility.
The two-process system (both air stripping and liquid-phase carbon adsorption) would be used tominimize overall treatment cost. Treatment of air emissions is not required for sources lessthan 0.1 tons/year of the COCs. It is expected that air emissions would not exceed this limit.However, due to the proximity of the treatment system to Del Monte offices, workers, andresidents, off-gas treatment would be provided using vapor-phase carbon adsorption. Vapor-phasecarbon adsorption is similar to liquid-phase carbon adsorption, except that the carbon removesCOCs from air instead of water.
Institutional Controls
Institutional Controls for Alternative P2 would prohibit certain activities unless suchactivities are first reviewed and approved by EPA. These prohibited activities include thefollowing:
• Activities that would /age or affect the integrity of the cap in the KVA. Such activitiesinclude, but are not limited to, excavating into the cap or contaminated soi1, or buildingon the cap;
• Activities, such as movement of earth, that would interfere with the effectiveness ofstormwater diversion swales or the cap grade;
• Activities that will damage or affect the integrity of the phytoremediation cells, and
• Activities that would /age or interfere with the groundwater monitoring, extraction wellsand related facilities associated with the perched aquifer remedy.
Appropriate fencing would be included to prevent access to groundwater extraction and treatmentsystems and surface remedies (i.e., “cap”). Appropriate warning signs will also be put intoplace.
Monitoring
For the perched aquifer, groundwater monitoring will be conducted until the RAOs for the perchedaquifer are achieved. COC concentrations will slowly continue to decrease even after remedialaction is complete. Perched aquifer monitoring wil1 include: the extraction wells and monitoringwells installed for the phytoremediation study; pre-RI extraction wells 3 and 9; and monitoringwells MW-1 through MW-21 installed during and subsequent to the RI that contain sufficient waterto sample. Head measurements will he ob/ed to document dewatering and containment of the perchedgroundwater and water samples from selected wells will he analyzed for VOCs including EDB andDBCP Monitoring is expected to be necessary for greater than 30 years.
Performance monitoring will also be performed for treatment components of the alternatives.Treatment monitoring would include sampling and analysis of influent and effluent groundwater.It is expected that soil sampling will be needed for phytoremediation to track potential buildupof COCs in soil.
In addition to groundwater monitoring, maintenance and monitoring of components of the remedy(cap and fencing) will be performed. Maintenance and monitoring will continue so long nsgroundwater extraction and treatment continues. Therefore, the cap will be maintained forgreater than 30 years.
Remediation Timeframe
Alternative P2 could potentially meet remediation goals in the basal aquifer within three toseven years of remedy startup. However, once the pumping system is turned off, recharge to thesaprolite will cause it to become resaturated and contaminants in the previously dewateredportions of the perched aquifer will again come into contact with saturated groundwater withsubsequent infiltration and recharge to the basal aquifer. An estimate of the mass of EDB andDBCP removal achievable by groundwater pumping can be made from the records and monitoring ofthe perched aquifer phytoremediation treatability study. The estimated mass of EDB, DBCP and1,2,DCP removed from perched groundwater as of May 2000 is about 11 grams, 32 grams and 163grams, respectively. The total percentage of COCs removed from soils during this period is only0.1 percent. Therefore, the mass removal of COCs from pumping will not reduce the mass of COCsin the vadose zone significantly and remediation is expected to take longer than 30 years.
9.1.3 Alternative P3 - Groundwater Extraction and Treatment with Capping and SoilVapor Extraction
This alternative is identical to Alternative P2, however, deep soils would also be treated viaSVE. SVE would be used to accelerate the time to reach the mass flux remediation goals for the

perched aquifer. There is some uncertainty regarding the effectiveness of SVE in the lowpermeability saprolite materials of the perched aquifer. Performance of a pilot test will berequired to evaluate design issues and assess performance. If SVE proves to be effective, thisalternative has the potential to achieve RAOs more quickly than Alternative P2.
The soil capping, groundwater extraction, and groundwater treatment components are the same asdescribed above for Alternative P2, so these sections are not repeated below. The majorcomponents of this alternative are:
• Backfilling the pit (already completed).
• Construction of a soil cap over the most affected area of the perched aquifer, includingappropriate storm water controls.
• Installation of a groundwater extraction system to provide hydraulic containment thatreduces the mass flux of COCs into the underlying basal aquifer and depresses thegroundwater elevation for SVE.
• Treatment of the extracted groundwater via phytoremediation or, alternatively, physicaltreatment.
• Installation of a SVE system in the most affected area of the perched aquifer to removeCOCs from unsaturated soils to reduce perched aquifer impacts on the basal aquifer morequickly.
• Implementation of institutional controls to prevent exposure to perched groundwater andsoil impacted by COCs and to prevent activities that would interfere with theeffectiveness of the remedy
• Operation of the groundwater extraction and treatment and SVE systems (with off-gastreatment) until the impact of the perched aquifer on the basal aquifer is reduced toremediation goals.
• Monitoring groundwater until remediation goals are achieved and can he shown to bemaintained after active remediation is terminated.
• Cap maintenance and inspection monitoring will continue until remediation goals areachieved and post-operation monitoring of basal groundwater is complete.
• Maintenance of institutional controls until remediation goals are achieved.
Soil Vapor Extraction (SVE)
For Alternative P3, SVE would be used to accelerate the rate of COC removal. SVE would primarilybe used to accelerate the time to reach the mass flux remediation goals for the perched aquifer.SVE would be used m conjunction with groundwater extraction. The water level drawdown providedby groundwater extraction would enable the SVE treatment to extend deeper into the perchedaquifer.
SVE would be accomplished with a vacuum blower to extract subsurface vapors via a piping networkfrom SVE wells. Piping would be laid aboveground within a fenced area. Existing groundwaterwellswould be used in a dual role, for both groundwater extraction and SVE. Additional SVE wellswould be installed as needed to provide the des/ treatment coverage
The air permeability of the perched zone has not been determined Based on the measured hydraulicconductivity and the clayey nature of the soil, the subsurface air permeability is expected tobe small, meaning that the radius of influence of SVE wells would be small.
Under State of Hawaii regulations, treatment of air emissions is not required for sources lessthan 0.1 tons/year of the COCs. It is expected that air emissions would not exceed this limit.However, to minimize risks during remedial activities, off-gas treatment will be provided usingvapor-phase carbon. Spent carbon would be sent off-site for regeneration or disposal at a
permitted facility. Design assumptions for this remediation component are as follows:
• Number of dual-use wells: 35
• Number of additional SVB wells: 55 (approximate)
• SVE header piping: 4-in. diam. PVC, 2SO feet
• Vacuum blower capacity: 200 scfm
• Off-gas treatment: Carbon adsorption
Pilot testing will be required for design purposes to determine the radius of influence andother operating parameters. The layout of the system and eventual number of additional SVE wellsneeded would be determined on the basis of pilot testing results.
Monitoring
Monitoring is the same as described above for Alternative P2 except the monitoring duration forAlternative P3 is estimated to be l0 to 15 years.
Institutional Controls
Institutional Controls for Alternative P3 would prohibit certain activities unless suchactivities are first reviewed and approved by EPA. These prohibited activities include thefollowing:
• Activities that would damage or affect the integrity of the cap in the KVA. Suchactivities include, but are not limited to, excavating into the cap or contaminated soil,or building on the cap;
• Activities, such as movement of earth, that would interfere with the effectiveness ofstormwater diversion swales or the cap grade;
• Activities that will damage or affect the integrity of the phytoremediation cells,
• Activities that would damage or interfere with the groundwater monitoring, extractionwells and related facilities associated with (he perched aquifer remedy, and
• Activities that would damage or interfere with the effectiveness of the SVE system.
Appropriate fencing would also be included to prevent access to groundwater extraction andtreatment systems and surface remedies (i.e., “cap”). Appropriate warning signs will also be putinto place.
Remediation Timeframe
For the remediation to be complete, contaminant concentrations in the deep soils and perchedgroundwater must be reduced sufficiently such that the mass flux of remaining contaminationwould not cause exceedances of cleanup standards in the basal aquifer. Pilot testing will berequired to estimate key SVE parameters necessary to assess the effectiveness of SVE at removingcontaminants from the perched zone. Because pilot testing has not been completed, engineeringjudgment was used to develop reasonable assumptions for the mass removal analysis. Based on theassumptions used in the FS, the restoration timeframe is estimated to be approximately 8 yearsafter full-scale startup of the SVE system.
Given the lack of pilot test data and other uncertainties, this analysis should only beconsidered a rough approximation of what will actually occur. The timeframe will likely beconstrained by diffusion of contaminants in the heterogeneous perched aquifer soils. SVE airflowis typically through relatively more permeable horizons in the soil, with contaminants diffusingfrom the less permeable soils. The extent that diffusion is limited cannot be accuratelypredicted without testing. This is a key area of uncertainty in estimating the remediation
timeframe.
9.2 Basal Aquifer Alternatives
Basal aquifer alternatives address contaminated groundwater in the “basal source area” and the“downgradient plume.”
9.2.1 Alternative B1 – No Action
As described above in Section 9.1.1, the NCP requires EPA to consider a no action alternativeand to evaluate the risk to the public if no action were taken. The No-Action Alternativeprovides a baseline for comparison with other remedial alternatives under consideration. In thisalternative, no remedial actions would be taken to control continued migration of contaminantsaway from the KVA source area and the downgradient plume would not be addressed. Thisalternative does not include any active response such as groundwater monitoring or extraction so there is no cost associated with this alternative. The No-Action Alternative allows continued,uncontrolled migration of groundwater con/nation and does not meet EPA's RAOs.
9.2.2 Alternative B2 – Phased Groundwater Extraction and Treatment with ContingentMonitored Natural Attenuation
This alternative includes deferred site characterization to define the source area and thedowngradient plume and monitoring to determine the effectiveness of source control and todetermine which remedy to implement for the downgradient plume. Groundwater would be extractedin a phased manner, beginning with the basal aquifer source area to remove the source of SiteCOCs from the downgradient plume. Extracted groundwater would be treated via physical treatment,and distributed for irrigation use. If shown to be effective, natural attenuation would be usedto address downgradient portions of the plume. If MNA is not shown to be effective, additionalextraction and treatment would be implemented to achieve RAOs in the downgradient plume.Institutional controls would be provided to prevent exposure to basal groundwater impacted bysite COCs and to prevent activities that might interfere with the effectiveness of the remedy.The effectiveness and progress of the remedy would be monitored using the existing Basal Welland existing regional monitoring wells as well as new wells that will be installed tocharacterize the plume, delineate the source, and monitor remedy performance. The well networkwould be sufficient to demonstrate effectiveness of source control and whether or not naturalattenuation is effective. As a contingency, point-of-use treatment would be used if drinkingwater supplies were unexpectedly to become affected by Site COCs. Monitoring and institutionalcontrols would be continued for a period of time after drinking water standards are reached toensure that concentration levels are stable and remain below MCLs.
Modeling estimates indicate that the basal aquifer plume will disperse rapidly (on the order of3 to 5 years) once source control is implemented The major components of this alternative are:
• Installation of groundwater monitoring wells to characterize the source area and thedowngradient plume and to monitor remedy performance
• Extraction of basal groundwater in the source area to eliminate the source of COCs.
• Treatment of extracted groundwater via air stripping and carbon adsorption.
• Implementation of a groundwater monitoring program to monitor the effectiveness of theremedies in the source area and downgradient plume.
• Increase pumping rate from the Kunia Well and/or other wells if needed to attain sourcecontrol.
• Evaluation of data and consideration of the contingency for MNA.
• If MNA is proven to be effective, allow natural attenuation to reduce COC concentrationsin the basal aquifer downgradient of the source area with performance monitoring.
• If MNA is proven to not be effective, implement a6ditional pumping and treating of the
downgradient plume with performance monitoring.
• Implementation of institutional controls to prevent exposure to basal groundwater impactedby COCs and to prevent activities that might interfere with the effectiveness of theremedy.
• Continuing institutional controls and monitoring for at least five years after groundwatercleanup levels have been achieved to ensure that concentration levels are stable andremain below MCLs.
Groundwater Extraction - Basal Aquifer
Groundwater extraction for the basal aquifer would initially be implemented in the source areaand would be intended as hydraulic containment to prevent COCs that reach the basal aquifer frommigrating outside of the source area. Based on a pump test conducted during the RI, sufficienthydraulic containment could be provided using only the Kunia Well pumping at 325 gpm. A highergroundwater extraction rate, although not expected to be required to achieve minimum hydrauliccontainment, would be beneficial in that it would decrease the time required for naturalattenuation (by controlling a greater percentage of the plume). A pumping rate of 1,000 gpm fromthe Kunia Well has been assumed. Continuous pumping at this rate would result in 1.44 milliongallons per day (mgd). The current water allocation is based on an annual average of 1.075 mgd.There will be some down time for well pumping over the course of a year sucb that the currentwater allocation would not be exceeded.
Additional groundwater extraction and treatment for the downgradient plume would be implementedif the contingent MNA is shown to not be effective. The design for additional groundwatercontrols would be optimized based on the additional data collected to characterize the plume andevaluate effectiveness of source control.
Treatment - Extracted Groundwater
Physical treatment would be used for treatment of extracted basal groundwater in bothAlternative B2 and B3. Physical treatment would consist of air stripping followed by liquidphase carbon adsorption.
A packed tower air stripper would be used. A packed tower provides better air-water contact thana tray stripper, meaning more efficient removal At the design flow rate, the higher removalefficiency and lower power requirements are significant.
Under State of Hawaii regulations, treatment of air emissions is not required for sources lessthan 0.1 tons/year of the COCs. 1t is expected that air emissions would not exceed this limitHowever, if air monitoring shows that air emissions exceed 0.1 tons/year, then off-gas treatmentwould be provided using vapor-phase carbon adsorption.
Design assumptions for this remedy component are as follows:
Influent groundwater rate: l,000 gpm
• Influent EDB: 0.25 µg/L
• Effluent EDB: < 0.04 (MCL)
• Influent DBCP: 1.1 µg/L
• Effluent DBCP: < 0.04 (MCL)
• Off-gas treatment: Carbon adsorption (if needed)
The assumed influent concentrations are based on data collected during the RI, which are higherthan concentrations in more recent sampling. Continuous operation was assumed for determiningoperation and maintenance cost.
Monitored Natural Attenuation
Monitored natural attenuation (MNA) is a contingent component of Alternative B2. Naturalattenuation is monitored use of naturally occurring physica1, chemical, and biological processesthat act without human intervention, to reduce the toxicity, mass, mobility or concentration ofCOCs. These processes include biodegradation, dispersion, dilution, sorption, volatilization,and chemical transformation. For this site, the primary attenuation mechanism is believed to bedispersion with a possible small contribution from abiotic degradation (e.g., hydrolysis).Source control, a thorough characterization of the extent of the plume, and long-termperformance monitoring are fundamental components of any MNA remedy. MNA will be used only whenit is shown to meet groundwater cleanup objectives within a timeframe that is reasonablecompared to pumping and treating the plume. It is estimated that cleanup objectives will bemet within 3 to 5 years for both MNA and active remediation.
Natural attenuation differs from “no action” in that: (a) chemical concentration reductionsoccur in the groundwater plume in a manner which is protective of downgradient receptors; (b)the progress of remediation is monitored to ensure its effectiveness and progress, and; (e)institutional controls are used were applicable to ensure that unacceptable exposure does notoccur while the remedy is in progress.
Monitored natural attenuation is included in this alternative as a contingency for thedowngradient plume, if groundwater monitoring data demonstrate that it would he effective.Removal of the basal source via hydraulic containment allows a rapid reduction in theconcentrations of COCs in the downgradient plume.
Additional source control would be provided by perched aquifer remediation. Therefore, sourcecontrol, via basal aquifer hydraulic containment and perched aquifer remediation, is animportant component of Alternative B2 in the event contingent MNA is implemented.
Nearly 20 years of historical data at the Kunia Well and perched aquifer wells have shown adefinite downward trend in basal and perched aquifer COC concentrations in the source area. Thisdownward trend has resulted in about a 50% decline in DBCP concentrations and a decline of morethan 90% for EDB at the Kunia Well since 1983. This information provides strong evidence thatthe source of contamination to the basal aquifer has been declining for some time.
The modeled maximum expected travel distances to an MCL exceedance were less than about 4500feet from the KVA. These are worst-case predictions and the actual travel distances may be less.Active source control (i.e., pump-and-treat for the basal source area and/or perched aquiferremediation) will insure that further declines occur. Therefore, MNA for the downgradient plumein the basal aquifer will not likely result in additional migration of chemicals in the basalaquifer or unacceptable impacts to receptors. Additional site characterization and performancemonitoring would be needed to demonstrate this.
Institutional Controls
Institutional controls (e.g., groundwater use restrictions) would prohibit certain activitiesunless such activities are first reviewed and approved by EPA. These prohibited activitiesinclude the following:
• Installation of groundwater extraction wells into the plume of contaminated groundwater orextraction of contaminated groundwater that will adversely impact the basal aquiferremedy;
• Installation of groundwater extraction wells or extraction of groundwater in proximity tothe contaminated groundwater that causes movement of groundwater that would negativelyaffect the monitoring and/or extraction wells associated with the basal aquifer remedy,and
• Activities that would damage or interfere with the effectiveness of any component of thebasal aquifer remedy.
Appropriate fencing would also be included to prevent access to groundwater extraction and
treatment systems. Appropriate warning signs will also be put into place.
Monitoring
For the basal aquifer, monitoring will be needed to verify the effectiveness of source controland natural attenuation. The general program will consist of:
• Installing new wells to determine the direction of groundwater flow, plume boundaries andassess plume dissipation.
• Installing a new well or wells to define the extent of the source area. These wells willalso be used as performance monitoring wells to evaluate the effectiveness of basalaquifer source control.
• Installing a point of compliance monitoring well at the leading edge of the plume, Thepoint of compliance monitoring well will be used to help determine where the contingentMNA remedy can be implemented (see Section 11.1.2 for further discussion of point ofcompliance monitoring).
• Monitoring at regional basal wells to provide data on COC levels at the relevant existingsupply wells (HCC well and Honouliuli II wells).
New wells will be installed using a phased approach, as discussed below:
• Two wells will be installed that, in conjunction with the existing Basal Well and KuniaWell, will be used primarily to determine groundwater flow direction in the basal aquifer.These well locations will be approximately 2,500 to 3,000 feet downgradient of the KVA.This distance is expected to be sufficiently far from the KVA that potential measurementerrors will be minimized in relation to the expected head differences between wells. Inaddition to providing information related to flow direction, these wells, in conjunctionwith the structural discontinuity located between the Ewa-Kunia and Waiawn-Waipahuaquifers, will be useful in bounding the plume laterally from water quality data and plumesymmetry considerations.
• A monitoring well (or wells) will also be installed to delineate the extent of the basalaquifer source area and to monitor performance of the source area containment system.These data will be used to demonstrate that hydraulic control has been achieved.
• Using data from new and existing wells to evaluate flow directions, monitoring wells willbe installed in the downgradient flow path from the KVA. The locations will be evaluatedbased on a refinement of the groundwater plume model with new water quality data. One ofthe wells will be installed downgradient of the source area near the leading edge ofcontamination (see Section 11.1.2 for further discussion). This well will be used toconfirm that COCs have not migrated farther downgradient than anticipated and that MNA isstill a potential contingent option.
• If the new monitoring well data indicate that the groundwater flow direction issufficiently different than anticipated and/or the downgradicnt plume MCL concentrationsare not sufficiently bounded, an additional monitoring well (or wells) will be installedat a location based on further refinement of the groundwater plume model with newlyacquired data.
• Further monitoring well installation would only be necessary if: (I) the downgradient MCLconcentration limits of COPCs are not adequately bounded; or (2) there are no monitoringwells located in the plume emanating from the KVA with detectable concentrations tomonitor attenuation.
Following completion of these wells, a1I the data will be evaluated to determine if themonitoring network is adequate to meet site monitoring objectives, or if an additional well orwells wil1 be needed. In addition to monitoring at these new wells, monitoring would also beconducted at regiona1 wells, including the HCC well, and one of the Honouliuii II wells. Thesewill provide information of water quality and concentrations at key receptor locations, as wellas to further confirm the results of modeling.
Remediation Timeframe
Modeling was conducted as part of this FS to estimate the timeframe required for MNA to attainRAOs for the basal aquifer. The modeling was based on the "reasonable worst case” analysispresented in the RI for the historically observed basal aquifer impacts. For the estimate theaim was to assess the impact of source control on the downgradient plume. The modeling indicatesthat source control is expected to result in a rapid dispersal of the downgradient plume. Themaximum concentration along the centerline of the plume falls below the MCL after approximately3 years time. Because this modeling was conducted using the reasonable worst-case scenario fromthe RI, this result is conservative. Use of the best estimates for the parameters would resultin even shorter times. On the basis of these results, once source control is attained, MNA isprojected to achieve basal aquifer RAOs in an estimated three to five years. This calculationdemonstrates that RAOs could be achieved within a reasonable timeframe.
9.2.3 Alternative B3 – Groundwater Extraction and Treatment in the Source Area andthe Downgradient Plume
This alternative involves containment and treatment of both the source area as well as theentire downgradient plume. A comprehensive groundwater investigation would be conducted todetermine the dimensions of the source area and the downgradient plume to provide informationrequired to design and implement an efficient extraction system. Additional monitoring wellswould be installed to provide performance monitoring to determine the effectiveness of thesystem. The source area would be extracted and treated for use as irrigation water as describedfor Alternative R2. An extensive extraction well network would then be installed and anadditional treatment system constructed to treat the extracted groundwater. Injection wellswould be installed to re-inject treated water in excess of Del Monte’s water right.
The major components of this alternative are:
• Site characterization to delineate the source area and downgradient plume and design anextraction system.
• Extraction of basal groundwater in the source area to remove the source of COCs from thedowngradient plume.
• Installation of groundwater extraction wells and treatment system and extraction of basalgroundwater in the downgradient plume to accelerate meeting remediation goals in thisplume.
• Treatment of extracted groundwater via air stripping and carbon adsorption.
• Discharge of treated water for irrigation to the extent allowed under Del Monte waterrights (source area and possibly some downgradient basal groundwater).
• Reinjection of treated groundwater in excess of Del Monte water rights (i.e., from thedowngradient plume).
• Implementation of institutional controls to prevent exposure to basal groundwater impactedby COCs and prevent activities that might interfere with the effectiveness of the remedy
• Continuing institutional controls and monitoring as long as basal groundwater qualityexceeds remediation goals for the basal aquifer.
Groundwater Extraction - Basal Aquifer Source Area and Downgradient Plume
Groundwater extraction would be conducted for the entire area of the basal aquifer impactedabove MCLs, both within and outside the source area (i.e., in the downgradient plume). Theobjective would be to provide containment of the downgradient plume and to accelerategroundwater cleanup through active remediation, without attempting to phase implementation ofthe groundwater extraction system. Additional investigation would still be required to fullycharacterize the downgradient plume to enable design and implementation of an efficient
extraction well network. Following delineation of the MCL exceedance plume, extraction wellswould be installed It is assumed that several of the wells installed to define the plume couldalso be used for extraction or performance monitoring wells.
The assumed extraction system would include 5 wells. One line of 2 wells would he installedperpendicular to the flow axis across the widest section of the plume. A second line of 2 wellswould be installed further downgradient across the flow path, and one well would be installed atthe downgradient edge along the centerline of the plume. The goal would be to provide completecontainment, limiting any additional migration, and also provide the optimum extractionefficiency and reliability (maintenance, downtime, etc.) for attaining RAOs for the entire plumein a short timeframe (three to five years, including time for characterization andconstruction).
The extracted water would be transported to the groundwater treatment system through pipelines.After treatment, any water in excess of Del Monte water rights would he re-injected back intothe aquifer through a series of injection wells. Reinjection of the treated water would not,affect the quantity of groundwater available for beneficial uses further downgradient, and maybe required due to limits on withdrawals from the Ewa-Kunia aquifer system. It is anticipatedthat two injection wells would be installed in a line perpendicular to the flow axis. They wouldbe located a sufficient distance downgradient of the extraction system to minimize hydraulicinfluences to extraction. Two wells are included to ensure that there is always one available inthe event of maintenance. An Underground Injection Control permit from EPA or the HDOH may beneeded for reinjection of treated water offsite.
Design assumptions for components of this remediation system are:
• Number of extraction wells: 4 in two lines plus 1 at plume end
• Total extraction rate: 5 wells at 250 gpm each = l,250 gpm
• Number of reinjection wells: 2
Treatment - Extracted Groundwater
Tbe design of groundwater treatment for the downgradient basal plume would be very similar totreatment for the basal source area (air stripping followed by liquid-phase carbon adsorption asdescribed above in Alternative B2). The treatment system would be connected to the groundwaterextraction and reinjection system. Design assumptions for this remediation eomponent are asfollows:
• Influent groundwater rate: l,250 gpm
• Influent EDB: 0.02 to 0.2 µg/L
• Effluent EDB: Not detectable to < 0.04 (MCL)
• Influent DBCP:0.02 to 0.9 µg/L
• Effluent DBCP: Not detectable to < 0.04 (MCL)
• Off-gas treatment: Carbon adsorption (if needed)
Influent concentrations are assumed to range from the quantitation limit to about the maximumconcentrations detected in the Basal Well, although average concentrations would be expected tobe lower than these maximum concentrations.
Institutional Controls
The Institutional Controls for this alternative are the same as described above for AlternativeNo. B2.
Monitoring
Performance monitoring wells (6 new wells were assumed in the FS) would consist of:
• Two types of source area wells- wells to delineate the plume in the source area and wellsto monitor the effectiveness of source control from pumping at the Kunia Well (seeAlternative B2 for further discussion of these monitoring wells);
• Plume delineation wells and new monitoring wells to monitor effectiveness of hydrauliccontainment of the downgradient contaminant plume.
• Wells located downgradient of the extraction well at the downgradient centerline of theplume.
Performance monitoring wells would be sampled for COCs and head measurements would be used toevaluate capture zones and optimize extraction well pumping to contain the plume whileminimizing the volume of water extracted and treated.
Remediation Timeframe
The goal would be to provide complete containment, limiting any additional migration, and alsoprovide the optimum extraction efficiency and reliability (maintenance, downtime, etc.) forattaining RAOs for the entire plume within three to five years after groundwater extractionbegins.
10 Comparative Analysis of Alternatives
The six remedial alternatives described in Section 9 are evaluated using the nine Superfundevaluation criteria listed in 40 C.F.R. Section 30D 430. The comparative analysis provides thebasis for determining which alternatives present the best balance of the criteria. The first twoevaluation criteria are considered threshold criteria that the selected remedial action mustmeet. The five primary balancing criteria are balanced to achieve the best overall solution. Thetwo modifying criteria, state and community acceptance, are also considered in remedy selection.
Threshold Criteria
• Overall Protection of Human Health and the Environment addresses whether each alternativeprovides adequate protection of human health and the environment, and describes how risksposed through each exposure pathway are eliminated, reduced, or controlled throughtreatment, engineering controls, and/or institutional controls.
• Compliance with ARARs addresses the requirement of Section 121(d) of CERCLA that remedialactions at least attain legally applicable or relevant and appropriate federal and staterequirements, standards, criteria, and limitations, which are collectively referred to as"ARARs," unless such ARARs are waived under CERCLA Section 121(d)(4).
Primary Balancing Criteria
• Long-term Effectiveness and Permanence refers to the ability of a remedy to maintainreliable protection of human health and the environment over time.
• Reduction of Toxicity, Mobility, or Volume Through Treatment refers to the anticipatedperformance of the treatment technologies that may Be included as part of a remedy.
• Short-term Effectiveness addresses the period of time needed to implement the remedy andany adverse impacts that may be posed to workers and the community during construction andoperation of the remedy until cleanup goals are achieved.
• Implementability addresses the technical and administrative feasibility of a remedy fromdesign through construction and operation. Factors such as availability of services andmaterials, administrative feasibility, and coordination with other governmental entitiesare also considered.
• Cost evaluates the estimated capital, operation and maintenance (O&M), and indirect costsof each alternative in comparison to other equally protective alternatives.
Modifying Criteria
• State Acceptance indicates whether the state agrees with, opposes, or has concerns aboutthe preferred alternative.
• Community Acceptance includes determining which components of the alternatives interestedpersons in the community support, have reservations about, or oppose.
This section describes each threshold and primary balancing criterion, evaluates eacha1ternative in relation to each criterion, and identifies advantages and disadvantages among thealternatives in relation to each criterion. Table 1la (perched aquifer alternatives} and 11b(basal aquifer alternatives) present a comparative matrix in which the three alternatives areranked for each of the evaluation criterion. The details of how the rankings have been assignedfor each criterion are provided below.
10.1 Overall Protection of Human Health and the Environment
The NCP requires that all alternatives be assessed to determine whether they can adequatelyprotect human health and the environment from unacceptable risks from site contamination. Theserisks can be mitigated by eliminating, reducing, or controlling exposure to hazardoussubstances, pollutants, or contaminants.
Perched Aquifer Alternatives
Alternatives P2 and P3 provide, adequate protection of human health and the environment. The No-Action alternative, Alternative Pl, does not because it does not have an active remedy componentthat inhibits continued migration of contaminants into the basal aquifer. Alternative Pl wouldincrease the long-term potential for human exposure, because of continued loading ofcontaminants to the basal aquifer, a drinking water source. P2 and P3 both significantly reducethe migration of perched groundwater containing COCs keeping it from reaching the basalgroundwater. The flux rates will be reduced such that within five to eight years they wi11 notbe able to cause MCL exceedances in the basal aquifer. Alternative P3 will result in additiona1long-term protection over that provided by P2 by using SVE to remove COCs from the dewateredsaprolites. Short-term effectiveness of P3 is better than P2, because active remediation of theperched aquifer and deep soils can be completed faster with alternative P3.
Considered in conjunction with either basal aquifer Alternatives B2 or B3 (discussed below),both Alternatives P2 and P3 satisfy EPA's remedial action objectives and reduce long-term risksto human health and the environment by containing contaminated groundwater in the source area,removing contaminant mass and limiting the potential for exposure. The phytoremediationtreatment technology to be employed by these alternatives appears to he effective at meetingfederal and state MCLs. Alternative P3 is ranked higher than Alternative P2 because it includesadditional contaminant removal in the source area using SVE.
Basal Aquifer Alternatives
Both Alternatives B2 and B3 provide adequate protection of human health and the environment bycontaining the basal aquifer source area and initiating remediation of the downgradient plume.The No-Action Alternative (B1) does not because there is no action taken to control the sourcearea, allowing continued migration of contaminants into downgradient areas that contain drinkingwater wells. Alternatives B2 and B3 both provide long-term effectiveness and permanence andwould allow RAOs to be reached in a short timeframe (3 to 5 years). Alternative B3 may achieveRAOs slightly faster than R2, if natural attenuation is not as effective as anticipated.
Alternatives B2 and B3 both satisfy EPA*s remedial action objectives and reduce long-term risksto human health and the environment by containing contaminated groundwater in the source area,containing and removing contaminant mass from the downgradient plume and reducing the potentialfor exposure by ensuring that the downgradient plume does not impact drinking water productionwells. The two-stage, air stripping and liquid-phase carbon adsorption treatment process
included in Alternatives B2 and B2 will be effective at meeting MCLs.
10.2 Compliance with ARARs
This evaluation criterion is also a threshold requirement and is used to determine if eachalternative would attain federal and state ARARs, or whether there is adequate justification forinvoking waivers for specific ARARs.
The No-Action Alternatives Pl and B1 do not meet ARARs. Both alternatives allow for continuedmigration of contaminants above MCLs toward downgradient drinking water wells and leaveconsiderable untreated waste(i.e., contaminated groundwater) in the aquifer.
Alternatives P2, P3, B2, and B3 were designed to meet the ARARs described in Section 12 of thisROD. These alternatives provide containment of contaminated basal groundwater as well asprotection of existing production wells.
10.3 Long-Term Effectiveness
This evaluation criterion assesses the extent to which each remedial alternative reduces riskafter the remedial action objectives are met. Residual risk can result from exposure tountreated waste or treatment residuals. The magnitude of the risk depends on the magnitude ofthe wastes and the adequacy and reliability of controls, if any, that are used to manageuntreated waste and treatment residuals. For this action, untreated waste refers to anycontaminated groundwater not removed from the aquifer.
The performance of the alternatives in relation to this criterion is evaluated primarily byestimating the extent to which each alternative prevents the migration of contaminatedgroundwater and how quickly the remedy can reduce basal aquifer concentrations to below MCLs.Preventing or reducing contaminant migration reduces contaminant concentrations in downgradientareas, reducing risk by reducing the likelihood of exposure.
Perched Aquifer Alternatives
Alternative P3 would aggressively remove COCs from the perched aquifer by a combination of SVEand groundwater extraction and treatment. Use of SVE with groundwater pumping would allowshutdown of the active remediation systems much sooner. In contrast, although it would alsoremove some COC mass, Alternative P2 essentially relies on long-term hydraulic containment forits effectiveness. Groundwater pumping would be required indefinitely (for more than 30 years)because it is not capable of removing sufficient quantity of COCs mass in dewatered areas of thesaprolite. Likewise, land use restrictions would have to be maintained for 30 years or more forAlternative P2 as compared to about eight years for Alternative P3. Alternative Pl would notachieve RAOs because it does not have an active remedy component that provides migration controlor containment of the contaminated groundwater. Contaminated groundwater would continue tomigrate downgradient and downgradient water supply wells would be vulnerable to COCcontamination. Alternative Pl would not generate any treatment residuals. Using thephytoremediation, Alternatives P2 and P3 will both generate relatively small volumes oftreatment residuals, primarily the vapor-phase carbon from treating the SVE system discharge.
Basal Aquifer Alternatives
Alternative B1 does not provide measures to ensure protection of human health and theenvironment (unlike the other alternatives). The other two alternatives (B2 and B3) wouldachieve RAOs.
Alternatives B2 and B3 would achieve the same endpoint, COCs below MCLs m the basal aquifer,upon completion of remedial action. Although less of the contaminated groundwater is activelycontained in Alternative B2 compared to B3, MNA of the downgradient plume, in conjunction withsource control, is likely to be effective and reliable. The performance of MNA would be verifiedby groundwater monitoring. Therefore, Alternative B2 has nearly the same long-term effectivenessand permanence as Alternative B3. Land use restrictions would be the same for Alternatives B2and 83 and are not included with Bl.
In Alternatives B2 and B3 the residual generated from treatment of contaminated groundwaterwould be spent granular activated carbon- both liquid phase and vapor phase. This spent granularactivated carbon would be either disposed or reactivated offsite. The transportation anddisposal/reactivation of this residual would be conducted in accordance with applicableregulations and would present /al long-term risks because contaminants adsorbed to the granularactivated carbon would be either destroyed during the reactivation process or effectivelycontained at permitted disposal facilities.
10.4 Reduction of Toxicity, Mobility, and Volume Through Treatment
This criterion addresses the preference, as stated in the NCP, for selecting remedial actionsemploying treatment technologies that permanently and significantly reduce toxicity, mobility,or volume of the hazardous substances as a principal element of the action. This preference issatisfied when treatment is used to reduce the principal threats at a site through destructionof toxic contaminants, reduction of total mass of toxic eon/ants, irreversible reduction incontaminant mobility, or reduction of total volume of contaminated media.
This evaluation focuses on the following factors for each remedial alternative:
• Whether the alternative satisfies the statutory preference for treatment as a principalelement
• The treatment process employed, including the amount of hazardous materials that will bedestroyed or treated and the degree of expected reduction in toxicity, mobility, or volume
• The degree to which treatment is irreversible
• The type and quantity of treatment residuals that will remain following treatment.
Perched Aquifer Alternatives
Alternatives P2 and P3 both satisfy the statutory preference for treatment. These alternativeswould significantly reduce the volume and mobility of contamination by inhibiting furthercontaminant migration down to the basal aquifer. The phytoremediation treatment technologycontemplated for perched groundwater in Alternatives P2 and P3 would irreversibly reduce thetoxicity and volume of contaminants in the extracted groundwater and result in an effluentstream that meets drinking water standards.
Alternative P3 provides the greatest reduction in volume of contaminant mass through treatmentbecause SVE, with vapor-phase carbon treatment, is added to the groundwater treatment.Alternative P2 includes only the groundwater treatment. Alternative Pl does not provide anyreduction in toxicity, mobility, or volume through treatment and does not satisfy the statutorypreference for treatment.
Basal Aquifer Alternatives
Over the life of the remedy, Alternatives B2 and B3 would provide a similar reduction incontaminant volume and mobility. However, Alternative B3 would provide a greater amount ofphysical treatment (both the source and downgradient areas) and somewhat higher total COC massremoval than Alternative B2, the difference in mass removal is not significant. This is becauseAlternative B3 involves removal of a very large volume of only slightly impacted groundwater.
Alternative B2 provides the treatment for the source area but may not include it for thedowngradient plume, if the contingent MNA is demonstrated to be effective. If additionalpump-and-treat is determined to be necessary for Alternative B2, it would be optimized based onthe additional site characterization data obtained. Alternative B1 does not provide treatment.
The treatment technologies considered for Alternatives B2 and B3, air stripping with off-gascontrols and liquid-phase carbon adsorption, would irreversibly reduce the toxicity and volumeof contaminants in the extracted groundwater and result in an effluent stream that meetsdrinking water standards. Both treatment technologies would result in the destruction of COCs ifthe granular activated carbon is regenerated.
10.5 Short-Term Effectiveness
This criterion evaluates the effects of each remedial alternative on human health and theenvironment during the construction and implementation phase until remedial action objectivesare met. The following factors are addressed for each alternative:
• Protection of workers and the community during construction and implementation phases.This factor qualitatively examines risk that results from implementation of the proposedremedial action and the effectiveness and reliability of protective measures.
• Environmental impacts. This factor addresses the potential adverse environmental impactsthat may result from the construction and implementation of an alternative. This factoralso evaluates the reliability of the available mitigation measures to prevent or reducepotential impacts.
• Time until RAOs are achieved. This factor considers the amount of time required toconstruct remediation facilities and meet the remedia1 action objectives.
Perched Aquifer Alternatives
Alternative Pl is not evaluated for this criterion because there is no construction orimplementation phase and RAOs would not be met. Alternative P3 would achieve RAOs and allowceasing groundwater extraction and treatment in an estimated 8 years, making it the only perchedaquifer alternative with a relatively short time to completion. Alternative P2 would requirelong-term (more than 30 years) operation, maintenance, land use restrictions, and monitoring tocontinue to achieve RAOs. Neither Alternative P2 or P3 pose unmitigable risks to the communityor the environment during construction or implementation. The alternatives would involve thegeneral construction hazards associated with any large construction project.
Basal Aquifer Alternatives
Alternative Bl is not evaluated for this criterion because there is no construction orimplementation phase and RAOs would not be met. Alternatives B3 and B2 would take approximatelythe same amount of time to achieve RAOs in the basal source area. For the downgradient plume,Alternative B3 would likely achieve RAOs in the downgradient plume somewhat faster thanAlternative B2. However, the time required for Alternative B3 to reach RAOs in the downgradientplume is dependent on the effectiveness of source control, the time required to characterize theplume adequately, and the time required to construct and implement the downgradient extractionand treatment system (after p1ume characterization). Modeling results indicate that, once sourcecontrol is implemented, COC concentrations in the downgradient plume will be reduced rapidlythrough natural attenuation (estimated three to five years). Therefore, the time to achieve RAOswill not be substantially different for Alternatives B2 and 83.
Neither Alternative P2 or P3 pose unmitigable risks to the community or the environment duringconstruction or implementation. The alternatives would involve the general construction hazardsassociated with any large construction project.
10.6 Implementability
This criterion addresses the technical and administrative feasibility of implementing analternative and the availability of various services and materials required during itsimplementation. The following factors are considered:
Technical Feasibility
• Ability to construct and operate: addresses any technical difficulties and unknownsassociated with construction or operation of the technology
• Reliability of technology: focuses on the likelihood that technical problems associatedwith implementation will lead to schedule delays
• Ease of undertaking additional remedial action: includes a discussion of what, if any,future remedial actions may need to be undertaken and how the remedial action wouldinterfere with, or facilitate, the implementation of future actions
Administrative Feasibility
• Coordination with other agencies, including the need for agreements with parties otherthan EPA required for construction and operation of the remedy.
• Availability of necessary equipment, specialists, and provisions to assure any necessaryresources
• Availability of services and materials, plus the potential for obtaining competitive bids
Perched Aquifer Alternatives
Alternative Pl is not evaluated for this criterion because no action is implemented. Asdescribed above, the implementability evaluation incorporates several factors. Each of these isdiscussed separately in the following text.
Technical Feasibility: Ability to Construct and Operate. The capping, extraction, treatment, andmonitoring technologies included in Alternatives P2 and P3 are all relatively straightforward toconstruct and operate. Much of the groundwater extraction, treatment and monitoring system hasalready been constructed and operated.
There are operational difficulties expected with operation of the SVE system included inAlternative P3 because of the clayey soils present in the perched aquifer.
Technical Feasibility: Reliability of Technology. The extraction, SVE, and monitoringtechnologies included in Alternatives P2 and P3 are proven and known to be reliable. Theproposed phytoremediation treatment technology is an innovative technology that does have aproven record of long-term reliability in this particular application. However, extensivepilot-scale and full-scale testing of the technology for treatment of the extracted groundwaterfrom the perched aquifer in the KVA has provided very favorable results.
Technical Feasibility: Ease of Undertaking Additional Remedial Actions. The alternativeswould not interfere with the implementation of future response actions to further containcontamination or restore groundwater in the Del Monte Site area.
Administrative Feasibility. Implementation of Alternatives P2 and P3 require that institutionalcontrols be established in the Kunia Village source area that will restrict land-use activitiesuntil the remedial action is completed. lt may be more difficult to implement and maintain theland use restrictions for the 30 years or more that would be required for Alternative P2compared to the 8 years for Alternative P3. Therefore, from an administrative feasibilityperspective, Alternative P3 would be somewhat easier to implement that Alternative P2.
Availability of Services and Materials. Required services and materials are believed to beavailable for implementation of Alternatives P2 and P3, including qualified contractors forconstruction and operation of the necessary facilities.
Overall, Alternative P2 is ranked slightly higher than Alternative P3 for the implementabilitycriterion.
Basal Aquifer Alternatives
Alternative BI is not evaluated for this criterion because no action is implemented. Asdescribed above, the implementability evaluation incorporates several factors. Each of these isdiscussed separately in the following text.
Technical Feasibility: Ability to Construct and Operate. Alternative B2 requires constructionand operation of a relatively large groundwater treatment system. However, because the KuniaWell and Basal Well are already installed, Alternative B2 cou1d be implemented relatively
quickly. In contrast, Alternative B3 would be more difficult to implement because it involvesconstruction and operation of the additional downgradient extraction, conveyance and treatmentsystem. Alternative B3 would most 1ikely also require installation of a network of injectionwells to return treated groundwater to the aquifer. Although the larger system in A1ternative 83will be more difficult to implement, there do not appear to he any significant technical issuesthat would inhibit construction or operation.
Technical Feasibility: Reliability of Technology. The extraction, treatment, and monitoringtechnologies included in Alternatives B2 and B3 are generally proven and known to be reliable.The reliability of the MNA component of Alternative B2 is not known at this point. Although MNAhas proven to be effective and reliable at many sites, little information is available on thedowngradient. plume at the Del Monte Site to assess its reliability in this application.
Technical Feasibility: Ease of Undertaking Additional Remedial Actions. The alternativeswould not interfere with the implementation of future response actions, if necessary, to restoregroundwater in the Del Monte Site area. As a contingency measure, monitoring wells installed inthe downgradient plume during site characterization will be constructed to allow them to he usedas potential future extraction wells, if necessary.
Administrative Feasibility. A1ternatives H2 and 83 both require that institutional controls bein place during implementation of the remedial action to prevent activities that might interferewith the effectiveness of the remedy. There is some uncertainty regarding the ease with whichadequate land use controls can be obtained. The land use restrictions would be the same for bothalternatives and would therefore involve the same degree of difficulty to implement.
In addition, implementing Alternative B3, and potentially Alternative B2, may require resolutionof administrative issues associated with groundwater extraction in excess of Del Monte’sallocation and re-injection of treated groundwater back into the aquifer.
Availability of Services and Materials. Required services and materials are believed to beavailable, including qualified contractors for construction and operation of the necessaryfacilities.
Overall, Alternative R3 would be the somewhat more difficult to implement than Alternative B2.It involves construction and operation of a source-area treatment system (the same asAlternative B2), plus detailed characterization of the downgradient groundwater plume, followedby construction of a very large extraction and treatment system (much larger than the sourcearea system).
10.7 Cost
This criterion addresses the total cost of each alternative. This includes short-term andlong-term costs, and capital and O%M costs. The following cost elements are considered for eachalternative:
• Capital Cost. Direct capital cost includes the cost of construction, labor, equipment,land, site development, and service. Indirect capital cost includes engineering fees,license and permit cost, startup and shakedown costs, and contingencies.
• O&M Cost. Annual O&M cost includes operating labor cost, maintenance materials and labor,pumping and treatment energy costs, monitoring costs, and all other post-constructioncosts necessary to ensure continuous effective operation of the alternative.
• Total Present Worth. The total present worth of each alternative is calculated at adiscount rate of 5 percent and a maximum time period of 30 years. Total present worth foreach alternative includes capital cost plus the present worth of the annual O&M costs.
The cost estimates are considered order-of-magnitude level estimates (i.e., the cost estimateshave an expected accuracy of +50 to -30 percent).
Although there is no cost presented for the no-action alternatives (Alternatives Pl and B1),there is a potential substantial financial impact to downgradient water purveyors if the
continued migration of contamination impacts their production wells. Table 12 summarizes theestimated costs for Alternatives B2, H3, P2, andP3.
Table 12 compares the cost of each alternative for capital costs, long-term O&M costs, andpresent worth. The short-term capital costs for perched aquifer alternatives are $720,000 forAlternative B2 and $1,460,000 for Alternative P3. For basal aquifer alternatives, theAlternative B2 capital cost is approximately $4,270,000 and Alternative B3 $8,730,000. The netpresent worth of the annual O&M costs are $1,360,000 for Alternative B2 and $1,590,000 forAlternative B3. For the basal aquifer alternatives, the present worth of the annual O&M is$5,580,000 for Alternative B2 and $9,170,000 for Alternative B3. The total present worth of thefour alternatives range from a low of $2,100,000 for Alternative P2 to $17,900,000 forAlternative B3.
10.8 State Acceptance
In a letter dated September 22, 2003, the Hawaii State Department of Health, as lead agency forthe state, concurred with EPA's selected remedy.
10.9 Community Acceptance
EPA received one written comment on the Proposed Plan. The pertinent oral comments from thepublic meeting held on April 2, 2003 and all of the written comments received during the 30-daypublic comment period, along with EPA's responses to them, are presented in the ResponsivenessSummary in Part III of this ROD. The transcript for the public meeting is available at EPA'sSuperfund Records Center at EPA's Regional Office in San Francisco, and locally at the Del MonteSite Information Repository at the Wahiawa Public Library. None of the oral or written commentsreceived warranted a change to the proposed remedy.
11 Selected Remedy
After considering CERCLA's statutory requirements, the detailed comparison of the alternativesusing the nine evaluation criteria, and public comments, EPA, in consultation with the State ofHawaii, has determined that the most appropriate remedy for this site is Alternative P3 -Groundwater Extraction and Treatment with Capping and SVE for the perched aquifer andAlternative B2 - Phased Pump and Treat with Contingent Monitored Natural Attenuation for thebasal aquifer.
Summary of Rationale for the Selected Remedy
Perched Aquifer
No-Action Alternative Pl provides the least overall protection of human health and theenvironment and does not fully comply with State and Federal requirements (ARARs). Considered inconjunction with the basal aquifer alternatives, Alternatives P2 and P3 both satisfy the RAOsand satisfactorily meet the threshold criteria of overall protection of human health and theenvironment and compliance with State and Federal requirements. Alternatives P2 and P3 bothaddress containment of the perched aquifer source area. The perched aquifer source area containsconsiderable mass of COCs and is continuing to contribute contamination to the basal aquifer.EPA considers controlling migration out of the perched aquifer and removing this source ascritical. Estimates indicate that Alternative P3 would achieve perched aquifer RAOs and allowceasing groundwater extraction and treatment in an estimated eight years. In contrast,Alternative P2 would likely require long-term (more than 30 years) operation, maintenance, landuse restrictions, and monitoring to continue to achieve RAOs.
EPA has designated contaminated deep soil (below 20 feet) in the Kunia Village source area as aprincipal threat waste at the site. This designation is based on the deep soil source materialcontaining significant concentrations of highly toxic materials that have been shown to bemobile in the subsurface and that represent a significant risk to human health or theenvironment should exposure occur. It should be noted that the depth of these source materials(greater than 20 feet bgs) makes human exposure very unlikely, however the contaminated soildoes represent a substantial threat to groundwater resources. Alternative P3 satisfies the
preference in the NCP that EPA address principal threats wherever practicable (NCP Section300.430(a)(1)(iii)(A)).
The principal threat waste will be addressed through dewatering (groundwater extraction), thenextraction and treatment of the contaminants using the SVE system. In addition, the cap to beinstalled over the source area will minimize potential transport of contaminants away from theprincipal threat waste by reducing infiltration. Institutional controls plus access restrictions(fences and signage) will minimize potential exposure to the principal threat waste and ensurethat nothing interferes with implementation of the remedy.
Basal Aquifer
No-Action Alternative B1 provides the least overall protection of human health and theenvironment and does not fully comply with State and Federal requirements (ARARs). AlternativesB2 and B3 both satisfy the RAOs and satisfactorily meet the threshold criteria of overallprotection of human health and the environment and compliance with State and Federalrequirements. Alternatives B2 and B3 both address remediation of the basal aquifer, in thesource area and downgradient. The basal aquifer is used as a source of drinking waterdowngradient of the KVA and remediation of the basal aquifer is a high priority. Alternative B3could potentially achieve RAOs slightly more quickly than Alternative B2, but Alternative B3would be much more expensive than Alternative B2 (see Table 12) for very limited additionalbenefit. Also, there may be additional implementability issues in trying to build and operatethe more extensive groundwater extraction and treatment system in the downgradient plume.
The selected remedy, Alternatives P3 and B2, meets the two Superfund threshold evaluationcriteria, overall protection of human health and the environment and compliance with ARARs, andprovides the best balance of the remaining Superfund evaluation criteria.
11.1 Description of the Selected Remedy
The selected remedy will be implemented using a performance-based approach. Theperformance-based approach specifies criteria (“performance criteria”) that must be met whileallowing flexibility in implementation. The performance criteria described below are designed toattain the RAOs for the Del Monte Site. EPA's RAOs for the selected remedy are to:
• Prevent exposure of the public to groundwater contaminated in excess of MCLs (as is notedabove in Section 8 and reiterated in Table 13, EPA has selected State of Hawaii MCLs asthe chemical-specific cleanup standards for the basal aquifer for EDB, DBCP and TCP sincethey are lower than the Federal MCLs. EPA has selected the Federal MCL as the chemicalspecific cleanup standard for DCP for the basa1 aquifer).
• Minimize further migration of contamination away from the KVA;
• Limit migration of KVA perched groundwater and deep soil contaminants into the basalgroundwater such that basal groundwater concentrations do not exceed MCLs, and;
• Restore groundwater to its beneficial use of drinking water supply within a reasonabletimeframe.
The selected remedy addresses the perched aquifer and deep soils in the KVA and the basalaquifer. For purposes of describing the remedy, the basal aquifer has been separated into twoareas: l) the Kunia Village Area or the source area and 2) the downgradient plume.
Actual technologies and sequence of technologies used will be determined during remedial design.Minor modifications of the remedy may occur during remedial design. However, public notice wouldbe given by EPA if there were any significant changes to the remedy and any fundamental changeswould be subject to public comment.
11.1.1 Perched Aquifer Remedy
The perched aquifer remedy includes pit backfill (already completed), soil capping, SVE,groundwater extraction, groundwater treatment, institutional controls, and monitoring. The major
components of this alternative are:
• Backfilling the pit (already completed).
• Construction of a vegetated soil cover, including appropriate storm water controls, overthe perched aquifer source area. A soil cover would consist of a minimum of 30 inches ofclean compacted soil fill overlain by 6 inches of vegetated topsoil. Maintenance of thevegetated soil cover would continue for as long as groundwater monitoring is continuing.
• Installation of an SVE system in the perched aquifer source area to remove contaminantmass from the deep soil (a principal threat waste) and reduce perched aquifer impacts onthe basal aquifer. Treatment of the extracted soil vapor via carbon adsorption.
• Installation of a groundwater extraction system to provide hydraulic containment andactive dewatering of the perched aquifer source area. Treatment of the extractedgroundwater via phytoremediation. If phytoremediation is proven to not be effective,implement physical treatment.
• Implementation of institutional controls to prevent exposure to perched aquifer soil andgroundwater that is impacted by COCs and to prevent activities that might interfere withthe effectiveness of the remedy. Specific institutional controls are expected to include:1) site access restrictions for all components of the perched aquifer remedy (e.g., fenceswith locked gates and warning signs), 2) a binding agreement between EPA and the owner ofthe Kunia Section of the Site providing for notice in the deed of the deep soil andgroundwater contamination, and 3) governmental controls including well permittingrequirements. Maintenance of institutional controls will continue until remediation goalsare achieved and post operation monitoring is complete.
• Operation of the groundwater extraction and SVE systems until the perched aquifercontamination is reduced such that it can no longer cause exceedances of MCLs in the basalaquifer.
• Monitoring groundwater and soil vapor until remediation goals are achieved.
The perched aquifer source area refers to the portion of the perched aquifer in the KuniaVillage area where concentration of COCs in groundwater exceed 1 pg/L. Based on the datacollected during the RI and post RI field investigations, the boundaries of the perched aquifersource area are illustrated on Figures 7, 8 and 9, as the areas exceeding 1 µg/L. However, thereare still areas where the location of the 1 µg/L contour is uncertain. Additional perchedaquifer investigations will be performed during remedial design to complete the delineation ofthe source area and to conduct an SVE pilot test. Based on the additional data collected duringremedial design, EPA may modify the boundaries of the perchedaquifer source area.
Soil Cap Performance Criteria
• The soil cap shall extend laterally across the entire perched aquifer source area.
• The soil cap shall, at a minimum, consist of an 30-inch thick compacted fill layerconstructed from available clean cover soil material, overlain by 6 inches of top soil.
• The grading and stormwater controls shall be sufficient to ensure that standing water doesnot accumulate on the vegetated soil cover.
• The vegetation selected for the soil cap shall be similar to existing vegetation in thearea and require minimal irrigation.
Compliance with Soil Cap Performance Criteria
Compliance will initially be demonstrated during construction by ensuring that the cap meets theminimum thickness criteria presented above.
As part of long-term O&M, visual monitoring will be conducted routinely to verify the continuedintegrity of the cap, including observing the status of site fencing and signage, confirmingthat standing water is not present on the cap, and monitoring for excessive erosion of the cap.The details of the long-term compliance monitoring will be described in a Compliance MonitoringPlan, submitted for EPA approval during remedial design.
Soil Vapor Extraction (SVE) Performance Criteria
The SVE system shall remove contaminant mass from the perched aquifer source area unsaturatedzone starting at 20 feet below ground surface by exerting a pressure influence across the entiresource area.
The SVE system in the perched aquifer source area will operate until the COC mass in soil hasbeen reduced such that the source-area contamination no longer would result in exceedances ofMCLs in basal aquifer groundwater. This will require that DBCP mass be reduced by 95 percent andEDB and DCP mass reduced hy 75 percent (DCP has not yet exceeded MCLs in the basal aquifer andthe 75 percent removal rate is expected to be sufficient to ensure long-term protection of thebasal aquifer). The initial mass estimated during the RI/FS is 28 kilograms (kg) of DRCP and 11kg of EDB. An initial mass estimate for DCP was not developed during the RI/FS. Based on theRI/FS data and soil vapor and soil data collected during remedial design, EPA will develop a DCPinitial mass estimate and wi11 reevaluate the initial mass estimates for DBCP and EDB. EPA mayfurther revise the mass estimates based on soil vapor collected during remedy implementation.
The SVE system shall be designed with enough extraction wells and a high enough extraction rateto produce a contaminant mass removal rate sufficient to reach the mass removal goals within 8years (in conjunction with the perched aquifer groundwater extraction system). If warranted, EPAmay extend this target remediation timeframe based on SVE performance data collected from theSVE treatability study to he conducted during remedial design or during implementation of theremedy.
In addition, the SVE system shall operate as long as the basal aquifer source area extractionsystem is operating, including any resumption of extraction caused by MCL exceedances during thepost-operation monitoring period (described below in Section 11.1.2).
During implementation of the remedy, if SVE and perched aquifer groundwater extraction system(described below) operational data indicate that mass removal rates have dropped substantiallysuch that the system is no 1onger effectively removing contaminant mass (and mass removal ratesdo not improve after attempting a pulse-style operating mode), EPA may shutdown the systembefore the mass removal targets have been reached. However, the status of the basal aquifersource area groundwater action wi11 be evaluated before early shutdown of the perched aquifersystems (SVE and groundwater) will be considered.
The SVE vapor treatment system must comply with all of the ARARs for air emissions described inSection 12. In addition, the treatment unit sha11 attain a minimum removal efficiency of 80percent for each COC.
Any liquids generated by the SVE system shall be added to the perched aquifer extractedgroundwater and treated using the phytoremediation system.
Compliance with SVE Performance Criteria
Pressure measurements will be performed at extraction wells and monitoring points throughout thesource area to demonstrate compliance. In addition, annual evaluations will be performed of boththe total mass removed and the percentage of the initial mass that has been removed for eachCOC. Data points to be used to demonstrate inward pressure gradients throughout the source areaand the processes to be used to estimate mass removal rates and vo1umes will be defined duringremedial design.
The treatment unit influent and effluent vapor quality will be monitored to ensure compliancewith ARARs and the minimum removal efficiency requirements described above.
Perched Aquifer Groundwater Extraction Performance Criteria
The perched groundwater phytoremediation treatment system shall be a closed loop system with nodischarge of the extracted groundwater through either subsurface infiltration or subsurfacedischarge.
The groundwater extraction system shall inhibit downward migration of groundwater from theperched aquifer source area to the basal aquifer throughout the source area by hydrauliccontainment or dewatering.
Similar to the SVE system, the groundwater extraction system in the perched aquifer source areawill operate until the COC mass in soil and groundwater has been reduced such that the sourcearea contamination no longer would result in exceedances of MCLs in basal aquifer groundwater.This will require that DBCP mass be reduced by 95 percent and EDB and DCP mass reduced by 75percent. For DBCP and EDB, these percent reductions were calculated in the FS based on themagnitude of drinking water standard exceedances detected in the Kunia Well, located in thebasal aquifer source area (as is noted above in the SVE discussion, DCP has not yet exceeded itsMCL in the basal aquifer and the 75 percent removal rate is expected to be sufficient to ensurelong-term protection of the basal aquifer). For example, DBCP was detected at approximately 20times the drinking water standard (or MCL), so the perched aquifer source area concentrationsneed to be reduced by 95 percent (20 times) to bring the basal aquifer concentrations down tobelow drinking water standards.
For this ROD, mass reduction will be used as the performance standard, rather than a reductionin concentration. The mass estimated during the RI/FS is 28 kg of DBCP and 11 kg of EDB. Aninitial mass estimate for DCP was not developed during the RI/FS. Based on the RI/FS data andsoil vapor and soil data collected during remedial design, EPA will develop a DCP initial massestimate and will reevaluate the initial mass estimates for DBCP and EDB. EPA may further revisethese mass estimates based on soil vapor and soil data collected during remedy implementation.
In addition, the perched aquifer groundwater extraction system shall operate as long as thebasal aquifer source area extraction system is operating, including any resumption of basalaquifer extraction caused by MCL exceedances during the post-operation monitoring period.
As is noted above in the SVE discussion, if the combined perched aquifer groundwater/SVE systemoperational data indicate that mass removal rates have dropped substantially such that thesystem is no longer effectively removing contaminant mass (and mass removal rates do not improveafter attempting a pulse-style operating mode), EPA may shutdown the systems before the massremoval targets have been reached. However, the status of the basal aquifer source areagroundwater action will be evaluated before early shutdown of the perched aquifer systems willbe considered.
Compliance with Perched Groundwater Extraction Performance Criteria
Water level measurements will be collected from extraction wells and monitoring pointsthroughout the source area to demonstrate compliance with the hydraulic control/dewateringrequirement. Annual evaluations will be performed of both the total mass removed and thepercentage of the initial mass that has been removed for each COC. The data points to be used todemonstrate hydraulic control (e.g., inward gradients) throughout the source area and theprocesses to be used to estimate mass removal rates and volumes will be defined during remedialdesign.
The phytoremediation treatment system shall undergo routine visual monitoring to ensure that noleaks are occurring from the system. In addition, a water balance for the treatment unit shallbe developed and tracked to ensure that all water can be accounted for, thus minimizing thepotential for undetected subsurface leaks from the system.
Perched Aquifer Institutional Controls Performance Criteria
1) To provide notification of the presence of hazardous substances.
2) To minimize the potential for exposure to contaminated soils and groundwater.
3) To prevent activities that might damage or affect the integrity of either the cap or the phytoremediation cells.
4) To prevent damage or interference with groundwater monitoring or extraction wells associated with the perched aquifer remedy.
5) To prevent any activities that might interfere with the effectiveness of the remedy.
6) To prevent development of the Kunia Village source area for commercial, industrial, or residential use until remediation and post-operation monitoring is complete so as to protect the public from exposure to contaminated soil and groundwater.
Compliance with Perched Aquifer Institutional Control Performance Criteria
Routine site monitoring shall be performed to ensure that site access restrictions remain ineffect and to ensure that there has been no damage or adverse affect upon any component of theperched aquifer remedy.
Land use restrictions shall be put in place requiring the following:
• The owner must give notice of all institutional controls to any lessees of any portion ofthe Site.
• The owner must give 6 months prior notice to EPA before any sale of any portion of theSite.
• The owner must identify to EPA all lessees on any portion of the Site within 30 days ofsuch lessees occupying any portion of the Site.
• Without prior review and written approval by EPA, the owner of the Kunia Section of theSite shall not undertake or allow any activities which: damage or affect the integrity ofthe cap; damage or affect the integrity of the pkytoremediation cells; damage or interferewith the groundwater monitoring or extraction wells; or excavate or disturb contaminatedsoil.
• To ensure that the public is protected from exposure to contaminated soil and groundwater,the owner of the Kunia Section of the site shall not allow development of the KuniaVillage source area for commercial, industrial, or residential use until remediation andpost-operation monitoring is complete or until EPA agrees that such development will notcause a threat to public health.
11.1.2 Basal Aquifer Remedy
The basal aquifer remedy is groundwater extraction and treatment with contingent monitorednatural attenuation. The remedy includes installation of monitoring we1ls to characterize thesource area and downgradient plume; source area groundwater extraction, treatment and discharge;and downgradient plume monitoring to determine if natural attenuation is effective at reducingCOC concentrations to MCLs. If monitoring data shows that natural attenuation is not effectiveat reducing contaminant concentrations to MCLs within 5 years, then additional groundwaterextraction will be implemented to insure that the entire plume is captured and treated.
As an additional contingency, point-of-use treatment at downgradient drinking water wells willbe implemented if the wells become impacted by contaminants from the site. Finally, the remedyincludes Institutional Controls to insure that land use is restricted to prevent activities thatmight interfere with the effectiveness of the remedy and to prevent the installation of drinkingwater supply wells in the plume. Major components of the selected remedy are:
• Installation of monitoring wells to characterize the extent of contaminated groundwater inboth the source area and the downgradient plume.
• Extraction of basal groundwater in the Kunia Village source area to provide hydrauliccontainment of the source area and eliminate the source of COCs to the downgradient plume.The extraction system will operate until the basal aquifer source area contamination isreduced to below MCLs and the perched aquifer remedy is complete.
• Treatment of extracted groundwater via air stripping and liquid-phase carbon adsorption,followed by discharge of the treated water for irrigation use.
• Evaluation of whether natural attenuation is acting to reduce contaminant concentrationsin the downgradient plume.
• Potentially, contingent monitored natural attenuation to address the basal aquiferdowngradient plume. The criteria that will be used to trigger implementation of themonitored natural attenuation action are described below.
• Potentially, groundwater extraction and treatment to address the basal aquiferdowngradient plume. The criteria that will be used to trigger implementation of extractionand treatment are described below.
• Implementation of a monitoring program sufficient to monitor the effectiveness of sourcecontrol and either natural attenuation of or extraction from the downgradient plume.Monitoring will continue for at least 5 years after cleanup standards are reached toensure that the concentrations are stable and remain below the cleanup standards.
• Implementation of institutional controls to prevent exposure to basal groundwater impactedby COCs and to prevent activities that might interfere with the effectiveness of theremedy while the groundwater cleanup is progressing. Specific institutional controls areexpected to include: 1) site access restrictions for all components of the basal aquiferremedy (e.g., fences with locked gates and warning signs), 2) a binding agreement betweenEPA and the owner of the Kunia Section of the Site providing for notice in the deed of thegroundwater contamination, and 3) governmental controls including both groundwater userestrictions and well permitting requirements.
• Potentially, contingent installation of point-of-use treatment at downgradient drinkingwater supply wells in the event they become impacted by contaminants from the Del MonteSite.
The basal aquifer source area refers to the extent of basal aquifer contamination that islocated vertically beneath the perched aquifer source area (described above in Section 11.1.1),plus a buffer zone of 25 percent beyond the perched aquifer source area boundary. /s buffer zoneis intended to account for the lateral spread of contamination as it travels downward from theperched aquifer to the basal aquifer. This 25 percent buffer applies around the entire perchedaquifer source area because the lateral spreading during downward migration could be in anydirection. As an example, if the east-west width of the perched aquifer source area is 400 feet,the basal aquifer source boundary would extend l00 feet beyond the eastern and westernboundaries of the perched aquifer source area boundary. As is described in detail in Section1l.1.1, the boundary of the perched aquifer source area has not yet been defined in alldirections. EPA will determine the final boundaries of the perched aquifer and basal aquifersource areas during remedial design.
Basal Aquifer Source Area Groundwater Extraction Performance Criteria
The remedial action shall provide sufficient hydraulic control to prevent further lateral andvertical migration of groundwater contaminated above MCLs out of the basal aquifer source area.Implementation of the basal aquifer source area extraction will be phased. At a minimum, thefirst phase will include extraction from the Kunia Well. Groundwater monitoring during phase onewill provide data on the performance of groundwater extraction from the Kunia Well. EPA will usethese data, in conjunction with the final basal aquifer source area boundaries to determinewhether additional extraction is required.
The basal aquifer source area groundwater extraction system will operate until the COCconcentrations me below MCLs (Table 13). Basal aquifer source area monitoring must continue for
at least five years after extraction has stopped to monitor for potential rebounds incontaminant concentrations. Ln addition, basal aquifer source area monitoring must continue forat least five years after the perched aquifer remedy has met its remediation goals. If MCLexceedances arc detected at any time during basal aquifer source area monitoring, groundwaterextraction from the basal aquifer source area wi11 resume.
Compliance with Basal Aquifer Source Area Groundwater Extraction Performance Criteria
Demonstration of hydraulic control (i.e., inward gradients) must be used to demonstrate that thegroundwater extraction is controlling lateral and vertical migration of contaminated groundwaterout of the basal aquifer source area. Hydrau1ic control must be demonstrated throughout thebasa1 aquifer source area.
COC concentrations in water extracted from the basal aquifer source area will be monitored totrack the progress of source area cleanup.
Basal Aquifer Downgradient Plume - Phased Implementation Approach and PerformanceCriteria
The ultimate objective for the basal aquifer portion of the remedial action is to restore thebasal aquifer to its beneficial use. The beneficial use of the basal aquifer is as a source ofdrinking water and the aquifer is currently used for this purpose downgradient of the Del MonteSite. Based on the information gathered to date, EPA believes that the selected remedy willachieve this objective in a reasonable timeframe.
The downgradient plume portion of the basal aquifer remedy will be implemented in two phases.Phase 1 will include installation of monitoring wells to determine groundwater flow directionand the extent of the basal aquifer downgradient plume, plus evaluation of monitoring data toassess the effectiveness of MNA. Phase 2 will include either implementation of the MNAcontingency or implementation of downgradient groundwater extraction and treatment if MNA is noteffective. The basal aquifer downgradient plume refers to the area exceeding MCLs downgradientof the source area boundary. There are currently no monitoring wells in the basal aquifer todefine the extent of contamination downgradient of the Kunia Village area. During phase one, asufficient number of monitoring wells will be installed (or existing wells identified) andmonitored to achieve the following objectives: 1) determine the downgradient and lateral extentof the basal aquifer source area; 2) determine groundwater flow direction downgradient of thebasal aquifer source area; 3) delineate the downgradient extent of cleanup standard exceedancesin the basal aquifer; 4) track the distribution of contamination between the source area andleading edge of the plume; 5) monitor the leading edge of basal aquifer contamination to ensurethat no exceedances of cleanup standards occur; and, 6) monitor upgradient of the nearestdowngradient drinking water wells to provide early warning of potential impacts to the drinkingwater wells. The well (or wells) installed downgradient of the leading edge of contaminationwill be used as a point of compliance monitoring well. Monitoring wells located within the basalaquifer plume downgradient of the source area are termed performance monitoring wells and willbe used to provide information for objectives 1, 3, and 4. Monitoring wells located upgradientof drinking water wells (objective S) are termed sentinel wells. If properly located, amonitoring well may serve two purposes (e.g., the point of compliance well could potentiallyalso serve as a sentinel well).
The leading edge of the downgradient basal aquifer plume is expected to be no more than 4,500feet downgradient of the Kunia Village source area (Figure 10). Based on modeling conducted aspart of the RI/FS, this distance represents the furthest distance downgradient from the sourcearea that groundwater exceeding MCLs could migrate using “worst-case” assumptions. At least onemonitoring well will be installed downgradient of the source area near this predicted maximummigration distance. If this initial point of compliance well indicates that cleanup standardsare already exceeded at the 4,500 foot downgradient point, EPA will either require a replacementpoint of compliance monitoring well located further downgradient or determine that the MNAcontingency is not appropriate. The MNA contingency will not be appropriate if the basal aquifersource area extraction system is operational, the leading edge concentrations are high, andinsufficient time exists to determine that MNA is effective before a drinking water well wouldbe impacted.
Once the downgradient extent of the plume has been established and a point of compliancemonitoring point installed, if a verified MCL exceedance occurs at this point of compliancewell, EPA may require that the basal aquifer downgradient plume extraction and treatment action(described below) be implemented.
After construction of the phase one monitoring system is complete, routine quarterly monitoringwill be conducted to evaluate the downgradient plume and to monitor performance of sourcecontrol. If no exceedances are detected at the point of compliance monitoring well, monitoringduring phase one will be conducted for three years to ensure that sufficient information isavailable to select phase two of the remedial action. A three year timeframe was selectedbecause MNA has been predicted to achieve cleanup in three to five years. Accordingly, thereshould be substantial evidence of the performance of MNA within three years.
If there is sufficient evidence to suggest that natural attenuation, in conjunction withcontainment of the source area, can be effective at reducing COC concentrations to MCLs in areasonable timeframe, phase two will include implementation of contingent monitored naturalattenuation. If the data collected during phase one indicate that natural attenuation will notbe effective, phase two will include groundwater extraction and treatment for the basal aquiferdowngradient plume. Performance criteria for both of the phase two options are described below.
Basal Aquifer Monitored Natural Attenuation Performance Criteria (if implemented)
The performance standards for the potentia1 monitored natural attenuation component of theremedy require that COC concentrations throughout the downgradient plume must be reduced tobelow cleanup standards within 5 years of establishing contaminant of the basal aquifer sourcearea (5 years is selected because the remediation timeframe estimates from the FS indicate thatMNA should reduce COC concentrations to below drinking water standards within 3 to 5 years aftersource control is achieved) and that groundwater exceeding cleanup standards must not migratebeyond the point of compliance monitoring well (described above).
During phase one, performance monitoring wells will be installed upgradient of the leading edgeof contamination (expected to be less than 4,500 feet downgradient) to help define the currentextent of the downgradient plume and to provide data for evaluating whether the naturalattenuation is progressing as expected. Progressing as expected means that the plume is stable,downgradient concentrations are decreasing and all cleanup standards will be met within 5 yearsof containing the source area. The progress of natural attenuation will be evaluated annually.
Compliance with Basal Aquifer Monitored Natural Attenuation Performance Criteria
Compliance with the performance criteria will be confirmed by quarterly groundwater sampling atthe downgradient performance, point of compliance and sentinel monitoring wells.
Compliance with the 5-year cleanup requirement will be based on an annual technical evaluationof the progress of natural attenuation.
Basal Aquifer Downgradient Plume Groundwater Extraction Performance Criteria (IfImplemented)
If implemented, the downgradient plume groundwater extraction action wi11 include groundwaterextraction in the downgradient plume, groundwater treatment and discharge of treated water.
EPA will determine the location and magnitude of groundwater extraction required based ongroundwater conditions at the time the phase two action is selected. The groundwater extractionimplemented as part of a phase two action must be sufficient to ensure that groundwater cleanupstandard are not exceeded at a point of compliance. EPA will identify the point of compliance atthe time a phase two groundwater extraction action is selected. The point of compliance will belocated downgradient of the leading edge of the downgradient basal aquifer plume.
The groundwater treatment performance criteria are described below . The treated water shalleither be discharged for irrigation use by Del Monte or, if the volumes exceed irrigationrequirements or water rights, the treated water shall be injected back into the basal aquiferdowngradient of the point of compliance.
Compliance with Basal Aquifer Downgradient Plume Groundwater Extraction Remedy PerformanceCriteria (If Implemented)
Compliance with the performance criteria will be determined through demonstration of hydrauliccontrol (i.e., inward lateral and vertical gradients) at the leading edge of the downgradientplume.
The potential phase two groundwater extraction system shall operate until concentrationsthroughout the downgradient plume are below MCLs.
The annual report will document that all treated water was either used for irrigation orinjected in the aquifer in accordance with ARARs.
Basal Aquifer Groundwater Treatment Performance Criteria
COCs will be removed to below MCLs from the extracted basal aquifer groundwater by air strippingand liquid-phase carbon adsorption. 1f necessary to comply with ARARs, the air-stripping off-gaswill be treated with vapor-phase carbon adsorption. However, because of the relatively low COCconcentrations in the basal aquifer, it is likely that off-gas controls will not be necessary tomeet ARARs. If alternative treatment technologies are identified instead of air stripping andcarbon adsorption, EPA will evaluate the alternative technology during remedial design using thesame nine Superfund evaluation criteria employed to evaluate remedial alternatives (as describedin Section 10 above and in 40 C.F.R. Section 300.430).
The groundwater treatment plant shall meet the effluent discharge standards, which are MCLs(Table 13), on a continuous basis.
Compliance with Basal Aquifer Groundwater Treatment Performance Criteria
COC concentrations will be monitored in the treatment unit effluent.
Basal Aquifer Institutional Controls Performance Criteria
1) To provide notification of the presence of hazardous substances.
2) To minimize the potential for exposure to contaminated groundwater.
3) To prevent damage or interference with any components of the basal aquifer remedy.
4) To prevent any change in the current use of the land, i.e., from pineapple farming, to commercial, other industrial, or residential use, until phase two of the downgradient plume portion of the basal aquifer remedy has been implemented and post-operation monitoring is complete.
Compliance with Basal Aquifer Institutional Control Performance Criteria
Routine site monitoring shall be performed to ensure: 1) that site access restrictions remain ineffect, 2) that there has been no damage to any component associated with the basal aquiferremedy, and 3) that no groundwater extraction wells have been installed that would interferewith the basal aquifer remedy.
The State of Hawaii Department of Land and Natural Resources (specifically, the State Water UseCommission} shall be notified of the extent of the downgradient plume and requested not topermit any new extraction from the vicinity of the basal aquifer downgradient plume or sourcearea without prior approval from EPA. (An annual review of State of Hawaii Department of Landand Natural Resources files may be conducted or a notice mechanism may be agreed upon betweenthe State and EPA.)
Land use restrictions shall be put in place requiring the following:
• The owner must give notice of all institutional controls to any lessees of any portion ofthe Site.
• The owner must give 6 months prior notice to EPA before any sale of any portion of theSite.
• The owner must identify to EPA all lessees on any portion of the Site within 30 days ofsuch lessees occupying any portion of the Site.
• Without prior review and written approval by EPA, the owner of the Kunia Section of theSite shall not undertake, allow or consent to installation of groundwater extraction wellsthat will interfere with the remedy.
• Without prior review and written approval by EPA, the owner of the Kunia Section of theSite shall not undertake, allow or consent to activities which /age or interfere with thegroundwater monitoring or extraction wells or any component associated with the remedy.
• To minimize interference with the remedial action, the owner of the Kunia Section of theSite shall not allow any change in the current use of the land, i.e., from pineapplefarming, to commercial, other industrial or residential use, until phase two of thedowngradient plume portion of the basal aquifer remedy has been implemented andpost-operation monitoring is complete.
Basal Aquifer Contingent Point-of-Use Treatment Performance Criteria
It is not anticipated that any additional existing wells are at risk of becoming impacted byCOCs from the Del Monte Site. However, io the unlikely event that a drinking water weI1 becomesimpacted by contamination from the Del Monte Site, point-of-use treatment would be implementedfor the contaminated well or wells. The performance standard or action level for implementingthe contingent point-of-use treatment is detection of COCs in a drinking water well at or aboveone half of the MCLs groundwater cleanup standards.
A sentinel monitoring well located upgradient of the nearest downgradient drinking water well(or wells) will be used to provide early warning of potential impacts to drinking wells.
Physical treatment,, consisting of air stripping and/or carbon adsorption, would be used if thiscontingency is implemented. The performance of the point-of-use treatment unit would bemonitored in accordance with State of Hawaii monitoring requirements for drinking water sources.
11.2 Summary of the Estimated Remedy Costs
A detailed breakdown of the estimated capital, O&M, and present worth costs associated with theselected remedy is included in Table 14. As shown in this table, the following is included inthe estimated capital cost for this alternative.
Capital Costs
• Mobilization, site preparation, demobilization
• Earthwork: pit backfill (existing) and cap construction
• Installation of fencing to restrict site access
• Perched aquifer groundwater extraction system (existing)
• Dedicated pumps for perched aquifer monitoring wells
• Phytoremediation system (existing)
• SVE system installation
• Contingency for Resource Conservation and Recovery Act (RCRA) compliance
• Contractor overhead and profit
• Engineering and construction surveillance
As shown in these tables, the following is included in the estimated O&M cost for thisalternative:
O&M Costs
• Labor for operation of the remediation systems
• Labor, equipment, and supplies to maintain the remediation systems
• Labor, equipment, and supplies to inspect and maintain the soil cap
• Labor for obtaining samples to monitor phytoremediation system performance (air, soil, andwater) and for perched groundwater monitoring
• Laboratory analytical costs for monitoring
• Electricity (primarily SVE blower and groundwater pumping)
• Carbon regeneration/disposal for SVE off-gas treatment
• Fencing inspection and maintenance
• Supplies and miscellaneous consumables for operation, maintenance, and monitoring
• Data compilation, evaluation, and reporting
• Monitoring of Institutional Controls
The information in this cost estimate summary table (Table 14) is based on the best availableinformation regarding the anticipated scope of the remedial alternative. Changes in the castelements are likely to occur as a result of new information and data collected during theengineering design of the selected remedy. Major changes may be documented in the form of amemorandum in the Administrative Record file, and Explanation of Significant Differences (ESD)or a ROD Amendment. This is an order-of-magnitude engineering cost estimate this is expected tobe within +50 to -30 percent (%) of the actual project cost.
The present worth cost estimates assume a 5% discount rate and a 5- (downgradient plumecomponents) to 10-year project duration. The total estimated capital costs range from $5.73million to $10.19 million. The low end of the range assumes that phase two of the basal aquiferremedy consists of monitored natural attenuation. The upper end of the estimated remedy costsassumes that phase two includes full extraction and treatment for the downgradient plume. Thepresent worth of the perched aquifer 0&M is $1.59 million. The present worth of the basalaquifer O&M ranges from $5.58 to $9.17 million for monitored natural attenuation and full-scalepumping, respectively. The total present worth cost estimate for the remedy ranges from $12.9million (monitored natural attenuation') to $21.0 million (full-scale downgradient pumping).These total estimated costs do not include the capital or O&M costs of the contingentpoint-of-use treatment unit. Costs have been estimated for this in the unlikely event that thiscontingent system is needed. The estimated capital cost is $1.77 million and the present worthof the annual O&M is $2.70 million, assuming 10 years of operation. If implemented along withthe phase two downgradient pump-and-treat, this contingent action could raise the total remedycosts as high as $25A million.
11.3 Expected Outcomes of the Selected Remedy
Once completed, this remedy will restore the basal aquifer to unrestricted beneficial use as asource of drinking water supply. COC concentrations wi11 be below the cleanup standards (MCLs)presented in Table 13 and the perched aquifer and deep soils will no longer represent a threatto basal water quality. The remedy is expected to be completed in less than 10 years (althoughmonitoring may be needed for a longer period of time) after which unrestricted use of the landand groundwater will be available at the Del Monte Site.
12 Applicable or Relevant and Appropriate Requirements (ARARs)
Section 121(d) of CERCLA, 42 U.S.C. g 9621(d) requires that remedial actions at CERCLA sitesattain (or justify the waiver of) any federal or state environmental standards, requirements,criteria, or limitations that are determined to be legally applicable or relevant andappropriate. These applicable or relevant and appropriate requirements are referred to as"ARARs." Federal ARARs may include requirements promulgated under any federal environmentallaws. State ARARs may only include promulgated, enforceable environmental or facility-sitinglaws of general application that are more stringent or broader in scope than federalrequirements and that are identified by the state in a timely manner.
An ARAR may be either "applicable," or "relevant and appropriate," but not both. If there is nospecific federal or state ARAR for a particular chemical or remedial action, or if the existingARARs are not considered sufficiently protective, then other guidance or criteria to beconsidered (TBCs) may be identified and used to ensure the protection of public health and theenvironment. The NCP, 40 C.F.R. Part 300, defines "applicable," "relevant and appropriate," and"to be considered" as follows:
• Applicable requirements are those cleanup standards, standards of control, or othersubstantive requirements, criteria, or limitations promulgated under federal environmentalor state environmental or facility siting laws that specifically address a hazardoussubstance, pollutant, contaminant, remedial action, location, or other circumstances foundat a CERCLA site. Only those state standards that are identified by a state in a timelymanner and that are more stringent than federal requirements may be applicable.
• Relevant and appropriate requirements are those cleanup standards, standards of control,and other substantive requirements, criteria, or limitations promulgated under federalenvironmental or state environmental or facility siting laws that, while not "applicable"to a hazardous substance, pollutant, contaminant, remedial action, location, or othercircumstance at a CERCLA site, address problems or situations sufficiently similar tothose encountered at the CERCLA site that their use is well suited to the particular site.Only those state standards that are identified in a timely manner and that are morestringent than federal requirements may be relevant and appropriate.
• TBCs consist of advisories, criteria, or guidance that EPA, other federal agencies, orstates developed that may be useful in developing CERCLA remedies. The TBC values andguidelines may be used as EPA deems appropriate. Once a TBC is adopted, it becomes anenforceable requirement.
ARARs are identified on a site-specific basis from information about the chemicals at the site,the remedial actions contemplated, the physical characteristics of the site, and otherappropriate factors. ARARs include only substantive, not administrative, requirements, andpertain only to onsite activities. Section 121(e) of CERCLA, U.S.C. 9621(e), states that nofederal, state or local permit is required for remedial actions conducted entirely on-site.Offsite activities, however, must comply with all applicable federal, state, and local laws,including both substantive and administrative requirements, that are in effect when the activitytakes place. There are three general categories of ARARs:
• Chemical-specific ARARs are health- or risk-based concentration limits, numerical values.or methodologies for various environmental media (i.e., groundwater, surface water, air,and soil) that are established for a specific chemical that may be present in a specificmedia at the site, or that may be discharged to the site during remedial activities. TheseARARs set limits on concentrations of specific hazardous substances, pollutants, andcontaminants in the environment. Examples of this type of ARAR include state and federaldrinking water standards.
• Location-specific ARARs set restrictions on certain types of activities based on sitecharacteristics. Federal and state location-specific A/s are restrictions placed on theconcentration of a contaminant or the activities to be conducted because they arc in aspecific location. Examples of specia1 locations possibly requiring ARARs may includeflood plains, wetlands, historic places, and sensitive ecosystems or habitats.
• Action-specific ARARs are technology- or activity-based requirements that are triggered bythe specific type of remedial activities selected. Examples of this type of ARAR are RCRAregulations for waste treatment, storage, or disposal.
EPA has evaluated and identified the ARARs for the selected remedy in accordance with CERCLA,the NCP, and EPA guidance, including the CERCLA Compliance with Other Laws Manual, Part I(Interim Final), OSWER Directive 9234.1-01 (EPA, 1988a) and CERCLA Compliance with Other LawsManual, Part II, OSWER Directive 9234.1-02 (EPA, 1989). Tables 14 (chemical-specific) and 15(action-specific) present the ARARs for the perched aquifer and basal aquifer components of theremedy.
It should be noted that for RCRA regulations, the Hawaii Administrative Rules (HAR) Title 11 andcertain provisions in Chapters 261 through 267 are either applicable or relevant and appropriatefederal ARARs for the perched aquifer and the basal aquifer. These provisions are considered afederal ARAR because they were approved by EPA in its November 1, 2001 authorization of theState of Hawaii’s RCRA program and are federally enforceable.
12.1 Chemical-Specific ARARs
Table 15 summarizes the chemical-specific ARARs for the selected remedy. The COCs for the DelMonte Site are compounds that have been detected in groundwater (basal and perched) in the KuniaVillage source area. Table 13 1ists these compounds and their selected cleanup levels based onthe chemical-specific ARARs.
12.1.1 Chemical-Specific ARARs - Perched Aquifer
Safe Drinking Water Act (SDWA)
The impacted perched groundwater is not a current or potential future source of drinking water,and therefore the SDWA requirements are not an ARAR for the perched groundwater. The perchedgroundwater at the Kunia Village Area is only present locally, and does not provide sufficientsustainable yield to provide for use as a water supply. The EPA groundwater policy set forth inthe NCP preamble uses the system in EPA Guidelines for Groundwater Classification under the EPAGroundwater Protection Strategy (NCP, 55 Fed Reg. 8752 – 8756). Under this policy, groundwateris classified in one of three categories (Class I, II, or HI) based on ecological importance,its ability to be replaced, and vulnerability. Class I is irreplaceable groundwater currentlyused by a substantial population, or groundwater that supports a vital habitat. Class IIconsists of groundwater currently used or that might be used as a source of drinking water inthe future. Class III is groundwater that cannot he used for drinking water because of itsunacceptable natural quality or insufficient quantity. In accordance with the EPA guidelines,sufficient yield for a typical household is a minimum of 150 gallons per day. However, asdemonstrated during the phytoremediation treatability study, regular pumping of the perchedaquifer extraction wells is dewatering the perched zone. Actual pumping rates achievable duringSeptember 1999 for the phytoremediation treatability study show that all 14 extraction wellsonly produced 1865 gallons per week (133 gal/well/week), and several of the wells have beencompletely dewatered. The perched aquifer has continued to be dewatered even following rainfallevents. In the period between the weeks ending January 3, 2000 through Apri19, 2000 the averageproduction from the 7 extraction wells still producing was only 39.2 gal/day. The other 7 wellshave been dewatered. The perched aquifer in the Kunia Village area is classified as a Class IIIaquifer. Therefore, drinking water standards are neither applicable nor relevant and appropriatefor the perched groundwater. However, because perched groundwater eventually recharges the basalaquifer, the impacts from the perched groundwater to the basal groundwater have to be evaluated.
RCRA Hazardous Waste Definition Standards
RCRA standards (HAR Title 11) are applicable federal ARARs for determining whether soil fromwell construction or groundwater extracted from the perched aquifer is a hazardous waste. Thesoil and extracted groundwater will be considered a hazardous waste if it contains elevatedlevels of the site COCs because of the “contained-in” policy. The policy states that materialscontaminated with hazardous waste are considered hazardous waste if they contain a listed wasteor if they meet specified criteria, including exceedances of the Toxicity CharacteristicLeaching Procedure (TCLP) maximum concentrations.
12.1.2 Chemical-Specific ARARs - Basal Aquifer
Water Quality Protection Plan
Under the SDWA and RCRA, a significant issue in identifying ARARs for groundwater is whether thegroundwater can be classified as a source of drinking water. The EPA groundwater policy setforth in the NCP preamble uses the system in EPA Guidelines for Groundwater Classification underthe EPA Groundwater Protection Strategy (NCP, 55 Fed. Reg. 8752 – 8756). Under this policy,groundwater is classified in one of three categories (Class l, II, or III) based on ecologicalimportance, its ability to be replaced, and vulnerability. Class I is irreplaceable groundwatercurrently used by a substantial population, or groundwater that supports a vital habitat. ClassII consists of groundwater currently used or that might be used as a source of drinking water inthe future. Class III is groundwater that cannot be used for drinking water because of itsunacceptable quality (e.g., high salinity or widespread naturally occurring contamination) orinsufficient quantity. The basal aquifer at the Site can be classified as a Glass II aquifer andis a potential source of drinking water.
Safe Drinking Water Act
MCLs under the SDWA are relevant and appropriate requirements for aquifers with Class I and IIcharacteristics and, therefore, are federal ARARs. The point of compliance for MCLs under theSDWA is at the tap. For CERCLA remedies, however, EPA indicates that MCLs should be attainedthroughout the contaminated plume, or at and beyond the edge of the waste management area whenthe waste is left in place (55 Fed. Reg. 8753). At the Del Monte Site, MCLs are cleanup levelsthroughout the basal aquifer plume, both in the Kunia Village source area and downgradient (seeTable 13 for a listing of the MCLs/cleanup levels).
RCRA Hazardous Waste Definition Standards
RCRA regulations are applicable federal ARARs for determining whether the extracted basalgroundwater is a hazardous waste. Because the extracted water is likely to contain a listedhazardous waste, it is likely to be classified as hazardous in accordance with the “containedin” policy. The contained-in policy states that materials contaminated with a listed hazardouswaste or meeting the characteristic criteria are considered hazardous waste. It is notanticipated that the basal groundwater would meet the characteristic criteria to be considered ahazardous waste. However, if necessary, the extracted groundwater will be tested to determinewhether it is hazardous waste in accordance with these regulations.
RCRA Groundwater Protection Standards
RCRA regulations (HAR Title l 1, Chapter 264-94) state that concentration limits for RCRAgroundwater protection standards are set for RCRA-regulated units. These regulations providethat compounds must not exceed their background levels in groundwater or some higherconcentration limit set as part of the corrective action program. A Limit greater thanbackground may be approved if the owner can demonstrate that it is not technologically oreconomically feasible to achieve the background value and that the constituent at levels greaterthan background will not pose a hazard to human health or the environment. A concentration limitgreater than background must never exceed other applicable standards including MCLs establishedunder the federal SDWA. As is stated above, MCLs have selected for the cleanup levels in thebasal aquifer. EPA has determined that these cleanup levels reflect the current and potentialuse and exposure at the site
The RCRA groundwater protection standards are applicable only to RCRA-regulated units, and theDel Monte Site is not considered a RCRA-regulated unit. However, the substantive provisions ofHAR-11-264-94 (a)(l), (a)(3), (c), (d). and (e) are deemed relevant and appropriate federalARARs for groundwater affected by releases from this site because the constituents beingaddressed are listed RCRA hazardous wastes.
Primary MCLs
National primary drinking water standards for organic compounds are found at 40 C.F.R.§ 141.61(a). The federal MCL for DCP has been determined to be a relevant and appropriate
requirement for basal groundwater cleanup. Primary State MCLs are set forth in HAR Title 11,Chapter 20 - Potable Water System Regulations. The State MCLs for EDB and DBCP (0.04 µg/l foreach) are more stringent than the Federal MCLs (0.05 µg/l and 0.2 µg//l respectively). Inaddition, the State of Hawaii has established an MCL for l,2,3-TCP (0.6 µg/l, whereas theFederal regulations do not include an MCL for this compound. As such, the State MCLs for thesethree compounds are relevant and appropriate for basal groundwater at the Del Monte Site.
12.1.2 Chemical-Specific ARARs - Soil and Other Solids
There are not any chemical-specific ARARs related to the remediation of deep soil in the perchedaquifer. However, soil cuttings will be generated during installation of additional wells inboth the perched and basal aquifers. In addition, spent carbon will be generated duringgroundwater treatment. Hazardous waste determinations will be made for both of these at the timethe waste is generated. Assuming that the waste will be hazardous, the action-specificrequirements identified below for handling of hazardous wastes would be ARARs.
12.1.3 Chemical-Specific ARARs - Air
There will be discharges to air from both the SVE treatment unit associated with the SVE systemtreatment unit and from the air stripper associated with the basal aquifer groundwater treatmentunit. Hawaii Air Pollution Control Standards (HAR Title I 1, Chapter 60) address discharge ofair pollution including visible emissions, fugitive dust, incineration, process industries,sulfur oxides from fuel combustion, storage of VOCs, VOC separation from water, and waste gasdisposal. The regulation requires permits for point sources and treatment systems that exceed0.1 tons per year of each hazardous air pollutant. The substantive provisions of theseregulations will be applicable for any action that includes air discharges exceeding thisthreshold. At this stage, it does not appear likely that either the air stripper or the SVEtreatment unit will have discharges approaching the 0.1 tons per year threshold.
12.1.4 Chemical-Specific ARARs - Surface Water
There are no planned discharges to surface water as part of the selected remedy at the Del MonteSite. However, if there is a change in the planned discharge option and treated water is goingto be discharged to surface water, discharges will need to meet water quality standards.
Water Quality Standards
On 22 December 1992, U.S. EPA promulgated federal water quality standards under the authority ofthe federal Clean Water Act (CWA) Section 303(c)(4)(B), 33 U.S.C. ch. 26, g 1313 to establishwater quality standards required by the CWA where states had failed to do so (57 Fed. Reg. 60848[1992]). 1hese standards have been amended over the years in the Federal Register including theamendments of the National Toxics Rule (60 Fed. Reg. 22228 [1995]). The water quality standards,as amended, are codified at 40 C.F.R. § 131.36. The water quality standards contained in 40C.F.R. § 131.36(a) are applicable federal ARARs for discharge to surface water.
Discharges to surface water are regulated under the National Pollutant Discharge EliminationSystem (NPDES) program. The NPDES program has been delegated to the State of Hawaii and isimplemented through the Hawaii Water Pollution Control Regulations (HAR Title 11, Chapter S5).While no NPDES permit will be required for any discharge to surface water on-site, suchdischarge will still have to comply with the substantive requirements of an NPDES permit.
12.2 Location-Specific ARARs
No location-specific laws or regulations have been identified as being either applicable orrelevant and appropriate for the Del Monte Site. Location-specific laws and regulationstypically apply to wetlands, historic places, and endangered species. The remedial action atthis site impacts a zone of perched groundwater within the Kunia Village Area and a portion ofthe basal groundwater within the Ewa-Kunia aquifer system. There is no physical connection ofthe perched water with surface water (other than the excavation pit prior to it beingbackfilled).
12.3 Action-Specific ARARs
ARARs are technology- or activity-based requirements that are triggered by the type of remedialactivities selected. Table 16 lists the action-specific ARARs for the selected remedy whichinclude monitoring requirements, waste-generating requirements and requirements for treatmentunits.
12.3.1 Action-Specific ARARs - Perched Aquifer
Resource Conservation and Recovery Act (RCRA) - HAR Title 11 Chapter 260-268
RCRA provides requirements that address the identification, generation, transport, storage,treatment, and disposal of hazardous waste. These regulations are applicable to hazardous wastegenerated or managed during response actions. EPA has determined that perched groundwateroriginating from the Kunia Village source area must be managed as hazardous waste if thegroundwater is extracted from the ground during response activities because the water containsEDB (which is a listed hazardous waste if spilled or discarded – hazardous waste ID OU067), DBCP(U066), and DCP (U083). In addition to the extracted groundwater being managed as a hazardouswaste because it contains a listed RCRA waste or meets the criteria for characteristic hazardouswaste, any treatment residuals (i.e., spent carbon) will also have to be managed as hazardouswaste based on these criteria. Soil cuttings generated during installation of wells may a1sofall into this category if they contain elevated levels of COCs. Additional discussion onhazardous waste definition is included above in Section l2.1.1 and in Table 15.
RCRA Hazardous Waste Characterization, Generation, Storage, Transportation, and Treatment
The RCRA regulations contained in HAR Title 11 Chapter 261 (Identification of Hazardous Waste),Chapter 262 (Regulations for Generators of Hazardous Waste), and Chapter 264 (Regulations forPermitted Hazardous Waste Facilities) are applicable to treatment of extracted perchedgroundwater and management of treatment residuals (and potentially soil cuttings from drilling).Management and disposa1 of soil cuttings and treatment residuals shipped to off-site facilities,such as spent carbon sent to an off-site facility for regeneration, would be subject to on-sitepackaging, labeling, marking, shipping and transportation requirements of HAR Title 11 Chapter262 (see Table 16).
Because the extracted groundwater contains hazardous waste, the substantive requirements of HARTitle 11 Chapter 264 are applicable for the design, construction, operation, and closure of allfacilities associated with the remedial action, including the phytoremediation treatment system.EPA bas determined that the phytoremediation treatment system is a RCRA miscellaneous treatmentunit and the RCRA miscellaneous treatment unit requirements are applicable.
Monitoring
A groundwater monitoring program will be implemented for the perched aquifer. The monitoringprogram will meet the substantive requirements of the RCRA general groundwater monitoringstandards presented in HAR Title 11 Chapter 264-97. Evaluation monitoring and corrective actionwill be performed in accordance with Chapter 264-99 and 264-l00. A point of compliance has notbeen designated for the Del Monte Site because waste is not being left in place. Cleanup goalsapply to all portions of the perched groundwater plume.
12.3.2 Action-Specific ARARs - Basal Aquifer
All of the ARARs cited in Section l2.3.1 for the perched aquifer also apply to the basalaquifer. In addition, the following ARARs are specific to the basal aquifer component of theremedy.
Federal Insecticide, Fungicide, and Rodenticide Act § 3 and 40 CFR Part 152 Subparts C and D
This section of the Federal Insecticide, Fungicide, and Rodenticide Act (FIFRA) requiresregistration of pesticides and includes requirements for labeling and use restrictions. Userestrictions have been included on pesticide formulations containing 1,3 dichloropropene(including Telone II®, which is used by Del Monte on the Oahu plantation), that stipulate such
formulations cannot be used within 100 feet of a water well. Therefore, this requirement willmandate that a buffer zone be established around monitoring, extraction or injection wellsinstalled in or near pineapple fields as part of the remedial action.
Underground Injection Control Program (40 CFR Part 144)
The Underground Injection Control (UIC) Program provides regulations and permitting requirementsfor five general classes of injection wells. These regulations would be applicable to use ofgroundwater injection wells for recharge of treated groundwater. Although injection wells arenot currently planned, if the volumes of water that need to be extracted from the basal aquiferas part of the remedy exceed Del Monte’s water rights injection may become necessary. Theinjection wells would be considered Class V injection wells. EPA maintains primary enforcementauthority for the UIC program under 40 CFR Part 144.
12.4 ARARs Waivers
This remedial action shall comply with all ARARs described in this section. EPA does notanticipate the need for any waivers of ARARs for implementation of the selected remedy.
13 Statutory Determinations
Under CERCLA Section 121, EPA must select remedies that are protective of human health and theenvironment, comply with applicable or relevant and appropriate requirements (unless a statutorywaiver is justified), are cost-effective, and utilize permanent solutions and alternativetreatment technologies or resource recovery technologies to the maximum extent practicable. Inaddition, CERCLA includes a preference for remedies that employ, as a principal element,treatment that permanently and significantly reduces the volume, toxicity, or mobility ofhazardous wastes. The following sections discuss how the selected remedy meets these statutoryrequirements.
13.1 Protection of Human Health and the Environment
The selected remedy will protect human health and the environment by providing perched aquiferand basal aquifer source control to limit further migration of contaminated groundwater awayfrom the Kunia Village area and preventing the existing downgradient basal aquifer groundwatercontamination from impacting current and future groundwater users through either monitorednatural attenuation or groundwater extraction and treatment. The remedy provides an additionallayer of human health protection by including contingent point-of-use treatment in the unlikelyevent that any drinking water supply wells become impacted by contaminants from the Del MonteSite in the future.
The selected remedy will remove all Del Monte Site contamination in excess of drinking waterstandards from the basal aquifer within 10 years allowing for unrestricted use of the aquiferand eliminating the potential for future exposure to site contaminants. The remedy will alsoremove contaminant mass from the perched aquifer source area, such that the perched aquifer nolonger represents a threat to the basal aquifer. Available treatment technologies aretechnically feasible and proven effective in meeting ARARs for VOCs in the treated groundwaterand air. Implementation of the remedy will not pose unacceptable short-term risks. In addition,no adverse cross-media impacts are expected.
13.2 Compliance with ARARs
The selected remedy shall comply with all ARARs described in Section 12 of this ROD. Thisincludes restoration of the basal aquifer to below the chemical-specific cleanup standardslisted in Table 13.
13.3 Cost-Effectiveness
EPA believes the selected remedy is cost-effective and represents a reasonable value for themoney to be spent. Section 300.430(f)(ii)(D) of the NCP requires EPA to determinecost-effectiveness by evaluating the cost of an alternative relative to its overall
effectiveness. Effectiveness is defined by three of the five balancing criteria: long-termeffectiveness, short-term effectiveness, and reduction of toxicity, mobility and volume throughtreatment. The overall effectiveness is then compared to cost to ensure that the selected remedyis cost-effective.
The estimated present worth cost of the selected remedy ranges from $12.9 million to $25Amillion, depending on which phase two action (monitored natural attenuation or groundwaterextraction and treatment) is implemented and on the need for the contingent point-of-usetreatment. If monitoring data indicate that groundwater and contaminant conditions arefavorable, EPA’s goal is to implement the monitored natural attenuation action for thedowngradient plume, which will result in the costs being at the lower end of the range presentedabove. Evaluations completed during the RI/FS indicate that the monitored natural attenuationaction can provide an overall 1evel of protection and cleanup time comparable to the moreexpensive downgradient groundwater extraction and treatment action.
13.4 Utilization of Permanent Solutions and Alternative TreatmentTechnologies to the Maximum Extent Practicable
EPA has determined that the selected remedy represents the maximum extent to which permanentsolutions and treatment technologies can be utilized in a practicable manner at the Del MonteSite. EPA has also determined that the selected remedy provides the best balance of tradeoffs interms of the five balancing criteria, while also considering the statutory preference fortreatment as a principal element and considering state and community acceptance.
The selected remedy provides source contro1 and mass removal that will achieve significantreductions in source area contaminant concentrations in soil (a principal threat waste), perchedgroundwater and basal groundwater. The selected remedy satisfies the long-term effectivenesscriterion by removing contamination from the source area groundwater and destroying the COCsduring carbon regeneration. Groundwater containment through extraction in the source area, inconjunction with downgradient monitoring of natural attenuation, effectively reduces themobility and volume of and potential for exposure to site-related contamination. The selectedremedy does not present. any short-term risks that can not be readily mitigated and there are nospecial implementability issues associated with the selected remedy.
The phytoremediation treatment system is an innovative technology that satisfies EPA’s goa1 ofusing alternative technologies to the maximum extent practicable. The phytoremediation treatmentis also beneficial in that it does not require disposal of the treated water and it does notgenerate wastes that require special management or disposal.
13.5 Preference for Treatment as a Principal Element
By treating the contaminated soil using SVE, the extracted soil vapor using carbon adsorption,and the extracted groundwater using air stripping and liquid-phase carbon adsorption, theselected remedy addresses the site contamination through the use of treatment technologies. Byusing treatment as a significant component of the remedial action, the statutory preference forremedies that employ treatment as a principal element is supported.
13.6 Five-Year Reviews
This remedy will not result m hazardous substances, pollutants, or contaminants remaining onsiteabove levels that allow for unlimited use and unrestricted exposure. However, it will likelytake more than five years to attain remedial action objectives and cleanup levels. Accordingly,EPA may conduct a policy review within five years of construction completion for the Site toensure that the remedy is, or will be, protective of human health and the environment If it isdetermined that the remedy is not or will not be protective of human health and the environment,then modifications to the remedy will be evaluated and implemented as necessary.

14 Documentation of Significant Changes
The Proposed Plan for the Del Monte Site was released for public comment in March 2003. TheProposed Plan identified Alternative P3 (Groundwater Extraction and Treatment with Capping andSVE) for the perched aquifer and B3 (Groundwater Extraction and Treatment in the Source Areawith Monitored Natural Attenuation of the Downgradient Plume) for the basal aquifer as thePreferred Alternative for addressing contamination at the Del Monte Site. EPA reviewed writtenand verbal comments submitted during the public comment period. 1t was determined that nosignificant changes to the remedy, as originally identified in the Proposed Plan, werenecessary.
Part III – Responsiveness Summary
This Responsiveness Summary portion of the Record of Decision (ROD) presents the U.S.Environmental Protection Agency's (EPA) responses to the written and significant oral commentsreceived at the public meeting and during the public comment period. 7he section is divided intoresponses to written comments and responses to oral comments. Comments are expressed in italics,EPA's responses in plain text.
1 Responses to Written Comments
This section provides responses to written comments received by EPA during the public commentperiod. Written comments were received from Mr. Roy Arno, a community member.
1.1 Responses to Comments from Mr. Roy Arno, Community Member
Written Comment No. 1. I felt the presentation was clear and understandable. I used fo live inKunia Village from l977 - l988 with no apparent ill effects to myself and my family.
EPA's Response. Thank you for your comment.
2 Responses to Oral Comments
In this section, EPA provides responses to the formal oral comments received at the publicmeeting held on April 2, 2003. Formal oral comments were received from five parties: Mr. HenryCurtis, representing Life of the Land; Ms. Audrey Hyrne, a community member; Mr. Marcus Oshiro,a member of the Hawaii State House of Representatives (39th Representative District); Ms. KatBrady, representing Life of the Land, and Ms. Kathy Masunaga, a community member. The fulltranscript of the public meeting is available at EPA's Superfund Records Center at EPA'sRegional Office in San Francisco, and locally at the information repository at the WahiawaLibrary
2.1 Responses to Comments from Mr. Henry Curtis, Life of the Land
Mr. Curtis Comment No. 1. Transcript Page 15, Line 24. We would like to know where the dirtwas moved to that came out of the site area, since we have been to the EPA presentations beforeand got different answers at each one.
EPA's Response. As reported in the Final RI report dated November 6, 1998, Del Monte excavated2,000 tons of soil in 1981 and 16,000 tons of soil in 1983 from the Kunia Village spill area.The soil was spread in a thin layer over an approximately 20 acre pineapple field in Del MonteField 8 which is located about 1,700 feet west of Kunia Village (see Figure 12). This action wasconducted with approval from the State of Hawaii Department of Health (HDOH) to allowvolatilization and natural attenuation of the soil fumigants from the soil. The HDOH rationalefor this action was that the soil fumigants were still permitted for agricultural use inpineapple fields at the time. This information was also discussed in EPA’s January 1999 FactSheet and at the January 27, 1999 Public Meeting.
Mr. Curtis Comment No. 2, Transcript Page 17, Line 7. Weren't the pesticides involvedbanned on the national level before the spill?
EPA's Response. The spill occurred in April 1977. On September 30, 1983, more than 5 yearslater, EPA banned the use of EDB as a soil fumigant on agricultural crops. DBCP was banned in198S.
Mr. Curtis Comment No. 3. Transcript Page 21, Line 2. You have an estimated location of theWaianae-Kaolau unconformity. So you’re assuming that you know where the line is, and becausethe line is there, you know the groundwater will nat travel beyond that. What assumptions haveyou used in assuming where you think it might be?
EPA's Response. The contact (or unconformity) between the Koolau and Waianae basalts hastraditionally been mapped at the land surface at a location about 4,000 feet west of the Kunia
Well. However, EPA is more concerned with the location of the contact at the groundwater tablesurface because that is where the contact serves to block the flow of groundwater from theWaianae basalts to the Koolau basalts. EPA has assumed, consistent with numerous publishedgeologic studies and maps, that the contact between the Koolau and Waianae basalts at thegroundwater table lies about 1,000 feet or more east of the Kunia Village area. The geologicrationale behind this assumption is as follows: The Waianae volcano and basalts are older in agethan the Koolau basalts. The surface of the Waianae volcano, which slopes downhill about 3 ta 10degrees to the east, was already present when the younger Koolau volcano was erupting andgrowing to the east. As the Koolau volcano grew, its lava flowed over and buried the existingslope of the Waianae volcano in the vicinity of present day Kunia village. Therefore, theunconformity between the Waianae and Koolau basalts is now a buried slope, which dips about 3 to10 degrees to the east, beneath Kunia Village Where this buried slope intersects the groundwatertable, which lies approximately at sea level (about 800 feet beneath the 1and surface) is thehydrogeologic barrier between the Koolau and Waianae basalts. If a slope of 10 degree is assumedfor the unconformity, the sea level elevation contact between the Koolau and Waianae is aboutl,000 feet east of the Kunia Village area. 1f a slope of 3 degrees is assumed, the sea 1evelcontact would be several thousand feet further east of Kunia Village.
2.2 Responses to Comments from Ms. Audrey Hyrne, Community Member
Ms. Hyrne Comment No. 1- Transcript Page 16, Line 11. I just want to know who’s paying forthis. Who’s footing the bill for this entire project?
EPA’s Response. At the beginning of the presentation on the Proposed Plan, EPA stated that DelMonte is paying for all costs associated with the investigation and cleanup of the site. Underthe terms of the Administrative Order of Consent signed by Del Monte, EPA, and the Hawaii DOH in1995, Del Monte is 1iable for all costs to conduct the RI/FS. This also includes reimbursing EPAand DOH for their response and oversight costs during the RI/FS. After this ROD has been signed,EPA will negotiate a Consent Decree that will include a work plan for design and construction ofthe remedy outlined in the ROD and wi11 specify who will pay. EPA is assuming that ConsentDecree negotiations will be conducted solely with Del Monte. However, Del Monte may decide tobring in other potentially responsible parties to share the costs.
Ms. Hyrne Comment No. 2- Transcript Page 16, Line 13. It was an excellent presentation,Janet, but it's just honestly over the majority of, you know, everyone in Honolulu’s head. If Iwould have brought anyone else here with me that didn't understand what MCL or DBCP or, youknow, ethylene dibromide, all these other things that they never heard of before, they’re nevergoing to understand this. How are they going to comment on this? I think that maybe we need tohave it understood a little more simply, you know. And I know, I’ve been to your office before,and I know what you have to work with, what you have to deal with. So it's nothing against theplan itself. I'm so happy you guys are here, you know, in 2003.
EPA's Response. EPA understands that the material is technically comp1ex and has made everyeffort to present the material m an understandable fashion at public meetings and in “plainlanguage” fact sheets. EPA provides an open-ended time at every community meeting for questionsand answers to insure that those in attendance understand the material presented. EPA alsopublishes the phone number of its Project Manager and its Community Involvement Coordinator, aswell as the number of its toll-free message line, in every fact sheet and encourages communitymembers to contact EPA directly to ask questions. EPA appreciates your efforts to attend publicmeetings, provide comments, and work with us on this important project.
Ms. Hyrne Comment No. 3- Transcript Page 16, Line 25. But nonetheless, who's paying for allof this? Whose liability is this? Who’s the one that said, okay, this 19 million or sevenmillion here or three million there? That's my question.
EPA's Response. As indicated above, Del Monte agreed to pay all costs associated withdevelopment of the remedial alternatives presented in the Proposed Plan. EPA has reviewed andcommented on the estimated costs to implement the various remedial alternatives presented in theFS, including the selected remedy, and concurs that the estimated costs are accurately estimatedbased on the current understanding of site conditions.
Ms. Hyrne Comment No. 4- Transcript Page 20, Line 19. I'm going to add on to what Mr. Oshiro hadsaid earlier. You know, I know you talked about monitoring. Is that going to include medicalmonitoring in the future? I know you talked about monitoring. What does that encompass?
EPA's Response. The monitoring referred to is monitoring of the groundwater plume, treated airand groundwater, remedial systems performance, and other physical aspects of the final remedy.Based on the findings of the Agency for Toxic Substances and Disease Registry (ATSDR) in theirFebruary 7, 1995 Public Health Assessment for the site, EPA believes medical monitoring is notnecessary. ATSDR concluded the following: “Based on the available information, ATSDR concludesthat the people of Kunia were not exposed to significant levels of EDB and DBCP in theirdrinking water. Therefore, we do not anticipate that the people who drank the Kunia well waterwill have any adverse health effects.”
2.3 Responses to Comments from Mr. Marcus Oshiro, Hawaii State House ofRepresentatives,District 39
Mr. Oshiro Comment No. 1- Transcript Page 18, Line 2. Good to see you again. I think thelast time we were here was back in '99. I'm glad this thing has moved along. A couple ofcomments. One, I'll probably be submitting written comments, also. I'll probably slow e-mail –not e-mail, but snail mail.
EPA's Response. EPA looks forward to receiving written comments from Mr. Oshiro.
Mr. Oshiro Comment No. 2- Transcript Page 18, Line 7. On, I think it’s on page eight of theplan, for the Remedy Option on the Basal Aquifer, there's three options there, and I think thepreference at this time is to go with number two, extraction and treatment, contingent monitorednatural attenuation. And then I believe it states that, if it is found that natural attenuationis not occurring, then Alternative 3 will become the preferred remedy. So I guess my commentwould be, at what time would that occur? What would be the turning events? And when would thatdecision be made in the process!
EPA's Response. As is described in the Selected Remedy section in Part II of this ROD, the basalaquifer remedy will be implemented using a phased approach. During phase one, the source controlcomponent will be implemented and the nature and extent of the basal aquifer plume will becharacterized. In addition, point-of-compliance monitoring will be initiated. Based on modelingconducted as part of the RI/FS, a distance of 4,500 feet represents the furthest distancedowngradient from the source area that groundwater exceeding MCLs could migrate using“worst-case” assumptions. Therefore, 4,,500 feet downgradient of the Kunia Village source areais the currently estimated location where point of compliance monitoring will be conducted. Ifsite characterization indicates that the plume has extended further than 4,500 feetdowngradient, EPA will evaluate whether to install another point of compliance monitoring pointfurther downgradient and/or implement the basal aquifer downgradient plume extraction andtreatment action.
After construction of the phase one monitoring system is complete. routine quarterly monitoringwill be conducted to evaluate the downgradient plume and monitor performance of the sourcecontrol. If no exceedances are detected at the point of compliance well, monitoring during phaseone will be conducted for three years to provide sufficient information to select phase two ofthe remedial action.
If there is sufficient evidence to suggest that natural attenuation, in conjunction withcontainment of the source area, can be effective at reducing COC concentrations to below MCLs ina reasonable timeframe, phase two will include implementation of contingent monitored naturalattenuation. If the data collected during phase one indicate that natural attenuation will notbe effective, phase two will include groundwater extraction and treatment for the basal aquiferdowngradient plume.
Mr. Oshiro Comment No. 3- Transcript Page 18, Line 18. The second comment I have would be, inthe ’99 meeting, we talked about some of the lands north of Wahiawa, the Galbraith lands, about22& acres, and the status of those acres where there were found some contamination of someburial sites, spill sites in the Poamoho area. I don’t see any of those sites discussed in this
particular plan. But I would want to know, was final disposition, as far as remediation, donefor those particular parcels out in the Poamoho area north of Wahiava?
EPA's Response. The Poamoho section is not discussed in the Proposed Plan because theinvestigations of the Other Potential Source Areas in the Poamoho Section showed low levels ofcontamination below EPA’s health based guidelines. Based on these findings, EPA believes that nocleanup actions are needed. A description of the sampling conducted in the Poamoho Section canbe found in the 1998 Remedial Investigation Report and the March 17, 2003 Remedial InvestigationTechnical Memorandum 02-02, Investigation Results for Additional Other Potential Source Areas.
Mr. Oshiro Comment No. 4- Transcript Page 19, Line 3. And the third comment I would like tomake is, is the consideration of delisting of those particular lands, given their physicaldistance pom the Kunia Well and the areas of the monitoring well, is the possibility of delis6ngstill being considered by the EPA for those lands north of Wahiawa?
EPA’s Response. EPA was prepared to delist the Poamoho section in 2002, when a former DelMonte employee informed Del Monte that two other potential source areas for pesticidecontamination could exist in the Poamoho section. Del Monte investigated those sites, under EPAoversight, in 2002 and 2003. The investigation results indicate that pesticides are not presentat concentrations above EPA’s health based guidelines. A Notice of Intent to Partially Deletewill be published in the Federal Register. If there are no adverse comments during the 30-daypubic comment period, EPA will publish a Notice of Partial Site Deletion io the FederalRegister.
2.4 Responses to Comments from Ms. Kat Brady, Life of the Land
Ms. Brady Comment No. 1- Transcript Page l9, Line l2. I would like to request a communitymeeting where a discussion could happen, where people could ask questions and have themanswered at the meeting. I think it’s kind of disingenuous, when people’s lives have beenimpacted by this spill, that you give a dog and pony show, and you ask people to ask questions,but no answers are ever shared. That is not helpful to the community. What is helpful to thecommunity is to understand what this wel1 covers, what the groundwater, how it flows. So we wantto see maps of how the groundwater flows, what other areas could be affected, and we want tolearn from each other's questions. To have a meeting where people just ask questions, and theyget written down, and nobody has the benefit of an answer is not helpful to us. This is aboutpeople's lives. And I think the questions that have been asked now about who's paying for it,we're taxpayers, we'd like to know. Are we footing the bill? Who's paying for this? And theseare the kinds of things that we need to know. So to have a meeting where it's just talking headsis not helpful to us. And I am hereby formally requesting a mee1ing where we have a discussion,people can benefit from other people's questions and answers, and that we can actually find outwhat the impact of this is, what future things we should be worried about, where the chemicalsare on the scale of contamination and related to health problems. We want real answers. Thankyou.
EPA's Response. Different opportunities for public comment were explained and provided at theProposed Plan Public Hearing. Before the presentation on the Proposed Plan began, EPA statedthat there would be an opportunity to ask clarifying questions immediately following thepresentation. After any clarifying questions had been answered, EPA would take official commentson the Proposed Plan and respond to them in the Responsiveness Summary. A number of communitymembers asked questions after the presentation and EPA responded before moving on to the formalreceipt of public comments. EPA staff stayed after the close of the public hearing to talk withcommunity members.
The detailed presentation on the Proposed Plan addressed the issues outlined in this commentsuch as who is paying for the investigation and cleanup, the direction of groundwater flow, theextent of contamination and risk from the site.
In addition to the Proposed Plan Public Hearing, EPA has conducted a number of communitymeetings for the Del Monte Site which included an open-ended question and answer session. Beforeconducting a community meeting in January 1999, EPA met with the residents of Village Park inthe home of one of the residents. EPA publishes the phone number of its Project Manager and itsCommunity Involvement Coordinator, as well as the number of its toll-free message line, in every
fact sheet and encourages community members to contact EPA to ask questions.
EPA believes that the Del Monte Proposed Plan Public Hearing met the intent of EPA guidance andpractice and therefore, does not need to be repeated.
Ms. Brady Comment No. 2- Transcript Page 21, Line 10. I'm glad you're talking about RiskAssessment. But, you know, that’s really more and more becoming problematic for the community.We really prefer the precautionary principle. A Risk Assessment is goad, you know, well, itshould only hurt, you know, one in a million people. Well, that's fine unless it's your kidwho's actually being impacted. So the community more and more is requesting that the governmentreally start looking, erring on the side of precaution. And we are really interested if the EPAever goes by the precautionary principle and uses that as a measure rather than Risk Assessment,and how you deal with that kind of stuff. I sit on many military restoration advisory boards,and this has been something that we have been talking about for the last year. That’s been a bigissue in the communities. You know, Risk Assessments don't cut it if our kid is the one personthat's going to be harmed. Thank you.
EPA's Response. EPA fully supports pollution prevention and appreciates the use of precautionaryprinciples; that is why EPA moved to ban the use of EDB as a soil fumigant 20 years ago when itbecame known that this compound was adversely impacting groundwater supplies in Hawaii,California, and other locations. However, the work at the Del Monte Site to date, including thisProposed Plan, must address contamination resulting from a spill and pesticide handlingpractices that pre-date the ban on use of EDB. Risk assessments are an appropriate andwidely-accepted tool to conservatively evaluate the risks posed to public health and theenvironment and to help decision-makers make informed and reasonable decisions regardingappropriate uses of resources to efficiently and effectively clean up sites.
2.5 Responses to Comments from Ms. Kathy Masunaga, Community Member
Ms. Masunaga Comment No. 1- Transcript Page 22, Line 10. Aloha. My name is Kathy Masunaga, andI'm a resident of this Community here, and my husband is a retiree of Del Monte Corporation. Andjust formally, for the record, one of the things that I noticed, Janet, on your presentation wasthe fact that one of the areas. the trees were really, really tall, so it looks like, to me,even though this is comment on a plan, it looks like things have been done already. And I reallywant to, you know, commend the company and the government for working together. And I’m surethat, although there are other voices within the community that feel contrary to this. I thinkI'd like to give you guys and Del Monte a pat on the back. Thank you.
EPA’s Response. Comment acknowledged; thank you
References
ATSDR. See Agency for Toxic Substances and Disease Registry.
Agency for Toxic Substances and Disease Registry. Public Health Assessment. Del MonteCorporation (Oahu Plantation), Kunia, Honolulu County, Hawaii. CERCLIS No. HID9806373631Report prepared by U.S. Department of Health and Human Services, Public Health Services. 1995.
Del Monte Fresh Produce. 1999. Feasibility Study Technical Memorandum 99-2: Backfilling theExcavation Pit in the Former Storage Area of the Kunia Village Area – Del Monte Corporation(Oahu Plantation) Superfund Site. Prepared by Calvin Oda, Phytoremediation Project Manager,Bioremediation Working Group, Del Monte Fresh Produce (Hawaii) Inc.
EPA. See U.S. Environmental Protection Agency.
Golder Associates. 1998a. Remedial Investigation Report for the Del Monte Corporation (OahuPlantation) Superfund Site. November 1998. Redmond, WA. A Report for Del Monte Fresh Produce(Hawaii), Inc.
Golder Associates Inc. and GlobalTox. 1999. Baseline Risk Assessment Del Monte Corp. (OahuPlantation) Superfund Site – Kunia, Hawaii. Prepared for Del Monte Fresh Produce (Hawaii) Inc.December 1999.
Golder Associates Inc. 2002a. Addendum to the Del Monte Corporation (Oahu Plantation) Remedial1nvestigation Report. Remedial Investigation Technical Memorandum 01-02. Redmond, WA. Preparedfor Del Monte Fresh Produce (Hawaii), Inc. April 2002.
Golder Associates Inc. 2003a. Feasibility Study. Del Monte Corporation (Oahu Plantation)Superfund Site. Prepared for Del Monte Fresh Produce (Hawaii) Inc. February 2003.
Golder Associates Inc. 2003b. Remedial Investigation Technical Memorandum 02-02 (Revision 1).Investigation Results for Additional Other Potential Source Areas. Del Monte Corp. (OahuPlantation) Superfund Site. Prepared for Del Monte Fresh Produce (Hawaii) Inc. March, 2003.
ICF, 1997. Remedial Investigation Work Plan for the Del Monte Corporation (Oahu Plantation)Superfund Site. A Report for the U.S. EPA, Region IX. ICF Technology, Inc. Sacramento, CA.
U.S. Environmental Protection Agency. Guidelines for Ground-Water Classification under the EPAGround-Water Protection Strategy. EPA Office of Ground-Water Protection. December 1986
_______________ CERCLA Compliance with Other Laws Manual, Part I (Interim Final). OSWERDirective 9234.1-01. 1988a.
_______________ Guidance for Conducting Remedial Investigations and Feasibility Studies UnderCERCLA (Interim Final). OSWER Directive 9355.3-01. 1988b.
_______________ CERCLA Compliance with Other Laws Manual, Part II. OSWER Directive 9234.1-02.1989.
________________ Risk Assessment Guidance for Superfund, Volume l. Human Health EvaluationManual (Part A). OSWER Directive 9285.701a. Office of Emergency and Remedial Response,Washington, DC. September, 1989a.
________________ Role of the Baseline Risk Assessment in Superfund Remedy Selection Decisions.OSWER Directive 93S5.0-30. April 22, l99la.
________________ Risk Assessment Guidance for Superfund Volume 1: Human Health Evaluation Manual(Part 8, Development of Risk-Based Preliminary Remediation Goals). Publication 9285.7-01B.Office of Emergency and Remedial Response, Washington, DC. NTIS PR92-963333. 199lb.
________________ Risk Assessment Guidance for Superfund Volume I: human Health EvaluationManual, Supplemental Guidance: Standard Default Exposure Factors. Publication 928S.6-03. Officeof Emergency and Remedial Response, Washington, DC. NTIS PB91-921314. 199lc.
________________ Risk Assessment Guidance for Superfund Volume I: Human Health Evaluation Manual(Part C, Risk Evaluation for Remedial Alternatives). Publication 9285.7-01C. Office of Emergencyand Remedia1 Response, Washington, DG. 199lc.
________________ Health Effects Assessment Summary Tables. U.S. EPA Office of Research andDevelopment. Cincinnati, Ohio. 1997.
________________ Integrated Risk Information System. Chemical Files. U.S. EPA Integrated Risk1nformation System Database. Office of Research and Development. Cincinnati, Ohio. l998.
________________ Risk Assessment Guidance for Superfund (RAGS), Volume I: Human HealthEvaluation Manual (Part D). Publication 9285.7-01D-1. Office of Emergency and Remedial Response,Washington, DC. 1998a.
________________ EPA Region IX Preliminary Remediation Goal (PRG) Table, 1999.
________________ National Center for Environmental Assessment. Office of Research andDevelopment. Cincinnati, Ohio. 1996b.

Tables
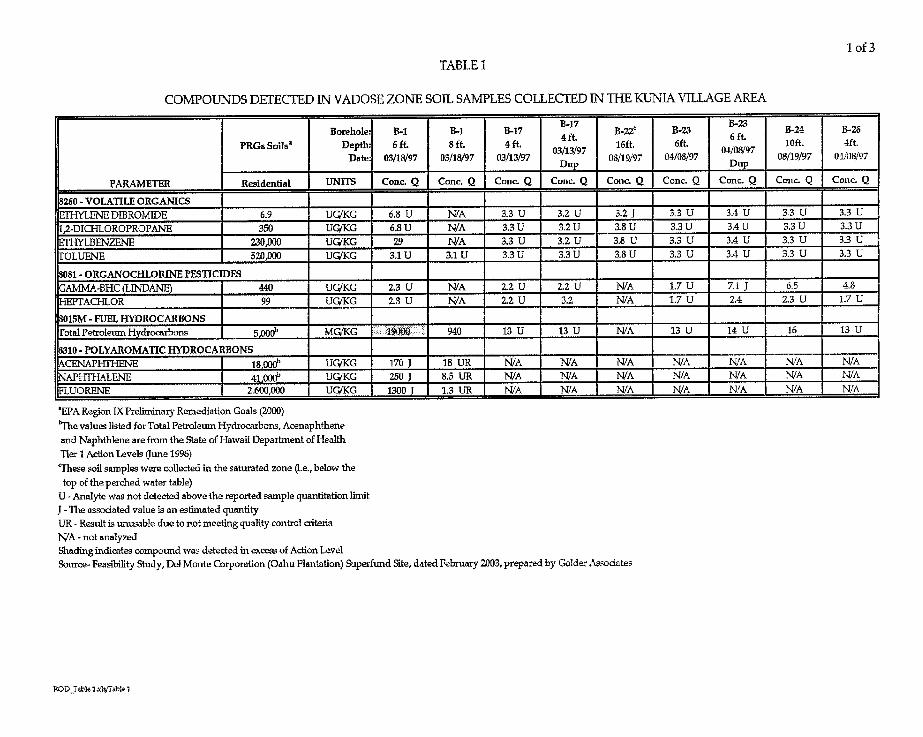
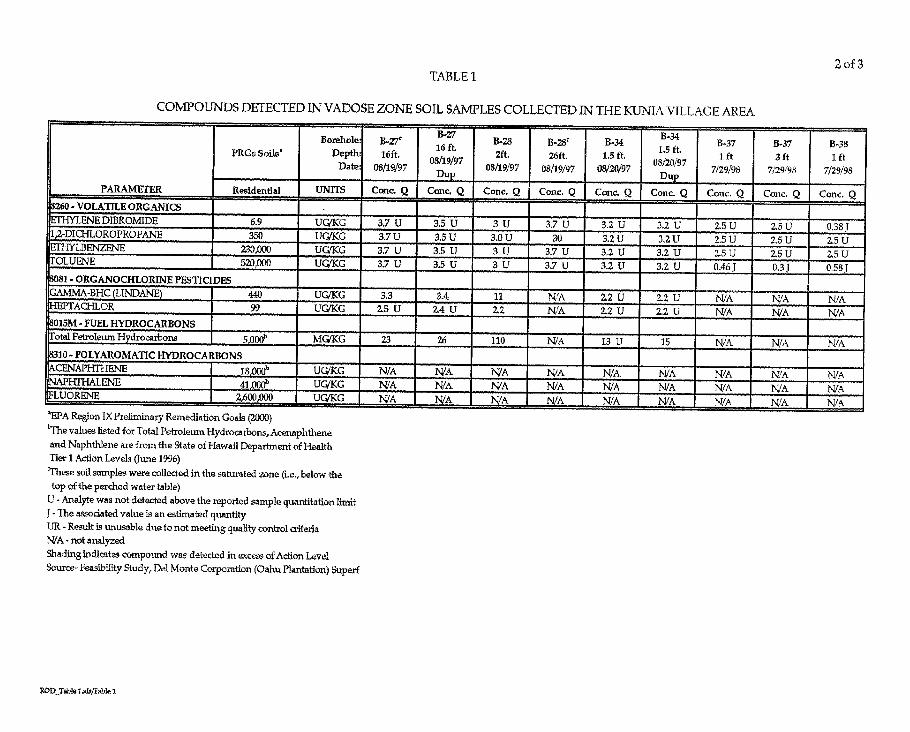
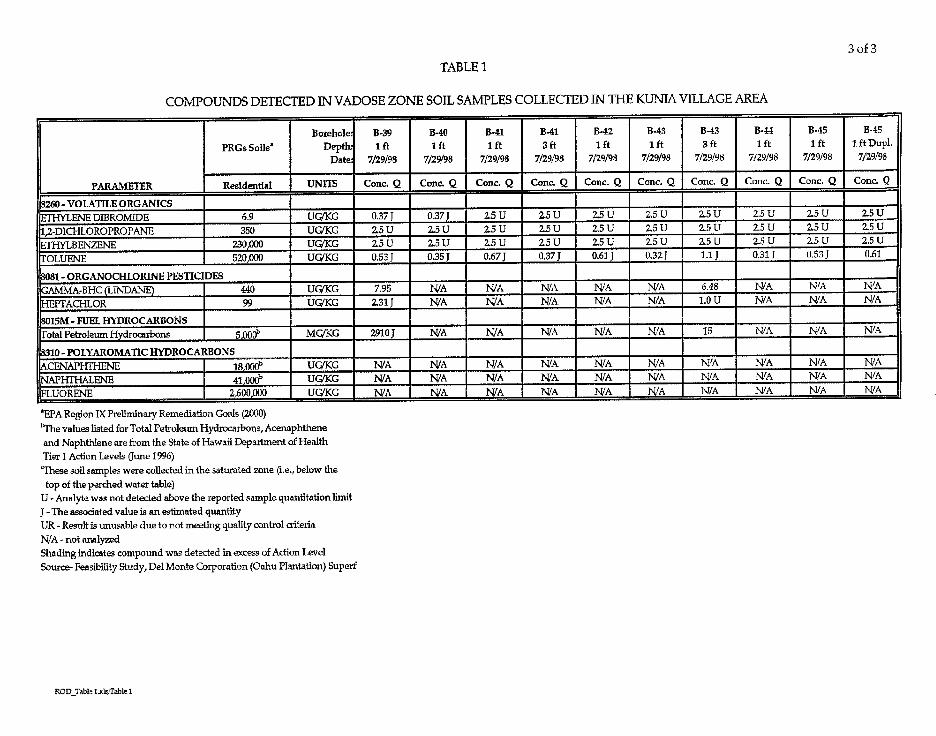
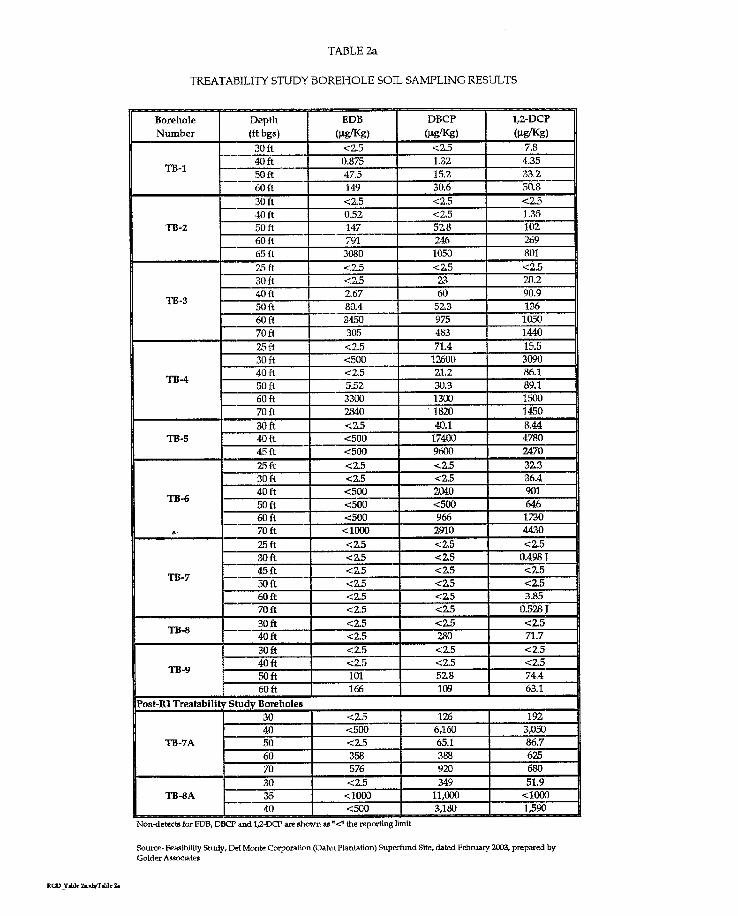
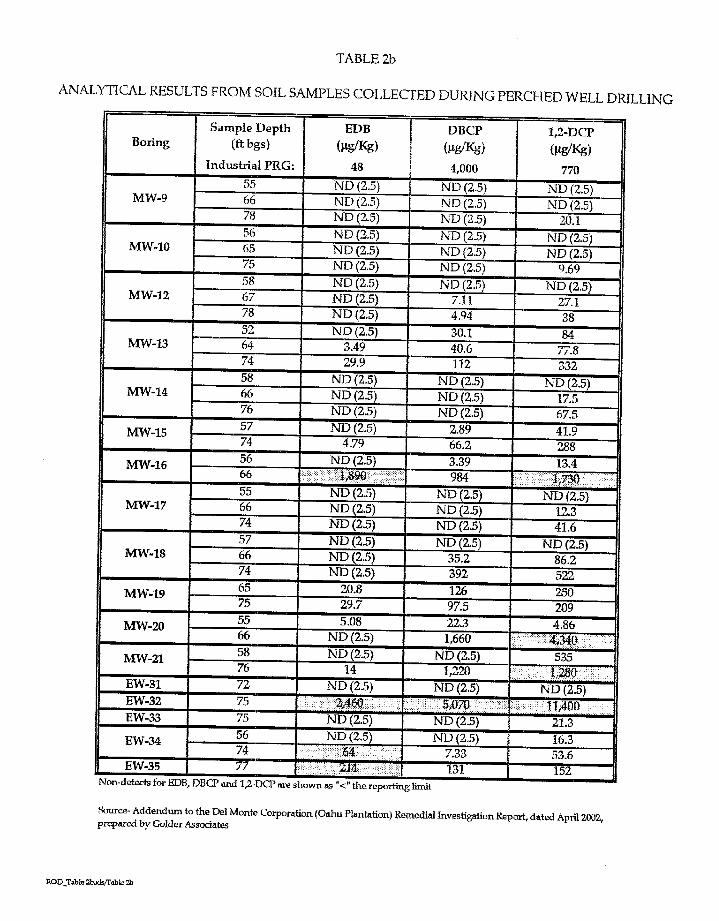
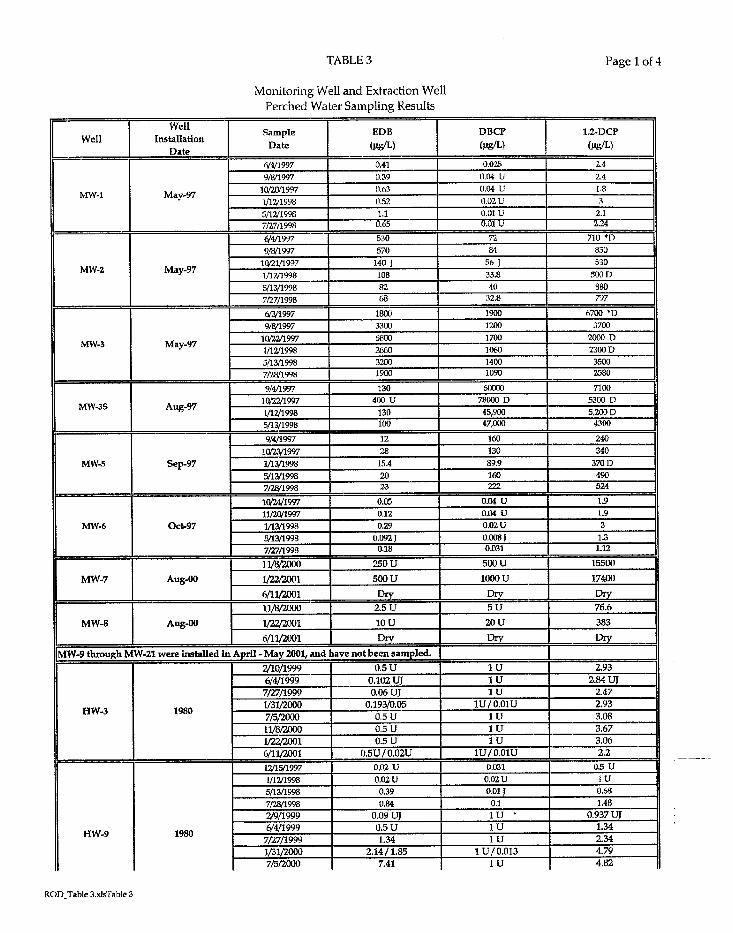
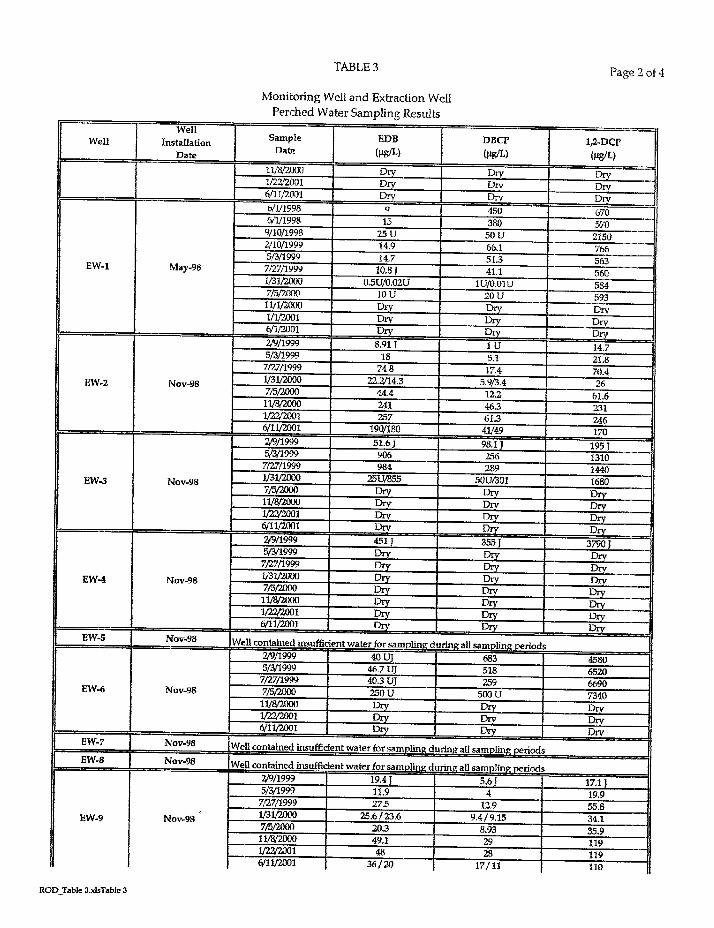
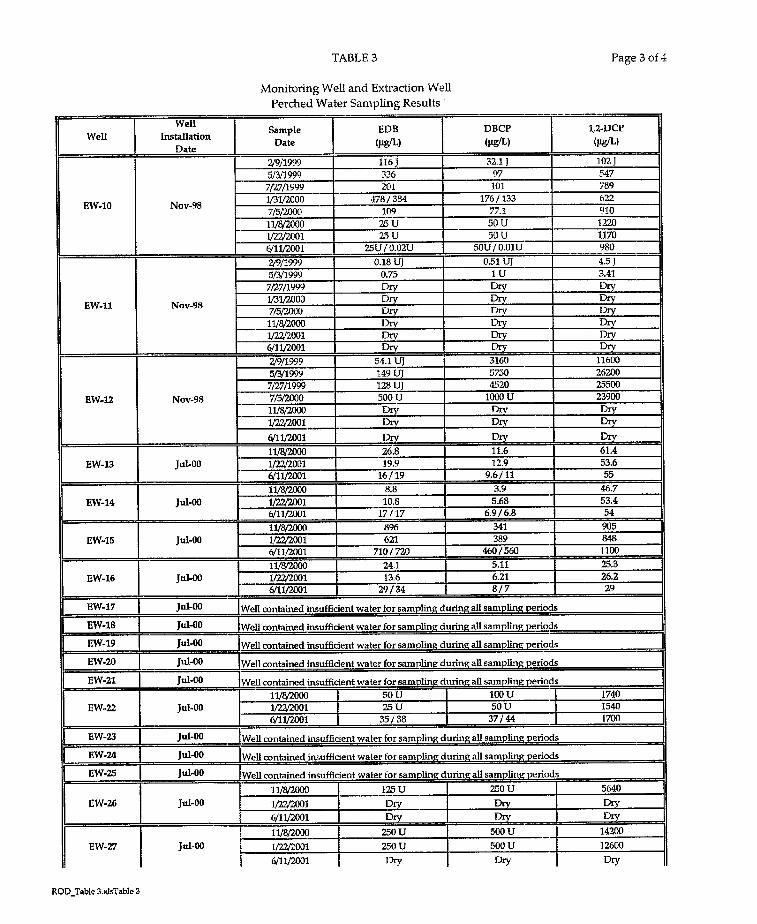
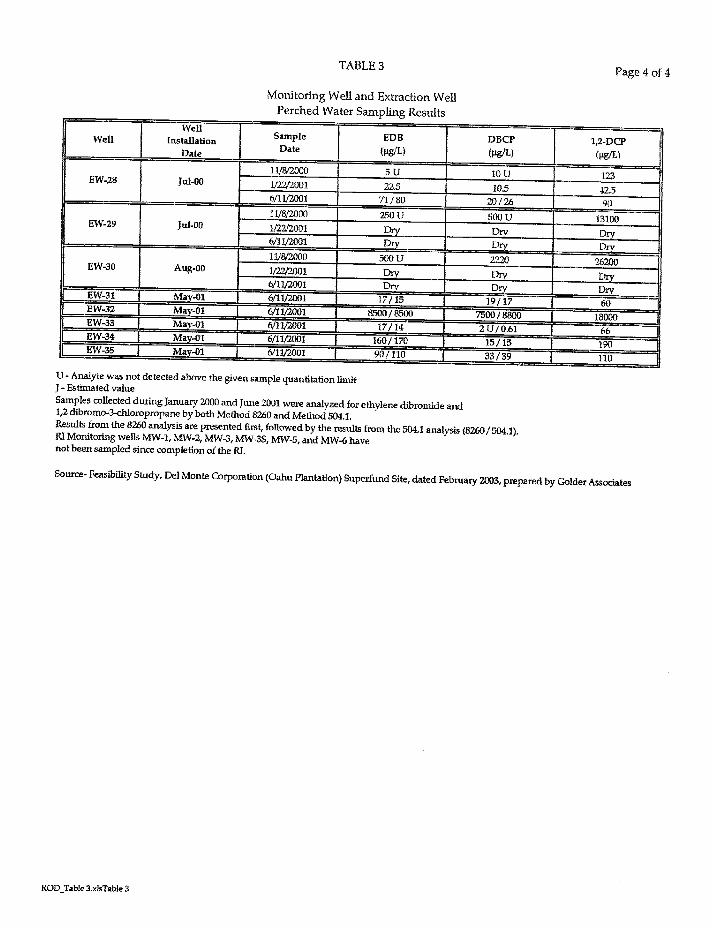
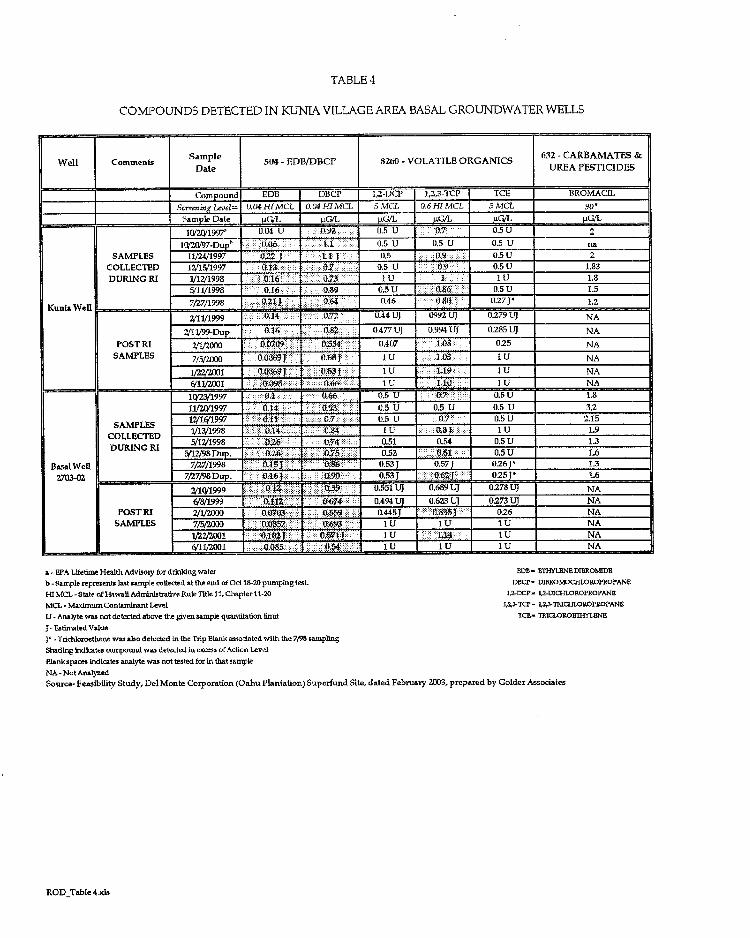
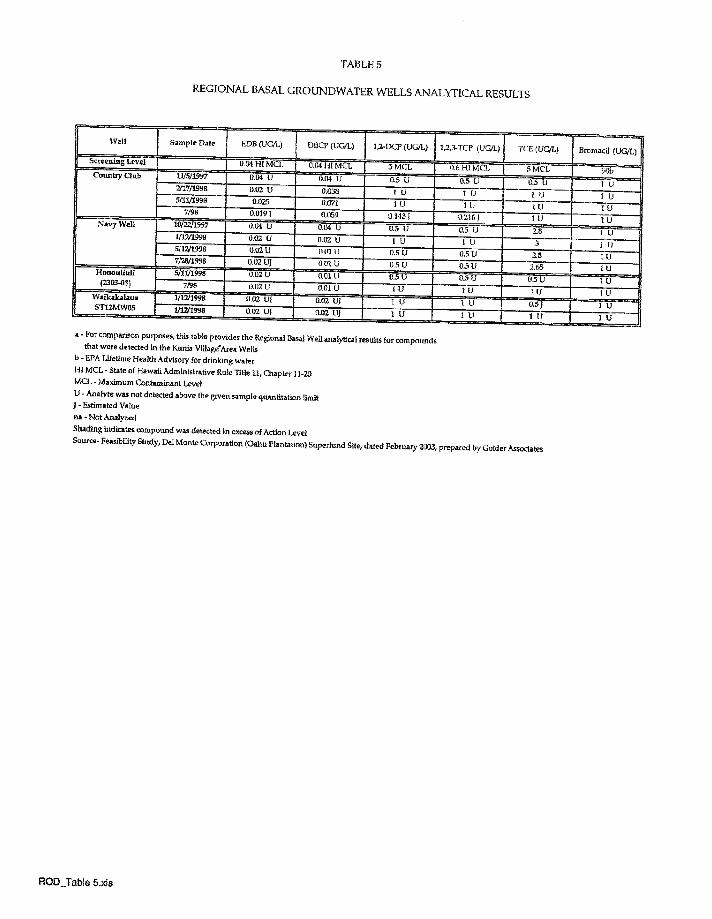
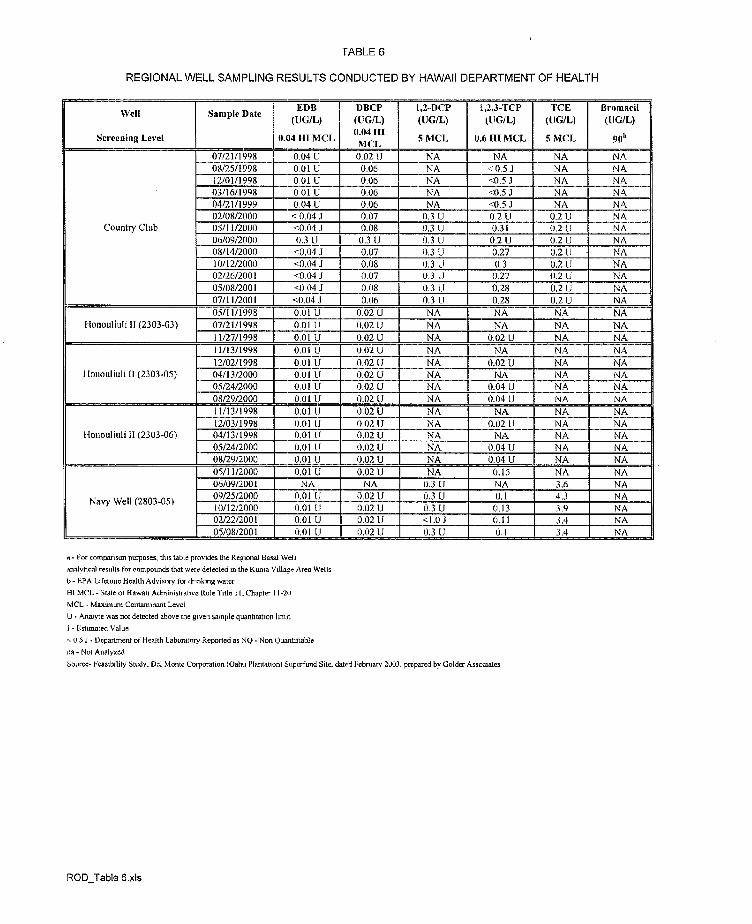
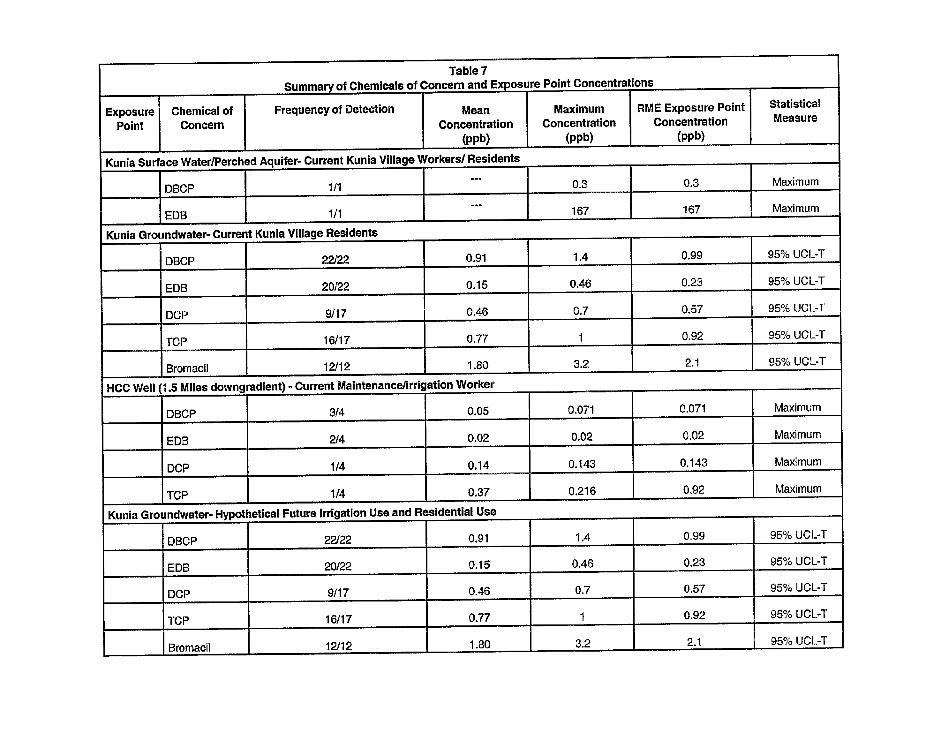
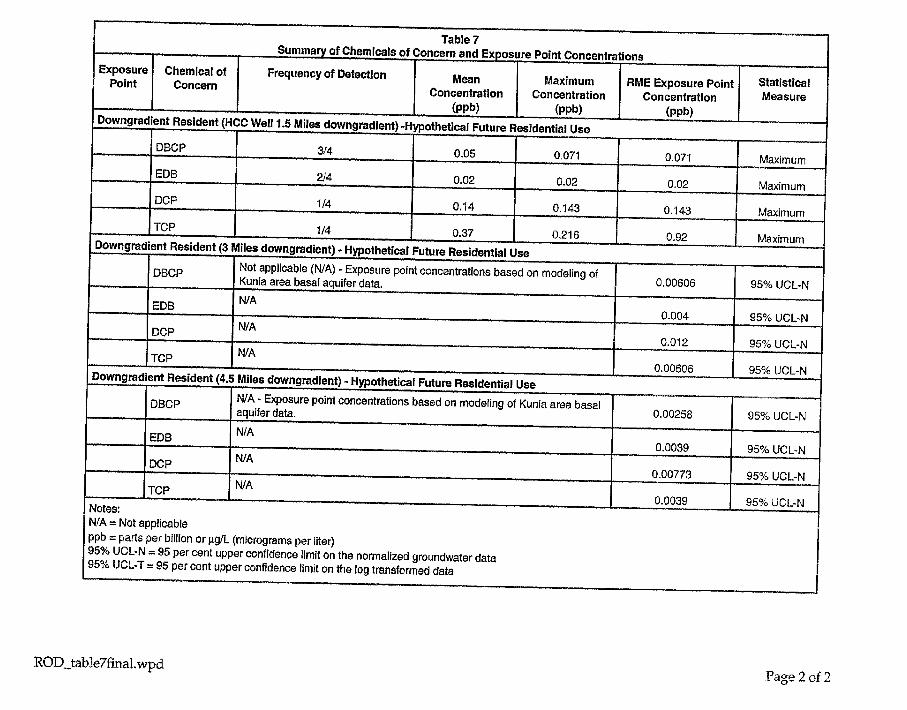
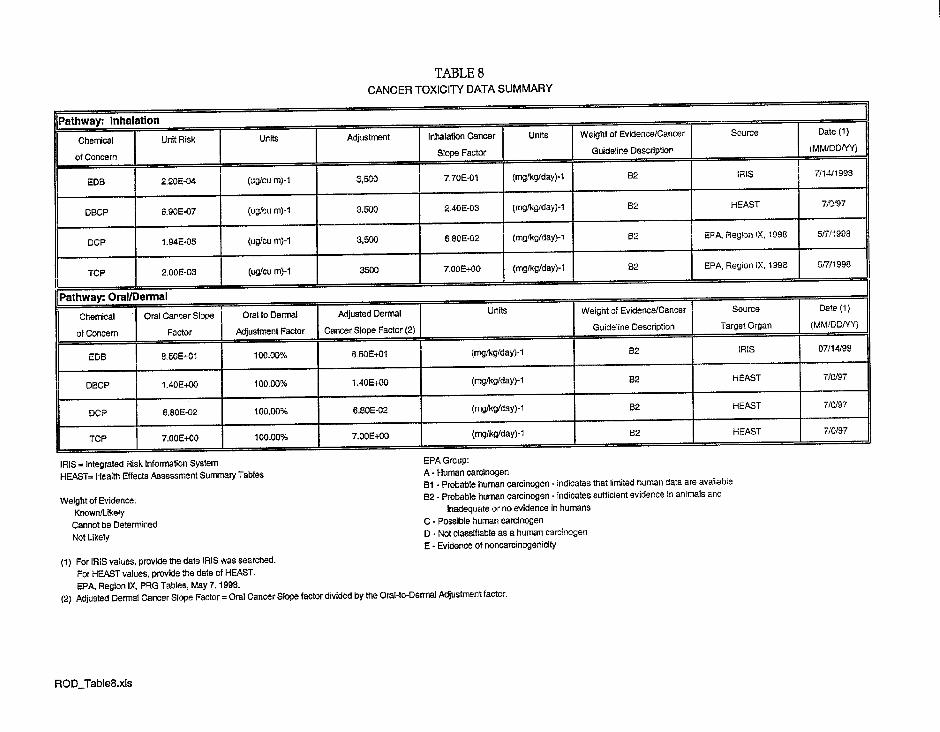
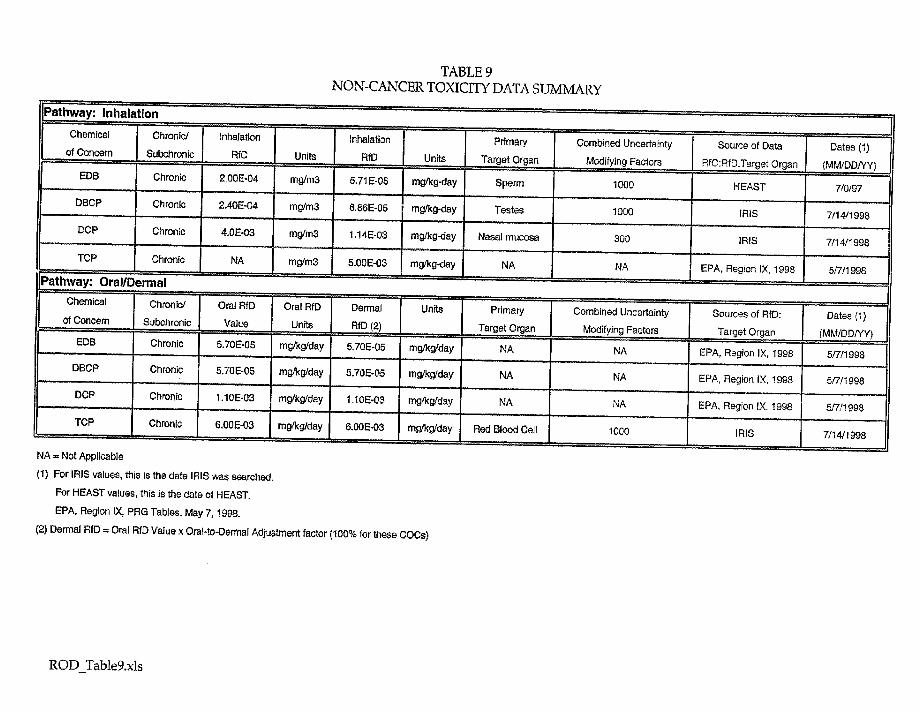
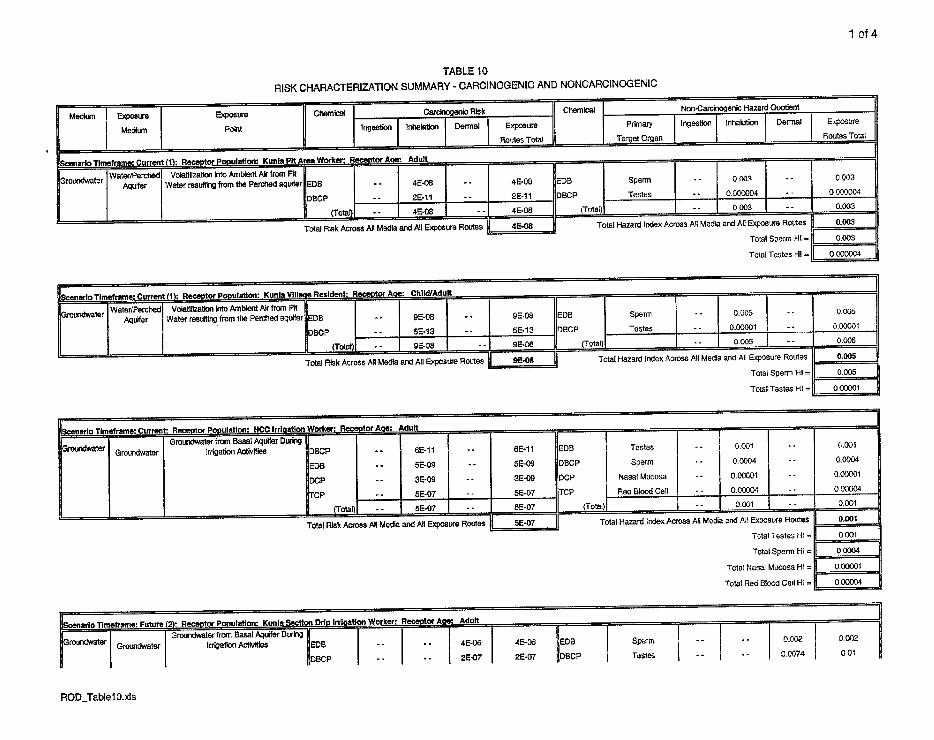
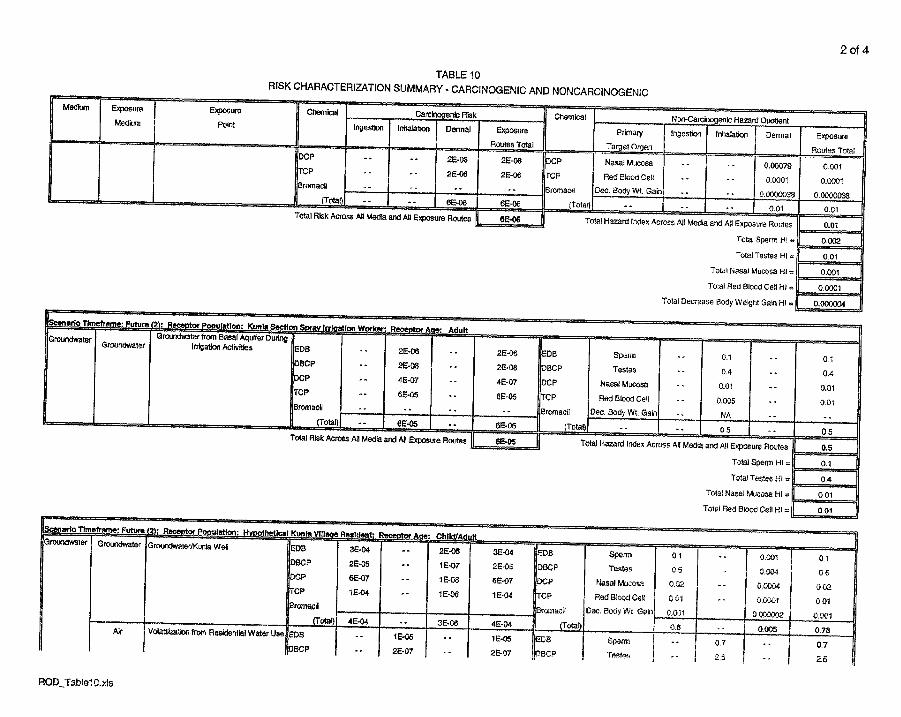
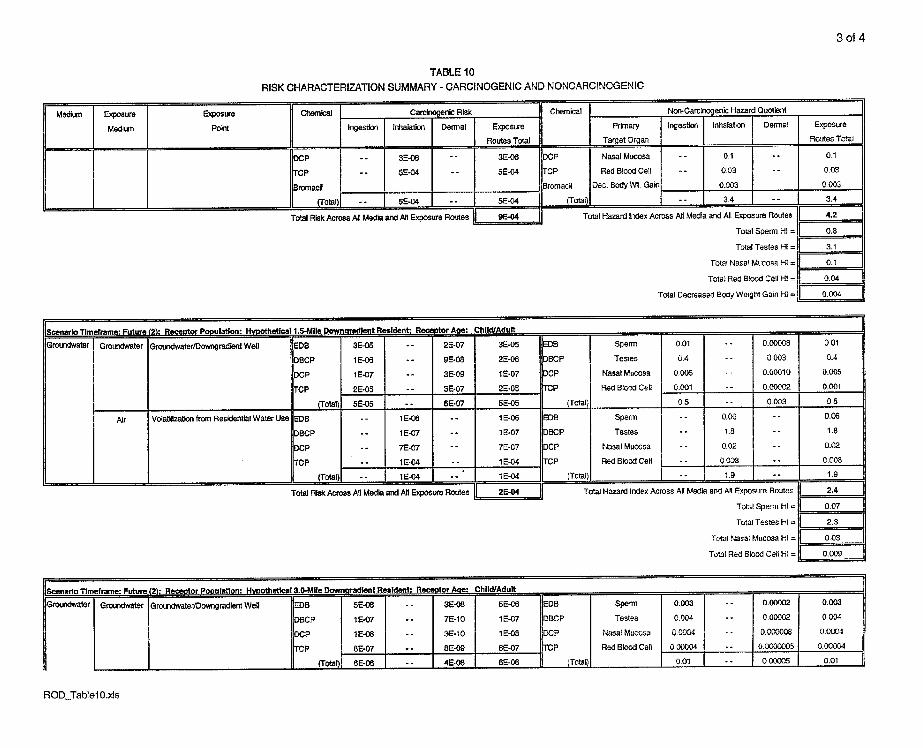
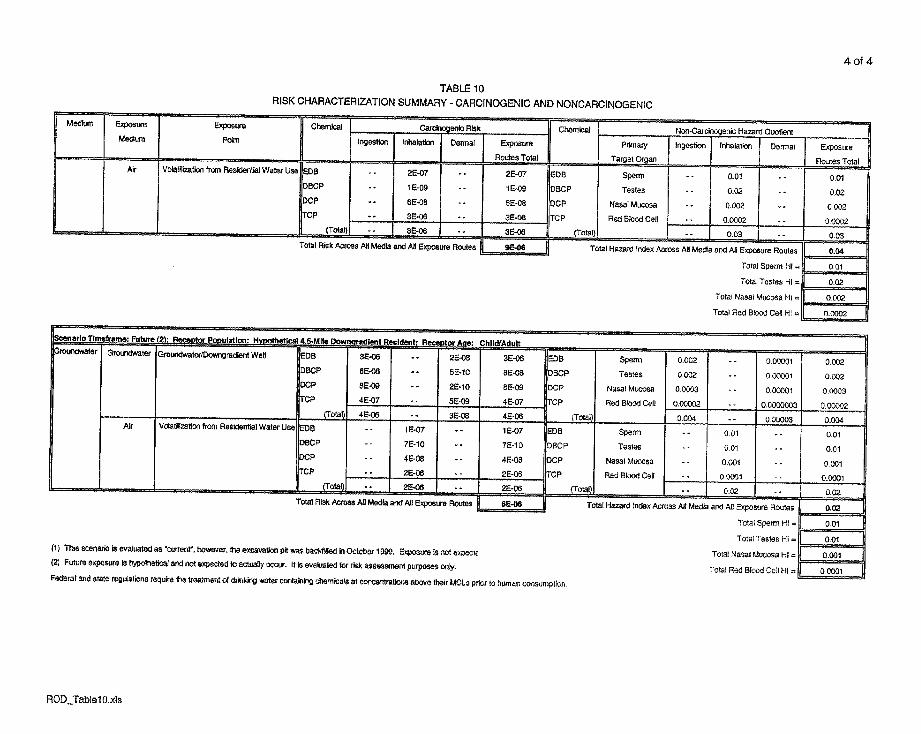
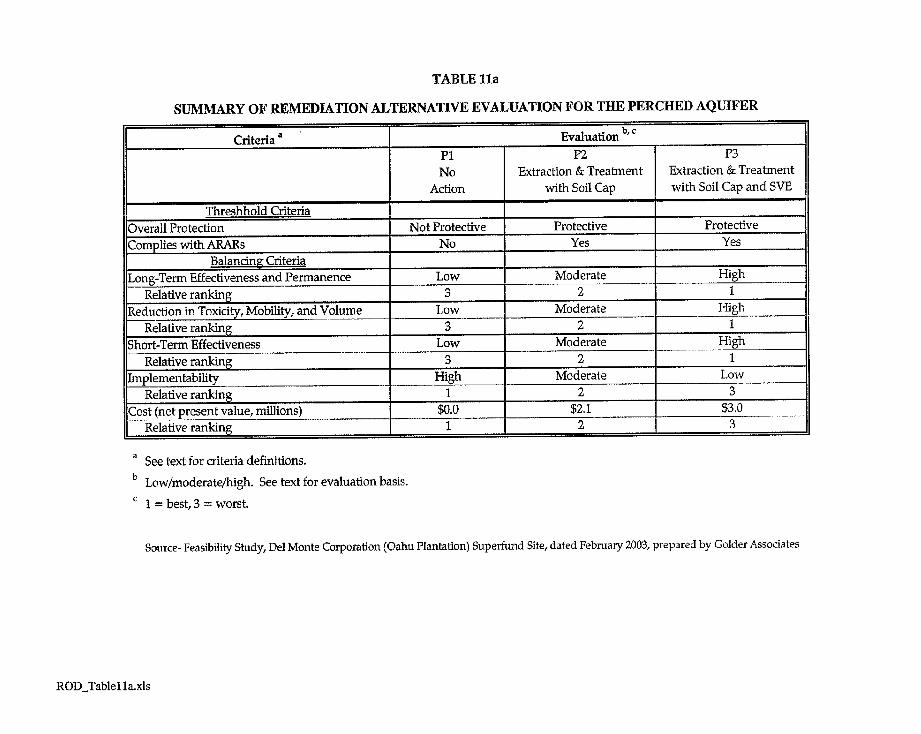
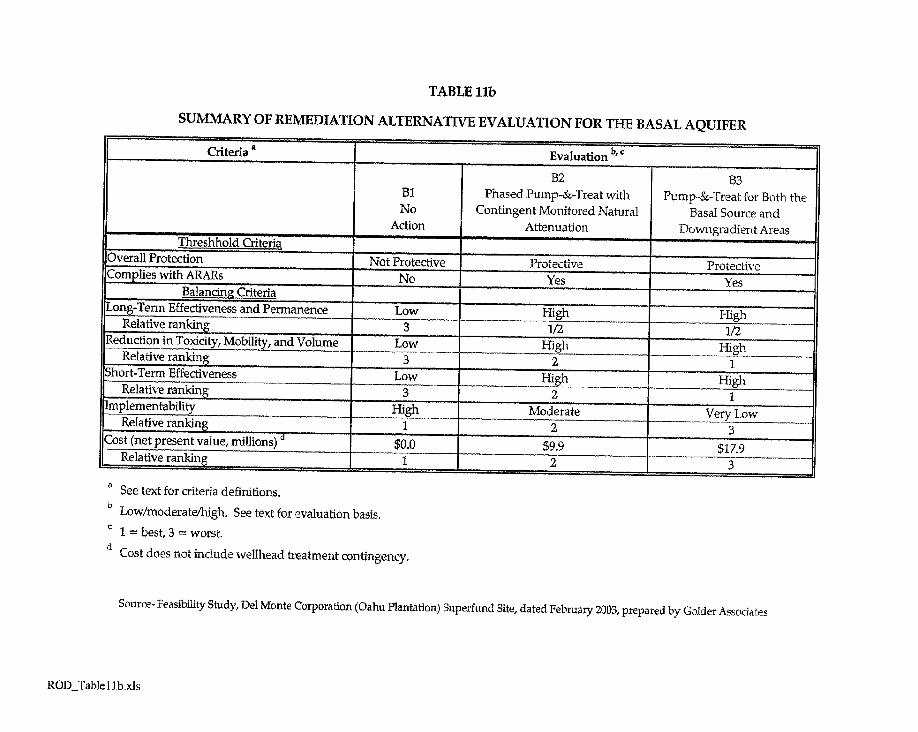
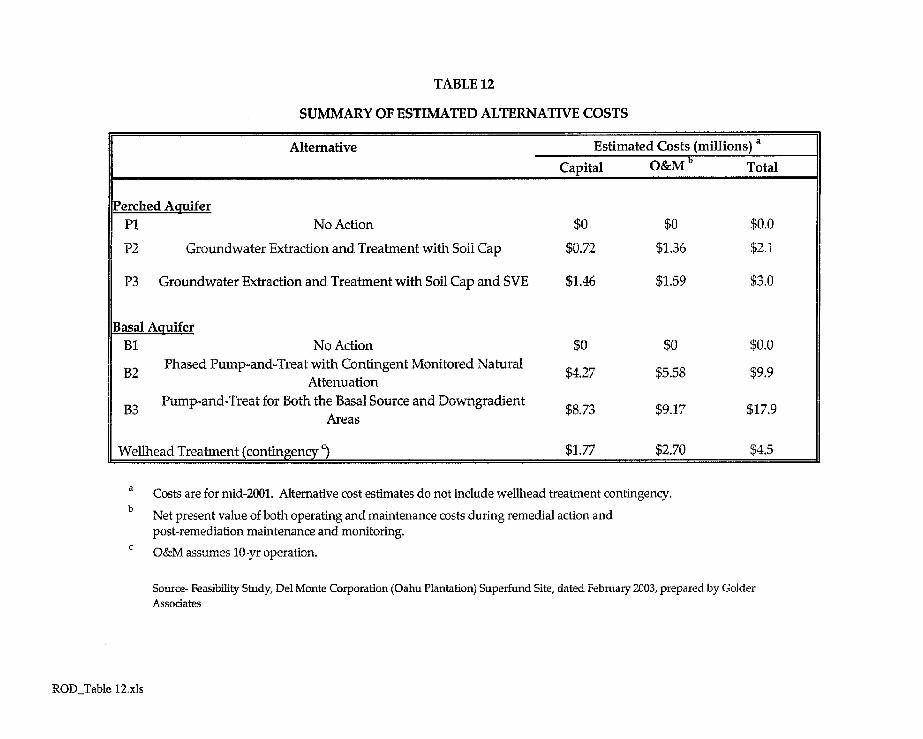
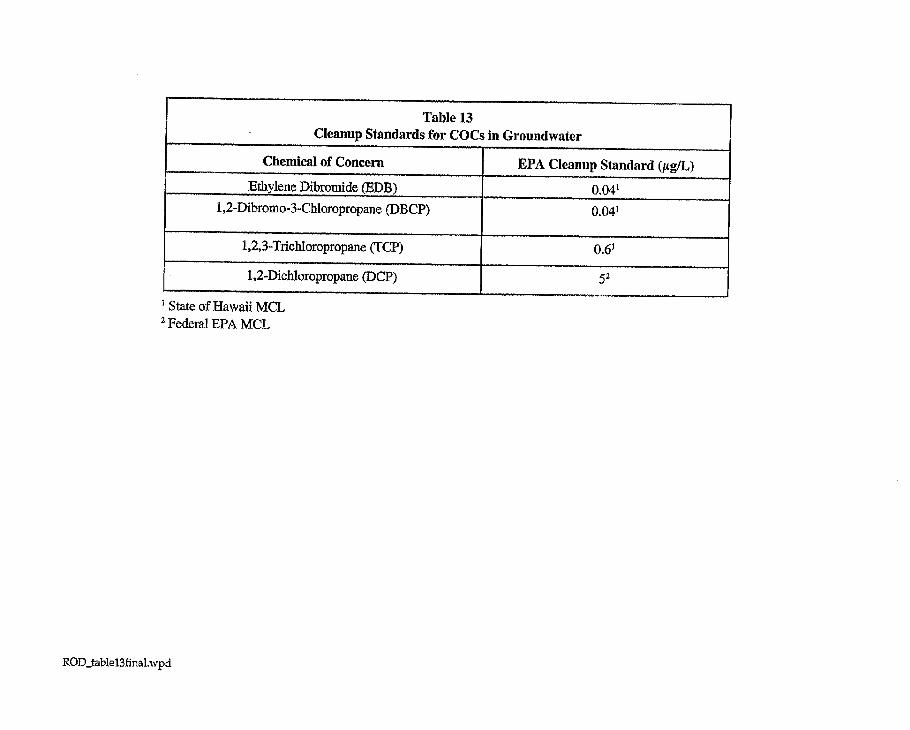
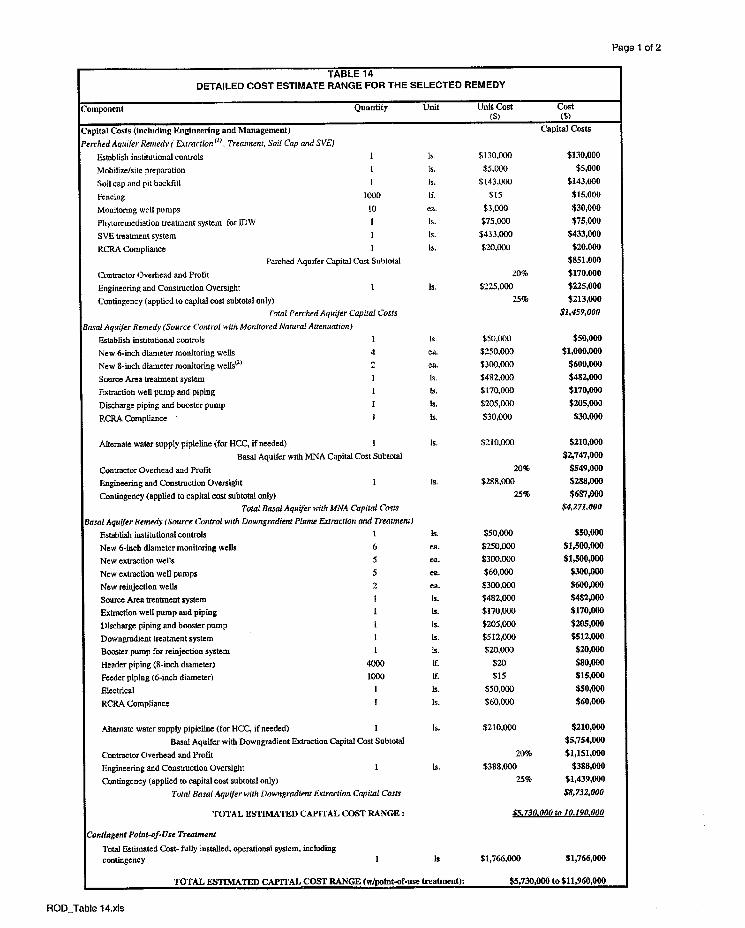
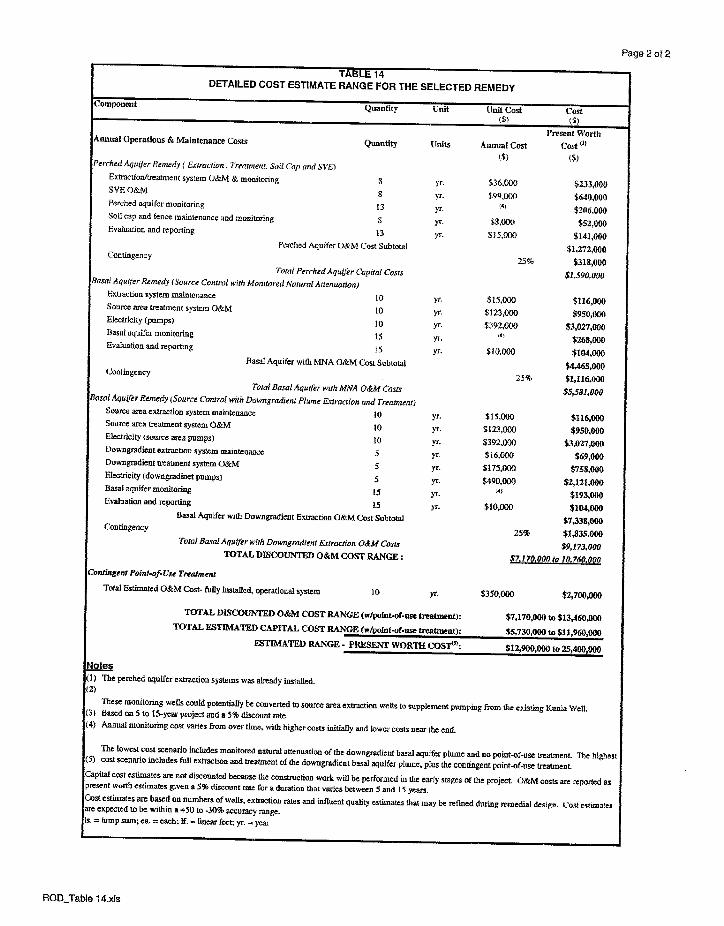

Figures